determination of evapotranspiration of some crops using ... issue 20-1/1961-1972 (262).pdf ·...
TRANSCRIPT
DETERMINATION OF EVAPOTRANSPIRATION OF SOME CROPSUSING SOME EMPIRICAL EQUATIONS
Omnia S. Mahmoud*, Rushdi M. M. EL-Kilani and M. E. ShawkyDepartment of Soil, Faculty of Agriculture, Cairo University, Giza, Egypt.
AbstractTwo crops were used sugar beet (Beta vulgaris L.) as winter crop and maize (Zea mays L.) as summer crop. Five empiricalequations were used representing the main groups in ETo calculations to determine the actual irrigation water requirements( IWR) both of maize and sugar beet and to choose the best empirical equations for predicting requirements for these crops.Also to, study the impact of different water regimes on the quantity of irrigation water, crop quantity and quality ,evaluate thewater use efficiency (WUE). The present investigation was optioned at the experimental Station of the faculty (WesternFarm), Faculty of Agricultural, Cairo University, Giza, during two seasons (2018-2019). The obtained results showed that themaximum IWR was obtained under SMD 10% for both crops and the IWR values were decreased with the increase in waterstress, so the minimum IWR value was obtained under SMD 50 %. On the meantime, satisfactory production of sugar beetsand maize can be obtained by providing 30% and 25% of IWR, respectively. Using the five empirical equations data indicatethat the closest equation to the actual evapotranspiration (Eta) in field is the equation Pan-evaporation for sugar beet, Turcand Hargreaves equations for maize.Key words : Actual irrigation water requirements, soil moisture depletion, empirical equations, sugar beet, maize, water use
efficiency.
IntroductionOn a global scale water resources are plentiful,
serious water shortages are developing especially in thearid and semi-arid regions. In this regions for exampleEgypt where the rainfall is infrequent and water resourcesare limited. Egypt is facing increasing water demands bythe speedily growing population, by increased urbanizationand by developed standards of living. Subsequently,increasing the productivity of obtainable water resourcesis essential to producing more food, fighting poverty,reducing rivalry for water.
Evapotranspiration (ET) is one of the chiefcomponents in water cycling in soil–plant– atmospherecontinuum. Its dependable information is of essentialimportance in water connected studies and applicationsfor example irrigation system designing, water resourceplanning and management , crop yield prediction (Pereraet al., 2015). Though, ET can be measured by amultiplicity of methods, they are difficult, time-consuming
and overpriced. So for most applications it is estimated,typically by the well known two-stage approach (Allenet al ., 1998) as a product of reference cropevapotranspiration (ETo) and crop coefficient. Therefore,accurate calculation of ETo becomes a critical step inobtaining ET.
Numerous ETo models, approximately 50 accordingto Lu et al. (2005) have been advanced and revised sofar. Based on supposition and climatological input theyare approximately classified as combination, radiation,temperature and pan evaporation. The multi of modelshas convenience for applications, but they have alsocaused misunderstanding as to which one to choose underdifferent climate and region due frequently to theirrestricted evaluation against measurement Understandingthe behavior of these models technique has been a keysubject of anxiety under numerous climates, e.g. (Jensenet al., 1990; Kashyap and Panda, 2001; Liu et al., 2006;Perera et al., 2015; Li et al., 2016; Zheng et al., 2017)and various others. Though, a huge number of modelshave been advanced, their rigorous evaluation with
Plant Archives Vol. 20 Supplement 1, 2020 pp. 1961-1972 e-ISSN:2581-6063 (online), ISSN:0972-5210
*Author for correspondence : E-mail: [email protected]
1962 Omnia S. Mahmoud et al.
measurements is still absent, leading to misperception anddisarray in model selection (Liu et al., 2017).
The selection of ETo method is become more criticalwhen modeling irrigation requirements at a short temporalscale (daily or monthly) as necessary for manyapplications, such as daily irrigation scheduling, than at along chronological scale (Satti et al., 2004). Therefore,to guarantee the accuracy of results, we should eitherpick the sensible ones or performance domesticadjustments for the studied regions (Zheng et al., 2017).
In Egypt, some attempts were done to apply theempirical equations for estimating crop evapotranspiration(ETC) values and water requirements of crops underdifferent climatological zones in Egypt. Amer et al. (1990)in Menofyia reported that pan evaporation was easierand best method. El-Gindy et al. (1991) found at Mariutearea that the Radiation and Blaney-Cridule methods werethe best empirical equations used for estimating ETO.Asker et al. (1992) reported that modified Penman,modified Blaney-Criddle, Radiation, Class A pan andEgleman methods were suitable for estimating potentialevapotranspiration at Kfr-EL-Sheikh Governorate.Borham et al. (2005) reported that P.M and PE equationswere the best empirical equations for predicting waterrequirements for maize, cowpea and intercroppedcowpea/maize under similar conditions Giza.
With regards to upgrading water productivity, thereis a great interest in what is known regulated deficitirrigation, an irrigation practice where by water supply isdecreased below maximum levels and mild stress isallowed with insignificant impacts on yield, thismethodology can prompt more prominent additions thanexpanding yields per unit of water (FAO, 2002).
In Egypt, sugar production depends mainly on bothsugar cane and beet crops. Sugar beet contributes withabout 57.61% of total sugar production. Meanwhile,Sugar cane represent 42.39% (Sugar Crop CouncilReport, 2017). Sugar beet (Beta vulgaris L.) is a fieldcrop, which has tolerant to drought (Vamerali et al., 2009),however drought stress have an undesirable consequenceon morpho-physiological characteristics of growthparameters ex. root, leaves and plant dry weight, leafchlorophyll and stomatal conductance; also, root yield ofsugar beet genotypes (Moosavi et al., 2017).
Maize (Zea mays L.) is a vital grain in worldwide,and more sensitive to drought stress than most of foodcrops (Tsonev et al., 2009). Maize is normally utilizedfor animals feed, ethanol production also, food production.Shortage water creates water stress that can influencethe development and productivity of corn plants.
Therefore, adequate water supply for maize growth anddevelopment is necessary.
The objective of this research is to determine theactual IWR of maize and sugar beet , and choose thebest empirical equations for predicting IWR for thesecrops. Study the effect of different water regimes on theIWR, crop quality and quantity, evaluate the water useefficiency (WUE), under various conditions of watersupply.
Materials and Methods Location and experiment
The present investigation was conducted at theAgricultural Experimental Station (Western Farm),Faculty of Agricultural, Cairo University, Giza, 30° 02 Nlatitude, 31° 3 E longitude). during two seasons (2018-2019) soil of the experimental station is characterized asclay loam non-alkaline non saline soil (tables 1 and 2).Two crops were used sugar beet (Beta vulgaris L.) aswinter crop and maize (Zea mays L.) as summer crop.The planting date was 15, Oct. 2018 and the harvestdate was 12, May 2019 for sugar beet crop . For maizeThe planting date was 2, Jul. 2019 and the harvest datewas 20, Oct. 2019. Experimental design
For sugar beet the field of study area was dividedinto 12 equal blocks. The blocks were separated fromeach other by belt (1m width). The experimental unitarea was 16 m2 (4 × 4). Each block has five rows 0.6 mwidth 4m length and 17.5 cm between plants to get 40.000plants/fed. Meanwhile, the maize crop the experimentalunit area was 18 m2 (4 × 4.5), each block has six rows0.7 m width 4m length and 25 cm between plants to get20.000 plants/fed. For sugar beet and maize crops arandomized complete blocks design with three replicateswas implemented in the experimental area. Treatments
For sugar beet crop four levels of soil moisturedepletion (SMD) were investigated, SMD 0.10, SMD0.30, SMD 0.40 and SMD 0.50 treatments i.e. Irrigationwhen soil moisture content was depleted to 10%, 30%,40% and 50% of available water (AW), respectively. Asfor maize season three levels of soil moisture depletionwater depletion (SMD) were investigated, SMD0.10,SMD0.25 and SMD 0.50 treatments i.e. Irrigation whensoil moisture content was depleted to 10%, 25% and 50%of available water (AW), respectively. Irrigation water application
Water was added to each block using gated pipe.
Determination of Evapotranspiration of some Crops using some Empirical Equations 1963
The quantities of water added were estimated using ameasuring meter. Soil moisture content was monitoreddaily using gravimetric method in soil depths (0-20, 20-40, 40-60 cm). Actual crop evapotranspiration (ETa)
The values of actual evapotranspiration wascalculated according to Israelsen and Hansen (1962) usingthe following equation :
Eta ={(FC –v)/100} × dWhere,- ETa : actual evapotranspiration mm / interval.- FC : volumetric soil moisture content (%) at field
capacity.- θV : volumetric soil moisture content (%) at
irrigation time, which depending on the irrigationtreatments.
- d : depth of soil layer (0.2m in initial stages, 0.6mfixed to end stages for the two crops).
Irrigation water requirementsThe depth of irrigation water requirements (I) was
calculated according to Ayers and Wastcot (1985) I =Eta/ Ei (1-LR) mmwhere,
- I = total depth of irrigation waterrequirements [mm]
- ETa = actual evapotranspiration(consumptive use) [mm]
- LR = leaching Requirements [R= 4%, 18%for sugar beet and maize calculatedaccording to Ayers and Wastcot (1985), asEC water = 1.29 ds m-1 (table 3)].
- Ei = irrigation system efficiency [65%]. Reference evapotranspiration (ETO)I. The combination methods
Values of ETo were calculated according to Penman-Monteith equation (Allen et al., 1998).
2
2
3401273
9004080
u.
eeUT
GR.ET
asn
o
Where,- ETo reference evapotranspiration [mm day-1]- Rn net radiation at the crop surface [MJ m-2 day-1]- G soil heat flux density [MJ m-2 day-1]
- T mean daily air temperature at 2 m height [°C]- u2 wind speed at 2 m height [m s-1]- es saturation vapour pressure (KPa]- ea actual vapour pressure [KPa]- es-ea saturation vapour pressure deficit [KPa]- slope vapour pressure curve (KPa °C-1]- Y psychrometric constant [KPa °C-1]
II. Temperature methodsValues of ETo were calculated according to Blaney
and Criddle equation (Doorenbos and Pruitt, 1984). ETo = a + b fo f = p (0.46 T + 8)o a = 0.0043 RHmin -n/N -1.41o b = 0.82 + (- 0.0041* RHmin) + 1.07*n/N
+ 0.066*Ud + (-0.006* RHmin *n/N) +(-0.0006* RHmin *Ud)
Where,- ETo = reference evapotranspiration in mm for
the period considered.- T = mean daily temperature in c° over the period
considered.- a, b = adjustment factors which depends on
minimum relative humidity, sunshine hours anddaytime wind estimates.
- RHmin = is the relative humidity in percent.- n/N = is the ratio of actual to maximum possible
sunshine hours.- Ud = is the daytime wind speed in m/sec at 2-m
height.III Evaporation method
Values of ETo were calculated according to PanEvaporation equation (Doorenbos and Pruitt, 1984) ETo = Kp.Epan
Where,- ETo = reference evapotranspiration (mm/day).- Epan = pan evaporation in mm/day and
represents the mean daily value of the periodconsidered.
- Kp = pan coefficient (which depending on panlocation and climatic condition (mean relativehumidity and wind speed).
IV. Radiation method According to Jensen et al. (1990), the Truc
formula for estimating ETo was used as follows

1964 Omnia S. Mahmoud et al.
For RH > 50% ETo = 0.013 (T / ( T+15 ))(Rs +50)For RH < 50% ETO=0.013 {T/(T+15)(RS+50)(1+((50-RH)/70)}Where,- ETo = reference evapotranspiration (mm day-1)- RH = relative humidity [%]- T = the average temperature in [°C]- Rs = solar radiation in [cal cm-2 d-1]. values of ETo were calculated according to
Hargreaves equation (Allen et al., 1998). ETo = 0.0023 Ra (Tmean + 17.8) (T max -Tmin)
0.5
where,- ETo = reference evapotranspiration (mm day-1)- Ra = extraterrestrial radiation in the equivalent
evaporation units, calculated or taken from tablepresented by Allen et al. (1998), [mm d-1]
- 1 mm day -1 = 2.45 MJ m -2 day-1
- Tmax -Tmin = the difference between maximumand minimum temperatures, [°C]
- Tmean = mean air temperature, [°C] Crop coefficient (Kc):Crop coefficient was calculated for each treatment
according to Allen et al. (1998). Kc = ETc /EToWhere,- ETc = Crop evapotranspiration under standard
condition mm/day.- ETo = Reference evapotranspiration mm/day. Soil sampling and methods of analysisBefore planting undisturbed and disturbed soil
samples were collected from three successive soil depths(0-20, 20-40 and 40-60 cm) to determine some physicaland chemical characteristics of the investigated soil site,according to the methods described by Page et al. (1982)for chemical soil properties and Klute (1986) for physicalsoil properties
Chemical analysis of irrigation waterElectric conductivity (EC), pH and soluble cations
and anions were determined according to Page et al.(1982).
Water use efficiency (WUE)Water use efficiency of crop was calculated
according to Giriappa (1983)
CWUE = Yield (kg/fed)/Eta (m3/fed) IWUE = Yield (kg/fed)/IWRa (m3/fed)Where,- ETa = actual evapotranspiration- IWRa = actual irrigation water requirement- CWUE = crop water use efficiency- IWUE = irrigation water use efficiency Crops measurements- For sugar beet crop Root yield (kg/fed). Recoverable sugar yield (kg/fed).- Sugar yield = Root yield (kg/fed) * Sugar
recovery%- (Sugar recovery % = {pol% - 0.029-(0.343
(Na+K)-0.094(amino-N)}- Where pol% = sucrose% according to Renfield
et al. (1974).- For maize crop Grain yield (kg/fed).
Statistical analysisThe results obtained from field were statistically
analyzed using F-value test and the mean were comperedby L.S.D at the level of probability of 5%. WASP - WEBAGRI STAT PACKAGE 2.0 was used to carry outstatistical analysis. WASP is the first Web BasedAgricultural Statistics Software Package offered byICAR Research Complex. The performance of allequations were compared to the filed data which wereestimated on each growth stages for both crop using thestandard error (SE).
Results and DiscussionThe response of sugar beet and maize crops todifferent irrigation regimesSugar beet crop
Data offered in table reveal that the SMD 10% gavelow root yield ,In spite of high quantities of irrigation watercompared with the SMD 30% AND SMD 40% this maybe due to Irrigation by definition creates a more humidenvironment. Inevitably this favours the survival andspread of some disease and pest organisms whilediscouraging others (Camprag, 1976; Christmann, 1976).Besides aggravating certain disease and pest problems,very wet soils have other reverse effects on sugar beetassociated with anaerobic conditions in the rootenvironment (Dunham, 1993). Also perhaps the
convergence of irrigation periods too much does not makethe roots deep in the soil significantly and this makesthem do not take the appropriate size, subsequentlydecrease the productivity of yield. However, the effectof increasing irrigation in SMD 10% that was less thanthe effect of water stress in SMD 50% treatment, whichhave the lowest root yield. Increasing water stress from30% to 50% decreased root yield.
The reduction in root yield with increased water stressfrom 30% to 50% may be owing to the depressive effectof drought stress on beet growth, in terms of, fresh anddry weight of root as a result of the reduction in Leafarea index and leaf chlorophyll content, which wasreflected in lower relative growth rate (RGR) and netassimilation rate (NAR). These results was in agreementwith Abd El-Wahab and Nameat Alla (2002).
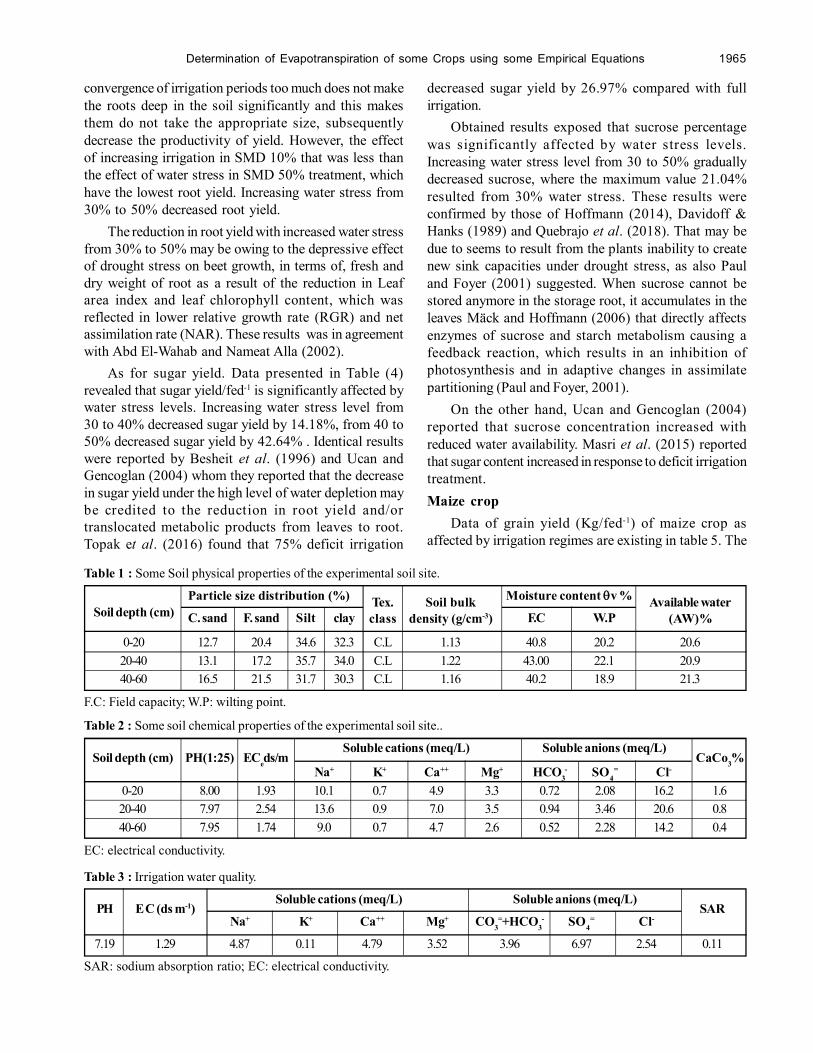
As for sugar yield. Data presented in Table (4)revealed that sugar yield/fed-1 is significantly affected bywater stress levels. Increasing water stress level from30 to 40% decreased sugar yield by 14.18%, from 40 to50% decreased sugar yield by 42.64% . Identical resultswere reported by Besheit et al. (1996) and Ucan andGencoglan (2004) whom they reported that the decreasein sugar yield under the high level of water depletion maybe credited to the reduction in root yield and/ortranslocated metabolic products from leaves to root.Topak et al. (2016) found that 75% deficit irrigation
decreased sugar yield by 26.97% compared with fullirrigation.
Obtained results exposed that sucrose percentagewas significantly affected by water stress levels.Increasing water stress level from 30 to 50% graduallydecreased sucrose, where the maximum value 21.04%resulted from 30% water stress. These results wereconfirmed by those of Hoffmann (2014), Davidoff &Hanks (1989) and Quebrajo et al. (2018). That may bedue to seems to result from the plants inability to createnew sink capacities under drought stress, as also Pauland Foyer (2001) suggested. When sucrose cannot bestored anymore in the storage root, it accumulates in theleaves Mäck and Hoffmann (2006) that directly affectsenzymes of sucrose and starch metabolism causing afeedback reaction, which results in an inhibition ofphotosynthesis and in adaptive changes in assimilatepartitioning (Paul and Foyer, 2001).
On the other hand, Ucan and Gencoglan (2004)reported that sucrose concentration increased withreduced water availability. Masri et al. (2015) reportedthat sugar content increased in response to deficit irrigationtreatment.Maize crop
Data of grain yield (Kg/fed-1) of maize crop asaffected by irrigation regimes are existing in table 5. The
Table 1 : Some Soil physical properties of the experimental soil site.
Particle size distribution (%) Moisture content v %
C. sand F. sand Silt clay F.C W.P
0-20 12.7 20.4 34.6 32.3 C.L 1.13 40.8 20.2 20.620-40 13.1 17.2 35.7 34.0 C.L 1.22 43.00 22.1 20.940-60 16.5 21.5 31.7 30.3 C.L 1.16 40.2 18.9 21.3
F.C: Field capacity; W.P: wilting point.
Tex. Soil bulk Available waterSoil depth (cm) class density (g/cm-3) (AW)%
Table 2 : Some soil chemical properties of the experimental soil site..
Soluble cations (meq/L) Soluble anions (meq/L)Soil depth (cm) PH(1:25) ECeds/m CaCo3%
Na+ K+ Ca++ Mg+ HCO3- SO4
= Cl-
0-20 8.00 1.93 10.1 0.7 4.9 3.3 0.72 2.08 16.2 1.620-40 7.97 2.54 13.6 0.9 7.0 3.5 0.94 3.46 20.6 0.840-60 7.95 1.74 9.0 0.7 4.7 2.6 0.52 2.28 14.2 0.4
EC: electrical conductivity.
Table 3 : Irrigation water quality.
Soluble cations (meq/L) Soluble anions (meq/L)PH E C (ds m-1) SAR
Na+ K+ Ca++ Mg+ CO3=+HCO3
- SO4= Cl-
7.19 1.29 4.87 0.11 4.79 3.52 3.96 6.97 2.54 0.11
SAR: sodium absorption ratio; EC: electrical conductivity.
Determination of Evapotranspiration of some Crops using some Empirical Equations 1965

obtained results show that the yield of maize cropdecreases with increasing the soil moisture depletion(SMD). This decrease may be rendered to water stresswhich hinder the carbohydrate accumulation, andconsequently, visible reduction in plant growth and grainyield (Azab, 1998).Actual Evapotranspiration (ETa)
Data presented in tables 4 and 5 shows the actualevapotranspiration (ETa) values under differenttreatments for sugar beet and maize. Data indicate thatthe maximum ETa value was obtained under SMD 10%at both crops and the ETa values were decreased withthe increase in water stress, so the minimum ETa valuewas obtained under SMD 50% that may be due to thatthe seasonal actual evapotranspiration ETa are mostlyinfluenced by moisture regime. The increase inconsumptive use under the lowest treatment of availablesoil moisture depletion (10% SMD) possibly assign tothe increase in direct evaporation resulting from thefrequent wetting of the surface soil layer and the existenceof relatively high quantities of available water whereas,the plants tend to consume more water under low tensionsthan under high moisture tensions. Also the irrigation waterrequirements (IWR) took the same trend.Reference evapotranspiration (ETo)
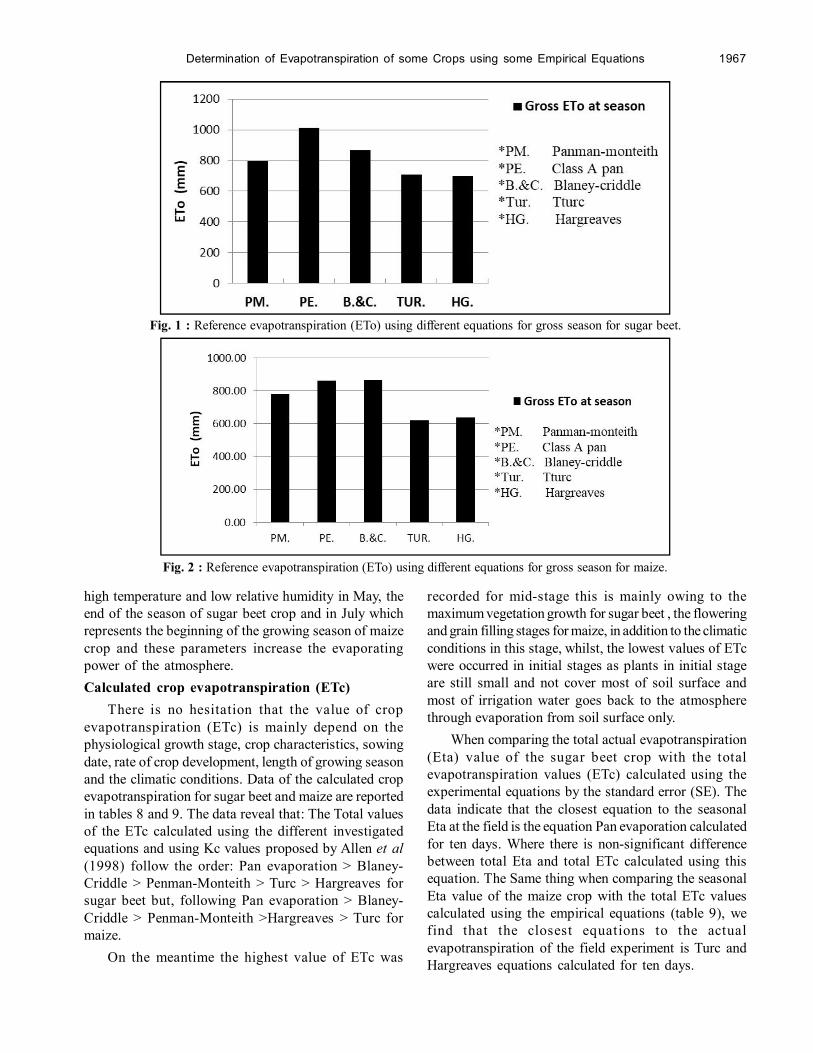
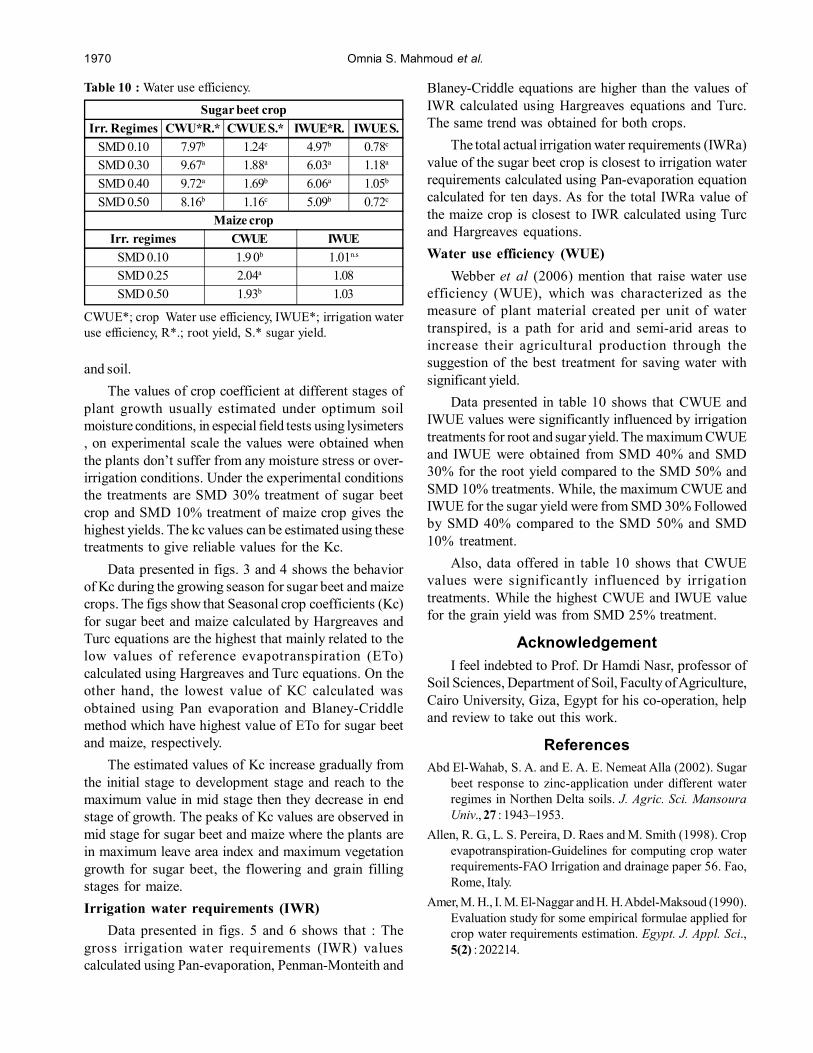
Data illustrated in table 7 and figs. 1 and 2 shows theETo values calculated at each growing stage and at theend of the seasons, according to Penman-Monteith, Pan-evaporation, Blaney-Criddle, Turc, Hargreaves equationsfor sugar beet and maize using climatological data forthe experimental site (table 6). The obtained resultsindicate that gross ETo values calculated using Pan-evaporation and Blaney-Criddle equations are higher inall cases than the values of ETo calculated using Turc
and Hargreaves equations in the two growing seasons.In winter season (sugar beet crop) the ETo values
have the order Pan-evaporation > Blaney-Criddle >Penman-Monteith > Turc >Hargreaves. As for summerseason (maize crop) it follows the order Blaney-Criddle> Pan-evaporation > Penman-Monteith > Hargreaves >Turc.
The observed variances between the gross ETovalues calculated using different empirical equations maybe attributed to the variations of the climatic elementsneeded for calculation of each equation and differencesin climatic elements between seasons.
Data offered in table 7 shows that the variations ofthe daily ETo values between equations were highaccording to equations differences and different growthstages of crops. High values of the daily ETo wereobtained at the end stage for sugar beet crop, while itreached maximum at initial stage for maize. This aremainly related to climate conditions in table 6. Such as
Table 4 : The response of sugar beet crop to different irrigation regimes.
Irr. Regimes Eta (mm) IWRa (mm) Sucrose (%) Root yield(kg/fed-1 ) Sugar yield(kg/fed-1)SMD 0.10 861.12 1380.00 17.57 c 28826.67 c 4502.32c
SMD 0.30 833.82 1336.25 21.04a 33850.00 a 6600.46a
SMD 0.40 798.72 1280.00 19.34b 32600.00 b 5664.66b
SMD 0.50 666.12 1067.50 16.51c 22833.33d 3249.43d
L.S.D at 5%.
Table 5 :The response of maize crops to different irrigationregimes.
Irr. regimes Eta( mm) IWR (mm) Yield(kg/fed-1)SMD 0.10 425.47 802.77 3403.40 a
SMD 0.25 340.08 641.66 2909.67b
SMD 0.50 275.31 519.45 2238.13 c
L.S.D at 5%.
Table 6 : Monthly meterological data during (2018-2019).
EP Wind RH. T min. T max. Month(m/s2) (%) (0C) (0C)
Sugar beet crop (2018)9.06 2.21 46.65 18.90 30.55 Oct.*7.00 1.85 57.67 15.47 26.90 Nov.5.37 1.92 60.67 11.60 21.33 Des.
Sugar beet crop (2019)5.13 2.06 51.67 6.97 19.63 Jan.5.27 2.12 53.00 8.07 21.80 Feb.6.54 2.71 48.50 11.65 24.23 Mar.8.20 2.66 46.33 14.47 28.53 Apr.9.10 2.83 32.50 18.05 34.35 May.**
Maize crop (2019)12.10 2.81 42.67 24.27 38.17 Jul.12.27 2.93 46.00 24.53 37.67 Aug.10.50 2.89 53.33 22.47 34.83 Sep.8.05 2.36 51.50 21.40 34.40 Oct.**
* Calculated from data 11-31 Oct. ,** Calculated from data 1-20 May., *** Calculated from data 1-20 Oct.(Source: meterology station of giza –Egyt in AgricultureResearch Center).
1966 Omnia S. Mahmoud et al.
high temperature and low relative humidity in May, theend of the season of sugar beet crop and in July whichrepresents the beginning of the growing season of maizecrop and these parameters increase the evaporatingpower of the atmosphere.Calculated crop evapotranspiration (ETc)
There is no hesitation that the value of cropevapotranspiration (ETc) is mainly depend on thephysiological growth stage, crop characteristics, sowingdate, rate of crop development, length of growing seasonand the climatic conditions. Data of the calculated cropevapotranspiration for sugar beet and maize are reportedin tables 8 and 9. The data reveal that: The Total valuesof the ETc calculated using the different investigatedequations and using Kc values proposed by Allen et al(1998) follow the order: Pan evaporation > Blaney-Criddle > Penman-Monteith > Turc > Hargreaves forsugar beet but, following Pan evaporation > Blaney-Criddle > Penman-Monteith >Hargreaves > Turc formaize.
On the meantime the highest value of ETc was
recorded for mid-stage this is mainly owing to themaximum vegetation growth for sugar beet , the floweringand grain filling stages for maize, in addition to the climaticconditions in this stage, whilst, the lowest values of ETcwere occurred in initial stages as plants in initial stageare still small and not cover most of soil surface andmost of irrigation water goes back to the atmospherethrough evaporation from soil surface only.
When comparing the total actual evapotranspiration(Eta) value of the sugar beet crop with the totalevapotranspiration values (ETc) calculated using theexperimental equations by the standard error (SE). Thedata indicate that the closest equation to the seasonalEta at the field is the equation Pan evaporation calculatedfor ten days. Where there is non-significant differencebetween total Eta and total ETc calculated using thisequation. The Same thing when comparing the seasonalEta value of the maize crop with the total ETc valuescalculated using the empirical equations (table 9), wefind that the closest equations to the actualevapotranspiration of the field experiment is Turc andHargreaves equations calculated for ten days.
Fig. 1 : Reference evapotranspiration (ETo) using different equations for gross season for sugar beet.
Fig. 2 : Reference evapotranspiration (ETo) using different equations for gross season for maize.
Determination of Evapotranspiration of some Crops using some Empirical Equations 1967

The differences of ETc values, which calculatedusing different experimental equations during each growthstage of crop. It may lead to make The validity of theequations during each growth phase different. The closestequations for the growth stages of sugar beet and maizecrop are Blaney-Criddle, Pan evaporation for initial anddevelopment stages, respectively. While, Penman-Monteith and Blaney-Criddle for End stage for sugar
beet. Where there is non-significant difference between(Eta) actual evapotranspiration and (ETc) calculatedusing this equations at this stages. For maize there is nonsignificant difference between (Eta) actualevapotranspiration and (ETc) calculated using, Blaney-Criddle for initial stage, Turc and Hargreaves equationsfor development stage, however, there is significantdifference between (Eta) actual evapotranspiration and
Table 7 : Calculated reference evapotranspiration (ETo) using different equations for different growth stages periods for crops.
Growth stages
Initial stage Develop. Stage Mid. Stage End Stage
mm d-1 mm mm d-1 mm mm d-1 mm mm d-1 mm MmCalculated reference evapotranspiration (ETo) using different equations for different growth stages periods for sugar beet.Panman-monteith 3.92 137.28 2.37 142.06 3.46 242.10 6.09 273.90 795.34
Class A pan 6.17 216.08 4.12 247.07 4.18 292.82 5.71 256.73 1012.70Blaney-criddle 4.73 165.58 2.80 167.78 3.56 249.26 6.32 284.44 867.06
Turc 3.58 125.36 2.34 140.58 2.98 208.92 5.23 235.41 710.27Hargreaves 3.30 115.38 2.14 128.47 3.13 219.13 5.29 238.00 700.98
Calculated reference evapotranspiration (ETo) using different equations for different growth stages periods for maize.Panman-monteith 8.38 167.62 7.99 239.56 6.88 206.34 5.46 169.36 782.88
Class A pan 8.45 168.96 8.46 253.94 8.19 245.55 6.20 192.25 860.70Blaney-criddle 9.19 183.71 8.74 262.28 7.53 225.88 6.27 194.24 866.11
Turc 6.90 137.90 6.40 192.15 5.14 154.07 4.44 137.66 621.78Hargreaves 7.08 141.60 6.52 195.72 5.33 159.98 4.51 139.94 637.24
Methods of Grosscalculation ETo season
Table 8 :Crop evapotranspiration ( ETc ) mm of sugar beet calculated using different equations and actual evapotranspirationfor treatment that have higher crop yield.
Growth KC Panman- Pan- Blaney- Turc Hargreaves Eta SE**stages FAO* monteith evaporation criddle
Initial 0.49 67.27 105.88 81.13 61.43 56.54 81.12 7.33Develop. 0.86 122.17 212.48 144.29 120.9 110.48 198.90 17.79
Mid. 1.23 297.78 360.17 306.59 256.97 269.53 343.20 16.45End 0.76 208.16 195.11 216.17 178.91 180.88 210.60 6.47Total 0.83 695.38 873.64 748.18 618.21 617.43 833.82 44.01
Kc FAO* : kc calculated from standard kc values for represent different weather according to Allen et al. (1998),SE** standard error.
Table 9 :Crop evapotranspiration (ETc) mm of maize calculated using different equations and actual evapotranspiration fortreatment that have higher crop yield.
Growth KC Panman- Pan- Blaney- Turc Hargreaves Eta SE**stages FAO* monteith evaporation criddle
Initial 0.22 36.88 37.17 40.42 30.34 31.15 39.75 1.74Develop. 0.74 177.27 187.92 194.09 142.19 144.83 141.33 10.01
Mid. 1.26 259.99 309.39 284.61 194.13 201.57 150.17 24.89End 0.40 67.74 76.90 77.70 55.06 55.98 94.22 6.08Total 0.66 541.88 611.38 596.82 421.72 433.53 425.47 36.27
Kc FAO* : kc calculated from standard kc values for represent different weather according to Allen et al.(1998),SE** standard error.
1968 Omnia S. Mahmoud et al.

Fig. 4 : Kc values of maize at different crop stages using different equations for calculating ETo.
Fig. 5 : Relationship between calculated and actual irrigation water requirements for sugar beet.
Fig. 3 : Kc values of sugar beet at different crop stages using different equations for calculating ETo.
(ETc) calculated using all the experimental equations inMid stage for both crop and in end stage for maize thatmay come back to the significant variation in the valuesof crop coefficient that estimated in the field and thecrop coefficient used from FAO, which is related to thevariety of plant types and hybrid used. In addition to theeffect of the date of agriculture (lug late) for maize crop.
As the climate change condition, it is recommended toconduct local calibrations for this equations, to ensurethe correctness of results for each region.Crop coefficient (Kc)
The Kc coefficient combines crop characteristicsand averaged effects of evaporation from the soil.Therefore, it differs in accordance with the type of crop
Determination of Evapotranspiration of some Crops using some Empirical Equations 1969
and soil.The values of crop coefficient at different stages of
plant growth usually estimated under optimum soilmoisture conditions, in especial field tests using lysimeters, on experimental scale the values were obtained whenthe plants don’t suffer from any moisture stress or over-irrigation conditions. Under the experimental conditionsthe treatments are SMD 30% treatment of sugar beetcrop and SMD 10% treatment of maize crop gives thehighest yields. The kc values can be estimated using thesetreatments to give reliable values for the Kc.
Data presented in figs. 3 and 4 shows the behaviorof Kc during the growing season for sugar beet and maizecrops. The figs show that Seasonal crop coefficients (Kc)for sugar beet and maize calculated by Hargreaves andTurc equations are the highest that mainly related to thelow values of reference evapotranspiration (ETo)calculated using Hargreaves and Turc equations. On theother hand, the lowest value of KC calculated wasobtained using Pan evaporation and Blaney-Criddlemethod which have highest value of ETo for sugar beetand maize, respectively.
The estimated values of Kc increase gradually fromthe initial stage to development stage and reach to themaximum value in mid stage then they decrease in endstage of growth. The peaks of Kc values are observed inmid stage for sugar beet and maize where the plants arein maximum leave area index and maximum vegetationgrowth for sugar beet, the flowering and grain fillingstages for maize.Irrigation water requirements (IWR)
Data presented in figs. 5 and 6 shows that : Thegross irrigation water requirements (IWR) valuescalculated using Pan-evaporation, Penman-Monteith and
Blaney-Criddle equations are higher than the values ofIWR calculated using Hargreaves equations and Turc.The same trend was obtained for both crops.
The total actual irrigation water requirements (IWRa)value of the sugar beet crop is closest to irrigation waterrequirements calculated using Pan-evaporation equationcalculated for ten days. As for the total IWRa value ofthe maize crop is closest to IWR calculated using Turcand Hargreaves equations.Water use efficiency (WUE)
Webber et al (2006) mention that raise water useefficiency (WUE), which was characterized as themeasure of plant material created per unit of watertranspired, is a path for arid and semi-arid areas toincrease their agricultural production through thesuggestion of the best treatment for saving water withsignificant yield.
Data presented in table 10 shows that CWUE andIWUE values were significantly influenced by irrigationtreatments for root and sugar yield. The maximum CWUEand IWUE were obtained from SMD 40% and SMD30% for the root yield compared to the SMD 50% andSMD 10% treatments. While, the maximum CWUE andIWUE for the sugar yield were from SMD 30% Followedby SMD 40% compared to the SMD 50% and SMD10% treatment.
Also, data offered in table 10 shows that CWUEvalues were significantly influenced by irrigationtreatments. While the highest CWUE and IWUE valuefor the grain yield was from SMD 25% treatment.
AcknowledgementI feel indebted to Prof. Dr Hamdi Nasr, professor of
Soil Sciences, Department of Soil, Faculty of Agriculture,Cairo University, Giza, Egypt for his co-operation, helpand review to take out this work.
ReferencesAbd El-Wahab, S. A. and E. A. E. Nemeat Alla (2002). Sugar
beet response to zinc-application under different waterregimes in Northen Delta soils. J. Agric. Sci. MansouraUniv., 27 : 1943–1953.
Allen, R. G., L. S. Pereira, D. Raes and M. Smith (1998). Cropevapotranspiration-Guidelines for computing crop waterrequirements-FAO Irrigation and drainage paper 56. Fao,Rome, Italy.
Amer, M. H., I. M. El-Naggar and H. H. Abdel-Maksoud (1990).Evaluation study for some empirical formulae applied forcrop water requirements estimation. Egypt. J. Appl. Sci.,5(2) : 202214.
Table 10 : Water use efficiency.
Sugar beet cropIrr. Regimes CWU*R.* CWUE S.* IWUE*R. IWUE S.
SMD 0.10 7.97b 1.24c 4.97b 0.78c
SMD 0.30 9.67a 1.88a 6.03a 1.18a
SMD 0.40 9.72a 1.69b 6.06a 1.05b
SMD 0.50 8.16b 1.16c 5.09b 0.72c
Maize cropIrr. regimes CWUE IWUE
SMD 0.10 1.9 0b 1.01n.s
SMD 0.25 2.04a 1.08SMD 0.50 1.93b 1.03
CWUE*; crop Water use efficiency, IWUE*; irrigation wateruse efficiency, R*.; root yield, S.* sugar yield.
1970 Omnia S. Mahmoud et al.
Asker, F. A., M. A. Barakat and M. M. Attia (1992). Suitabilityof different empirical methods for calculating crop waterrequirements in North Nile Delta region. J. Agric. Sci.Mansoura Univ., 17(5): 1160-1166.
Ayers, R. S. and D. W. Westcot (1985). Water quality foragriculture (Vol. 29). Rome: Food and AgricultureOrganization of the United Nations.
Azab M.A. (1998). Effect of water depletion and nitrogen rateon water consumption use and yield of wheat in sandysoil. Al-Azhar J. Agric. Res., 27 : 1-12.
Besheit, S. Y., B. B. Mekki and M. G. Beshay (1996). Effect ofdifferent levels of water supply on sugar beet yield andquality in calcareous soils. J. Agric. Sci. MansouraUniv., 21 : 3429-3436.
Borham, T. I., M. E. Shawky, R. E. Sabrah and F. A. Gomaa(2005). Water Use Efficiency For Some Crops UnderIntercropping Systems. 3 rd Conference on RecentTechnologies in Agriculture, 2005 .
Camprag, D. (1976). The effect of irrigation on the occurrenceof some important sugar beet pests in Yugoslavia andother countries of southeastern Europe.Proceedings ofthe 39th Winter Congress of the International Institute forSugar Beet Research, pp. 449-57.
Christmann, J. (1976). Relations entre l’irrigation, les maladieset les ravageurs de la betterave a sucre. Proceedings ofthe 39th Winter Congress of the International Institute forSugar Beet Research, pp. 149-57.
Davidoff, B. and R. J. Hanks (1989). Sugar beet production asinfluenced by limited irrigation. Irrigation Science, 10(1): 1-17.
Quebrajo, L., M. Perez-Ruiz, L. Pérez-Urrestarazu, J. Doorenbosand W. O. Pruitt (1984). Guidelines for predicting cropwater requirements. F.A.O. Irrigation and Drainage paperNo. 24. Rome.
Dunham, R. J. (1993). Water use and irrigation. In : The sugarbeet crop (pp. 279-309). Springer, Dordrecht.
El-Gindy, A. M., M. A. Massoud and M. A. Hussein (1991).Calculation of evapotranspiration and crop coefficient forsome irrigated Egyptian crops. Egypt. J. Soil Sci., 31(3):403-419.
FAO (2002). Deficit Irrigation Practices. Water Reports No.22. Rome.
Giriappa, S. (1983). Water use efficiency in agriculture. Oxford& IBH publishing C.O. New Delhi.
Hoffmann, C. M. (2014). Adaptive responses of Beta vulgarisL. and Cichorium intybus L. root and leaf forms to droughtstress. Journal of agronomy and crop science, 200(2) :108-118.
Israelsen, O. W. and V. E. Hansen (1962). Irrigation principlesand practices. 3rd Edit. John Willey and Sonsins, NewYork.
Jensen, M. E., R. D. Burman and R. G. Allen (1990).Evapotranspiration and irrigation water requirements.
ASCE.Kashyap, P. S. and R. K. Panda (2001). Evaluation of
evapotranspiration estimation methods and developmentof crop-coefficients for potato crop in a sub-humid region.Agricultural Water Management, 50(1) : 9-25.
Klute, A. (ed.) (1986). Methods of Soil Analysis. Part -1 “Physicaland mineralogical Methods” 2nded . Amer. Soc. of Agron.Madison, Wisconsin, U.S.A.
Li, S., S. Kang, L. Zhang, J. Zhang, T. Du, L. Tong and R. Ding(2016). Evaluation of six potential evapotranspirationmodels for estimating crop potential and actualevapotranspiration in arid regions. Journal of Hydrology,543 : 450-461.
Liu, X. Y., Y. Z. Li and Q. S. Wang (2006). Evaluation on severaltemperature-based methods for estimating reference cropevapotranspiration. Transactions of the CSAE, 22(6) : 12-18.
Liu, X., C. Xu, X. Zhong, Y. Li, X. Yuan and J. Cao (2017).Comparison of 16 models for reference cropevapotranspiration against weighing lysimetermeasurement. Agricultural Water Management, 184 : 145-155.
Lu, J., G. Sun, S. G. McNulty and D. M. Amatya (2005). AComparison of Six Potential Evapotranspiration Methodsfor Regional Use in the Southeastern United States 1.JAWRA Journal of the American Water ResourcesAssociation, 41(3) : 621-633.
Mäck, G. and C. M. Hoffmann (2006). Organ-specific adaptationto low precipitation in solute concentration of sugar beet(Beta vulgaris L.). European journal of Agronomy, 25(3): 270-279.
Masri, M. I., B. S. B. Ramadan, A. M. A. El-Shafai and M. S. El-Kady (2015). Effect of water stress and fertilization onyield and quality of sugar beet under drip and sprinklerirrigation systems in sandy soil. International Journal ofAgriculture Sciences, ISSN, 2167-0447.
Moosavi, S. G. R., S. H. R. Ramazani, S. S. Hemayati and H.Gholizade (2017). Effect of drought stress on root yieldand some morpho-physiological traits in differentgenotypes of sugar beet (Beta vulgaris L.). Journal ofCrop Science and Biotechnology, 20(3) : 167-174.
Page,A. L., R. H. Miller and D. R. Keeney (1982). Methods ofSoil Analysis. Part-2 “Chemical and MicrobiologicalProperties”,2nd ed. Amer. Soc. of Agron. Madison,Wisconsin, U.S.A.
Paul, M. J. and C. H. Foyer (2001). Sink regulation ofphotosynthesis. Journal of experimental Botany, 52(360): 1383-1400.
Perera, K. C., A. W. Western, B. Nawarathna and B. George(2015). Comparison of hourly and daily reference cropevapotranspiration equations across seasons and climatezones in Australia. Agricultural Water Management, 148: 84-96.
Determination of Evapotranspiration of some Crops using some Empirical Equations 1971

Quebrajo, L., M. Perez-Ruiz, L. Pérez-Urrestarazu, G. Martínezand G. Egea (2018). Linking thermal imaging and soil remotesensing to enhance irrigation management of sugar beet.Biosystems Engineering, 165 : 77-87.
Renfield, E., A. Emmerich, G. Baumarten, C. Winner and U. Beiss(1993). Zur voraussage des melosse suckers ausrubenanalyses. Zuker. In: 1st ed. In: Cock, D. A. and R. K.Scott (Eds.), The Sugar Beet Crop 27. Chapman & Hall(World Crop Series), London, UK, pp. 2–15 (1974).
Satti, S. R., J. M. Jacobs and S. Irmak (2004). Agricultural watermanagement in a humid region: sensitivity to climate, soiland crop parameters. Agricultural water Management,70(1) : 51-65.
Sugar Crops Council (2017). Annual report for sugar crops.Arabic Ed.
Topak, R., B. Acar, R. Uyanöz and E. Ceyhan (2016).Performance of partial root-zone drip irrigation for sugarbeet production in a semi-arid area. Agricultural WaterManagement, 176 : 180-190.
Tsonev, S., E. Todorovska, V. Avramova, S. Kolev, N. Abu-Mhadi and N. K. Christov (2009). Genomics assisted
improvement of drought tolerance in maize: QTLapproaches. Biotechnol Biotechnol EQ 23:1410–1413
Uçan, K. and C. GENÇOÐLAN(2004). The effect of water deficiton yield and yield components of sugar beet. TurkishJournal of Agriculture and Forestry, 28(3) : 163-172.
Vamerali, T., M. Guarise, A. Ganis and G. Mosca (2009). Effectsof water and nitrogen management on fibrous rootdistribution and turnover in sugar beet. European journalof Agronomy, 31(2) : 69-76.
Webber, H. A., C. A. Madramootoo, M. Bourgault, M. G. Horst,G. Stulina and D. L. Smith (2006). Water use efficiency ofcommon bean and green gram grown using alternate furrowand deficit irrigation. Agricultural Water Management,86(3) : 259-268.
Zheng, H., G. Yu, Q. Wang, X. Zhu, J. Yan, H. Wang and J.Zhang (2017). Assessing the ability of potentialevapotranspiration models in capturing dynamics ofevaporative demand across various biomes and climaticregimes with China FLUX measurements. Journal ofHydrology, 551 : 70-80.
1972 Omnia S. Mahmoud et al.