determination of fe2+ ions concentration in serum … · with concentrations 0.075, 0.1 and 0.15...
TRANSCRIPT
Comenius University, Bratislava, Faculty of Medicine
Institute of Medical Chemistry, Biochemistry and Clinical Biochemistry
1
PHYSICO – CHEMICAL METHODS
PRACTICAL EXERCISE No1
DETERMINATION OF Fe2+ IONS CONCENTRATION IN SERUM
USING ANALYTICAL CURVE
Name, group No: Date:
Principle
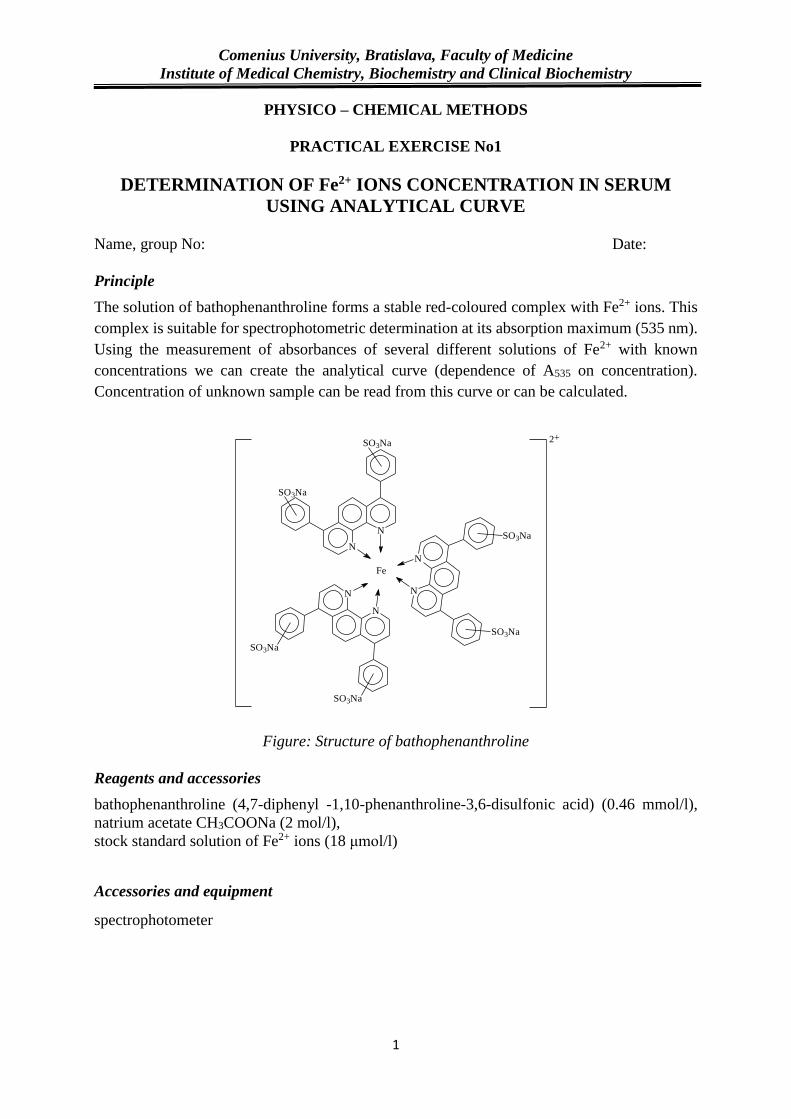
The solution of bathophenanthroline forms a stable red-coloured complex with Fe2+ ions. This
complex is suitable for spectrophotometric determination at its absorption maximum (535 nm).
Using the measurement of absorbances of several different solutions of Fe2+ with known
concentrations we can create the analytical curve (dependence of A535 on concentration).
Concentration of unknown sample can be read from this curve or can be calculated.
Figure: Structure of bathophenanthroline
Reagents and accessories
bathophenanthroline (4,7-diphenyl -1,10-phenanthroline-3,6-disulfonic acid) (0.46 mmol/l),
natrium acetate CH3COONa (2 mol/l),
stock standard solution of Fe2+ ions (18 μmol/l)
Accessories and equipment
spectrophotometer
N
N
SO3Na
SO3Na
N
N
SO3Na
SO3Na
N
N
SO3Na
SO3Na
Fe
2+
Comenius University, Bratislava, Faculty of Medicine
Institute of Medical Chemistry, Biochemistry and Clinical Biochemistry
2
Experimental procedure
Evaluation
1. Construction of analytical curve using absorbances and concentrations in test tubes No. 1 –
No. 4
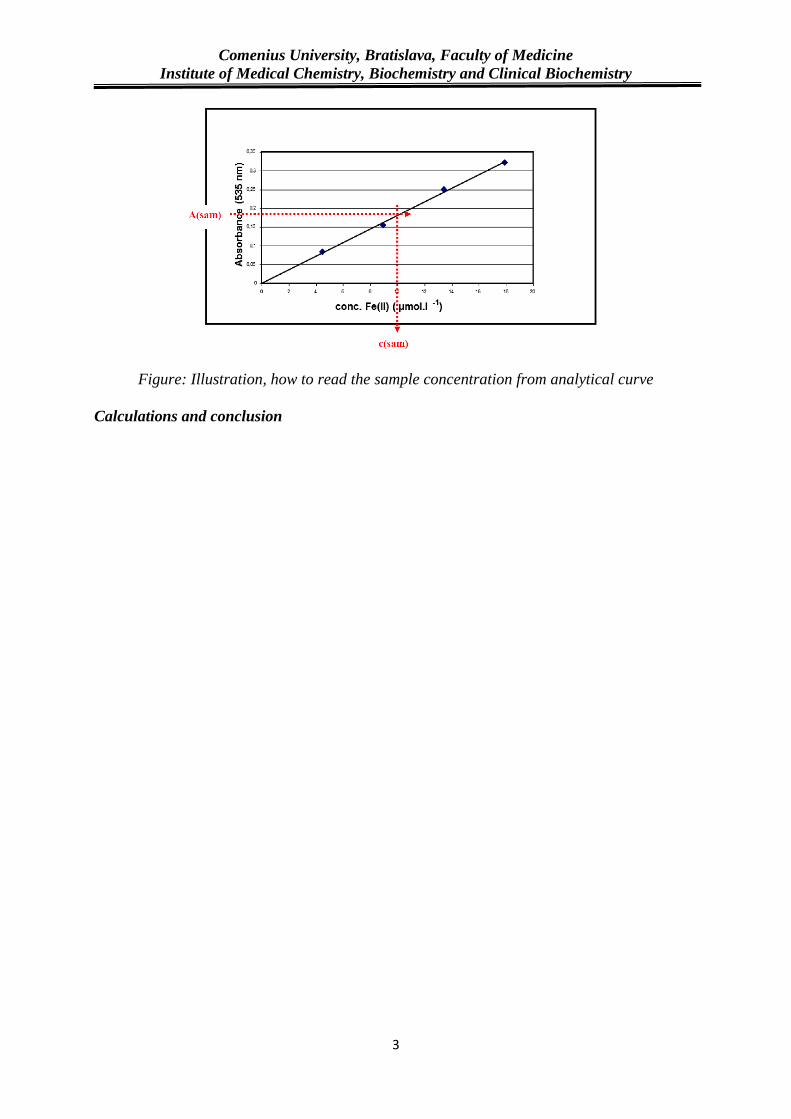
2. Read the concentration of Fe2+ in serum from curve. (see Fig.)
3. Calculate the concentration of Fe2+ ions in serum using one of the known standard solutions:
csam= Asam
Ast . cst
where Asam is absorbance of sample, Ast is absorbance of standard solution, csam is
concentration of the sample and cst is concentration of the standard
4. Compare the determined concentration with physiological values:
fS (Fe2+) males = 9,6 – 30,2 µmol.l-1
fS (Fe2+) females = 8,9 – 27,3 µmol.l-1
fS (Fe2+) children = 9 – 30 µmol.l-1
Test tube No 1 2 3 4
serum
sample
reference
sample
Standard solution Fe2+ (ml) (17.9
µmol/l) 0.5 1.0 1.5 2.0
H2O (ml) 1.5 1.0 0.5 - - 2.0
Serum sample (ml) - - - - 2.0 -
Reagent (ml) 0.5 0.5 0.5 0.5 0.5 0.5
A535 is measured against reference sample within 5-60 min
A535 -
c (Fe2+) (µmol/l) 18 -
Comenius University, Bratislava, Faculty of Medicine
Institute of Medical Chemistry, Biochemistry and Clinical Biochemistry
3
Figure: Illustration, how to read the sample concentration from analytical curve
Calculations and conclusion

Comenius University, Bratislava, Faculty of Medicine
Institute of Medical Chemistry, Biochemistry and Clinical Biochemistry
4
BIOGENIC ELEMENTS
PRACTICAL EXERCISE No2
EFFECT OF METAL IONS ON ELIMINATION OF FREE RADICALS
IN BIOLOGICAL MATERIAL
Name, group No: Date:
Principle
Free radicals are in the organism formed in many pathological conditions. They are derived
mostly from oxygen, e. g. superoxide anion radical O2-. . The enzyme superoxide dismutase
catalyzes its dismutation into oxygen and H2O2, and in this way it decreases its toxicity. Some
metallic ions (e.g. Cu(II), Mn(III), Fe(III) and mainly their biocoordination compounds have
the ability to react with superoxide and thus to eliminate its increased production in the
organism.
Superoxide formed by the system xanthine - xanthine oxidase reduces the detector of
superoxide - a tetrazolium salt (INT) - into monoformazane that can be determined
spectrophotometrically at 510 nm. Superoxide dismutase or Cu(II) complex scavenge
superoxide, so they decrease its level and decrease the reduction of the INT.
X + O2 + H+XO→ O2
.− + H2O2 + uric acid (1)
O2.− + INT + H+ → O2 + INT − H (2)
2O2.− + 2H+
SOD→ O2 + H2O2 (3)
O2.− + Cu (II) → O2 + Cu(I) (4)
Cu (I) + O2.−+2H+ → Cu(II) + H2O2 (5)
Reagents
0.05 mol/1 phosphate buffer solution (pH 7.8),
xanthine (5 x 10⁻⁵ mol/1),
xanthine oxidase (XO) (10 U/l), INT (9.8 x 10⁻⁵ mol/l),
superoxide dismutase (SOD) (1.33 x 10⁻⁷ g/l),
Cu(II) complex (N-salicylidene-L-glutamato)(2-methylimidazole)copper(II) complex (4 x 10⁻⁷
g/l)
Accessories and equipment
spectrophotometer
Comenius University, Bratislava, Faculty of Medicine
Institute of Medical Chemistry, Biochemistry and Clinical Biochemistry
5
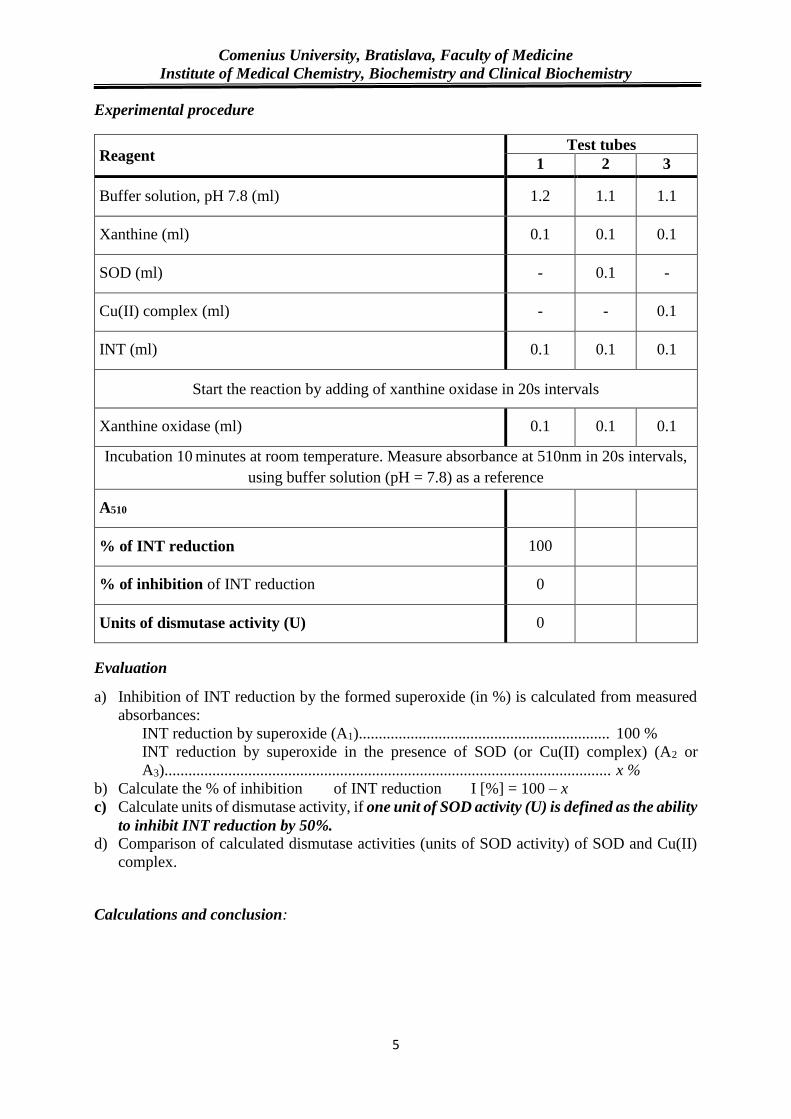
Experimental procedure
Reagent Test tubes
1 2 3
Buffer solution, pH 7.8 (ml) 1.2 1.1 1.1
Xanthine (ml) 0.1 0.1 0.1
SOD (ml) - 0.1 -
Cu(II) complex (ml) - - 0.1
INT (ml) 0.1 0.1 0.1
Start the reaction by adding of xanthine oxidase in 20s intervals
Xanthine oxidase (ml) 0.1 0.1 0.1
Incubation 10 minutes at room temperature. Measure absorbance at 510nm in 20s intervals,
using buffer solution (pH = 7.8) as a reference
A510
% of INT reduction 100
% of inhibition of INT reduction 0
Units of dismutase activity (U) 0
Evaluation
a) Inhibition of INT reduction by the formed superoxide (in %) is calculated from measured
absorbances:
INT reduction by superoxide (A1)............................................................... 100 %
INT reduction by superoxide in the presence of SOD (or Cu(II) complex) (A2 or
A3)................................................................................................................ x %
b) Calculate the % of inhibition of INT reduction I [%] = 100 – x
c) Calculate units of dismutase activity, if one unit of SOD activity (U) is defined as the ability
to inhibit INT reduction by 50%.
d) Comparison of calculated dismutase activities (units of SOD activity) of SOD and Cu(II)
complex.
Calculations and conclusion:
Comenius University, Bratislava, Faculty of Medicine
Institute of Medical Chemistry, Biochemistry and Clinical Biochemistry
6
SOLUTIONS
PRACTICAL EXERCISE No3
PREPARATION OF 250 ml OF NaCl SOLUTION WITH A
CONCENTRATION 0.15 mol.l-1
Name, group No: Date:
Principle
Solution with concentration expressed as the ratio of the amount of substance concentration to
the total volume of the solution is being prepared. The following formula is used:
𝒄 =𝒏
𝑽 𝒏 =
𝒎
𝑴𝒓 𝒎 = 𝒄 . 𝑽 .𝑴𝒓
The solution will be prepared in the 250 ml volumetric flask.
Reagents
NaCl p.a. (Mr = 58)
Accessories and equipment
volumetric flask (250 ml),
funnel,
watch glass,
scale
Experimental procedure
The mass of NaCl necessary to prepare the solution is calculated and the amount is weighed on
the scale. This amount is transferred through the funnel into the volumetric flask and the watch
glass is carefully washed with the distilled water into the volumetric flask. NaCl is dissolved in
distilled water and the flask is filled with water to the graduation mark. The flask is equipped
with a label stating composition and concentration of the compound and the date of preparation.
Calculations and conclusion:
Comenius University, Bratislava, Faculty of Medicine
Institute of Medical Chemistry, Biochemistry and Clinical Biochemistry
7
SOLUTIONS
PRACTICAL EXERCISE No4
PREPARATION OF 100 ml OF 75 AND 100 mmol.1-1 NaCl SOLUTIONS
BY DILUTION OF 150 mmol.l-1 NaCl SOLUTION
Name, group No: Date:
Principle
If the composition of solution is given as amount-of-substance concentration, the following
balance equation- holds for calculation of changes in solution composition by addition of a
solvent:
c1 . V1 = c2 . V2
The equation is derived from balance of the amount of substance:
n1 = c1 . V1 n2 = c2 . V2
From the definition of amount of substance concentration it follows:
n1 = n2
c1 . V1 = c2 . V2
E. g., to prepare 100 ml of a 75 mmol.l-1 solution NaCl by diluting physiological saline (150
mmol.l-1) it holds that:
c1 = 150 mmol.l –1 c2 = 75 mmol.l-1
V1 = ? ml V2 =100 ml
𝐕1 =𝐜2 . 𝐕2
𝐜1= 75 . 100
150= 50 ml
In calculation of the amount of 150 mmol/l NaCl required to prepare 100 ml 100 mmol/l NaCl
is proceed in the same way.
Reagents and accessories
NaCl solution, c = 0.15 mol.l-1,
a set of 100 ml volumetric flasks,
pipettes,
graduated cylinder,
funnel,
wash bottle

Comenius University, Bratislava, Faculty of Medicine
Institute of Medical Chemistry, Biochemistry and Clinical Biochemistry
8
Experimental procedure
Calculated volumes of physiological NaCl solution necessary for preparation of the diluted
solutions are measured with a graduated cylinder, transmitted into 100 ml volumetric flasks,
the flasks are filled with distilled water to the mark, closed with a stopper and well mixed.
Flasks are identified with a label of composition and concentration of the compound, and date
of preparation.
Calculations and conclusion

Comenius University, Bratislava, Faculty of Medicine
Institute of Medical Chemistry, Biochemistry and Clinical Biochemistry
9
SOLUTIONS
PRACTICAL EXERCISE No5
EXAMINATION OF HYPOTONIC HEMOLYSIS (OSMOTIC FRAGILITY) OF
ERYTHROCYTES
Name, group No: Date:
Principle
In hypotonic environment, erythrocytes undergo hemolysis. Osmotic resistance (or,
alternatively, osmotic fragility) is examined by monitoring of erythrocytes hemolysis in
hypotonic environment. The maximal osmotic resistance is determined at the concentration of
NaCl, where the beginning of hemolysis is observed (staining of the supernatant over
erythrocyte sediment is slightly pink or clear due to the small amount of released hemoglobin).
Minimal osmotic resistance is measured at that concentration of NaCl, where hemolysis is
maximal (erythrocytes are completely hemolyzed, the solution has red color and no sediment
is observed at the bottom of the test tube, similarly to the control tube with distilled water).
Examination of osmotic resistance (fragility) is of diagnostic value. It is used for diagnosis as
well as for differentiation of hemolytic disease.
In clinical practice, as well as in research, osmotic fragility is the more frequently used term.
Not to be confused of these two terms, one has to recognize that maximal osmotic resistance
indicates minimal osmotic fragility, and minimal osmotic resistance indicates maximal osmotic
fragility. As it turns out, the more osmotically resistant (more stable against hemolysis) the
erythrocyte is, the smaller its osmotic fragility (sensitivity to hemolysis) is.
Reagents and accessories
Suspension of washed erythrocytes in an isotonic NaCl solution (20%, v/v), NaCl solutions
with concentrations 0.075, 0.1 and 0.15 mol.l-1 prepared in previous practical, test tubes of the
same size, glass and automatic pipettes, aluminium foil, centrifuge, spectrophotometer
Experimental procedure
20% suspension of erythrocytes preparation: Erythrocytes are isolated from blood by
centrifugation (200rpm for 10 min). After sucking off the plasma erythrocytes are three times
washed with isotonic NaCl solution and subsequently centrifuged at the same conditions.
Sediment with erythrocytes is resuspended at five times their volume of physiological solution.
Osmotic fragility examination: Prepared NaCl solutions in different concentrations are pipetted
into a set of centrifuge tubes, according to the table:
Comenius University, Bratislava, Faculty of Medicine
Institute of Medical Chemistry, Biochemistry and Clinical Biochemistry
10
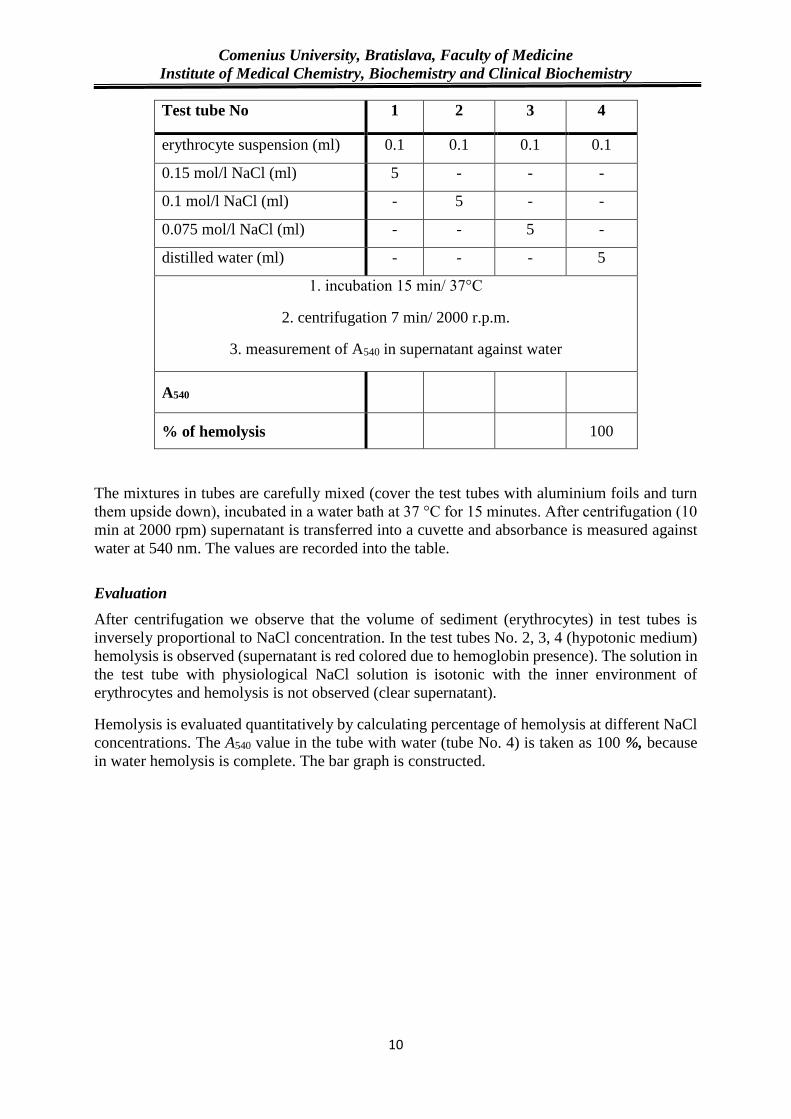
Test tube No 1 2 3 4
erythrocyte suspension (ml) 0.1 0.1 0.1 0.1
0.15 mol/l NaCl (ml) 5 - - -
0.1 mol/l NaCl (ml) - 5 - -
0.075 mol/l NaCl (ml) - - 5 -
distilled water (ml) - - - 5
1. incubation 15 min/ 37°C
2. centrifugation 7 min/ 2000 r.p.m.
3. measurement of A540 in supernatant against water
A540
% of hemolysis 100
The mixtures in tubes are carefully mixed (cover the test tubes with aluminium foils and turn
them upside down), incubated in a water bath at 37 °C for 15 minutes. After centrifugation (10
min at 2000 rpm) supernatant is transferred into a cuvette and absorbance is measured against
water at 540 nm. The values are recorded into the table.
Evaluation
After centrifugation we observe that the volume of sediment (erythrocytes) in test tubes is
inversely proportional to NaCl concentration. In the test tubes No. 2, 3, 4 (hypotonic medium)
hemolysis is observed (supernatant is red colored due to hemoglobin presence). The solution in
the test tube with physiological NaCl solution is isotonic with the inner environment of
erythrocytes and hemolysis is not observed (clear supernatant).
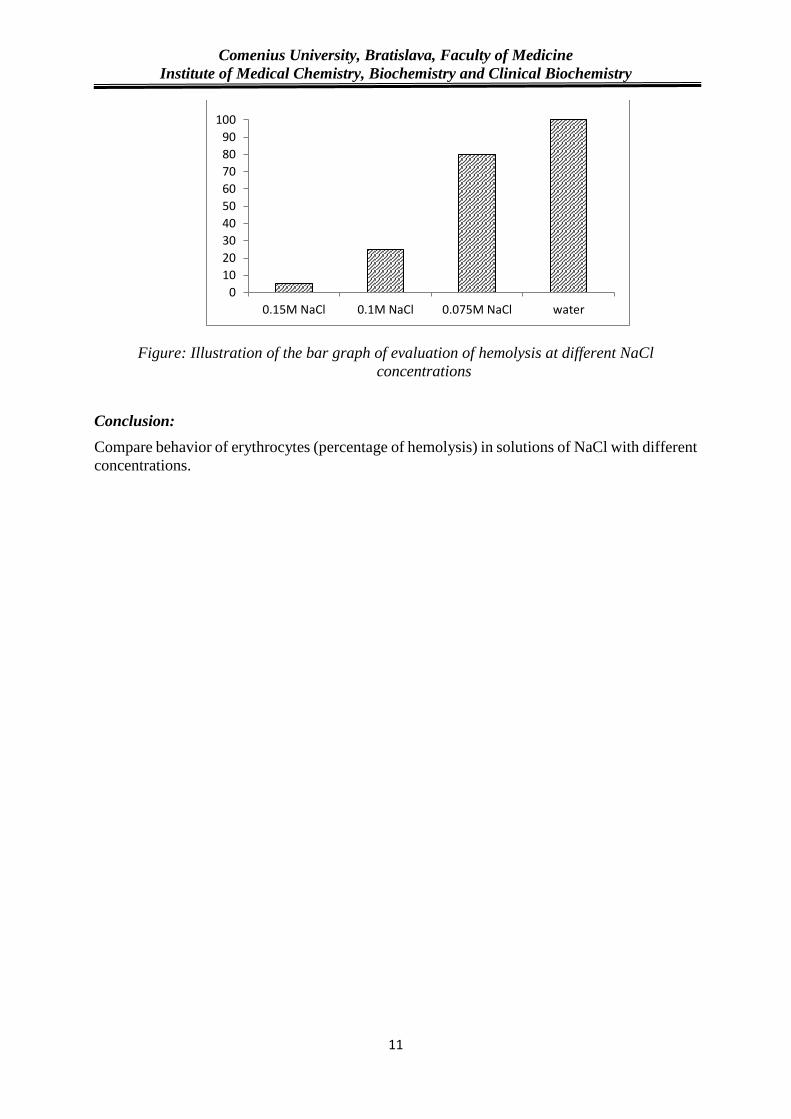
Hemolysis is evaluated quantitatively by calculating percentage of hemolysis at different NaCl
concentrations. The A540 value in the tube with water (tube No. 4) is taken as 100 %, because
in water hemolysis is complete. The bar graph is constructed.
Comenius University, Bratislava, Faculty of Medicine
Institute of Medical Chemistry, Biochemistry and Clinical Biochemistry
11
Figure: Illustration of the bar graph of evaluation of hemolysis at different NaCl
concentrations
Conclusion:
Compare behavior of erythrocytes (percentage of hemolysis) in solutions of NaCl with different
concentrations.
0
10
20
30
40
50
60
70
80
90
100
0.15M NaCl 0.1M NaCl 0.075M NaCl water

Comenius University, Bratislava, Faculty of Medicine
Institute of Medical Chemistry, Biochemistry and Clinical Biochemistry
12
ACIDS AND BASES. pH. BUFFERS
PRACTICAL EXERCISE No6
DETERMINATION OF BODY AND NATURAL FLUIDS pH
Name, group No: Date:
Principle
pH determination of clear body and natural fluids is technically simple. In routine practice it is
sufficient to determine pH with a universal indicator strip or Phan strip. A universal indicator
is a pH indicator composed of a solution of several compounds that exhibits several smooth
color changes over a pH value range from 1 to 14 to indicate the acidity or alkalinity of
solutions.
Reagents
Different solutions of body and natural fluids (lemon juice, vinegar, tap water, milk, saliva and
distilled water)
Accessories and equipment
beakers, universal indicator Phan strips
Evaluation
Indicator strip is immersed into the examined liquid until color development is complete and
taken out. The developed color is compared to the sequence chart on the package, and pH is
read. Measured values are recorded into the table and compared with tabulated data.
Liquid pH (expected) Measured pH
Lemon juice 2.2 – 2.4
Vinegar 2.6 – 2.7
Tap water 5.5 – 6.0
Fresh milk 6.3 – 6.6
Saliva 6.5 – 7.0
Distilled water 7.0

Comenius University, Bratislava, Faculty of Medicine
Institute of Medical Chemistry, Biochemistry and Clinical Biochemistry
13
ACIDS AND BASES. pH. BUFFERS
PRACTICAL EXERCISE No7
DETERMINATION OF ACIDITY CONSTANTS OF WEAK
MONOBASIC ACIDS BY TITRATION
Name, group No: Date:
Principle
Solution of a hydroxide (NaOH, KOH) is gradually added into a known amount of acid, and
pH is measured throughout. Dependence of pH on the amount of added hydroxide solution is
displayed graphically. After adding 0.5 of the hydroxide per 1 equivalent of the acid,
concentrations of free acid and its conjugate base will be equal and from the equation it follows
that pH of this solution will be equal to the pKa value of the acid. The value of pKa is determined
from the graph, and the value of acidity constant of a weak acid, Ka, is calculated.
Reagents
solution of weak acid CH3COOH (c = 0.1mol/l, K = 1.8.10-5) and strong base KOH (c =
0.1mol/l)
Accessories and equipment
burette,
pipette,
beakers,
pH meter,
electromagnetic stirrer
Experimental procedure
20 ml of acetic acid is added to the titration beaker and is filled to 70 ml by water. Stirring the
content of the beaker 0.5 ml of potassium hydroxide is added and changed pH value is marked
to the table.
VKOH (ml) 0 2 4 6 8 10 12 14 16
pH
VKOH (ml) 18 18,5 19 19,5 20 20,5 21 22 23
pH
Evaluation
a) Measured values are plotted as a dependence of pH changes on the amount of added
KOH solution. The slope of the curve changed at the midpoint of the titration. At this
Comenius University, Bratislava, Faculty of Medicine
Institute of Medical Chemistry, Biochemistry and Clinical Biochemistry
14
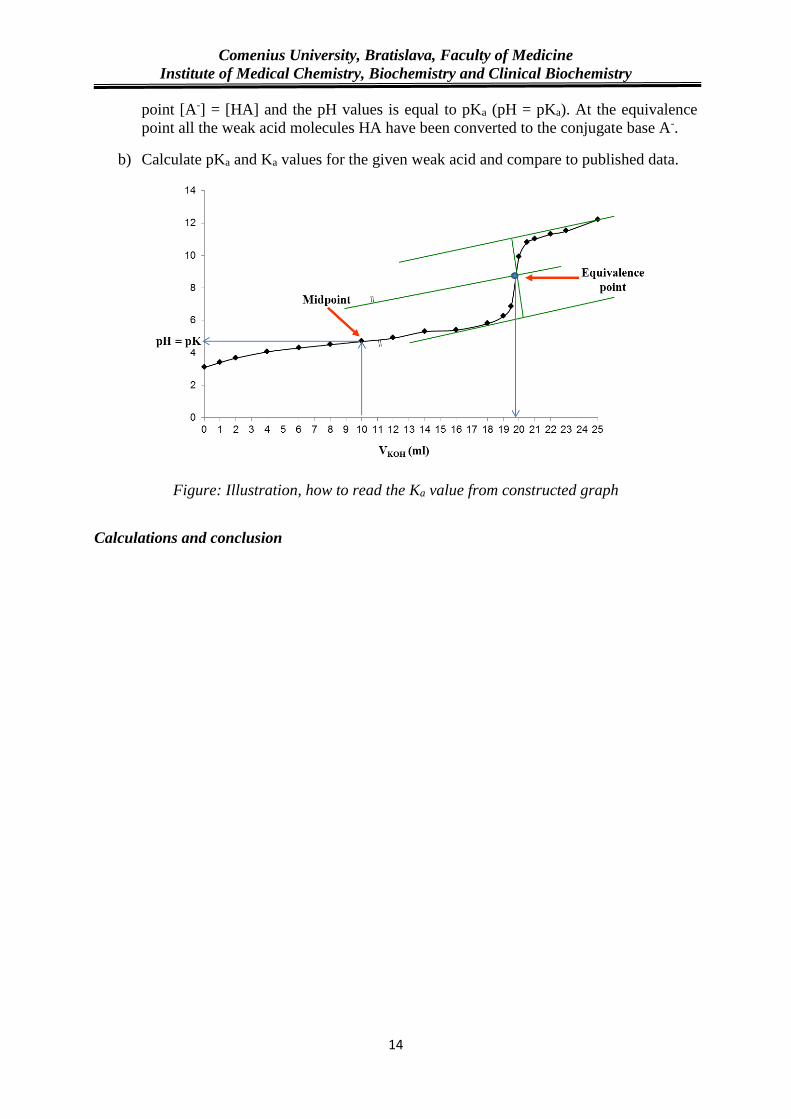
point [A-] = [HA] and the pH values is equal to pKa (pH = pKa). At the equivalence
point all the weak acid molecules HA have been converted to the conjugate base A-.
b) Calculate pKa and Ka values for the given weak acid and compare to published data.
Figure: Illustration, how to read the Ka value from constructed graph
Calculations and conclusion

Comenius University, Bratislava, Faculty of Medicine
Institute of Medical Chemistry, Biochemistry and Clinical Biochemistry
15
ORGANIC CHEMISTRY
PRACTICAL EXERCISE No8
DETERMINATION OF UREA CONCENTRATION IN SERUM AND
URINE
Name, group No: Date:
Principle
In strongly acidic environment, urea forms in the presence of thiosemicarbazide and Fe3+ ions
a red-coloured complex with diacetyl monoxime that is suitable for spectrophotometric
detection.
Reagents
standard solution of urea (c = 20 mmol.l-1),
reagent solution (contains 5.0 mmol.l-1 diacetyl monoxime, 0.9 mmol.l-1 thiosemicarbazide, 0.9
mmol.l-1 H2SO4, 25 μmol.l-1 Fe3+ )
Accessories and equipment
beakers,
boiling water bath,
spectrophotometer
Experimental procedure
Test tube No. 1 2 3 4
Standard solution of urea (ml) 0.01 - - -
Serum (ml) - 0.01 - -
Urine – 100x diluted (ml) - - 0.01 -
H2O (ml) - - - 0.01
Reagent (ml) 2 2 2 2
Stir, heat 10 minutes in boiling water bath,
then cool down and measure A525 against reference solution (tube 4)
A525 -
c (urea) in samples (mmol.l-1) 20 -
Comenius University, Bratislava, Faculty of Medicine
Institute of Medical Chemistry, Biochemistry and Clinical Biochemistry
16
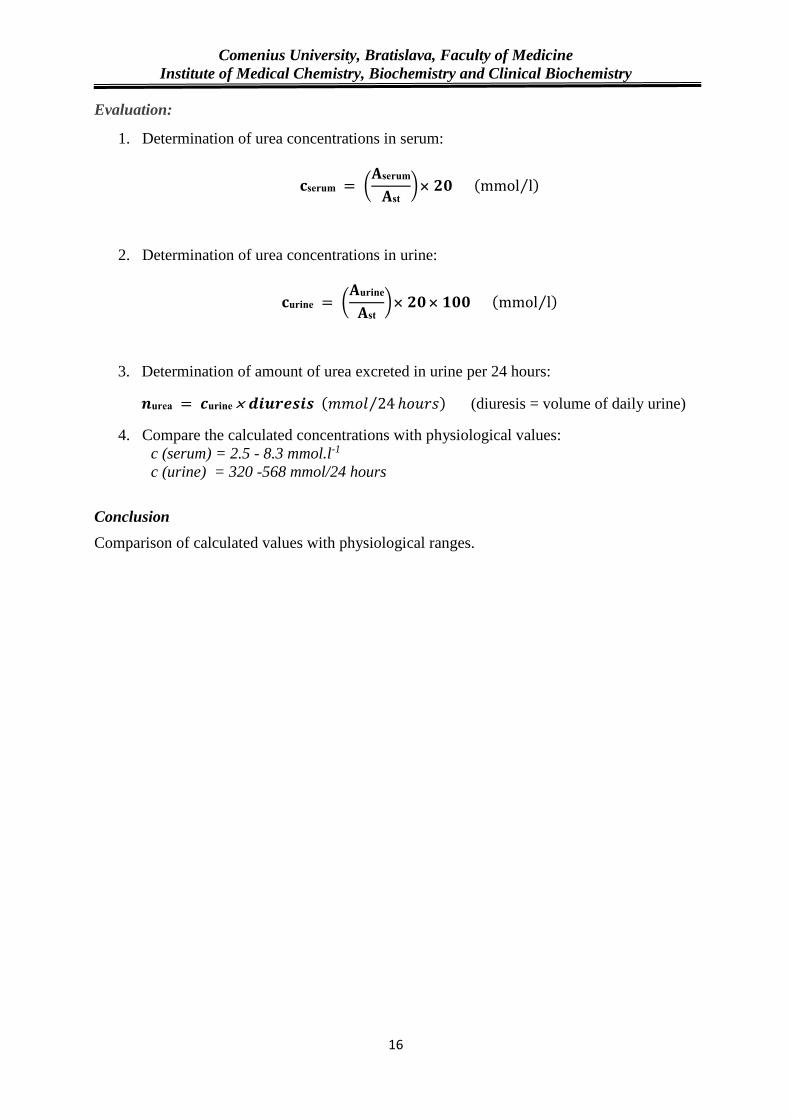
Evaluation:
1. Determination of urea concentrations in serum:
𝐜serum = (𝐀serum
𝐀st) 𝟐𝟎 (mmol l⁄ )
2. Determination of urea concentrations in urine:
𝐜urine = (𝐀urine
𝐀st) 𝟐𝟎 𝟏𝟎𝟎 (mmol l⁄ )
3. Determination of amount of urea excreted in urine per 24 hours:
𝒏urea = 𝒄urine 𝒅𝒊𝒖𝒓𝒆𝒔𝒊𝒔 (𝑚𝑚𝑜𝑙 24⁄ ℎ𝑜𝑢𝑟𝑠) (diuresis = volume of daily urine)
4. Compare the calculated concentrations with physiological values:
c (serum) = 2.5 - 8.3 mmol.l-1
c (urine) = 320 -568 mmol/24 hours
Conclusion
Comparison of calculated values with physiological ranges.

Comenius University, Bratislava, Faculty of Medicine
Institute of Medical Chemistry, Biochemistry and Clinical Biochemistry
17
ORGANIC CHEMISTRY
PRACTICAL EXERCISE No9
DETECTION OF KETONE BODIES IN URINE
Name, group No: Date:
Principle
Acetone and acetoacetic acid give a sensitive reaction with sodium nitroprusside
Na2[Fe(CN)5NO].2H20 in alkaline environment, in the course of which a coloured product is
formed (Legal’s and Lestradet’s test)
Legal’s test
Reagents
sodium nitroprusside (c = 0.2 mol.l-1)
NaOH (w = 10 %),
CH3COOH (w = 98%),
fresh urine,
acetone as positive control
Experimental procedure
Several drops of fresh sodium nitroprusside are added to a 2 ml urine sample. The solution is
alkalized with several drops of NaOH. 1 ml of concentrated acetic acid is added to the red-
coloured reaction product to eliminate false positive reaction with creatinine.
Evaluation
Formation of red-coloured complex is a proof of ketone bodies in the sample. Creatinine, which
is a normal component of urine, gives a positive nitroprusside reaction as well. Reaction of
creatinine can be discerned from that of ketone bodies by addition of acetic acid into the reaction
mixture. Violet colour after acidification with acetic acid is a proof of ketonuria, decolorization
of the red solution points to reaction of creatinine. Acetone and acetoacetic acid can be detected
by the nitroprusside reaction, while β-hydroxybutyric acid does not give a positive reaction and
usually is not determined in urine.
Conclusion
Comenius University, Bratislava, Faculty of Medicine
Institute of Medical Chemistry, Biochemistry and Clinical Biochemistry
18
SACCHARIDES
PRACTICAL EXERCISE No10
DETECTION OF GLUCOSE IN URINE
Name, group No: Date:
Principle
Detection of glucose in urine is based on its reducing properties. Fehling's or Benedict's tests
can be made as preliminary tests. These reactions are not specific for glucose and are positive
with other reducing saccharides as well, thus, in case of a positive reaction a test specific for
glucose has to be performed with the detection strip Glucophan, which is based on action of a
specific enzyme glucose oxidase.
a) Fehling's test
Reagents and equipment
Fehling᾽s I and Fehling᾽s II reagents,
fresh urine,
glass pipettes,
boiling water bath
Experimental procedure
2 ml of Fehling's reagent (Fehling I and Fehling II in a 1:1 ratio) is prepared in a test tube. An
equal volume of examined urine is added and the reaction mixture is heated for 2 minutes in
the boiling water bath. Reaction is positive, if an orange-red (ginger) precipitate of cuprous
oxide forms. Sensitivity is about 10 mmo1.l-1 Reducing tests have to be performed in a fresh,
non-turbid urine. In case of present proteins, urine has to be deproteinated before the test.
b) Detection and semiquantitative determination of glucose with diagnostic strips
"GLUCOPHAN"
Principle
Diagnostic strips serve for fast and specific detection as well as for semiquantitative
determination of glucose in urine. Their indicating zone contains the enzymes glucose oxidase
and peroxidase together with a special chromogenic system that is oxidized in the presence of
glucose to a red-colored product. This enzymatic reaction is specific only for glucose.
Reagents and equipment
Fresh urine,
diagnostic strips Glucophan (stored in a well closed bottle, in a dry and cool place)
Comenius University, Bratislava, Faculty of Medicine
Institute of Medical Chemistry, Biochemistry and Clinical Biochemistry
19
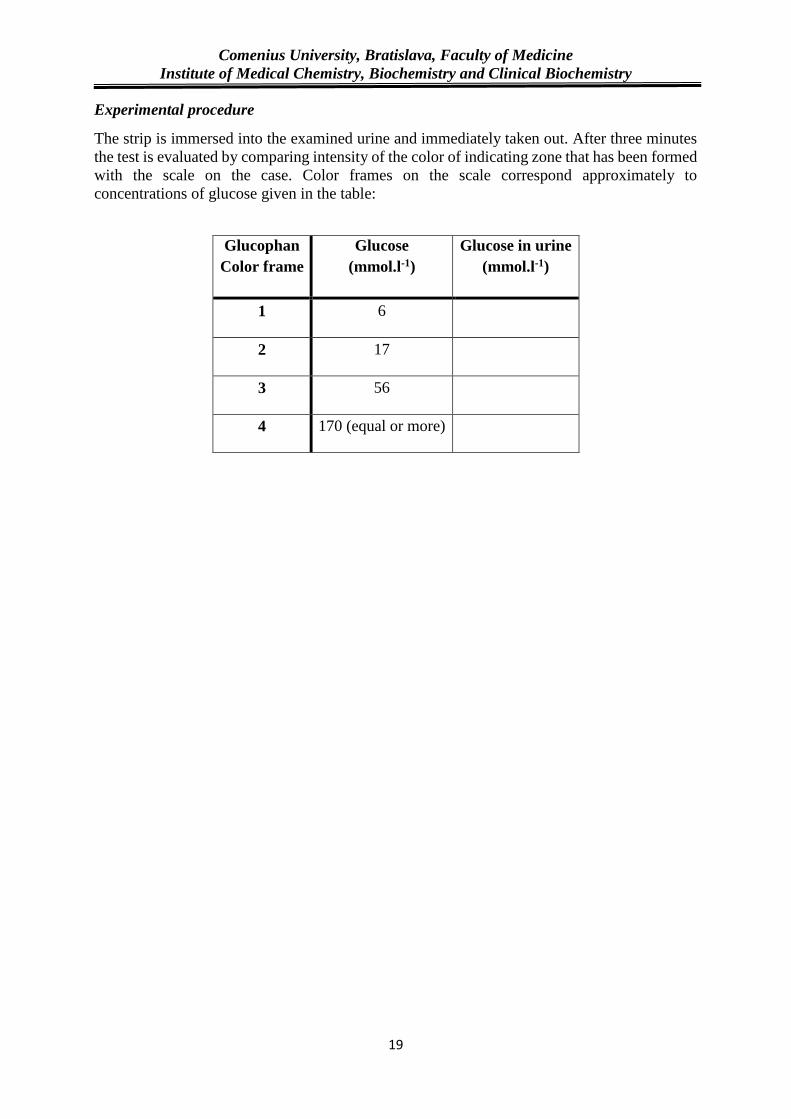
Experimental procedure
The strip is immersed into the examined urine and immediately taken out. After three minutes
the test is evaluated by comparing intensity of the color of indicating zone that has been formed
with the scale on the case. Color frames on the scale correspond approximately to
concentrations of glucose given in the table:
Glucophan
Color frame
Glucose
(mmol.l-1)
Glucose in urine
(mmol.l-1)
1 6
2 17
3 56
4 170 (equal or more)
Comenius University, Bratislava, Faculty of Medicine
Institute of Medical Chemistry, Biochemistry and Clinical Biochemistry
20
SACCHARIDES
PRACTICAL EXERCISE No11
ENZYMATIC DETERMINATION OF GLUCOSE CONCENTRATION
IN SERUM
Name, group No: Date:
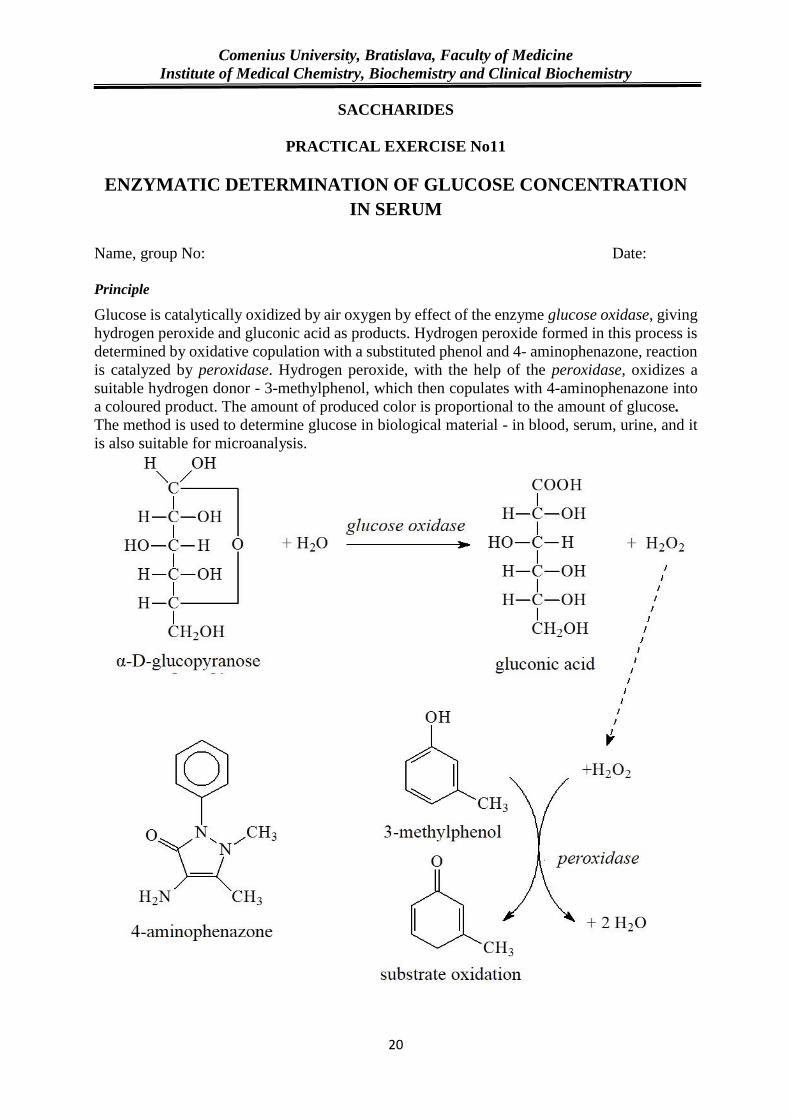
Principle
Glucose is catalytically oxidized by air oxygen by effect of the enzyme glucose oxidase, giving
hydrogen peroxide and gluconic acid as products. Hydrogen peroxide formed in this process is
determined by oxidative copulation with a substituted phenol and 4- aminophenazone, reaction
is catalyzed by peroxidase. Hydrogen peroxide, with the help of the peroxidase, oxidizes a
suitable hydrogen donor - 3-methylphenol, which then copulates with 4-aminophenazone into
a coloured product. The amount of produced color is proportional to the amount of glucose.
The method is used to determine glucose in biological material - in blood, serum, urine, and it
is also suitable for microanalysis.

Comenius University, Bratislava, Faculty of Medicine
Institute of Medical Chemistry, Biochemistry and Clinical Biochemistry
21
Reagents
Bio-La-Test kit - reagent for glucose determination contains: phosphate buffer solution (0.14
mo1.l-1), glucose oxidase (160 μmo.l-1), peroxidase (16 μcat.l-1), solution of 3- methylphenol
(0.01 mol.l-1), 4-aminophenazone solution (0.001 mo1.l-1), standard solution of glucose (0.01
mo1.l-1)
Experimental procedure
During glucose determination in blood or hemolytic serum, biological material has to be
deproteinaited using trichloroacetic acid. 0.5 ml of a deproteinizing solution is added to 0.05
ml of the sample. Formed precipitate is centrifuged (5 min at 3000 rpm). The supernatant is
pipetted for determination of glucose, and the procedure given in the table is used:
Test tube Sample Standard solution Reference solution
Serum (ml) 0.02 - -
Standard solution (ml) - 0.02 -
Distilled water (ml) - - 0.02
Reagent (ml) 2.0 2.0 2.0
Incubate 30 minutes at room temperature or 15 minutes in a water bath at 37 °C (the
incubation mixture is protected from direct light)
A498 -
Evaluation
Blood glucose level is hormonally kept in a constant range. It is changed at pathologic
conditions, thus estimation of glucose level - glycaemia - is of diagnostic value (in diabetes).
Calculate the concentration of glucose according to the formula:
𝒄 =𝑨sam
𝑨st. 𝟏𝟎 (
𝑚𝑚𝑜𝑙
𝑙)
Compare the calculated concentration of glucose in serum with physiological values
serum - 3.9-6.1 mmol.l-1
whole blood - 3.3 - 5.6 mmol.l-1
Calculations and conclusion
Comenius University, Bratislava, Faculty of Medicine
Institute of Medical Chemistry, Biochemistry and Clinical Biochemistry
22
LIPIDS
PRACTICAL EXERCISE No12
DETERMINATION OF CONCENTRATION OF TOTAL SERUM
LIPIDS
Name, group No: Date:
Principle
After hydrolysis with concentrated sulfuric acid blood serum lipids (including non-esterified
fatty acids) react with vanillin and phosphoric acid, forming a red-colored product. Its intensity
is proportional to the amount of total lipids in serum.
Reagents
Bio – La Test kit (vanillin, c = 10 mmol.l-1, phosphoric acid, c = 11.5 mol.l-1),
H2SO4, concentrated
serum,
standard solution of total lipids, c = 8 g.l-1
Accessories and equipment
water bath,
spectrophotometer,
burner
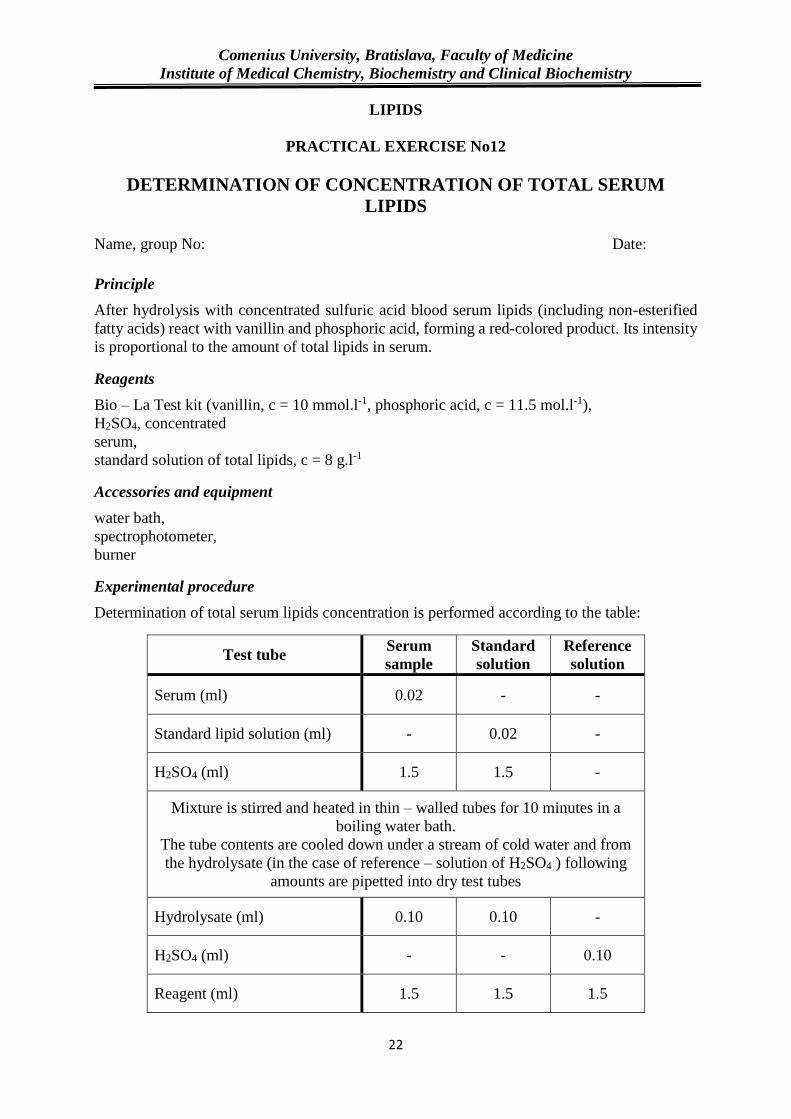
Experimental procedure
Determination of total serum lipids concentration is performed according to the table:
Test tube Serum
sample
Standard
solution
Reference
solution
Serum (ml) 0.02 - -
Standard lipid solution (ml) - 0.02 -
H2SO4 (ml) 1.5 1.5 -
Mixture is stirred and heated in thin – walled tubes for 10 minutes in a
boiling water bath.
The tube contents are cooled down under a stream of cold water and from
the hydrolysate (in the case of reference – solution of H2SO4 ) following
amounts are pipetted into dry test tubes
Hydrolysate (ml) 0.10 0.10 -
H2SO4 (ml) - - 0.10
Reagent (ml) 1.5 1.5 1.5
Comenius University, Bratislava, Faculty of Medicine
Institute of Medical Chemistry, Biochemistry and Clinical Biochemistry
23
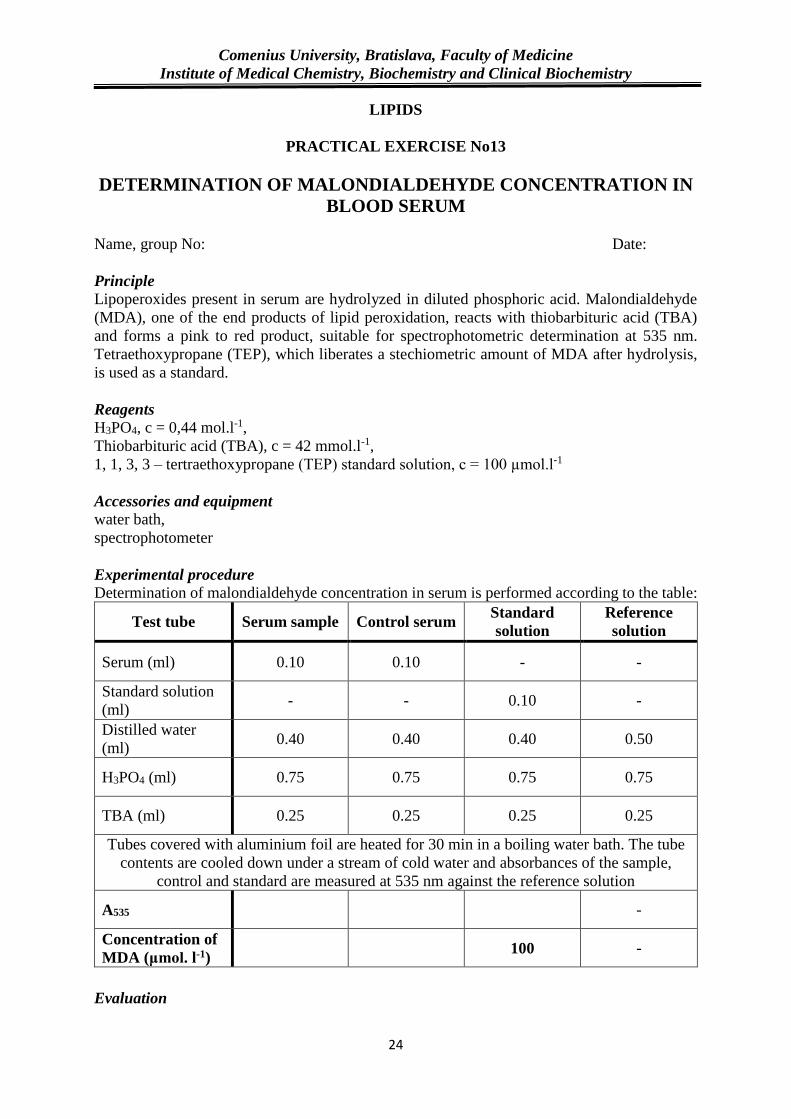
The tube contents are stirred, let stand for 10 – 15 min at room temperature
and absorbances of the sample and standard are measured at 530 nm
against the reference solution
A530 -
Total lipids (g.l-1) 8
Evaluation
Concentration of total serum lipids is calculated from sample (Asam) and standard (Ast)
absorbances according to the formula:
csam= Asam
Ast . 8 (g/l)
Compare the calculated concentration of total lipids with physiological values.
fs total lipids: 4 – 8 g/l
(f = fasted, s = serum)
Calculations and conclusion
Comenius University, Bratislava, Faculty of Medicine
Institute of Medical Chemistry, Biochemistry and Clinical Biochemistry
24
LIPIDS
PRACTICAL EXERCISE No13
DETERMINATION OF MALONDIALDEHYDE CONCENTRATION IN
BLOOD SERUM
Name, group No: Date:
Principle
Lipoperoxides present in serum are hydrolyzed in diluted phosphoric acid. Malondialdehyde
(MDA), one of the end products of lipid peroxidation, reacts with thiobarbituric acid (TBA)
and forms a pink to red product, suitable for spectrophotometric determination at 535 nm.
Tetraethoxypropane (TEP), which liberates a stechiometric amount of MDA after hydrolysis,
is used as a standard.
Reagents
H3PO4, c = 0,44 mol.l-1,
Thiobarbituric acid (TBA), c = 42 mmol.l-1,
1, 1, 3, 3 – tertraethoxypropane (TEP) standard solution, c = 100 µmol.l-1
Accessories and equipment
water bath,
spectrophotometer
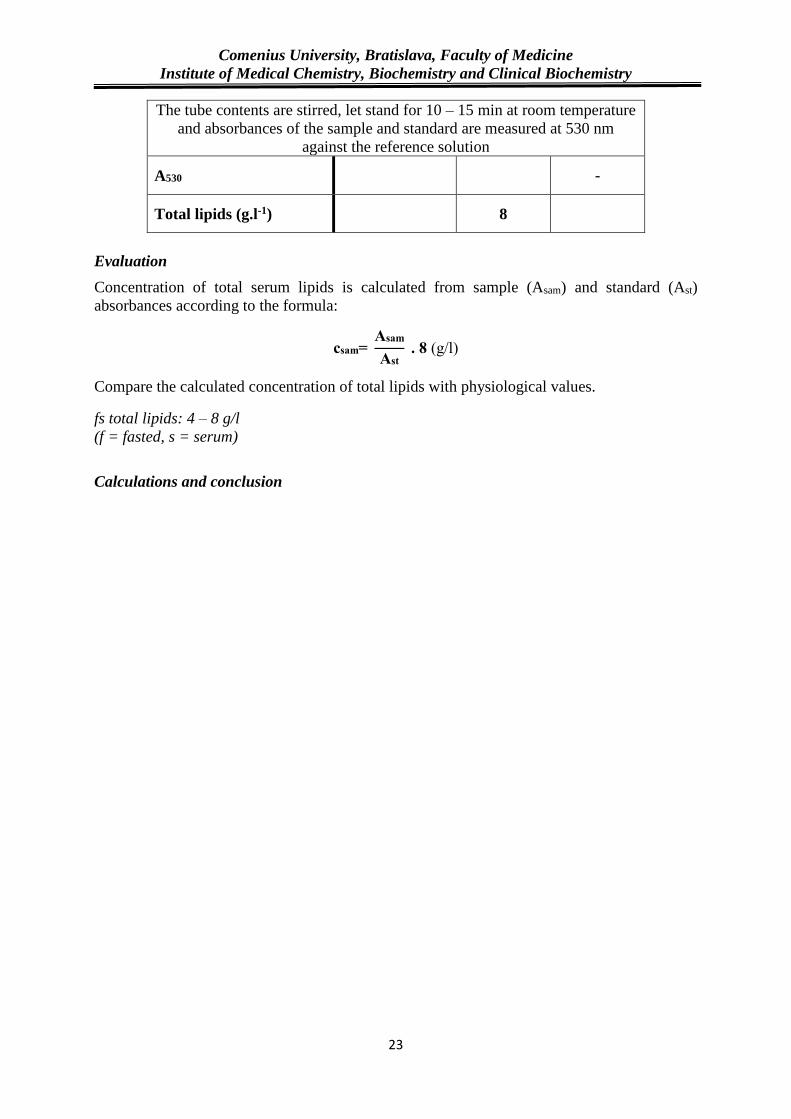
Experimental procedure
Determination of malondialdehyde concentration in serum is performed according to the table:
Test tube Serum sample Control serum Standard
solution
Reference
solution
Serum (ml) 0.10 0.10 - -
Standard solution
(ml) - - 0.10 -
Distilled water
(ml) 0.40 0.40 0.40 0.50
H3PO4 (ml) 0.75 0.75 0.75 0.75
TBA (ml) 0.25 0.25 0.25 0.25
Tubes covered with aluminium foil are heated for 30 min in a boiling water bath. The tube
contents are cooled down under a stream of cold water and absorbances of the sample,
control and standard are measured at 535 nm against the reference solution
A535 -
Concentration of
MDA (μmol. l-1) 100 -
Evaluation
Comenius University, Bratislava, Faculty of Medicine
Institute of Medical Chemistry, Biochemistry and Clinical Biochemistry
25
Concentration of malondialdehyde in the blood serum of the patient and control is calculated
according to the formulae:
csam= Asam
Ast . 100 (µmol/l)
𝑐control= Acontrol
Ast . 100 (µmol/l)
Comparison of MDA concentrations in sample of patient to control sample (healthy person).
Calculations and conclusion

Comenius University, Bratislava, Faculty of Medicine
Institute of Medical Chemistry, Biochemistry and Clinical Biochemistry
26
AMINOACIDS, PROTEINS
PRACTICAL EXERCISE No14
THIN – LAYER chromatography SEPARATION OF AMINO ACIDS
Name, group No: Date:
Principle
The principle of TLC (thin – layer chomatography) method is distribution of the components
of the sample between the mobile and the solid phase (stationary) of the thin layer based on the
different adsorption forces of the components of the sample. The stationary phase is formed by
a thin layer of fine adsorbent which is either intersperse or, preferably, fixed on a base
(aluminum foil, a glass plate). The mobile phase is formed by a mixture of organic solvents.
The components of the sample are separated according to their different affinities to the
adsorbent. Separation of compounds is based on the competition of the solute and the mobile
phase for binding places on the stationary phase. E.g., if as the stationary phase the polar one is
used and we separate two compounds that differ in polarity, the more polar compound has a
stronger interaction with stationary phase and the less polar compound moves higher up the
plate.
Detection of separated components is carried out by spraying an appropriate visualizing agent
(ninhydrine), which gives a positive reaction with free alpha – amino acids. Each component is
characterized by their retention factor.
Reagents
solutions of amino acids: leucine, lysine, glycine, glutamate, their mixture and unknown
samples of amino acids (w = 1%),
detection spray [solution of ninhydrine in acetone (w = 0,4)],
developing system [n-butanol – acetic acid - water (4:1:5)]
Accessories and equipment
silufol plate,
chromatographic chamber
Procedure
Samples of the known amino acids (leucine, lysine, glycine, and glutamate), their mixture and
samples of unknown amino acids are applied in the form of small spots (about 10-20 ml) on the
thin layer silufol plate. The plate is dried out, placed and closed in a chamber saturated with
vapors of a developing system. The separation proceeds until the front of the mobile phase
Comenius University, Bratislava, Faculty of Medicine
Institute of Medical Chemistry, Biochemistry and Clinical Biochemistry
27
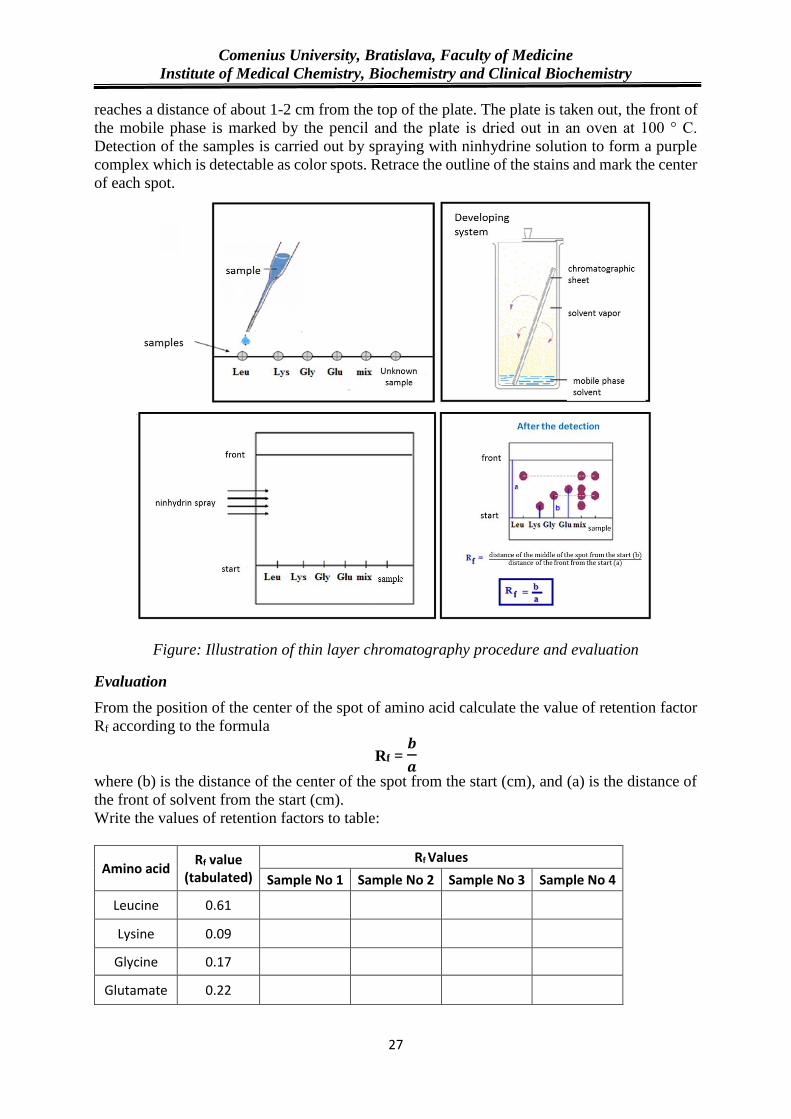
reaches a distance of about 1-2 cm from the top of the plate. The plate is taken out, the front of
the mobile phase is marked by the pencil and the plate is dried out in an oven at 100 ° C.
Detection of the samples is carried out by spraying with ninhydrine solution to form a purple
complex which is detectable as color spots. Retrace the outline of the stains and mark the center
of each spot.
Figure: Illustration of thin layer chromatography procedure and evaluation
Evaluation
From the position of the center of the spot of amino acid calculate the value of retention factor
Rf according to the formula
Rf = 𝒃
𝒂
where (b) is the distance of the center of the spot from the start (cm), and (a) is the distance of
the front of solvent from the start (cm).
Write the values of retention factors to table:
Amino acid Rf value
(tabulated)
Rf Values
Sample No 1 Sample No 2 Sample No 3 Sample No 4
Leucine 0.61
Lysine 0.09
Glycine 0.17
Glutamate 0.22

Comenius University, Bratislava, Faculty of Medicine
Institute of Medical Chemistry, Biochemistry and Clinical Biochemistry
28
The identity of Rf of known amino acids (standards) with Rf for the unknown samples
determines the presence of the corresponding amino acids.
Calculations and conclusion

Comenius University, Bratislava, Faculty of Medicine
Institute of Medical Chemistry, Biochemistry and Clinical Biochemistry
29
AMINOACIDS, PROTEINS
PRACTICAL EXERCISE No15
SEPARATION OF HEMOGLOBIN FROM POTASSIUM
HEXACYANOFERRATE (III) BY GEL PERMEATION
CHROMATOGRAPHY
Name, group No: Date:
Principle
The gel chromatography is based on the separation of compounds passing through the swollen
gel according to their molecular size. In the glass column filled by Sephadex G 100 are
separated compounds with a molecular weight of about 100 000. If the molecules passing the
gel are larger than the inner pores of gel, particles cannot diffuse into the pores and remain in
the interstitial fluid. They are drifted by it, and elute from the column as first. The pores retain
molecules of a smaller size, their movement through the column is stunted, and thus elute later.
The first elutes the hemoglobin followed by potassium hexacyanoferrate. The separation
efficiency of both components is evaluated by the elution diagram obtained by measuring of
the absorbance of the eluates at 420 nm. Absorbance is also the measure of the concentration
of substances in the eluent.
Reagents
Sephadex G 100 swollen in water,
solution of hemoglobin (w = 2%),
solution of K3[Fe(CN)6] (w = 2%)
Accessories and equipment
glass chromatographic column,
test tubes,
spectrophotometer
Procedure
Wash the column filled with swollen Sephadex G 100 with the distilled water. Before the
separation of a mixture slightly remove the distilled water from the surface of Sephadex. By
the pipette gently apply a mixture of 0.2 ml of hemoglobin solution and potassium
hexacyanoferrate (1:1) to the surface of the gel and let it soak into the column. Add small
amount of water and prevent the swirl. Connect with the water tank to enable the water to flow
continuously through the column. We observe the separation of a mixture into two components.
Attention! Column surface must always be under the level of water to prevent the crack of
the gel!!!
The first elutes out of the column the hemoglobin (brown to red band) as the second potassium
hexacyanoferrate (yellow band). The eluent of the compounds are taken up in 1.5 ml fractions
into calibrated tubes (10-15 samples) until both compounds of the mixture will not flow out the
column.
Comenius University, Bratislava, Faculty of Medicine
Institute of Medical Chemistry, Biochemistry and Clinical Biochemistry
30
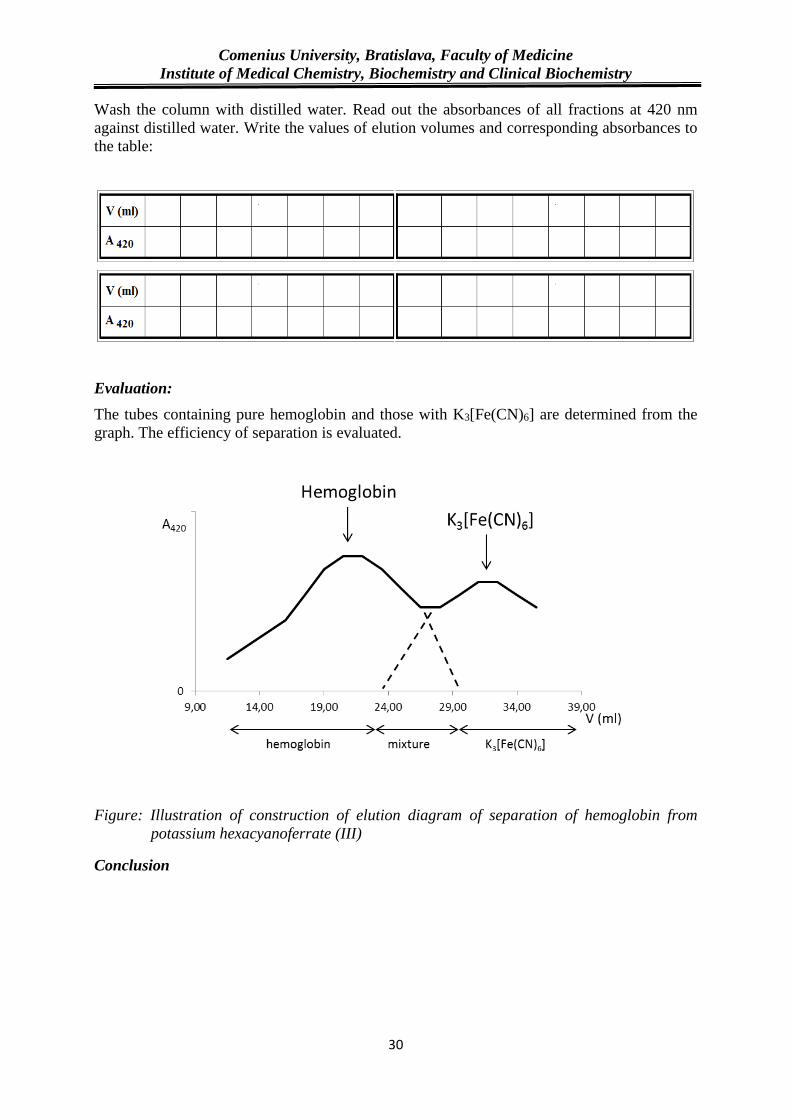
Wash the column with distilled water. Read out the absorbances of all fractions at 420 nm
against distilled water. Write the values of elution volumes and corresponding absorbances to
the table:
Evaluation:
The tubes containing pure hemoglobin and those with K3[Fe(CN)6] are determined from the
graph. The efficiency of separation is evaluated.
Figure: Illustration of construction of elution diagram of separation of hemoglobin from
potassium hexacyanoferrate (III)
Conclusion

Comenius University, Bratislava, Faculty of Medicine
Institute of Medical Chemistry, Biochemistry and Clinical Biochemistry
31
ENZYMES
PRACTICAL EXERCISE No16
EFFECT OF SUBSTRATE CONCENTRATION ON ENZYMATIC
ACTIVITY. DETERMINATION OF MICHAELIS CONSTANT (KM) OF
THE LACTATE DEHYDROGENASE (LDH)
Name, group No: Date:
Principle
Lactate dehydrogenase is enzyme which catalyzes reaction of lactic acid oxidation utilizing
NAD+ as coenzyme:
+ NAD+
+ NADH + H+
CH3 CH
OH
COOH CH3 C COOH
O
lactate pyruvate
At different substrate (lactate) concentrations the enzymatic reaction proceeds at different rates.
The rate is directly proportional to the amount of created product (pyruvate). In alkaline
environment pyruvate gives with 2,4-dinitrophenylhydrazine (DNPH) a brown – orange
pyruvate hydrazone, which is suitable for spectrophotometric determination.
From the values of measured absorbance at 505 nm the graphical dependence of enzymatic
reaction rate on substrate concentration is constructed, and the value of Michaelis constant KM
is determined either approximately according to Michaelis and Menten, or exactly according to
Lineweaver and Bürk.
Reagents
Solution of 2,4 - dinitrophenylhydrazine (DNPH) (w = 0.02 %),
lactate solution, (c = 3 mmol.l-1),
NaOH solution (c = 0.1 mol.l-1),
Tris-HCl buffer solution (c = 0.05 mol.l-1) pH 8.5 –for dilution of lactate and for use in a
reference solution.
Accessories and equipment
glass and automatic pipettes,
spectrophotometer,
water bath
Experimental procedure
Different concentrations of lactate are prepared as follows:

Comenius University, Bratislava, Faculty of Medicine
Institute of Medical Chemistry, Biochemistry and Clinical Biochemistry
32
Test tube No. 1 2 3 4
Concentrated lactate c = 3 mmol/l (ml) 2 1.5 1 0.5
Buffer solution, pH 8.5 (ml) - 0.5 1.0 1.5
Lactate concentration (mmol/l) 3.0 2.2 1.5 0.75
Enzymatic reaction at the different lactate concentration will be set according table:
Test tube No. 1 2 3 4 5
Lactate (ml) - different concentrations 0.4
(3 mM)
0.4
(2,2 mM)
0.4
(1.5 mM)
0.4
(0.75mM)
0.4
(buffer)
LDH (ml)in 30s intervals 0.2 0.2 0.2 0.2 0.2
Resulting substrate concentration 2 1.5 1.0 0.5 -
Incubate for 5 min at 37°C
DNPH (ml) in 30s intervals 0.5 0.5 0.5 0.5 0.5
Stir and let stand for 10min at room temperature
NaOH (ml) 5 5 5 5 5
Stir and let stand for 5 min at room temperature. Measure absorbance at 505 nm against the
reference solution (tube No 5)
A505 -
*buffer solution, pH 8.5
Evaluation
Absorbance values are proportional to the amount of generated product of the enzymatic
reaction –pyruvate; therefore reaction rate can be plotted directly as absorbance values. The
results are recorded into the table:
Test tube No. 1 2 3 4
Resulting concentration [S] in the reaction mixture
(mmol/l) 2 1.5 1.0 0.5
Reaction rate „v“ (A505)
1/[S] 0.5 0.67 1.0 2.0
1/v (1/A)

Comenius University, Bratislava, Faculty of Medicine
Institute of Medical Chemistry, Biochemistry and Clinical Biochemistry
33
The tabulated values are used to create a plot for determination of KM of LDH on a millimeter
paper:
1. According to Michaelis-Menten for approximate KM determination:
v = f ([S])
2. According to Lineweaver-Bürk for precise determination of KM :
𝟏
𝒗= 𝐟 (
𝟏
[𝑺])
From the values plotted in the value of KM is calculated:
−𝟏
𝑲M= −𝒙 (mmol/l)
𝑲M = 𝟏
𝒙 (mmol/l)
Conclusion:
Compare the KM values obtained by both ways and explain, which one is more exact and why.

Comenius University, Bratislava, Faculty of Medicine
Institute of Medical Chemistry, Biochemistry and Clinical Biochemistry
34
ENZYMES
PRACTICAL EXERCISE No17
EFFECT OF ACTIVATORS AND INHIBITORS ON ARGINASE
ACTIVITY
Name, group No: Date:
Principle
Arginase catalyzes hydrolytic cleavage of arginine into urea and ornithine in the urea cycle:
CH2
CH2
CH
COOH
NH2
CH2 NH C NH2
NH
+ H2Oarginase
NH2
C O
NH2
+
CH2 NH2
CH2
CH2
CH NH2
COOH
arginine urea ornithine
The amount of formed urea is directly proportional to the activity of arginase. Urea
concentration is determined by reaction with diacetyl monoxime in strongly acidic conditions
in the presence of thiosemicarbazide and ferric ions. A red complex suitable for
spectrophotometric determination at 525 nm is formed.
Urea cycle is a series of biochemical reactions, which remove the toxic ammonia released
during the degradation of proteins. Mammalian arginase is active as a trimer localized in the
cytoplasm of hepatocytes. Each subunit contains the active site with two Mn2+ ions. Activators
of the enzyme are Mn2+, Mg2+, Ca2+, Ni2+, and Co2+ ions. In their absence the activity of the
enzyme decreases. The competitive inhibitors of arginase include L-ornithine and L-lysine,
competing with arginine for binding to the active site of the enzyme. The high concentration of
the substrate suppresses the inhibitory effect of competitive inhibitors.
Reagents
BIO-LA-TEST set for urea concentration determination,
TRIS-HCl buffer (c = 0.05 mol.l-1, pH 9.7),
MnCl2 (activator) in buffer pH 9.7 (c = 0.1 mol.l-1),
L-lysine in water (inhibitor) (w = 1%),
liver homogenate as a source of arginase (w = 5 %),
L-arginine in TRIS-HCl buffer (c = 0.05 mol.l-1, pH 9.7),
urea standard solution (c = 8.3 mmol.l-1),
diluted H2SO4 for working solution preparation (stock solution from the kit with H2SO4 in 1:1
ratio),
trichloroacetic acid (TCA) (w = 5%)
Accessories and equipment
water bath (37°C and 100°C),
centrifuge,
spectrophotometer
Comenius University, Bratislava, Faculty of Medicine
Institute of Medical Chemistry, Biochemistry and Clinical Biochemistry
35
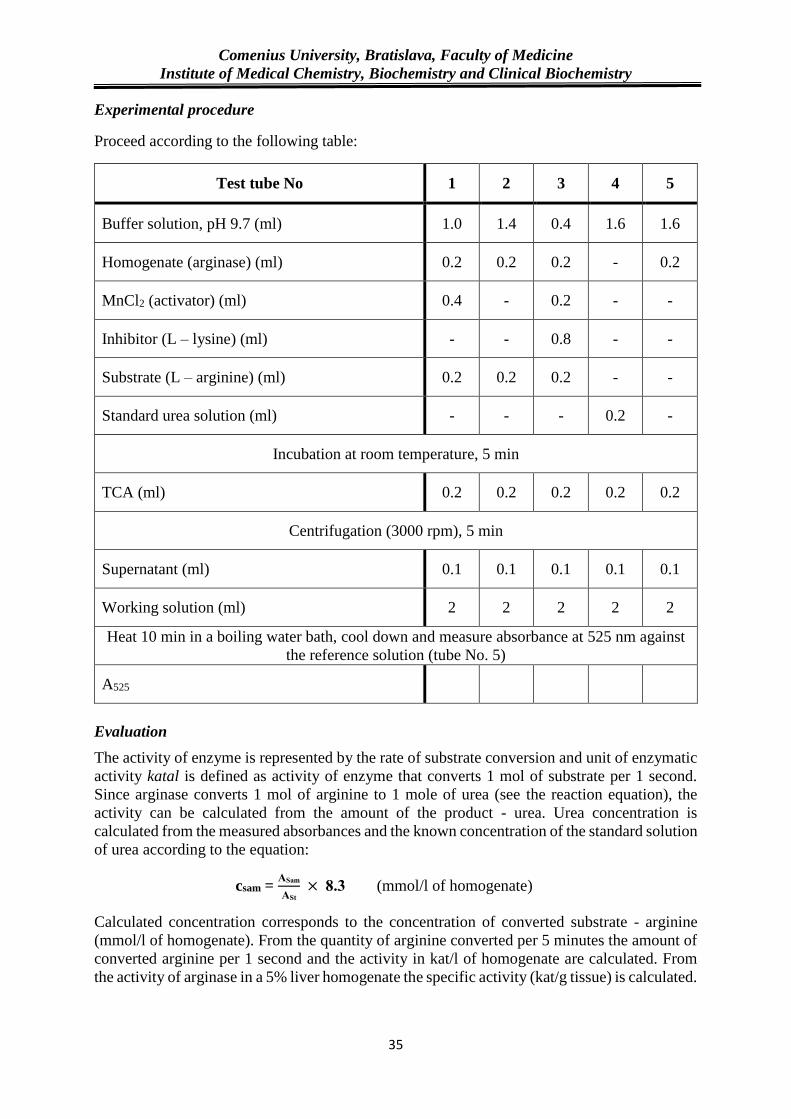
Experimental procedure
Proceed according to the following table:
Test tube No 1 2 3 4 5
Buffer solution, pH 9.7 (ml) 1.0 1.4 0.4 1.6 1.6
Homogenate (arginase) (ml) 0.2 0.2 0.2 - 0.2
MnCl2 (activator) (ml) 0.4 - 0.2 - -
Inhibitor (L – lysine) (ml) - - 0.8 - -
Substrate (L – arginine) (ml) 0.2 0.2 0.2 - -
Standard urea solution (ml) - - - 0.2 -
Incubation at room temperature, 5 min
TCA (ml) 0.2 0.2 0.2 0.2 0.2
Centrifugation (3000 rpm), 5 min
Supernatant (ml) 0.1 0.1 0.1 0.1 0.1
Working solution (ml) 2 2 2 2 2
Heat 10 min in a boiling water bath, cool down and measure absorbance at 525 nm against
the reference solution (tube No. 5)
A525
Evaluation
The activity of enzyme is represented by the rate of substrate conversion and unit of enzymatic
activity katal is defined as activity of enzyme that converts 1 mol of substrate per 1 second.
Since arginase converts 1 mol of arginine to 1 mole of urea (see the reaction equation), the
activity can be calculated from the amount of the product - urea. Urea concentration is
calculated from the measured absorbances and the known concentration of the standard solution
of urea according to the equation:
csam = ASam
ASt
× 8.3 (mmol/l of homogenate)
Calculated concentration corresponds to the concentration of converted substrate - arginine
(mmol/l of homogenate). From the quantity of arginine converted per 5 minutes the amount of
converted arginine per 1 second and the activity in kat/l of homogenate are calculated. From
the activity of arginase in a 5% liver homogenate the specific activity (kat/g tissue) is calculated.

Comenius University, Bratislava, Faculty of Medicine
Institute of Medical Chemistry, Biochemistry and Clinical Biochemistry
36
The effect of activators and inhibitors on arginase activity is evaluated by calculation of the
activity and inhibition of the enzyme. The value of the absorbance of the enzyme without
inhibitor and with activator (tube # 1) is considered as the 100% enzyme activity. The activity
is proportional to the amount of converted substrate. Inhibition (%) can be calculated directly
from the activity of enzyme as follows:
I (%) = 100 – activity (%)
Results of calculations are recorded in the table:
Conclusion
Explain the effect of used activator and inhibitor on activity of arginase.
Test tube No 1 2 3
Sample E + MnCl2 E - MnCl2 E + I
A525
Activity (%) 100
Inhibition (%) 0
c (mol/l of homogenate/10 min)
c (mol/l of homogenate/1s =
katal/l of homogenate=
katal/50g of tissue)
katal/g of tissue