determination of hexazinone residues and their …
TRANSCRIPT

DETERMINATION OF HEXAZINONE RESIDUES AND THEIR FATE
IN A NEW BRUNSWICK FOREST
by
J. FENG and C. FENG
INFORMATION REPORT FPM-X-8 1
FOREST PEST MANAGEMENT INSTITUTE
CANADIAN FORESTRY SERVICE
GOVERNMENT OF CANADA
P.O. BOX 490
SAULT STE. MARIE, ONTARIO
P6A 5M7
1908
^Minister of Supply and Services Canada, 1988
Catalogue No.: Fo46-16/8lE
ISSN: 0833^5540
ISBN: 0-662-16378-8
additional copies of this publication are
available free of charge from:
Information Services
Forest Pest Management Institute
Canaci ian Forestry Service
Agriculture Canada
P.O. Box 490
Sault Ste. Marie, Ontario
Canada, P6A 5M7
Cette publication est aussi disponible en
francais sous le titre Determination des
residus d'hexazinone et de son devenir dans
une foret du Nouveau-Brunswick.

Feng, J.; Feng, C. 1988. Determination of hexazinone residues and their fate in a New
Brunswick Forest. Can. For. Serv., For. Etest Manage. Inst., Sault Ste. Marie, Cht. Inf.
Rap. FEM-X-81, 15 p. + Appendices.
ABSTRACT
A clearcut site near St. Leonard, New Brunswick was treated with hexazinone, 3-
cyclohexy1-6-(dimethylaniino)-i-methyl-1,3#5-triazine-2,4{1H,3H)-dix3ne, at nominal rates, 3.1
and 3.8 kg ai/ha by a fixed wing aircraft equipped with a conventional boon and nozzles. Qn-
target deposit at soil plots was highly variable, averaging 2.53 kg/ha with 37% CV- Off-tar
get deposit monitored with 400 cm2 deposit plates decreased rapidly to 0.006 kg/ha at 70 and
100 m downwind. In spiked soil trials, recovery varied with concentration and residue, with
means ranging from 91.5 - 98.3%, 62.9 - 88.6% and 101.4 - 104.2% for hexazinone and its
metabolites A,
dione and B, 3-cyclohexyl-6-(methylaraino)-1-methyl-1,3,5-triazine-2,4( 1H,3H)-dione, respec
tively. Hexazinone recovery in fresh and air-dried samples of spiked humus soils was 114 and
110%, respectively. A consistency of 6.9% CV for hexazinone subsampling, extraction and
analysis was determined from 50 homogenized air-dried soils. log-log hexazinone residue dis
appearance relationships with time (up to 537 days after application) were found with corre
lation coefficients of the means ranging from r = 0.88 to 0.98, with 50% of the initial resi
dues calculated to remain after 8, 28 and 13 days for upper (0-15 cm}, lower (15-30 cm) and
their combined (0-30 cm) soil layers, respectively; and with 10% to remain after 49, 319 and
122 days, respectively. Hexazinone leaching to the lower soil layer was dependent on rain
fall, and peaked at 0.6 kg/ha (0.46 pg/g) after 6 days when cumulative rainfall reached 29
mm. Residue value reporting formats ug/g/ and kg/ha were compared. Soil residues monitored
at various distances off-target were correlated to off-target deposit rates as determined by
analyses of deposit collector residues. Lateral residue movement at stations 10 and 20 m
downslope (5%) was found from 6 to 61 days after application. Lateral residue movement to 50
m downslope was found in the first two weeks. to residues were found at 100 m downslope
throughout the 537-day monitoring period. Hexazinone residues were detected in strearnwater
throughout the 45-day period when runoff in 6 storm events was monitored. Residues decreased
both with time after application and with distance downstream. Ihe initial peak concentra
tion at 50 m downstream was 30.8 ppb during the first storm event 6 days after application,
and decreased rapidly to 3.7 ppb after 45 days; concentration at 800 m downstream was 5.1 ppb
duriny the second storm event 13 days after application and decreased to less than 1 ppb
between 20 and 45 days after application. No residues were found at 1500 m downstream
throughout the monitoring period.

RESUME
Un terrain de coupe rase pres de Saint-Leonard (Nouveau-Brunswick) a ete traite a
l'hexazinone (3-cyclohexyl-6-(diiaethylamino)-1-methyl-1, 3,5-triaz:me-2,4( 1H,3H)-dione) a des
taux nominaux, soit de 3,1 et de 3,8 kg/ha d' ingredients actifs, a l'aide d'un aeronef a
voilure fixe equipe d'une rampe de pulverisation ordinaire. Le depot sur les lots-cibles
etait fortement variable, etant en moyenne de 2,53 kg/ha avec un C.V. de 37 4. Les depots a
l'exterieur de la zone-cible, evalues a l'aide de plagues a depots de 400 cm2, ont diminue
rapidement a 0,006 kg/ha a 70 et 100 m en aval par rapport au vent. Inrs d'essais de sol
enrichi, le taux de recuperation variait selon la concentration et les residus, avec des
inoyennes comprises entre 91,5 et 98,3 %, 62,9 et 88,6 % et 101,4 et 104,2 % pour l'hexazinone
et ses metabolites, soit la 3-(4~hydroxycyclohexyl)-6-(dimethylamino)-1-methyl-1, 3,5-
triazine-2,4(iH,3H)-dicwe et la 3-cyclohexyl-6-(rrethylamino)-1-methyl-l,3,5-triazine-2,4(1H,
3H)-dione, respectivement. Le taux de recuperation d'hexazinone dans des echantillons frais
et seches a I1 air d1 humus enrichi etait de 114 et de 110 %, respactivement. A partir de 50
echantillons hcmogeneises seches a l'air, on a calcule un C.V. constant de 6,9 % pour la
preparation de sous-echantillons, 1'extraction et I1analyse de I1hexazinone. Les courbes
log-log de la disparition des residus d'hexazinone en fonction du temps (jusqu'a 537 jours
apres 1'application) correspondaient a des coefficients de correlation de inoyennes comprises
entre r = 0,88 et 0,98^50% des residus initiaux calcules persistant apres 8, 28 et 13 jours
dans le cas des couches superieures (0-15 cm), inferieures (15-30 cm) et ccmbinees (0-30 cm),
respectivement, et 10 % restant apres 49, 319 et 122 jours, respectivement. La lixiviation
de l'hexazinone vers les couches inferieures du sol dependait de la pluie et atteignait 0,6
kg/ha (0.6 yg/g) apres 6 jours, quand la valeur cumulative des precipitations de pluie
atteignait 29 mm. th a compare les types de mesures de valeurs des residus, soit en pg/g et
en kg/ha. Les residus de sol surveilles a diverses distances au-dela de la cible ont ete
correles avec les taux de depot a l'exterieur de la cible, mesures selon des analyses des
residus de depots. Le displacement lateral des residus a des stations a 10 et a 20 m suivant
une pente negative (5 %) a ete mesure entre 6 et 61 jours apres I1application. Le mouvement
lateral des residus a 50 m suivant une pente negative a ete mesure au cours des deux prem
ieres semaines. On n'a observe aucun residu a 100 m suivant une pente negative au cours de
toute la periode de surveillance de 537 jours. On a decele la presence de residus d'hexa
zinone dans les cours d'eau pendant toute la periode de 45 jours au cours de laquelle on a
surveille les eaux de ruissellement de 6 orages. Les residus diminuaient en fonction du
temps apres l'applicatin et de la distance en aval. La concentration de pointe initiale a 50
m en aval etait de 30,8 pp 109 au cours du praaier orage, 6 jours apres 1'application, et adiininue rapidement a 3,7 pp 10° apres 45 jours; la concentration a 800 m en aval etait de 5,1pp 109 au cours du deuxiane orage, 13 jours apres l'application, et a diiuinue a moins de 1 pp10" entre 20 et 45 jours apres 1'application. Aucun residu n'a ete observe a 1500 m en avalpendant toute la periode de surveillance.
INTRODUCTION
Hexazinone has had temporary registra
tion for forestry use in Canada since 1984.
Its use is currently restricted to ground
applications only for both site preparation
and conifer release (Reynolds et al. 1986).
Data on the behavior of hexazinone in the
Canadian forest environment are required be
fore it can be considered for full registra
tion for forestry use.
The validity of laboratory-generated
models in predicting herbicide movement and
fate in ecosystems requires verification
with systematic field evaluation (Naary et
al. 1983). Ihe persistence and mobility of
hexazinone in soils was found to be depen
dent on soil type and climate. Field soil
studies reported in the USA and elsewhere
indicated that hexazinone has a lialf-life of
between 1 and 6 months (Rhodes 1980; WSSA
1983)/ and the potential for off-site move
ment of at least 2 m down a 12-22 degree
slope (Barring and Ttorstensson 1983;
Harrington et al. 1982). Herbicide movement
in water from application with a pelleted
form of hexazinone (Velpar Gridball ) has
also been studied: in a stream cversprayed
by hexazinone pellets, water-borne hexa
zinone decreased to less than half of the
initial concentration within one hour of
application at a point adjacent to the
treated area {Miller and Bace 1980). When
storniflow and baseflow were monitored
through 26 storm events in a 13-month per
iod, 0.53% of the hexazinone applied was
calculated as lost through runoff (Neary et
al. 1933). And in another study, no resi
dues were found in groundwater or springflow
beyond 20 m from the treated area (Neary
1983). However, the behavior of hexazinone
in the Canadian forest environment, has not
been systematically evaluated.
"Ine specific objectives of this study
were to:
1) determine hexazinone deposit on the for
est floor ajid its persistence and leach-
ability in New Brunswick loam soils;
2) determine the off-site mobility of hexa
zinone in soil on a slope;
3) monitor the off-site movement of hexa
zinone in snownelt, baseflow and storm-
flow;
4) measure off-target deposit from aerial
application;
5) measure the occurrence and disappearance
of two primary metabolites A and B;
6) establish a new reporting method for
hexazinone residues in soil on an area
(kg/ha) basis to provide direct compari
son with the rate of application.
MATERIALS J1ND METHODS
Site Description
Two 3.7 ha plots clearcut in 1980-81,
were located on J.D. Irving property near
St. Leonard, in the northwest corner of New
Brunswick. Prior to herbicide treatment,
the few scattered residual snags (10-20 m
tall) were felled to allow accurate aerial
application. The dominant weed species was
raspberry [Rubus idaeus L. var strigosus
(Michx.) Maxim.]. Other brush siJecies in
cluded pin cherry (Prunus pensylvanica
L.f.), striped maple ('Acer pensylvanicum
L.), mountain maple (A. spicatum Lam.), red
maple (A. rubrum L.), and sugar maple (A.
saccharuin Marsh.) . Tne intended crop
species for planting was white spruce
[Picea glauca (ttoench) Voss]. Naturally
regenerated balsam fir (Abies balsamea (L.)
Mill] was also observed on the site.
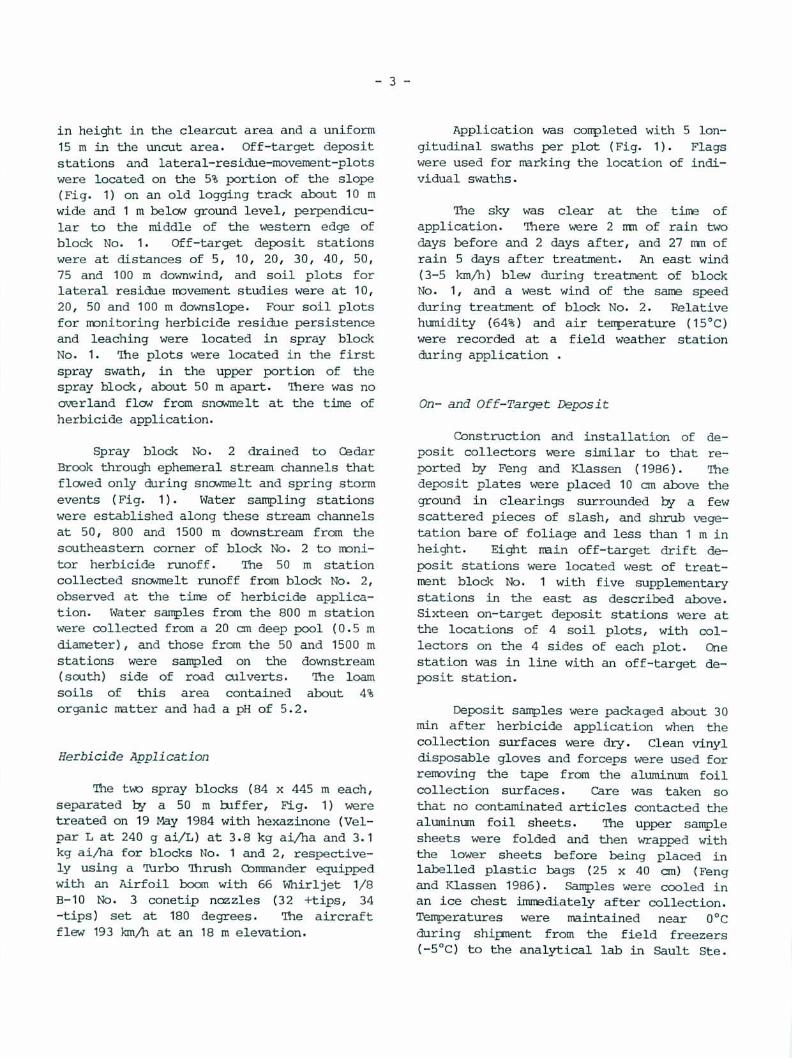
The experimental site was located
within two drainage systems and was gener
ally flat. It was subdivided into two
spray blocks (Fig. 1}. Spray Block tto. 1
drained to the west directly into Big Brook
River. The surface gradient was 5% for the
first 150 m west of Block No. 1 and before
the clearcut boundary, then 10-20% for the
remaining 350 m of uncut buffer to the
river. Vegetation averaged less than 0.5 m

- 2 -
A
a
A A A
Big Brook River
Mil
A
A
A
Block
No1
3.8 kg
1
ha
Block
No. 2
31 kg
t
ha
\
\
Swath direction of
hexazinone application
Soil sampling site
(lateral residue movement)
a Off-target deposit site
* Soil sampling site
(residue persistence)
0 Water sampling station
y
/ Ephemeral
Tributaries
of Cedar Brooks
ROAD
North Branch
Cedar Brook (permanent)
NOT DRAWN TO SCALE
Figure 1. Study site locations near St. Leonard, New Brunswick-
- 3 -
in height in the clearcut area and a uniform
15 tn in the uncut area. Off-target deposit
stations and lateral-residue-movement-plots
were located on the 5% portion of the slope
(Fig. 1) on an old logging track about 10 m
wide and 1 m below ground level, perpendicu
lar to the middle of the western edge of
block No. 1. Off-target deposit stations
were at distances of 5, 10, 20, 30, 40, 50,
75 and 1D0 m downwind, and soil plots for
lateral residue movement studies were at 10,
20, 50 and 100 m downslope. Four soil plots
for monitoring herbicide residue persistence
and leaching were located in spray block
No. 1. The plots were located in the first
spray swath, in the upper portion of the
spray block, about 50 m apart. There was no
overland flow from snowmelt at the time of
herbicide application.
Spray block No. 2 drained to Cedar
Brook through ephemeral stream channels that
flowed only during snowmelt and spring storm
events (Fig. 1). Water sampling stations
were established along these stream channels
at 50, 800 and 1500 m downstream from the
southeastern corner of block No. 2 to moni
tor herbicide runoff. The 50 m station
collected snowmelt runoff from block No. 2,
observed at the time of herbicide applica
tion. Water samples from the 800 m station
were collected from a 20 cm deep pool (0.5 m
diameter), and those from the 50 and 1500 m
stations were sampled on the downstream
(south) side of road culverts. Ihe loam
soils of this area contained about 4%
organic matter and had a pH of 5.2.
Herbicide Application
The twD spray blocks (84 x 445 m each,
separated by a 50 m buffer. Fig. 1} were
treated on 19 May 1984 with hexazinone (Vel-
par L at 240 g ai/L) at 3.8 kg ai/ha and 3.1
kg ai/ha for blocks No. 1 and 2, respective
ly using a Turbo Thrush Commander equipped
with an Airfoil boom with 66 Whirljet 1/8
B-10 fto. 3 conetip nozzles (32 +tips, 34
-tips) set at 180 degrees. The aircraft
flew 193 km/h at an 18 m elevation.
Application was completed with 5 lon
gitudinal swaths per plot (Fig. 1). Flags
were used for marking the location of indi
vidual swaths.
The sky was clear at the time of
application. There were 2 rrm of rain two
days before and 2 days after, and 27 mm of
rain 5 days after treatment. An east wind
(3-5 km/h) blew during treatment of block
No. 1, and a west wind of the same speed
during treatment of block No. 2. Relative
humidity (64%) and air temperature (15°C)
were recorded at a field weather station
during application .
On- and Off-Target Deposit
Construction and installation of de
posit collectors were similar to that re
ported by Feng and Klassen (1986). The
deposit plates were placed 10 cm above the
ground in clearings surrounded by a few
scattered pieces of slash, and shrub vege
tation bare of foliage and less than 1 m in
height. Eight main off-target drift de
posit stations were located west of treat
ment block No. 1 with five supplementary
stations in the east as described above.
Sixteen on-target deposit stations were at
the locations of 4 soil plots, with col
lectors on the 4 sides of each plot. One
station was in line with an off-target de
posit station.
Deposit samples were packaged about 30
min after herbicide application when the
collection surfaces were dry. Clean vinyl
disposable gloves and forceps were used for
removing the tape from the aluminum foil
collection surfaces. Care was taken so
that no contaminated articles contacted the
aluminum foil sheets. The upper sample
sheets were folded and then wrapped with
the lower sheets before being placed in
labelled plastic bags (25 x 40 cm) (Feng
and Klassen 1986). Samples were cooled in
an ice chest immediately after collection.
Temperatures were maintained near 0°C
during shipment from the field freezers
{-5°C) to the analytical lab in Sault Ste.

- 4 -
Marie, Ontario using insulated commercial
coolers and a covering of frozen cooler
packs.
Soil Sampling
Preparations for soil sampling included
removal of slash and large debris from the
soil plots. Vegetation was trimmed down to
about 1 cm above the ground inside and to
0■5 m outside each plot to allow full herbi
cide deposition on the ground to generate a
worst case scenario. Disturbance to the
forest floor was kept to a minimum.
Cue soil core was collected at each of
the 4 residue persistence plots (16 m2) andthe 4 lateral residue movement sites 1 day
before and 1 hour, 3, 6, 13 days, 1, 2, 3,
4, 5, 6, 12, 18 months after treatment.
Soil cores were taken with a Campbell soil
auyer (9.2 cm diameter) (Feng and Klassen
1986), and divided into subsamples, separ
ating soils 0-15 cm from soils 15-30 below
the surface. Samples were immediately
cooled and kept in ice-filled coolers
(Coleman) after collection and frozen (-5°C)
within 8 hours. The temperature of the
samples was maintained at about 0°C in com
mercial coolers during shipping to the
analytical laboratory. The samples were
maintained at -14°C at the analytical labor
atory prior to analysis.
Water Sampling
Runoff water samples were collected at
the three stations described above one day
before treatment and with collection times
selected to correspond with the major rain
events immediately following treatment. Six
storm events were monitored for hexazinone
runoff during a 45-day period between May 25
and July 3, 1984. Water samples were col
lected at 3, 7 and 14 days after each storm
event and before the start of the next storm
event. Samples were taken by collecting
approximately 900 mL in 1 L polypropylene
bottles prewashed with metnanol. Samples
were cooled imnediately in an ice-filled
cooler and frozen {-5°C) within 2 hours of
collection. Shipping to, and storage at,
the analytical laboratory was similar to
that for the soil and deposit samples.
Sample Preparation
Deposit Samples: Hexazinone residues on
the deposit collectors were extracted from
tlie aluminun foil with a procedure modified
from methods of Feng and Klassen (1986) and
Holt (1981). The aluninun foil was ini
tially rinsed with 150 mL of extracting
solution (acetone/water; 80:20; V/V) then
cut into strips, sonicated (3 min) and
shaken (3 min) on a reciprocating shaker
with 3 x 150 mL extracting solution in a
Teflon bottle. The rinse and washings were
pooled and flash-evaporated in a rotary
evaporator under reduced pressure at 60°C
until only the aqueous phase (100 mL) re
mained. Residues were extracted by parti
tioning with 3 x 100 mL ethyl acetate, and
passed through a 30 g anhydrous sodium sul-
fate column, which was pre-washed with
ethyl acetate. The extracts were either
concentrated using a vacuum rotary evapora
tor and an N-Evap (Organcmation model III)
or diluted with ethyl acetate to 10-2500 mL
before gas chromatographic (GC) analysis.
Soil Samples: Soil core sections were pre
pared for extraction by weighing, air-
drying (to 5% moisture content), homogen
izing and sieving (2 ran mesh) the soils, as
described by Feng and Klassen (1986).
Total weights of fresh samples, air-dried
samples and pebbles ( 2 inn diameter, which
were contained in the samples and discarded
later), were measured. Sample air dry
weights were used to compute data from pg/g
to area (kg/ha) and volunetric (mg/L) bases
(Feng and Klassen 1986). The processed
soils were also used to determine soil tex
ture and chemical properties-
Hexazinone residues were extracted and
purified based on Holt's (1981) method.
Halt's method was modified to prevent fine
clay particles from entering the filtrate
before cleanup by liquid/liquid partition.
- 5 -
and formation of precipitates in the final
concentrates during cold storage. The
method was also siiiplified by avoiding chro-
matograhic column cleanups and derivatiza-
tion by trifluoroacetic anhydride, which
created unstable (8h) final products and a
wide range of percent recovery (64-124% in
soils). The modified method is briefly sum
marized as follows. An aliquot of 25 g pro
cessed air-dried soil was weighed in a 250
mL Nalgene bottle (Nalge 2107), wetted with
15 mL of distilled water, capped tightly and
shaken horizontally for 15 minutes on an
Eberbach reciprocating shaker at 280 excur
sions per minute. Sixty mL of acetone were
then added. After being shaken for another
15 min, the sample was centrifuged at 350 x
g (1150 rpm, rotor radius 23.8 an) for 10
min. The extracts were filtered through a
Hillipore Filter Apparatus (47 mm) with
Mitex disc filters (5 jj m, Millipore LSWP
04700) under reduced pressure. Soils were
extracted twice more, each with 75 mL of an
acetone-water solution (80:20; v/v), 2 min
of agitation and 10 min of centrifugation
similar to that described above. The ex
tracts were filtered through the same appar
atus described above, combined with the
first extract, and the acetone was flash-
evaporated in a vacuum rotary evaporator at
60°C. The remaining aqueous solution was
washed and extracted with 3 x 50 mL of n-
hexane (discarded) and 3 x 75 mL of chloro
form, respectively. Chloroform extracts
were combined, passed through anhydrous
sodium sulfate, and flash-evaporated to dry-
ness- The residues were re-dissolved in 50
mL of acetonitrile and washed twice each
with 50 mL of n-hexane. The acetonitrile
phase was flash-evaporated to dryness- The
residues were finally dissolved in 2-10 mL
of ethyl acetate and filtered with Millex SR
(0.5 /im) filter units (Millipore SLSR 025NB)
before GC analysis. After preliminary anal
ysis, if a concentrated sample extract con
tained more than twice the concentration of
that in the mix-standard solution {see Gas
ChrortHtography), the sample extract was
diluted to near the concentration of the
mix-standards and was reanalyzed {Feng
1987).
Water Samples: Water samples (500 mL) were
extracted by serial liquid-liquid parti
tioning with ethyl acetate (3 x 200 mL).
The amount of ethyl acetate used in parti
tioning was proportionally increased when
larger volumes of water sample were to be
extracted. Ihe extracts were pooled and
concentrated by using a vacuum rotary
evaporator and an N-Evap to 2-10 mL before
GC analysis.
Gas Cttroti&tography
Purified sample concentrates in ethyl
acetate were analyzed alternately with
mix-standard solutions containing 2.5, 5.0
and 10.0 ppn of hexazinone and metabolites
B and h, respectively, on a Varian VISTA
6000 GC equipped with a thermoionic speci
fic detector (TSD) and a VISTA data system
(DS402). The specific gas chromatographic
conditions were as follows:
chromatographic column: 60 cm glass, 2 mm
i.d., packed with 10% SP2250DA on 100/120
Supelcoport, and with Acid-treated glass-
wool plugs;
temperatures: Injector - 260°C Detector -
300°C;
Column Temperature Program - 240 °C (2.5
min) - 10°C/min - 280°C (3.5 min);
gas flow rates: N2 (Linde, UHP grade) - 33
mL/min; H2 (Linde, prepurified) - 4.5 mL/
min; air (Linde, zero gas grade) - 175 mL/
min.
Retention times under these GC conditions
were 2.6, 3.5 and 5.5 minutes for hexa
zinone and its metabolites B and A, respec
tively . Peak heights were used for the
calculation of residue concentration. When
a sample injected showed more than 5 ppn of
hexazinone, the sample was diluted to near
2.5 ppm with ethyl acetate, and re-analyzed
(Feng 1987). The average of two corres
ponding peak heights (i.e., hexazinone) was
obtained from a mix-standard solution anal
yzed immediately before and after sample

- 6 -
analysis. A 10% range about the average of
pre- and post-standard values was used as
the rejection threshold (Feng 1987).
RESULTS AND DISCUSSION
On-Taiget Deposition
Hexazinone deposit averaged 2.53 kg
ai/ha at 16 stations monitored in the target
area, equating to 66.3% of the planned
application rate with a high variation of
deposit values (37% CV or coefficient of
variation) (Table 1). Variation was also
high at collection stations clustered around
soil plots, with averages (n=4) of 2.94
(40%CV), 2.21 (42% CV), 1.99 (45% CV) and
2.98 kg/ha (18% CV) for soil plots 1, 2, 3
and 4, respectively [Table 1). Hexazinone's
metabolites A and B were not detected in any
of the 16 samples, indicating that appropri
ate sample handling and storage techniques
were followed.
Table 1. Hexazinone deposited at treated
soil plots as indicated by plate
deposit collectors {400 cm2)
Hexazinone (kg/ha)
Repli- Plot Plot Plot Plot
cation 12 3 4 Total
1
2
3
4
Mean
CV
2.78
4.65
.24
,11
2,
2.
2.94
40%
3.47
1.52
1.52
2.34
2.21
42%
1.47
1.72
1.44
3.33
1.99
45%
2.54
2.55
3.61
3.23
2.98 2.53
18% 37%
Off-Target Deposit
Wind direction at the time of applica
tion was from the east, conducive for moni
toring off-target deposit on the western
side of the spray block. Hexazinone deposi
tion 10 m within the treated zone was 2.43
kg ai/ha, or 63.6% of the planned applica
tion rate. This deposition value was 4%
lower than the average deposition from the
same spray swath at the soil plots (2,53
kg/ha) about 80 m. north. Off-target de
posit decreased rapidly with distance, from
2.43 to 0.006 kg/ha at 10 m within and 100
m downwind of the treated zone, respective
ly (Table 2). Linear regression analysis
indicated a log-log relationship for de
posit and distance downwind, log Y = 2.47 -
2.33 (log X) for Y = hexazinone deposited
(kg/ha) and X = distance downwind (m).
Data values fit very closely to the linear
regression, with a significant correlation
coefficient (r) of -0.97. The coefficient
of determination (r2) indicated the regres
sion equation accounted for 94% of the var
iation in data values. Extinction rates
calculated from the regression equation in
dicated that 50, 10, 1 and 0.5% of full
hexazinone deposition (2.43 kg/ha) would be
expected at 10.6, 21.1, 56.7 and 76.2 m
downwind, respectively, under the specific
conditions of this study.
Table 2. Hexazinone deposit at downwind
distances by aerial application
with conventional boom and
nozzles
Hexazinone Residues
Downwinda
Distance
(m)
Per Plate
(yg)b
Calculated
(kg/ha)
-10
10
20
30
40
50
75
100
9720
3410
1236
725
266
203
24.
25.3
2.43
0.85
0.31
0.18
0.067
0.050
0.006
0.006
a Wind speed (3-5 km/h); relative humidity
(64%); air temperature (15°C).
b Detection limit was 0.25 jj g per plate.

- 7 -
Recovery of Hexazinone in Soils
In spiked soil trials, recovery varied
with concentration and with residue anal
yzed. Percent recoveries of hexazinone and
its metabolites A and B from soil spiked at
1, 4 and 2 ug/g were 98.3% (8.6% CV), 88.6%
(15.4% CV) and 104.2% (8.7% C7), respective
ly. When the soil was spiked with lower
hexazinone concentrations at 0.1, 0.4 and
0.2 pg/g, recoveries were 91.5% (7.8% CV),
62.9% (11.8% CV) and 101.4%, (13.0% CV),
respectively. Subsequent soil residue
values were adjusted for recovery by the
appropriate recovery values.
Hexazinone Recovery Through Air Drying
Recovery of hexazinone from soil sam
ples spiked prior to air drying was measured
to determine whether degradation occurred
during drying. Dao et al. (1982) found that
air drying field samples did not modify soil
properties nor the adsorption capacity of
soils. When frozen samples were air dried
in this study, the rapid loss of 70% of the
total moisture content in the first day min
imized the possibility of microbial degrada
tion of hexazinone in the samples- Further
drying yielded an average 3.8% moisture con
tent from an initial average 31.3% found in
fresh field samples.
Recovery of hexazinone through air-
drying soil was measured in 500 g humus
with a 56% moisture content. The humus was
thoroughly blended before and after appli
cation of hexazinone by the Ontario
Ministry of Natural Resources l^b in Maple,
Ontario, at 0.5 kg ai/ha to a 5 cm layer.
Samples were in transit for 2 days (0°C) as
described by Feng and Klassen (1986), and
held in cold storage (-14°C) for one month
before being analyzed. One half of the
sample (2 5 0 u g) was air-dried for 3 days,
then homogenized as described by Feng and
Klassen (1986). Four aliquots each of wet
(25Mg) and dried (15(Jg) soil samples were
analyzed for hexazinone recovery. Bulk
densities were measured for both wet and
dried samples to enable values to be re
ported in different formats. Bulk density
data permitted the conversion from tradi
tional residue reporting on a weight basis
(Wg/g) to either a volumetric (yg/mL) or an
area (kg/ha) basis. The latter reporting
format allowed direct comparison between
samples of different porosity or composi
tion. Air drying trial recovery results
were reported in all three bases (pg/g;
Mg/mL; kg/ha) to illustrate the benefits of
the new reporting format. Results (Table
3) indicated that the air-drying procedure
described by Eeng and Klassen (1986) pro
vided a residue value consistency (4% CV)
superior to direct analysis of wet soils
{33% CV). Results also indicated that
there was no loss of hexazinone through
air-drying (110% recovery) compared to the
wet samples (114% recovery) (Table 3).
Table 3. Hexazinone recovery in fresh and air-dried samples from spiked (0.5 kg/ha) humus
soils
Hexazinone Residues
Replication
Format
1
2
3
4
Mean
CV
Recovery
1
1
1
1
1
wg/g
.03
.11
.06
.90
-2B
33%
Wet
U
0
0
0
1
1
Soil
g/mL
.93
.99
,95
.70
.14
33%
kg/ha
0.46
0.50
0.47
0.85
0.57
33%
114%
2
2
2
2
2
Air-Dried
g/g
.54
.58
.45
.38
.49
4%
fig/mL
1.11
1.13
1.07
1.05
1.09
4%
Soil
kg/ha
0.56
0.57
0.54
0.52
0.55
4%
110%

- 8 -
The overall consistency of procedures
used for subsampling, residue extraction,
cleanup, and analysis by gas chromatography
was examined. Fifty replicated subsamples
from a honogenized air-dried mineral soil
were individually processed and analyzed.
Results indicated high reproducibility, with
a mean hexazinone residue concentration of
0.84% ug/g, 6.9% CV and a range of 0.66 -
0.95 pg/g. The modifications made to Holt's
(1981) procedures for extraction and analy
sis improved both simplicity and reprodu
cibility.
Hexazinone Residue Persistence and Leaching
in Soils
Hexazinone residues measured in soils
at 0-time (1.99 kg/ha) were 79% of that in
dicated by on-target deposition collector
plates (2.53 kg/ha) and 52% of the planned
application rate. The unexpectedly low
residue values in the soil were probably
from residue loss during handling or ship
ping. Recovery trials described above indi
cated that thoroughly blended fresh hums
soils at 56% moisture content could be
handled and stored with no residue loss.
However, the concentrated nature of residues
in a thin surface layer containing all or
most of the residue applied my be the cause
of the apparent residue loss when the sample
cones into contact with the inner wall of
the sample bags. The vulnerability of these
high residue concentrations in the surface
layer would probably persist until rainfall
initiated leaching into lower layers. in
this study, rainfall occurred prior to the
soil collection on day 6, but samples from
day 3 (2 mm cumulative rainfall) may have
incurred similar losses as those from
0-time. To avoid potential residue losses
through contact with sample bags in future
0-time samples, the following procedure is
recommended:
1) Half-fill a set of glass jars (5 cm deep
and 10 cm diameter) with pre-spray soils
obtained from the field.
2) Submerge the jars to the ground level
and expose them to herbicide application
at the soil plots.
3) Re-fill the jars to the top with pre-
spray soils and seal the jar with a
glass cover.
4) Weigh the whole sample and calculate the
bulk density to enable the residues
analyzed in ii g/g to be converted to
kg/ha to directly compare with the depo
sition or application rates.
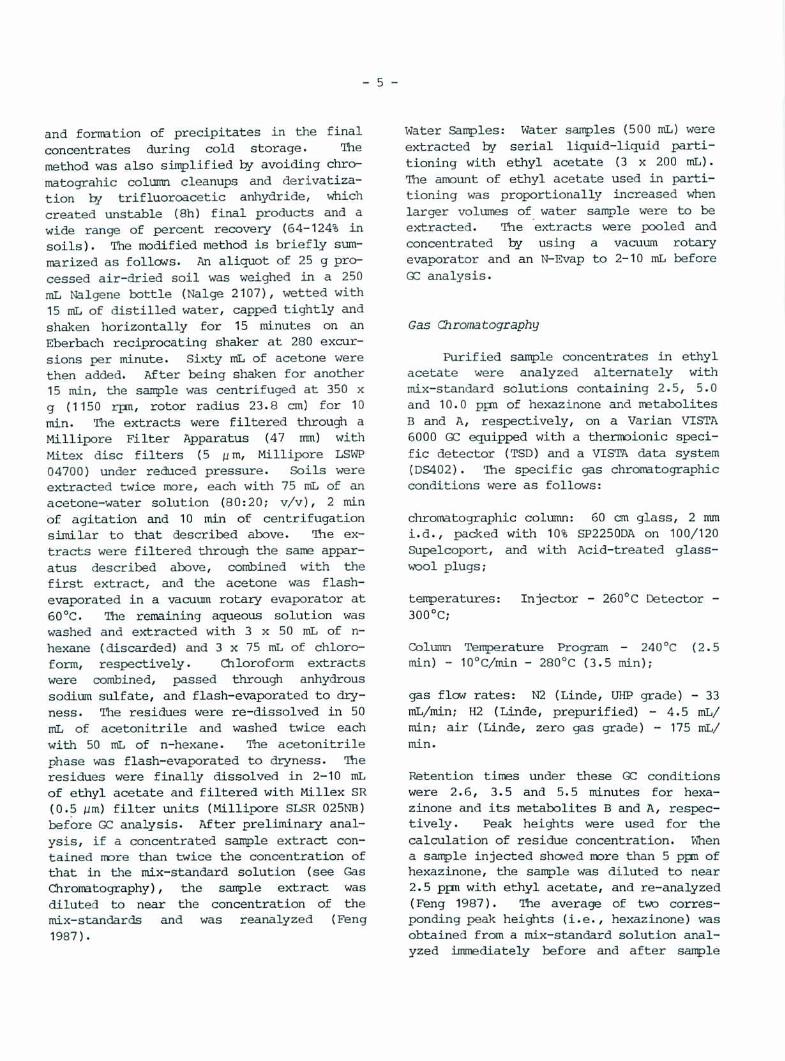
Average hexazinone residues in the
combined upper and lower layers {0-30 cm)
increased from 1.87 kg/ha, 3 days after
application, to a peak of 2.04 kg/ha, 6
days after application, when rainfall had
accumulated from 2 to 29 mm. residues then
disappeared rapidly to averages of 0.94,
1.05, 0.27, 0.27, 0.22, 0.11 and 0.09 kg/ha
at 13, 31, 61, 87, 122, 157 and 361 days
after application, respectively, with cumu
lative rainfall at 113, 172, 344, 419, 465,
539 mm and snow (Fig. 2). No residues were
detected 453 and 537 days after applica
tion. Metabolite A was found at low
levels, less than 0.26 kg/ha, in 5 out of
48 soil cores between 3 and 31 days after
application. Metabolite B, the only major
metabolite that shows phytotoxicity (Sung
1985), was found at less than 0.15 kg/ha in
10 out of 48 soil cores between 6 and 122
days after application.
The rate of hexazinone dissipation is
estimated by a linear regression of two
variables, the hexazinone residues (kg/ha)
(Wa) and days after application (D), and
expressed as: log Ha = a + b log D (Table
4). Data collected between 3 and 361 days
after application were used to obtain the
intercept (a = 0.78) and the slope (b =
-0.711) (Table 4). Results of the F-test
for the linear regression were significant
(P = 0.01). The coefficient of linear re
gression determination (r2) indicated thatthe regression equation accounted for 91%
of the variation in the data. The signifi-

_ g _
2.00
6 13 31 61 81 122 157 361
Days after application
Figure 2. Dissipation of hexazinone at different depths in New Brunswick loam soils treated
on 19 May 1984; •, total soil core (0-30 cm); a, upper layer (0-15 cm); m, lower
layer (15-30 cm); and their "best fit" regression lines: (0-30cm), (0-15
cm), (15-30 cm).

- 10 -
Table 4. Equations illustrating temporal dissipation of hexazinone in Mew Brunswick loam
soils at different depths
Soil Layer
Soil Depth
[cm) Linear Regression Equation3
Correlation
Coefficient N
Total
Upper
Lower
Upper
Lower
0-30 log Wa = 0.781 - 0.711 log D
0-15 log Wa = 0.803 - 0.891 log D
15-30 log Wa = 0.288 - 0.605 log D
0-15 log Ww = 0.743 - 0.887 log D
15-30 log Ww = 0.130 - 0.563 log D
0.953
0.980
0.879
0.975
0.876
9
9
9
9
9
Wa = Hexazinone residues on area basis (kg/ha); D = days after application; Ww = Hexazinone
residues on weight basis (jjg/g)-
cant correlation coefficient (r) indicated
that data values fitted very closely to re
gression line {r = 0.953). Dissipation
times (DT) required for 50% (DT50) and 90%
(DTgo) disappearance of hexazinone were es
timated from the linear regression and were
13 and 122 days, respectively.
Dissipation of hexazinone in the upper
soil layer (0-15 cm) was faster than in the
combined total soil core (0-30 cm). Hexa
zinone residues were 1.87, 1.44, 0.67, 0.52,
0.14, 0.10, 0.99, 0.05 and 0.04 kg/ha after
3, 13, 31, 61, 87, 122, 157 and 361 days,
respectively (Fig. 2). No residues were
found 453 and 537 days after application.
The DT5Q and DTgg values in this soil layer
were 8 and 49 days, respectively. The
shorter DT values indicated leaching of
hexazinone into the lower soil layer (15-30
cm), which was first observed 6 days after
application at 0.60 kg/ha (peak value) when
rainfall had accumulated to 29 mm. Dissipa
tion rate in this soil layer was much slower
(DT50 = 28 days; DTgo = 319 <3ays> ^^ in
the. upper layer and in the combined total
soil core. The measured hexazinone residues
were 0.60, 0.27, 0.53, 0.13, 0.17, 0.13,
0.06 and .05 kg/ha after 6, 13, 31, 61, 87,
122, 157 and 361 days (Fig. 2). No residues
were found 453 and 537 days after applica
tion . Significant linear regressions and
correlation coefficients (P = 0.01) for both
upper and lower soil layers are reported in
Table 4.
Results of this study did not preclude
the possibility of hexazinone being leached
into soils deeper than 30 cm. However,
actual data suggested that in New Brunswick
loam soil, hexazinone did not persist after
1 year or one growing season.
Hexazinone concentration measured on
weight basis (jjg/g) (Table 5) showed simi
lar regression and correlation (Table 4) as
that on area basis (kg/ha). The similarity
of soil chemical properties and textures
among soil plots and between the upper and
lower layers (Table 6) masked the improve
ment in r and r2 values for residue dis
appearance relationships generally offered
by the kg/ha format. Only about 15% of the
soil cores from the upper 15 cm layer con
tained an organic layer separable from
mineral horizons. Bulk densities of soil
samples containing organic layers may be
highly variable. Differences in format re
sults , with kg/ha showing greater consis
tency and therefore higher r and r2 values,
would be more pronounced if a variable
organic layer is prevalent. High spatial
variability of residues in field soils
found in other studies may be from both
extrinsic and intrinsic sources (Tiao and
Wagenet 1985).

Table 5.
- 11 -
Averaged concentration of hexazinone residues (N = 4) on weight basis (fjg/g) in New
Brunswick loam soils
Days After*1
Application
0
3
6
13
31
61
37
122
157
361
453
537
Upper Soil Layer
(0-15 cm)
1.65 + 0.40
1.46 + 0.59
1.30 + 0.21
0.58 + 0.06
0.52 + 0.36
0.12 + 0.09
0.11 + 0.09
0.07 + 0.04
0.05 + 0.10
0.03 + 0.04
0.03
0.03
Dower Soil Layer
(15-30 cm)
0.03b0.03
0.46 + 0.31
0.23 + 0.17
0.44 + 0.32
0.09 + 0.10
0.12 + 0.09
0.10 + 0.06
0.06 + 0.04
0.05 + 0.05
0.03
0.03
Cumulative
Rainfall (itm)
0
2
29
113
172
344
419
465
539
Snow
0-time on 19 May 1984
limit of Detection = 0.03 jjg/g
Table 6. Chemical properties and te>cture of New Brunswick loam soils
Layer
%N
%P
%K
PH
CEC (meq/IOOg)
%OM
%Sand
%Silt
%Clay
Number of replicates
Upper
(0 - 15
Mean
0.126
0.0012
0.0093
5.13
16.558
3.194
47.4
33.0
19.6
A
cm)
SD
0.023
0.0003
0.0040
2.533
0.794
1.8
2.0
2.1
Lower
(15 - 30
Mean
0.142
0.0022
0.0059
5.06
17.001
4.228
48.2
32.2
19.6
4
cm)
SD
0.080
0.0012
0.0032
6.639
2.724
2.6
3.9
2.2
Total
(0 - 31
Mean
0.135
0.0018
0.0074
5.09
16.811
3.785
47.9
32.5
19.6
8
cm)
0.
0.
0.
4.
2.
2.
3.
2.
SD
059
0010
0037
923
056
2
0
0
The moisture content of soils varied
little during the 537 day sartple schedule.
The mean iroisture content of the upper layer
(27.2% ± 5.9) was very comparable to that of
the lower layer (27.9% ± 5.2}. h minor peak
in moisture content in the upper layer was
found on the 6th day after application after
the first rainfall. Lower layer samples
from the 6th day also contained the highest
residue concentrations (0.6 kg/ha), indica
ting residue leaching during the first
rainfall. Station No. 2 showed the great
est leaching from the upper layer (1.06
kg/ha) to the lower layer (1.16 kg/ha) on
the 6th day and also had the highest mois
ture content (41.7%) and no separable
organic layer. These results related hexa
zinone residue leaching directly to the
initial rainfall and to soil porosity,
which restricts or inhibits the flow of
soil water.

- 12 -
Lateral residue Movement Bownslope
The O-tirae residue concentrations in
soil samples collected at distances off-
target down a 5% slope reflected the rate of
off-target drift fran the aerial applica
tion- The extinction rates were similar but
values were lower in soil samples (0.47,
0-13 and 0.03 kg/ha) than from deposition
collectors (0.85, 0.31 and 0.050 kg/ha at
10, 20 and 50 m downwind, respectively)
(Table 2, 7). The lower soil residue values
may be from residue loss through the sample
bags. A significant (p < 0.05) log-log ex
tinction rate relationship (log Y = 1,36
-1.70 log X) was found for 0-time where Y =
residue in soils (kg/ha) and X = distance
(m) downwind, with r = 0.999 and r2 = 0.998.
Increased residue concentrations at
off-target sites after the initial rainfall
indicated some lateral hexazinone movement.
The stations at 10 and 20 m down a 5% slope
showed lateral hexazinone movement from 6 to
61 days after application (Table 7).
Lateral hexazinone movement at 50 m down-
slope was found in trace amounts near the
detection limit in the first two weeks. to
residues ware detected in soil samples from
100 m downslope at any time in the sample
schedule. Cownslope hexazinone residue
movement was also observed in other studies
(Harrington et al. 1982; Barring and
Torstensson 19B3). Vertical hexazinone
leaching from the upper to lower soil layers
also occurred in the off-target stations
(Table 7). This vertical leaching suggests
that soil samples collected only from sur
face layers may be insufficient to appro
priately quantify residue runoff down a
slope. Hexazinone metabolites h and B were
not detected in any of the off-target sam
ples. The limits of detection were 0.03,
0.10 and 0.06 yg/g for hexazinone, metabo
lite A and B, respectively.
Off-Site Residue Atonement in Stormflow and
Baseflow (Snowmelt)
Six storm events were monitored for
hexazinone residue in streamwater between
25 May and 3 July 1984. Hexazinone resi
dues were found throughout the 45 day per
iod and during each storm event (Table 8).
Hssidues decreased to about 10% in samples
collected at the station 50 m downstream
fran 30.8 ppb in the first storm event to
3.7 ppb in the 6th storm event. These
findings were in agreement with those re
ported by Neary et al. (1983; 1985), that
residues in runoff peaked in the first
storm after application. No metabolite h
or B residues were detected in any of the
water samples in this study. A lag time
was indicated by the absence of detectable
hexazinone (i.e., < 0-5 ppb) in samples col
lected 800 m downstream during the first
storm event and first day of the second
storm event (Table 8). The magnitude of
the second storm event (the largest with 84
mm rainfall) was probably required to gen
erate sufficient flow to transport residues
longer distances in the otherwise slowly
flowing ephemeral stream. The flow in all
six storm events was insufficient to trans
port hexazinone residue in detectable quan
tities to the station 1500 m downstream
(Table 8). The The duration of lateral
residue movement in soils discussed above
[6-61 days) roughly coincides with the per
iod that samples were collected (and resi
dues detected) in storm runoff.
The accuracy of analysis of hexazinone
in vater samples was demonstrated with the
results of a spike-recovery trial. The re
covery of 5 and 50 ppb hexazinone in vater
(S = 4) was 100.4 ± 7.6% and 99.2 ± 8.4%,
respectively.
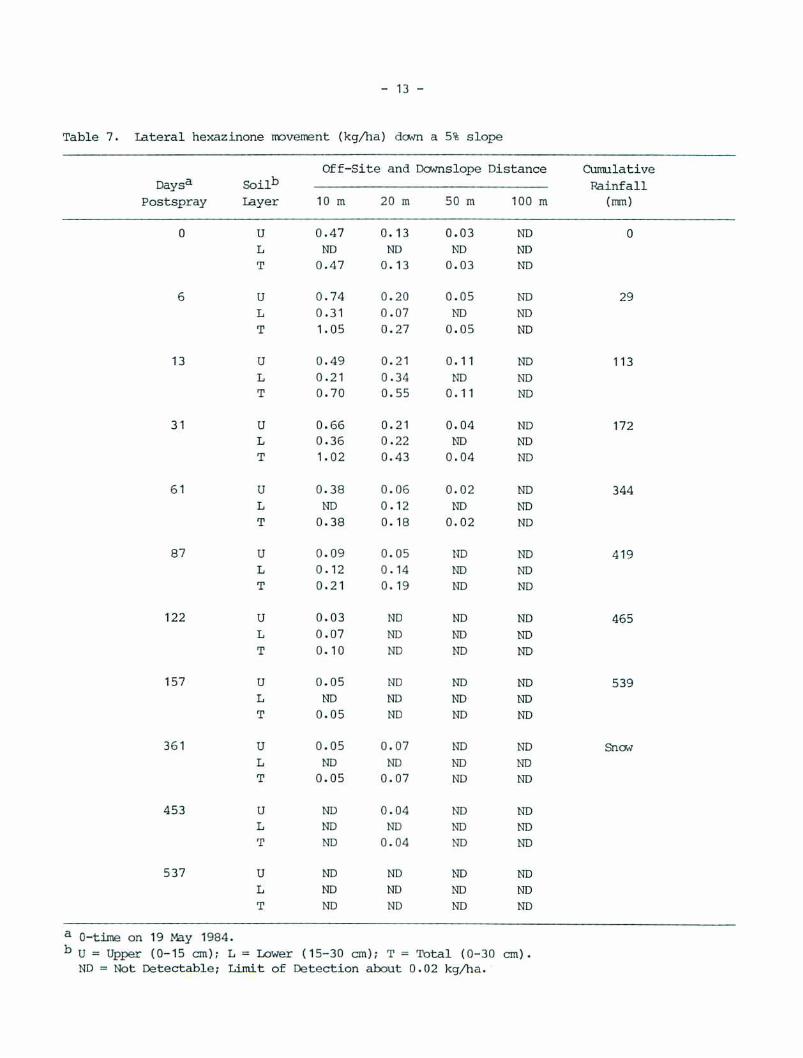
- 13 -
Table 7. lateral hexazinone movement (kg/ha) down a 5% slope
Daysa
Postspray
0
6
13
31
61
87
122
157
361
453
537
SoilbLayer
U
L
T
0
L
T
U
L
T
U
L
T
0
L
T
U
L
T
U
L
T
0
L
T
U
L
T
U
L
T
U
L
T
Off-Site
10 m
0.47
ND
0.47
0.74
0.31
1.05
0.49
0.21
0.70
0.66
0.36
1.02
0.38
ND
0.38
0.09
0.12
0.21
0.03
0,07
0.10
0.05
ND
0.05
0.05
ND
0.05
ND
ND
ND
ND
ND
ND
and
20 m
0.13
ND
0.13
0.20
0.07
0.27
0.21
0.34
0.55
0.21
0.22
0.43
0.06
0.12
0.18
0.05
0.14
0.19
ND
ND
ND
ND
ND
ND
0.07
ND
0.07
0.04
ND
0.04
ND
ND
ND
Downslope
50 m
0.03
ND
0.03
0.05
ND
0.05
0.11
ND
0.11
0.04
ND
0.04
0.02
ND
0.02
ND
ND
ND
ND
ND
ND
ND
ND
ND
ND
ND
ND
ND
ND
ND
ND
ND
ND
Distance
TOO m
ND
ND
ND
ND
ND
ND
ND
ND
ND
ND
ND
ND
ND
ND
ND
ND
ND
ND
ND
ND
ND
ND
ND
ND
ND
ND
ND
ND
ND
ND
ND
ND
ND
Cumulative
(ran)
0
29
113
172
344
419
465
539
Snow
a 0-time on 19 May 1984.
b U = Upper (0-15 cm); L = Lower (15-30 cm); T = Total (0-30 cm).ND m bfot Detectable; Limit of Detection about 0.02 kg/ha.

- 14 -
Table 8. Sample collection times during storm events and hexazinone residue concentration in
streanwater at three downstream distances
Daysa
Postspray
6
8
11
13
16
20
27
31
34
3S
45
Storm
Event
No.
1
2
3
4
5
e
Days
Poststorra
2
2
3
7
3
Cumulative
Rainfall
(mm)
29
29
74
113
116
116
134
172
175
201
236
50 m
30.8
17.9
13.4
19.1
10.4
6.5
7.7
7.1
5.7
3.9
3.7
Hexazinone
800 m
ND
ND
ND
5.1
3.1
0.9
0.7
0.8
0.8
0.7
1.0
(ppb)
1500 m
ND
ND
ND
ND
ND
ND
ND
ND
ND
ND
ND
a0-time at 19 toy 1984.
ND = Not Detectable; Limit of detection was 0.5 ppb.
ACKNOWLEDGEMENTS
The authors thank the Maritijne Forestry
Centre (CFS), J.D. Irving, Ltd., Du Font
Canada Inc., and Bwironmsnt New Brunswick
for their financial and manpower support,
Janes Conrad, Patrick ftorceau and Wendy Sex-
smith for technical assistance during the
field application and sampling, and B.
Staznik, V. Squire, T. Buscarini, L. Belsito
and D. Egglesfield for laboratory assis
tance.
REFERENCES
Barring, U.; Tbrstensson, L. 1983. An
. example of the mobility of hexazinone
on a slope. Swedish Weed Conf. 24:311"
325 (1983).
Dao, T.H.; Marx, D.M.; Lang, T.L.; Dragun,
J. 1982. Effects, and statistical
evaluation of soil sterilizations on
aniline and diuron adsorption iso
therms. Soil Sci, Soc. Am. J. 46:963-
969.
Feng, J.C.; Klassen, H.D. 1986• Forestry
field and laboratory manual for herbi
cide residue sampling, sample proces
sing and reporting. Can. For. Serv.,
For. Pest Manage. Inst., Sault Ste.
Marie. Inf. Rep. FPM-X-72, 38 pp.
Feng, J.C. 1987. Persistence, mobility
and degradation of hexazinone in for
est silt loam soils. J. Environ.
Sci. Health B22:221-233.
Harrington, K.C.; Rolston, M.P.; Ivens,
G.W. 1982. Movement of hexazinone
spots applied to hill slopes. Pages
162-165 in Proc. 35th N.Z. Weed and
Pest Control Conf.
Holt, R.F. 1981. Determination of hexa
zinone and metabolite residues using
nitrogen-selective gas chromatography.
J. Agric. Food Chem. 29:165-172.
Miller, J.H.; Bace, A.C. 1980. Stream-
water contamination after aerial
application of a pelletized herbicide.
USDft For. Serv. South. For. Exp. Stn.
Res. Note SO-225.

- 15 -
Neary, D.G. 1983. Monitoring herbicide
residues in springflow after an opera
tional application of hexazinone.
South. J. Applied for. 7:217-223.
Neary, D.G.; Bush, P.B.; Douglass, J.E.
19U3. Off-site movement of hexazinone
in stormflow and baseflow from forest
watershed. Weed Sci. 31:543-551.
Neary, D.G.; Bush, P.B.; Grant, M.A. 1986.
Water quality of ephemeral forest
streams after site preparation with the
herbicide hexazinone. For. Ecol.
Manage. 14:23-40.
Rao, P.S.C.; Wagenet, R.J. 1985. Spatial
variability of pesticides in field
soils: methods for data analysis and
consequences. Weed Sci. 33 (Suppl.
2):18-24.
Reynolds, P.E.; MacKay, T.S.; McCormack,
M.L. Jr. 1986. Results of a
hexazinone-mechanical site preparation
trial. tfcrtheastern Heed Sci. Soc.
proc. 40:222-229.
Rhodes, R.C. 1980. soil studies with 14
C-labelled hexazinone. J. Agric. Food
Chein. 28:311-315.
Sung, S.S.; South, D.B.; Gjerstad, D.H.
1985. Bioassay indicates a metabolite
of hexazinone affects photosynthesis
of loblolly pine (Pinus taeda). Weed
Sci. 33:440-442.
Weed Science Society of flmerica. 1983.
Herbicide Handbook. 5th ed. Weed Sci.
Soc. Am., Champaign, II.

Appendix 1. Hexazinone residue persistence and leaching data (kg/ha)
Daysa
Postspray
0
3
6
13
31
61
87
122
157
361
453
Soilb
layer
U
L
T
0
L
T
U
L
T
U
L
T
U
L
T
U
L
T
U
L
T
U
L
T
U
L
T
U
L
T
B
L
T
1
2.10
ND
2.10
2.07
ND
2.07
1.69
0.57
2.26
0.83
0.20
1.03
0.18
0.28
0.46
0.05
0.11
0.16
0.09
0.17
0.26
0.20
0.22
0.42
ND
0.06
0.06
ND
0.11
0.11
ND
ND
ND
Station
2
1.74
ND
1.71
1.01
ND
1.01
1.06
1.16
2.22
0.64
0-52
1.16
0.52
0.13
0.65
0.18
ND
0.18
0.11
ND
0.11
0.09
0.09
0.18
0.21
0.03
0.24
0.08
ND
0.08
ND
ND
ND
Number
3
2.11
ND
2.11
1.49
ND
1.49
1.94
0.53
2.47
0.53
0.30
0.83
0.86
0.87
1.73
0.27
0.08
0.35
0.06
0.26
0.32
0.05
0.12
0.17
ND
0.05
0.05
ND
ND
ND
ND
ND
ND
4
2.03
ND
2.03
2.89
ND
2.89
1.08
0.13
1.21
0.66
0.05
0.71
0.53
0.84
1.37
0.06
0.32
0.38
0.15
0.23
0.38
0.03
0.10
0.13
ND
0.10
0.10
0.06
0.10
0.16
ND
ND
ND
Maan
1.99
ND
1.99
1.87
ND
1.87
1.44
0.60
2.04
0.67
0.27
0.93
0.52
0.53
1.05
0.14
0.13
0.27
0.10
0.17
0.27
0.09
0.13
0.23
0.05
0.06
0.11
0.04
0.05
0.09
ND
ND
ND
SD
0.19
0.19
0.81
0.81
0.44
0.42
0.56
0.12
0.20
0.20
0.28
0.38
0.60
0.10
0.14
0.11
0.04
0.12
0.12
0.08
0.06
0.13
0.11
0.03
0.09
0.04
0.06
0.07
a 0-time on 19 toy 1984.
b U = Upper (0-15 cm); L = Lower {15-30 cm); T ■ Total (0-30 cm)
ND = Not Detectable; Limit of Detection about 0.02 kg/ha.

Appendix 2- Hexazinone residue persistence and leaching data
Daysa
Fastspray
0
3
6
13
31
61
87
122
157
361
453
537
Soilb
layer
U
L
T
U
L
T
U
L
T
0
L
T
U
L
T
U
L
T
0
L
T
U
L
T
U
L
T
u
L
T
U
L
T
U
L
T
1
1.44
ND
1.44
1.55
ND
1.55
1.30
0.49
1.79
0.61
0.15
0.76
0. 14
0.30
0.44
0.03
0.07
0.10
0.09
0.11
0.20
0.12
0.18
0.30
ND
0.05
0.05
ND
0.09
0.09
ND
ND
ND
ND
ND
ND
Station
2
1.35
ND
1.35
0.76
ND
0.76
1.40
0.87
2.27
0.54
0.31
0.85
0.43
0.08
0.51
0. 14
ND
0. 14
0.08
ND
0-OB
0.07
0.05
0. 12
0.19
0.03
0.22
0.08
ND
0.08
ND
ND
ND
ND
ND
ND
Number
3
1.57
ND
1.57
1-33
ND
1.33
1.49
0.35
1.84
0.65
0.42
1.07
0.51
0.53
1.04
0.24
0.05
0-29
0.04
0.15
0.19
0.05
0.07
0-12
ND
0.03
0.02
ND
ND
ND
ND
ND
ND
ND
ND
ND
4
2.23
ND
2.23
2.19
ND
2.19
1.00
0.13
1.13
0.52
0.04
0.56
1.01
0.83
1.84
0.06
0.23
0.29
0.24
0.22
0.46
0.03
0.09
0. 12
ND
0.12
0.12
0.05
0.09
0.14
ND
ND
ND
ND
ND
ND
Mean
1.65
ND
1.65
1.46
ND
1.46
1.30
0-46
1.76
0.58
0.23
0.81
0.52
0.44
0.%
0.12
0.09
0.21
0.11
0.12
0.23
0.07
0-10
0.17
0.05
0.06
0.11
0.03
0.05
0.08
ND
ND
ND
ND
ND
ND
SD
0.40
0.40
0.59
0.59
0.21
0.31
0.47
0.06
0.17
0.21
0.36
0.32
0.65
0.09
0.10
0. 10
0.09
0.09
0.16
0.04
0.06
0.09
0.10
0.04
0.09
0.04
0.05
0.06
on 19 May 1984.
bu = Upper (0-15 an); L = lower (15-30 cm); T = Ibtal (0-30 cm)
ND = Not Detectable; Limit of Detection 0.03 jj g/g.

Appendix 3. Appearance of metabolites A and B after hexazinone treatment in New Brunswick
loam soils
Days3
Post-
Spray
0
3
6
13
31
61
87
122
157
361
453
537
SoilbLayer
U
L
U
L
CJ
L
U
L
U
L
U
L
U
L
U
L
U
L
U
L
D
L
a
L
(0
0.
(0
(0
(0
Metabolite
kg/ha
ND
ND
.26)c
ND
09±0.01
ND
.09)
ND
.15,0.05)
.16,0.08}
ND
ND
ND
ND
ND
ND
ND
ND
ND
ND
ND
ND
ND
ND
(0
0.
(0
(0
(0
&
uq/q
ND
ND
.20)
ND
08±0.01
ND
.07)
ND
.12,0.09)
.10,0.08)
ND
ND
ND
ND
ND
ND
ND
ND
ND
ND
ND
ND
ND
ND
Metabolite B
kg/ha
ND
ND
ND
ND
(0.09,0.08)
ND
(0.08)
ND
(0.12,0.06)
(0.15,0.09)
ND
(0.08)
(0.06)
(0.11,0.09)
(0.13)
(0.09)
ND
ND
ND
ND
ND
ND
ND
ND
Mg/g
ND
ND
ND
ND
(0.07,0
ND
(0.06)
ND
(0.07,0
(0.09,0
ND
(0.06)
(0.06)
(0.7,0.
(0.08)
(0.07)
ND
ND
ND
ND
ND
ND
ND
ND
.06)
• 12)
.09)
08)
Cumulative
(mm)
0
2
29
113
172
344
419
465
539
Snow
a 0-tine on 19 May 1984.
b U = Upper {0-15 cm); L = Lower (15-30 cm).
c Values in () indicate less than four detectable values, otherwise n=4.
ND = Not Detectable; Limit of Detection = 0.03, 0.10 and 0.06 ug/g for hexazinone, metabolite
A and B, respectively, and about 0.02 kg/ha for hexazinone.

Appendix 4. Soil
Layer
bulk
(0-15
Station
Davsa
Postspray
0
3
6
13
31
61
87
122
157
361
453
537
1
0.973
0.889
0.863
0.904
0.840
0.951
0.650
1.076
0.938
1.094
0.862
1.073
density data from the residue persistence sites Station Ho. Upper
cm) Station No.
No. Upper layer
2
0.843
0.891
0.505
0.799
0.821
0.882
0.954
0.815
0.759
0.678
0.796
0.665
3
0.895
0.749
0.869
0.538
1.126
0.765
0,958
0.702
0.768
0.938
1.039
1.145
Lower layer
(0-15 cm)
4
0.606
0.878
0.722
0.636
0.351
0.770
0.412
0.608
0.610
0.829
0.727
0.632
(15-30
Station
1
1.226
1.001
0.766
0.904
0.614
1.074
1 .005
0.836
0.882
0.880
0.877
1.453
cm)
No. Lowei
2
1 .032
1.038
0.885
1.114
1.102
1.441
1.186
1.117
0.771
0.665
1.070
1.020
• layer
3
0.601
0.747
0.994
0.466
1.083
1.031
1.148
1.082
1.008
1.039
1.088
1.167
(15-30 cm)
t 4
0.841
1.009
0.689
0.789
0.679
0.912
0.723
0.782
0.557
0.852
0.854
1.061
Mean 0.926 0.784 0.874 0.665
SD 0.124 0.121 0.180 0.163
N 12 12 12 12
Total Mean = 0.812 N = 48
0.959 1.04 0.955 0.812
0.219 0.199 0.225 0.142
12 12 12 12
Mean = 0.942 N = 48
a 0-time on 19 my 1984.

Appendix 5. Soil moisture content data from the residue persistence
Daysa
Postspray
0
3
6
13
31
61
87
122
157
361
453
537
Total
Soilb
Layer
U
L
D
L
U
L
U
L
U
L
U
L
U
L
U
L
U
L
U
L
0
L
U
L
U
L
1
25.4
24.5
24.1
26.7
23.4
28.0
27.0
30.4
21.4
32.8
25.1
26.7
27.6
26.1
16.7
22.8
21.6
27.3
22.0
31.5
19.9
22.5
29.7
20.8
(n=48)
(n=48)
2
31.8
27.4
26.8
22.5
41.7
32.5
24.8
24.4
35.1
24.6
30.3
16.6
28.7
21.7
32.1
23.4
34.5
33.6
35.0
34.9
30.7
26.6
35.5
27.0
Station Number
3
27.7
32.8
25.5
34.1
33.4
27.2
30.6
42.0
26.4
29.0
30.1
29,6
23.2
25.2
19.5
21.3
25.9
27.6
29.2
26.7
23.2
25.9
22.2
25.4
4
30.5
26.3
25.9
20.0
28.1
31.2
22.6
37.4
36.3
41.7
19.6
29.3
37.6
33.4
8.9
22.5
24.9
29.1
26.9
28.8
28.3
29.9
28.9
27.9
Msan
28.9
27.8
25.6
25.8
31.7
29.7
26.3
33.6
29.8
32.0
26.3
25.6
29.3
26.6
19.3
22.5
26.7
29.4
28.3
30.5
25.5
26.6
29.1
25.3
27.2
27.9
SD
2.9
3.6
1.1
6.2
7.8
2.5
3.4
7.7
7.1
7.3
5.1
6.1
6.0
4.9
9.6
8.8
5.5
2.9
5.4
3.5
4.9
3.0
5.4
3.2
5.9
5.2
a 0-tiire on 19 May 1984.
b U = Upper (0-15 cm); L = Lower (15-30 cm).