determination of mesalamine related impurities...
TRANSCRIPT

ISSN: 0973-4945; CODEN ECJHAO
E-Journal of Chemistry
http://www.e-journals.net 2011, 8(1), 131-148
Determination of Mesalamine Related
Impurities from Drug Product by
Reversed Phase Validated UPLC Method
TRIVEDI RAKSHIT KANUBHAI§*
, PATEL MUKESH C and KHARKAR AMIT R§
§Analytical Research and Development
Integrated Product Development, Dr. Reddy’s Laboratories Ltd.
Bachupally, Hyderabad-500 072, India
P.S. Science and H.D. Patel Arts College, S.V. Campus, Kadi-382 715, Gujarat, India [email protected]
Received 5 June 2010; Accepted 24 August 2010
Abstract: In the present study gradient reversed-phase UPLC method was developed for simultaneous determination and separation of impurities and degradation products from drug product. The chromatographic separation was performed on acquity UPLC BEH C18 column (50 mm x 2.1 mm, 1.7 µm) using gradient elution. Other UPLC parameters which were optimised are flow rate, 0.7 mL/min; detection wavelength, 220 nm; column oven temperature, 40 °C; and injection volume 7 µL. Stability indicating capability was established by forced degradation experiments and separation of known degradation products. The method was validated as per International Conference on Harmonization (ICH) guideline. For all impurities and mesalamine, LOQ (limit of quantification) value was found precise with RSD (related standard daviation) of less than 2.0%. In essence, the present study provides an improved low detection limit and lower run time for evaluation of pharmaceutical quality of mesalamine delayed-release formulation. Moreover, the developed method was successfully applied for quantification of impurities and degradation products in mesalamine delayed-release formulation. The same method can also be used for determination of related substances from mesalamine drug substance.
Keywords: Mesalamine, 5-Aminosalicylic acid, Stability indicating, UPLC, Validation.
Introduction
Mesalamine (5-aminosalicylic acid, 5-ASA), the therapeutically active moiety of sulfasalazine1-3
is routinely employed in the treatment of inflammatory bowel disease, that is ulcerative colitis
and Crohn’s disease. Various types of formulations are available for the mesalamine4.
Orally administrated mesalamine is rapidly and almost completely absorbed from the small
intestine5-7
. Formulations able to deliver the intact drug to the lower intestine are nowadays
successfully used8,9
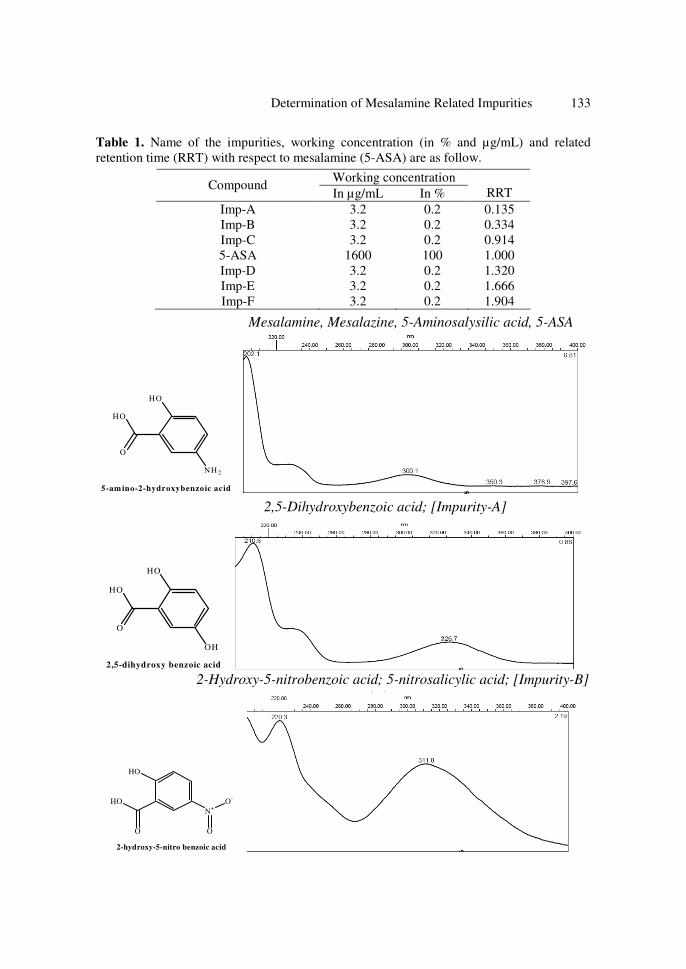
. The purity evaluation of mesalamine in drug product by determination of
related substances would be a first step in examination of the safety and quality of the drug
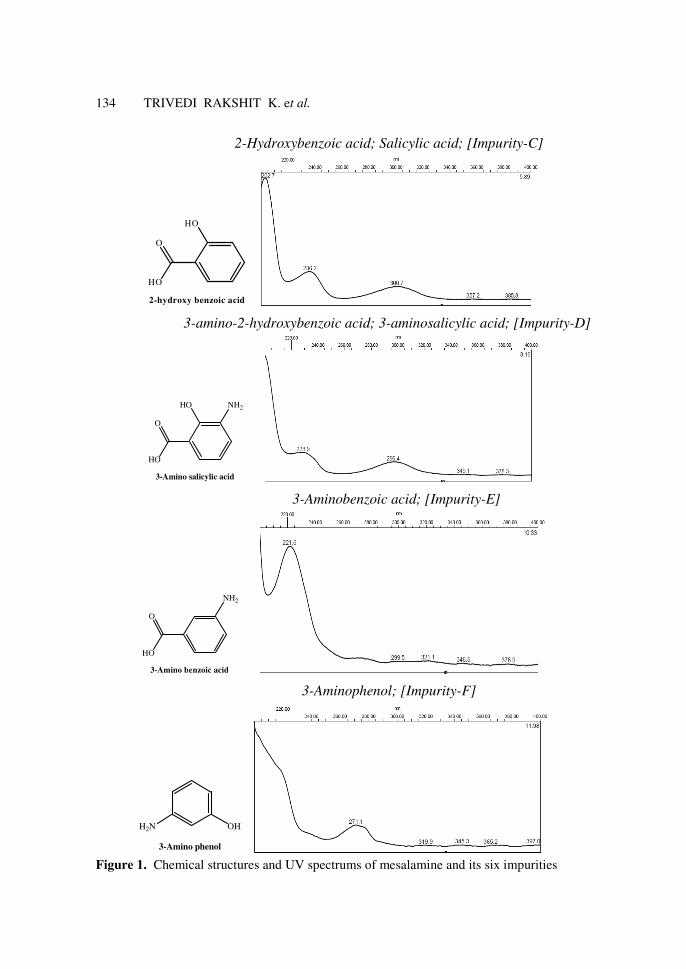
product. Chemical structures and UV spectrums of mesalamine and its six impurities are shown

132 TRIVEDI RAKSHIT K. et al.
in Figure 1. Mesalamine drug profile10
and degradation mechanism in aqueous solution was
reported11
. Several articles for mesalamine metabolism12,13
and its determination by HPLC14-16
and HPLC-ESI-MS/MS17
has been reported. Estimation of mesalamine and its metabolites in
plasma and urine by HPLC18-20
and by fluorescence detector21
are also reported. Mesalamine
HPLC determination in rectal tissue biopsies22
and endoscopic intestinal biopsy in human has
been reported23
. Identification of unknown impurity in mesalamine was also reported24,25
.
Mesalamine protects against colorectal cancer in inflammatory bowel disease26
. HPLC determination of mesalamine and related impurities using ion-pairing reagent
27 and by simple
liquid chromatography28
has been reported. Mesalamine formulation determination by spectro-photometric
29, by HPLC and ultraviolate
30 and by differential pulse voltammetry was reported
31.
Determination of mesalamine and its related impurity by micellar electrokinetic capillary chromatography has been reported
32. Determination of mesalamine related impurities by micellar
electrokinetic chromatography with an ion-pair reagent was reported33
. Mesalamine determination in pharmaceutical dosage forms by HPLC, DPPH and nitrosation was also reported
34.
Literatures survey revealed that the mesalamine drug substance is official in US Pharmacopeia
37 as well as in British Pharmacopoeia
38. Mesalamine extended release capsules
35
and mesalamine delayed-release tablets36
, formulation is also official in US Pharmacopoeia. In pharmacopeia method (mesalamine delayed-release tablets), requirement of resolution (system suitability) in between salicylic acid, mesalamine and 3-aminosalicylic acid is not less than 2. This resolution requirement (system suitability) is very low for the low ppm solution. In this method total run time, solution stability, impurities RRT (related retention time) and its order of elution for all impurities also not mentioned. Further, mesalamine delayed-release tablet USP monograph having unknown single max limit 0.5% with the area percent method. Now a day determination of Genotoxic and Carcinogenic Impurities (may be available in formulation as an unknown) in drug substances and product is the new approach from the regulatory agency
41.
Mesalamine delay release formulation having a higher amount of drug substance (total daily intake 1.2 g/day), below the qualification threshold, no investigation is required (intake is up to 2g/day), although impurities at levels above 1000 ppm (or 1mg/day) are expected, at the least, to be identified
42. Subsequent guidance from the U.S. Food and Drug Administration (USFDA)
41
conform that the ICH thresholds may not be acceptable for carcinogenic impurities (may be unknown in drug substances). To control and determination of the unknown impurity in drug product at lower level will help to reduce the risk of carcinogenic.
So, determination of related substances would be a first step in examination of the safety
and quality of the drug product. As per new approach related impurities/degradation
products/unknown impurities RRT and good amount of resolution between all related
substances in the drug product analytical method (with the low limit determination
capability) is the first step to measure the quality of drug product.
Comprehensive literatures for measure the quality of mesalamine delayed-release
product by HPLC have long run time, limited solution stability, less efficiency (N), higher
limit for unknown single maximum impurity, lack of related retention time for all impurities
and less resolution, as such there is lack of a suitable procedure for the quantification and
estimation for them. Therefore, the aim of the present work was to develop and validate a
simple, precise, accurate, short runtime and specific method for the quantification and
separation of 5-ASA and its impurities/degradation product by reversed-phase UPLC
method, in mesalamine delayed-release formulation.
Moreover, analytical column with sub 2-micron particle size technology was
explored for better chromatography. Working concentration and RRT for all related
substances was mentioned in Table 1.
Determination of Mesalamine Related Impurities 133
Table 1. Name of the impurities, working concentration (in % and µg/mL) and related
retention time (RRT) with respect to mesalamine (5-ASA) are as follow.
Working concentration Compound
In µg/mL In %
RRT
Imp-A 3.2 0.2 0.135
Imp-B 3.2 0.2 0.334
Imp-C 3.2 0.2 0.914
5-ASA 1600 100 1.000
Imp-D 3.2 0.2 1.320
Imp-E 3.2 0.2 1.666
Imp-F 3.2 0.2 1.904
Mesalamine, Mesalazine, 5-Aminosalysilic acid, 5-ASA
O
HO
HO
NH 2
5-am ino-2-hydroxybenzoic acid
2,5-Dihydroxybenzoic acid; [Impurity-A]
O
HO
OH
HO
2,5-dihydroxy benzoic acid 2-Hydroxy-5-nitrobenzoic acid; 5-nitrosalicylic acid; [Impurity-B]
O
HO
N+
O
O-
HO
2-hydroxy-5-nitro benzoic acid
134 TRIVEDI RAKSHIT K. et al.
2-Hydroxybenzoic acid; Salicylic acid; [Impurity-C]
O
HO
HO
2-hydroxy benzoic acid
3-amino-2-hydroxybenzoic acid; 3-aminosalicylic acid; [Impurity-D]
HO
O
HO
NH2
3-Amino salicylic acid
3-Aminobenzoic acid; [Impurity-E]
O
HO
NH2
3-Amino benzoic acid
3-Aminophenol; [Impurity-F]
OHH2N
3-Amino phenol
Figure 1. Chemical structures and UV spectrums of mesalamine and its six impurities

Determination of Mesalamine Related Impurities 135
Experimental
Mesalamine delayed-release tablets, placebo of mesalamine tablets, mesalamine [5-ASA] USP
reference standard, impurity-A to F, were provided by Dr. Reddy’s laboratories Ltd., Hyderabad.
HPLC grade acetonitrile and methanol were obtained from J.T.Baker (NJ., USA). HPLC grade
1-octane sulphonic acid sodium salt was obtained from RANKEM (RFCL Ltd., Delhi). Di-
potassium hydrogen orthophosphate purified, potassium dihydrogen orthophosphate purified, GR
grade orhtophosphoric acid and GR grade hydrochloric acid were obtained from Merck
(Mumbai, India). 0.2 µm nylon 66 membrane filter and 0.2 µm nylon syringe filter used was a
product of Pall life science limited (India). 0.2 µm PVDF syringe filter used was manufactured
by Millipore (India). High purity water was generated by using Milli-Q Plus water purification
system (Millipore, Milford, MA, USA). All experiments were performed using ‘A’ class
volumetric glassware and GLP compliance analytical laboratory.
Equipment
Cintex digital water bath was used for specificity study. Photo stability studies were carried
out in a photo-stability chamber (Sanyo, Leicestershire, UK). Thermal stability studies were
performed in a dry air oven (Cintex, Mumbai, India).
Buffer preparation
pH 2.2 buffer preparation: 1.36 g of potassium dihydrogen orthophosphate and 5.5 g of 1-
octane sulphonic acid sodium salt was dissolved in 890 mL of Milli-Q water. The pH of this
solution was adjusted to 2.2 with orthophosphoric acid and then filtered through 0.2 µm
nylon 66 membrane filter.
pH 6.0 buffer preparation: 1.74 g of dipotassium hydrogen orthophosphate and 5.5 g of 1-
octane sulphonic acid sodium salt was dissolved in 890 mL of Milli-Q water. The pH of this
solution was adjusted to 6.0 with orthophosphoric acid and then filtered through 0.2 µm
nylon 66 membrane filter. Bench top stability at room temperature for the both buffer
preparation was found stable with respect to pH and visual clarity up to 48 h.
Diluent preparation Diluent-1: 1N hydrochloric acid was used.
Diluent-2: 1.36 g of potassium dihydrogen orthophosphate and 2.2 g of 1-octane sulphonic
acid sodium salt were dissolved in 890 mL of Milli-Q water. The pH of this solution was
adjusted to 2.2 with orthophosphoric acid. Adjusted pH (2.2) buffer, methanol and
acetonitrile were mixed well in the ratio of 890:80:30 (v/v/v) respectively.
Chromatographic system Analyses were performed on Acquity UPLC
TM system (Waters, Milford, USA), consisting
of a binary solvent manager, sample manager and PDA (photo diode array) detector. System
control, data collection and data processing were accomplished using Waters Empower-2TM
chromatography data software. The chromatographic condition was optimised using Acquity
UPLC BEH C18 (50 mm x 2.1 mm, 1.7 µm) column. The buffer pH 2.2 was used as a
mobile phase-A (M.P.-A). Mobile phase-B (M.P.-B) was a mixture of buffer pH 6.0,
methanol and acetonitrile in the ratio of 890:80:30 (v/v/v) respectively. Mobile phase-A and
mobile phase-B was filtered through 0.2 µm nylon membrane filter and degassed under
vacuum prior to use. The separation of all impurities was achieved by gradient elution using
M.P.-A and M.P.-B. The finally selected and optimized conditions were as follows: injection
volume 7 µL, gradient elution (Table 2), at a flow rate of 0.7 mL/min at 40 °C (column oven)
temperature, detection wavelength 220 nm. The stress degraded samples and the solution
stability samples were analyzed using a PDA detector covering the range of 200-400 nm.

136 TRIVEDI RAKSHIT K. et al.
Table 2. Gradients program for elution of 5-ASA and all impurities
Time, min Flow rate, mL/min % M.P.-A % M.P.-B Gradient curve
Initial 0.7 90 10 Isocratic 3 0.7 90 10 Isocratic
13 0.7 10 90 Linear
13.1 0.7 90 10 Isocratic 15 0.7 90 10 Equilibration
System suitability solution preparation
1 mg of 2-hydroxy benzoic acid (salicylic acid), 1 mg of 5-ASA and 1 mg of 3-amino salicylic
acid standard was taken in 100 mL volumetric flask. About 6 mL of diluent-1 was added to this
volumetric flask and sonicated in an ultrasonic bath for 10 min. This solution was then diluted up
to the mark with diluent-2 and was mixed well. Three millilitres of this solution was transferred
into 10 mL volumetric flask and diluted up to the mark with diluent-2 and was mixed well.
Standard solution preparation
About 32 mg of 5-ASA working standard was taken into 100 mL volumetric flask, then added
6 mL of diluent-1 and dissolved it by 10 minutes sonication. This solution was then diluted to
the mark with diluent-2 and was mixed well. Two millilitres of this solution was transferred into
200 mL volumetric flask and diluted up to the mark with diluent-2 and was mixed well.
Sample solution preparation
Twenty tablets were crushed to fine powder. An accurately weighed portion of the powder
equivalent to 400 mg of mesalamine was taken into 250 mL volumetric flask. About 15 mL of
diluent-1 was added to this volumetric flask and sonicated in an ultrasonic bath for 10 minutes. This
solution was then diluted up to the mark with diluent-2, mixed well. It was then filtered through
0.2 µm PVDF syringe filter and the filtrate was collected after discarding first few millilitres.
Placebo solution preparation
Tablets placebo powder was taken into 250 mL volumetric flask. About 15 mL of diluent-1 was
added to this volumetric flask and sonicated in an ultrasonic bath for 10 minutes. This solution
was then diluted up to the mark with diluent-2, mixed well. It was then filtered through 0.2 µm
PVDF syringe filter and the filtrate was collected after discarding first few millilitres.
Method validation
The proposed method was validated as per ICH guidelines39
.
System suitability
System suitability parameters were measured so as to verify the system performance. In the
system suitability solution chromatogram resolution between salicylic acid, mesalamine and
3-aminosalicylic acid was measured. The similarity factor for the peak of mesalamine in
duplicate standard preparation was measured. In the standard preparation theoretical plates and
tailing factor for mesalamine peak was measured. Percentage related standard deviation for the
peak areas of mesalamine for six replicate (standard solution) injections was also measured.
All these system suitability parameters covered the system, method and column performance.
Specificity
Specificity is the ability of the method to measure the analyte response in the presence of its
potential impurities39,40
.Forced degradation studies were performed to demonstrate selectivity
and stability indicating capability of the proposed method. The sample solution was exposed to

Determination of Mesalamine Related Impurities 137
acidic condition (2 N HCl, 60 °C, 6 h), alkaline condition (1 N NaOH, 60 °C, 1 h), strong oxidizing (6% H2O2, bench top for 2 h), Hydrolysis (water, 60 °C, 2 h). The powdered sample of tablets was exposed to UV light (short and longer wavelengths, 7 days), dry heat (105 °C, 12 h), humidity (25 °C, 90% RH, 7 days) degradation conditions. Also, placebo of the tablets was exposed to above all stress conditions to identify the source of degradation peak. The entire exposed samples were analyzed by the proposed method with PDA detector.
Precision
The precision of the related substances method verified by repeatability and by intermediate precision. Precision was investigated using sample preparation procedure for six real samples (with spiked impurities in known concentration level) of tablets and analyzing by proposed method. Intermediate precision study was performed with different column, different instrument, and different day by another analyst. Precision was also performed at LOQ (in placebo), at 100% and 150% of specification limit level. The mean of percentage impurity (n=6) and the percentage relative standard deviation was also calculated for all substances.
Accuracy
To confirm the accuracy of the proposed method, recovery experiments were carried out by standard addition technique. Four different levels (LOQ, 50%, 100% and 150%) of impurities standards were added to pre-analyzed tablet samples in triplicate. Four different levels (LOQ, 50%, 100% and 150%) of mesalamine standard were added to pre-analyzed placebo samples in triplicate. The percentage recoveries of mesalamine and impurities at each level and each triplicate were determined. The mean of percentage recoveries was calculated.
Limit of detection (LOD) and Limit of quantification (LOQ)
The LOD and LOQ of mesalamine and all six impurities were determined (in placebo solution) by using signal to noise approach as defined in International Conference on Harmonization (ICH) guideline
39,40. Increasingly dilute solution of drug and each impurity was injected into
the chromatograph and signal to noise (S/N) ratio was calculated at each concentration.
Linearity
Linearity was demonstrated from LOQ to 250% of working concentration by using
minimum seven calibration levels for the mesalamine compound and all impurity standards.
The method of linear regression was used for data evaluation. Peak area of compound was
plotted against respective concentrations. Linearity was described by regression equation,
correlation coefficient and Y-intercept bias.
Robustness
The robustness as a measure of method capacity to remain unaffected by small, but deliberate
changes in chromatographic conditions was studies by testing influence of small changes in
flow rate (±0.05 mL/min), change in column oven temperature (38 °C to 42 °C) and change in
pH of M.P.-A (pH 2.1 to pH 2.3). Measured the system suitability criteria for all the above
experiment and compared the related retention time for all the impurities with the initial RRT.
Stability of standard and sample preparation
Stability of standard and sample solution was established by storage of sample solution
(duplicate preparation) and standard solution at ambient temperature for 24 h. Sample
solution stability was demonstrated by spiking impurity standards in pre-analyzed tablet
sample. Standard and sample solutions were re-analyzed after 12 h and after 24 h. For
sample solution, percentage difference in impurities was calculated against fresh injected
sample solution. Percentage RSD was calculated for standard preparation.

138 TRIVEDI RAKSHIT K. et al.
Filter compatibility
Filter compatibility was performed for nylon 0.2 µm syringe filter (Pall Life sciences) and
PVDF 0.2 µm syringe filter (Millipore). To confirm the filter compatibility in proposed
method, filtration recovery experiments were carried out by sample filtration technique. The
working concentration level impurities standard was added to pre-analyzed tablet sample in
duplicate. Spiked impurities samples was filter through both syringe filters and percentage
difference was calculated against centrifuged sample.
Results and Discussion Method development
The important criteria for development of successful RP-UPLC method for determination of
mesalamine related substances in delayed-release tablets were: the method should be able to
determine all impurities of the drug in single run with the good amount of resolution and it
should be accurate, reproducible, robust, stability indicating, free from interference (blank/
placebo/ other unknown degradation product) and straightforward enough for routine use in
quality control laboratory.
To develop the stability indicating method, first the retention behaviour of these all
compounds with change in percentage of organic solvent (acetonitrile and methanol) and with
change in buffer substances and change in pH of buffer was studied on Waters Acquity BEH
C18 column (50 mm x 2.1 mm, 1.7 µm). 1-Octane sulphonic acid ion pair reagent was used in
buffer preparation to improve the resolution and avoid the other substances co elution at same
retention time in RP chromatography. The buffer pH 2.2 for M.P.-A was found more
appropriate for robust resolution, peak shape and RRT performance of all the interested
substances. The final gradient run was chosen with regards to the peak resolution and analysis
time as well. The gradient program is given in Table 2. The flow rate of 0.7 mL/min was
optimized with regard to the back pressure and analysis time as well. Diluents concentration
was optimized to improve the solution stability and peak shape. Detection wavelength 220 nm
was selected for mesalamine and its related substances due to higher detector response at this
wavelength. Thus, determination of impurities was possible in single run.
Analytical parameters and validation
After satisfactory development of method it was subjected to method validation as per ICH
guideline39
. The method was validated to demonstrate that it is suitable for its intended
purpose by the standard procedure to evaluate adequate validation characteristics (system
suitability, accuracy, precision, linearity, robustness, ruggedness, solution stability, LOD and
LOQ, filter compatibility and stability indicating capability).
System suitability
The percentage RSD of mesalamine area count of six replicate injections was below 2.0%.
Low values of % RSD of replicate injections indicate that the system is precise. Result of
other system suitability parameters such as resolution, theoretical plates, tailing factor and
similarity factor (between two standard preparations) are presented in Table 3. As seen from
this data, the acceptable system suitability parameters would be: related standard deviation
of replicate injections is not more than 2.0%, resolution between salicylic acid and 5-ASA is
not less than 3.0, resolution between 5-ASA and 3-aminosalicylic acid is not less than 6.0,
theoretical plates for 5-ASA is not less than 10000, tailing factor for 5-ASA is not more than
1.5 and similarity factor (between two standard preparations) is not less than 0.95 and not
more than 1.05. Results of system suitability parameters from different studies are presented
in Table 3. Overlay chromatograms of replicate standard injection are presented in Figure 2.

Determination of Mesalamine Related Impurities 139
Figure 2. Overlay chromatograms of replicate standard injections
Table 3. System suitability results (precision, intermediate precision and robustness)
Condition
Resolution
between
Imp-C and
5-ASA
Resolution
between
5-ASA
and Imp-D
Theoretical
plates for 5-
ASA
Tailing
factor for
5-ASA
Similarity
factor
between two
Standard
% RSD
of
Standard
Area
Precision 3.89 6.21 15416 1.25 0.97 0.5 Intermediate
Precision 4.11 6.89 14434 0.85 1.02 0.9
At 0.65 mL/min flow rate
3.73 6.54 14821 0.81 1.03 1.1
At 0.75 mL/min flow rate
3.74 6.57 14438 0.82 0.99 0.7
At 38°C Column oven temp.
3.74 6.52 15403 0.83 1.01 0.5
At 42°C Column oven temp.
3.79 6.58 14262 0.80 1.03 0.9
M.P.-A pH 2.1 3.82 6.63 14985 0.81 0.98 0.8
M.P.-A pH 2.3 3.83 6.60 15050 0.81 0.97 0.7
Specificity
Typical overlaid chromatograms are presented in Figure 3 and 4, which shows separation of
individual compounds and also shows that there is no any interferences at the RT (retention time)
of individual compound due to blank and placebo. Chromatograms of base and peroxide
degraded (with its 3D plot and purity plot) tablet samples are presented in Figure 5 and 6
respectively. Mesalamine was found to be stable under acid, heat, humidity, and light degradation
condition. Further, spectra of unknown degradation products in tablet sample were similar to that
of unknown degradation products of individual standards eluting at respective retention time.
Also spectra of known impurities in degraded tablet sample were similar to its respective
impurity standard substance, indicating that there was no co-elution of unknown degradation
peak at retention times of respective known impurities. Peak due to mesalamine was investigated
for spectral purity in the chromatogram of all exposed samples and found spectrally pure. The
max plot of chromatograms degradation samples was also checked to ensure that no degradation
peak is missed due to use of wavelength of 220 nm. Therefore, the method is specific and
suitable for routine work. The results of forced degradation study are given in Table 4.

140 TRIVEDI RAKSHIT K. et al.
Table 4. Forced degradation data and purity results of mesalamine (5-ASA)
5-ASA Stress condition
Purity flag % Degradation
Refluxed with 2N HCl solution at 60 °C for 6 h. No 0.33
Refluxed with 1N NaOH solution at 60 °C for 1 h. No 5.05
6 % H2O2 solution bench top for 2 h. No 4.30
Refluxed with water at 60 °C for 2 h. No 0.22
Exposed to UV light. No 0.35
Dry heated at 105 °C for about 12 h. No 0.52
Exposed to humidity (25 °C, 90 %RH) about 7 days. No 0.18
Figure 3. Overlay chromatograms of placebo (bottom) and spiked impurities (top) with its 3D plot
Figure 4. Overlay chromatograms of (1) blank; (2) placebo and (3) system suitability
standard
(1)
(2)
(3)

Determination of Mesalamine Related Impurities 141
Figure 5. Chromatogram of alkali degraded tablet sample with its 3D plot and purity plot.

142 TRIVEDI RAKSHIT K. et al.
Figure 6.Chromatogram of peroxide degraded tablet sample with its 3D plot and purity plot.
Precision
Precision (at LOQ, 100% and 150%) results are shown in Table 5 along with intermediate
precision data. Low values of RSD, indicates that the method is precise. Overlay
chromatograms of precision at LOQ are presented in Figure 7.

Determination of Mesalamine Related Impurities 143
Table 5. Precision at three levels (LOQ, 100% and 150%) and intermediate precision results§
Precision at LOQ Precision at 100% Precision at 150% Intermediate
Precision Impurities
%
imp.#
%
RSD*
%
imp.#
%
RSD*
%
imp.#
%
RSD*
%
imp.#
%
RSD*
Imp-A 0.005 1.68 0.204 0.40 0.293 0.31 0.207 0.26
Imp-B 0.005 1.59 0.206 0.06 0.301 0.41 0.203 0.43
Imp-C 0.018 1.63 0.196 0.14 0.309 0.92 0.208 0.75
Imp-D 0.019 1.78 0.200 1.22 0.295 0.88 0.212 0.50
Imp-E 0.020 0.50 0.208 0.28 0.311 0.49 0.200 0.43
Imp-F 0.018 0.38 0.202 0.74 0.281 1.48 0.180 0.47 # Average of six determinations; * Determined on six values § Demonstrated by spiking known impurities into sample
Figure 7. Overlay chromatograms of precision at LOQ level
Accuracy by recovery
The amount recovered was within ±10% of amount added, which indicates that the method
is accurate and also there is no interference due to excipients present in tablets. The results
of recoveries for 5-ASA and impurities are shown in Table 6. Overlay chromatograms of
accuracy are presented in Figure 8.
Table 6. Accuracy results
Mean % Recovery (With triplicate determination at each level) Substances
at LOQ # at 50%
# at 100%
# at 150%
#
Imp-A 105.5 102.1 100.8 98.9
Imp-B 102.4 101.5 99.4 101.1
Imp-C 97.4 98.5 101.3 103.2
5-ASA 95.9 99.5 102.7 99.5
Imp-D 104.3 100.3 101.5 98.7
Imp-E 101.1 98.6 101.2 99.1
Imp-F 103.9 97.9 102.6 100.6 # Average of three determinations

144 TRIVEDI RAKSHIT K. et al.
Figure 8. Overlay chromatograms of accuracy (at 50%, 100% and 150%)
LOD and LOQ
The concentration (in %) with signal to noise ratio of at least 3 was taken as LOD and
concentration with signal to noise of at least 10 was taken as LOQ, which meets the criteria
defined by ICH guidelines39,40
. The LOD and LOQ results of all substances are presented in
Table 7. Precision result at LOQ was also presented in Table 5.
Table 7. Limit of detection and limit of quantification
In % (w.r.t. working conc.) Signal to noise ratio Substances
LOD LOQ LOD LOQ
Imp-A 0.0018 0.006 2.9 10.4
Imp-B 0.0018 0.006 3.2 10.0
Imp-C 0.006 0.020 2.7 10.0
5-ASA 0.006 0.020 2.4 9.7
Imp-D 0.006 0.020 3.0 9.9
Imp-E 0.006 0.020 3.3 13.5
Imp-F 0.006 0.020 3.1 10.2
Linearity
The response was found linear for all substances from LOQ to 250% of working
concentration. This test was performed on seven different levels of each substance, which
gave us a good confidence on analytical method with respect to linear range. For the all
substances correlation coefficient was greater than 0.999. Correlation coefficients, Y-
intercept bias and linearity equations for mesalamine and impurities are presented in Table
8. Overlay chromatograms of different linearity levels are also presented in Figure 9.
Table 8. Linearity results for 5-ASA and impurities
Compound Linearity
range, µg/mL
Correlation
coefficient (r2)
Linearity (Equation) Y- Intercept
bias
Imp-A 0.096 to 8.00 0.9996 y = 44871(x) - 2380 -1.692
Imp-B 0.096 to 8.00 0.9998 y = 40980(x) - 1678.8 -1.301
Imp-C 0.32 to 8.00 0.9998 y = 18233(x) - 711.35 -1.223
5-ASA 0.32 to 8.00 0.9997 y = 22128(x) - 1366.6 -1.964
Imp-D 0.32 to 8.00 0.9997 y = 21633(x) + 129.75 0.186
Imp-E 0.32 to 8.00 0.9999 y = 46186(x) - 624.15 -0.421
Imp-F 0.32 to 8.00 0.9997 y = 30622(x) - 1182.2 -1.212

Determination of Mesalamine Related Impurities 145
Figure 9. Overlay chromatograms of linearity study from LOQ to 250%
Robustness
No significant effect was observed on system suitability parameters such as resolution, theoretical
plates, tailing factor, similarity factor and RSD of respective components, when small but
deliberate changes were made to chromatographic conditions. The results are presented in Table 3
along with system suitability parameters of normal methodology. No significant effect was
observed on related retention time (RRT) of all impurities, when deliberate changes were made to
chromatographic conditions. The impurities RRT variation results are presented and compared
with normal methodology result, which was presented in Table 9. Thus, the method was found to
be robust with respect to variability in variable conditions
Table 9. Robustness results
Related retention time of Impurities
Flow rate per
minutes
Column oven
temperature
M.P.-A pH
variation Compound
Initial
0.65 mL 0.75 mL 38 °C 42 °C pH 2.1 pH 2.3
Imp-A 0.134 0.139 0.139 0.139 0.139 0.139 0.139
Imp-B 0.334 0.348 0.348 0.348 0.348 0.349 0.348
Imp-C 0.914 0.915 0.915 0.915 0.914 0.914 0.914
5-ASA 1.000 1.000 1.000 1.000 1.000 1.000 1.000
Imp-D 1.320 1.302 1.302 1.302 1.303 1.302 1.302
Imp-E 1.666 1.631 1.631 1.631 1.634 1.632 1.634
Imp-F 1.904 1.855 1.855 1.854 1.859 1.856 1.858
Stability of standard and sample solution
Solution stability was performed and determined with duplicate spike sample preparation.
Percentage difference in all impurities was calculated with respect to freshly injected sample
solution. Sample solution did not show any appreciable change in all impurities value when
stored at ambient temperature up to 24 hours, which was presented in Table 10. Standard
solution did not show any unknown peak during this 24 h study and also full fill the
requirement of % RSD, which was also presented in Table 11.

146 TRIVEDI RAKSHIT K. et al.
Table 10. Solution stability results (test preparation)
Initial sample Sample after 12 hours Sample after 24 hours
Imp. in % Imp. in % Difference in % Imp. in % Difference in %
Impurity Sam-1 Sam-2 Sam-1 Sam-2 Sam-1 Sam-2 Sam-1 Sam-2 Sam-1 Sam-2
Imp-A 0.207 0.208 0.205 0.204 0.002 0.004 0.204 0.206 0.003 0.002
Imp-B 0.210 0.210 0.206 0.207 0.004 0.003 0.207 0.206 0.003 0.004
Imp-C 0.200 0.200 0.203 0.204 0.003 0.004 0.209 0.208 0.009 0.008
Imp-D 0.207 0.205 0.210 0.210 0.003 0.005 0.205 0.208 0.002 0.003
Imp-E 0.212 0.212 0.208 0.209 0.004 0.003 0.210 0.209 0.002 0.003
Imp-F 0.204 0.206 0.205 0.205 0.001 0.001 0.203 0.205 0.001 0.001
Table 11. Solution stability results (standard preparation)
Initial After 12 h After 24 h Compound
Area % RSD# Area % RSD
§ Area % RSD
*
Mesalamine 66552.8 0.60 66710.8 0.79 66766.4 0.75 # Determined on five replicate injections
§ Determined on five initial and 12h standard injections (RSD of six Inj.)
*Determined on five initial, one 12h and one 24 h standard injections (RSD of seven Inj.)
Filter compatibility
Filter compatibility with 0.2 µm syringe filter of PVDF and nylon filter was determined with
duplicate sample preparation. Filtered sample solution was not shown any significant
changes in impurities percentage with respect to centrifuge samples impurities percentage.
Difference in all impurities percentage results was presented in Table 12. In displayed result
difference in % of impurities was not observed more than 0.002 %, which indicates that both
syringe filters are having good compatibility with sample solution.
Table 12. Filter compatibility results
Centrifuged PVDF Syringe filter 0.2µ
(Millipore)
Nylon Syringe filter 0.2µ
(Pall Life Sciences)
Imp. in % Imp. in % Difference in % Imp. in % Difference in %
Impurity
Sam-1 Sam-2 Sam-1 Sam-2 Sam-1 Sam-2 Sam-1 Sam-2 Sam-1 Sam-2
Imp-A 0.205 0.204 0.205 0.205 0.000 0.001 0.206 0.205 0.001 0.001
Imp-B 0.206 0.207 0.207 0.206 0.001 0.001 0.206 0.205 0.000 0.002
Imp-C 0.203 0.204 0.203 0.204 0.000 0.000 0.203 0.204 0.000 0.000
Imp-D 0.210 0.210 0.209 0.212 0.001 0.002 0.210 0.210 0.000 0.000
Imp-E 0.208 0.209 0.210 0.209 0.002 0.000 0.210 0.209 0.002 0.000
Imp-F 0.205 0.205 0.203 0.204 0.002 0.001 0.205 0.205 0.000 0.000
Conclusion
A novel RP-UPLC method was successfully developed and validated for simultaneous
determination of all six impurities from mesalamine delayed-release formulation. The total
run time was 15 minutes, within which drug and their impurities/degradation products were
well separated from each other. Method validation results have proved that the method is
selective, precise, accurate, linear, rugged, robust and stability indicating with low LOD and
LOQ. This method can be successfully applied for the routine analysis as well as stability

Determination of Mesalamine Related Impurities 147
study of mesalamine delayed-release drug product. Overall, the method provides high
throughput solution for determination of all related impurities in mesalamine delayed-release
formulation with excellent selectivity, precision and accuracy.
Acknowledgment
The authors would like to thank M/s. Dr. Reddy’s Laboratories Ltd. for supporting this
work. All raw data from the validation work archived at Dr. Reddy’s Laboratories Ltd. All
the development and validation work was performed at Analytical Research and
Development (AR&D) Lab., Dr. Reddy’s Laboratory Ltd., IPDO, Bachupally, Hyderabad,
India. The authors’ Intellectual Property Management department (IPM) has given this
manuscript internal publication number is PUB-00037-10.
References
1. Gisbert J P, Gomollon F, Mate J and Pajares J M, A systematic review., Dig Dis Sci
2002, 47, 471-488.
2. Klotz U, Maier K, Fisher C and Heinkel K, Eur J Clin Pharmacol., 2000, 56, 353-362.
3. De Vos M, Clin Pharmacokinet., 2000, 39, 85-97.
4. http://en.wikipedia.org/wiki/Mesalazine
5. Pappercorn M A and Goldman P, Gastroenterology, 1973, 64(2), 240-245.
6. Haagen Nielsen O and Bondesen S, Br J Clin Pharmacol., 1983, 16(6), 738-740.
7. Schröder H and Compbell D E, Clin Pharmacol Ther, 1972, 13(4), 539-551.
8. Goodman and Gilman’s. The Pharmacological Basis of Therapeutics,8th
Ed.,
Pergamon, 1990, p 650.
9. Reynolds J F, (Ed.) Martindale. The Extra Pharmacopoeia, Royal Pharmaceutical
Society, London, 1996, p.1227.
10. Alekha K Dash and Harry G Brittain, Analytical Profile of Drug Substances and
Excipients, 1998, 25, 209-242; doi: 10.1016/S0099-5428(08).
11. Rita K Palsmeier, Donna M Radzik and Craig E Lunte, Pharma Res., 1992, 9(7),
933-938.
12. Zhou S Y, Fleisher D, Pao L H, Li C, Winward B, Zimmermann E M, Drug Metab
Dispos., 1999, 27(4), 479-485.
13. Liu Z C, McClelland R A and Uetrecht J P, Drug Metab Dispos., 1995, 23(2), 246-250.
14. Bystrowska B, Nowak J and Brandys J, J Pharma Biomed Anal., 2000, 22(2), 341-347.
15. Fischer C and Klotz U, J Chromatogr. 1979, 162(2), 237-243.
16. Palmbo G, Bucchi S, Primavera L, Palumbo P and Carlucci G, Biomed Chromatogr.,
2005, 19(5), 350-354.
17. Elisabetta Paslorini, Marcello Locatelli, Patrizia Simoni, Giulia Roda, Enrico Roda
and Aldo Roda, J Chromatogr B Analyt Technol Biomed Life Sci., 2008, 872(1-2),
99-106.
18. Fischer C, Maier K and Klotz U, J Chromatogr., 1981, 225(2), 498-503.
19. Beata Bystrowska, Jolanta Nowak and Jerzy Brandys, J Pharma Biomed Anal., 2000,
22(2), 341-347.
20. Nobilis M, Vybiralova Z, Sladkova K, Lisa M, Holcapek M and J Kvetina, J
Chromatogr A, 2006, 1119(1-2), 299-308.
21. Lecompte S, Simard M, Gauthier G and Donato L Di, A sensitive HPLC Method
for the Determination of Mesalamine and its Metabolite in human Plasma using
Fluorescence Detection., Phoenix International Life Sciences., Montreal, PQ
Canada, 2000; www.aapsj.org/abstracts/AM_2000/2596.htm

148 TRIVEDI RAKSHIT K. et al.
22. Hussain F N, Ajjan R A, Moustafa M, Anderson J C and Riley S A, J Chromatogr B,
1998, 716(1-2), 257-266.
23. Palumbo G, Carlucci G, Mazzeo P, Frieri G, Pimpo MT, Fanini D, J Pharm Biomed
Anal., 1995, 14(1-2), 175-180.
24. Predrag Novak, Predrag Tepes, Ines Fistric, Lgor Bratos and Vesna Gabelica, J
Pharma Biomed Anal., 2006, 40(5), 1268-1272.
25. Joan Jensen, Claus Cornett, Carl Erik Olsen, Jette Tjornelund and Steen Honore
Hansen, Int J Pharma., 1992, 88(1-3), 177-187.
26. Tang J, Sharif O, Pai C and Silverman A L, Dig Dis Sci. 2010, 55(6),1696-1703.
27. Brian S. Kersten, Tom Catalano and Yury Rozenman, J Chromatogr A, 1991, 588(1-2),
187-193.
28. Haney P W, Dash A K, J Chromatogr A, 1997, 765(2), 233-239.
29. Arbad B R and Jadhav S M, Asian J Chem., 2000, 12(1), 294-296.
30. Majji Sunil, Srinivasa Rao K and Rao M E B, Analytical Chemistry, An Indian
Journal, 2008, 7(7), 546-550.
31. Biljana Nigovi and Branimir Imuni, J Pharma Biomed Anal., 2003, 32(1), 169-174.
32. Lee Allen, Julie Weinberger and Robert Weinberger,.J Chromatogr A, 2004,
1053(1-2), 217-226.
33. Roberto Gotti, Romeo Pomponio, Carlo Bertucci and Vanni Cavrini, J Chromatogr A,
2001, 916(1-2), 175-183.
34. Janice Aparecida Rafael, jose Roberto Jabor, Rubia Casagrande, Sandra Regina
Georgetti,Maria de Fatima Borin and Maria Jose Vieira Fonseca, Brazilian J Pharma
Sci., 2007, 43(1), 97-103.
35. United States Pharmacopeia, USP32-NF27, p 2895.
36. United States Pharmacopeia, USP32-NF27, p 2897.
37. United States Pharmacopeia, USP32-NF27, p 2894.
38. British Pharmacopoeia, BP- 2010, p 1368.
39. ICH, Validation of Analytical Procedure, Text and Methodology Q2 (R1):
International conference on Harmonization, IFPMA, Geneva, 2005.
40. ICH, Stability testing of New drug Substances and Product (Q1AR), International
conference on Harmonization, IFPMA, Geneva, 2002.
41. Genotoxic and Carcinogenic Impurities in drug Substances and Products:
Recommended approaches. FDA Center for Drug Evaluation and Research. Guidance
for Industry (Draft), 3 December 2008.
42. Derek I Robinson, A review and Perspective Organic Process Research and
Development, 2010, 14, 946-959.

Submit your manuscripts athttp://www.hindawi.com
Hindawi Publishing Corporationhttp://www.hindawi.com Volume 2014
Inorganic ChemistryInternational Journal of
Hindawi Publishing Corporation http://www.hindawi.com Volume 2014
International Journal ofPhotoenergy
Hindawi Publishing Corporationhttp://www.hindawi.com Volume 2014
Carbohydrate Chemistry
International Journal of
Hindawi Publishing Corporationhttp://www.hindawi.com Volume 2014
Journal of
Chemistry
Hindawi Publishing Corporationhttp://www.hindawi.com Volume 2014
Advances in
Physical Chemistry
Hindawi Publishing Corporationhttp://www.hindawi.com
Analytical Methods in Chemistry
Journal of
Volume 2014
Bioinorganic Chemistry and ApplicationsHindawi Publishing Corporationhttp://www.hindawi.com Volume 2014
SpectroscopyInternational Journal of
Hindawi Publishing Corporationhttp://www.hindawi.com Volume 2014
The Scientific World JournalHindawi Publishing Corporation http://www.hindawi.com Volume 2014
Medicinal ChemistryInternational Journal of
Hindawi Publishing Corporationhttp://www.hindawi.com Volume 2014
Chromatography Research International
Hindawi Publishing Corporationhttp://www.hindawi.com Volume 2014
Applied ChemistryJournal of
Hindawi Publishing Corporationhttp://www.hindawi.com Volume 2014
Hindawi Publishing Corporationhttp://www.hindawi.com Volume 2014
Theoretical ChemistryJournal of
Hindawi Publishing Corporationhttp://www.hindawi.com Volume 2014
Journal of
Spectroscopy
Analytical ChemistryInternational Journal of
Hindawi Publishing Corporationhttp://www.hindawi.com Volume 2014
Journal of
Hindawi Publishing Corporationhttp://www.hindawi.com Volume 2014
Quantum Chemistry
Hindawi Publishing Corporationhttp://www.hindawi.com Volume 2014
Organic Chemistry International
Hindawi Publishing Corporationhttp://www.hindawi.com Volume 2014
CatalystsJournal of
ElectrochemistryInternational Journal of
Hindawi Publishing Corporation http://www.hindawi.com Volume 2014