determination of physical and chemical stability in...
TRANSCRIPT

1
Determination of Physical and Chemical Stability in Pressurised Metered Dose Inhalers
(MDIs): Potential New Techniques
Jesslynn Ooi1, Daniela Traini1, Ben J Boyd2, Simon Gaisford3, Paul M Young*1
1Respiratory Technology, The Woolcock Institute of Medical Research, Sydney, Australia &
School of Medicine, Discipline of Pharmacology, University of Sydney, Australia 5
2Monash Institute of Pharmaceutical Sciences, Monash University, 381 Royal Parade,
Parkville, Victoria 3052, Australia
3School of Pharmacy, University College London, 29-39 Brunswick Square, London, WC1N
1AX, United Kingdom
10
*To whom correspondence should be addressed.
+61 2 9114 0350
Keywords: pressurised metered dose inhalers, drug stability, fast screening techniques, 15
Raman, laser diffraction, isothermal calorimetry

2
Abstract
The pressurised metered dose inhaler (pMDI) is one of the oldest and most commonly
prescribed therapeutic systems for drug delivery to the lung. pMDIs are subject to rigorous 20
physical and chemical stability tests during formulation and prior to commercial approval.
Due to the time and cost associated with formulation and product development studies, there
is a need, especially within an industrial setting, for novel techniques that allow fast screening
of new formulations in terms of physical and chemical (physico-chemical) stability. The key
problem with achieving this goal is in the nature of pMDI formulations. While conventional 25
intravenous, oral and topical formulations are in a solid-state at STP, pMDIs are by their
definition, pressurised, making the direct observation of physico-chemical properties in situ,
difficult.
Areas covered
This review highlights the state-of-the-art techniques and physico-chemical characterisation 30
tools that can potentially enhance the formulation and product development process for
pMDIs. Techniques investigated include: laser diffraction, Raman spectroscopy, isothermal
ampoule calorimetry, titration calorimetry and gas perfusion calorimetry. These are discussed
in the context of pharmaceutical development, with a focus on their use for the determination
of the physical and chemical stability in pMDI delivery systems. The operational principles 35
behind each technique are briefly discussed and complemented with examples from the
literature. The strengths and weaknesses of the above techniques are highlighted with the
purpose of guiding the reader to identify the most promising technique.
Expert opinion
Each technique has a unique set of advantages and disadvantages. Laser diffraction is 40
theoretically well placed to analyse real-time physical stability as a function of particle size,
however its use is restricted to suspension MDI formulations. Raman spectroscopy requires
little sample preparation and can be potentially used to attain both suspension and solution
pMDI spectra in real time, however the majority of experiments are ex-valve chemical
composition mapping. The next logical step in the development of Raman spectroscopy for 45
online pMDI monitoring is to begin in situ solid state analysis. Calorimetry is an effective
technique in capturing both chemical and physical degradation of APIs in real time but
requires redevelopment to withstand pressure for the purposes of pMDI screening. A
combination of ampoule and gas perfusion calorimetry has the most potential to fast-screen
for drug-propellant compatibility within a commercial environment. 50
3
Abbreviations
ACI Anderson cascade impactor
ANDAs Abbreviated new drug applications 55
Arcton-113 1,1,2-tri-chloro-tri-fluoro-ethane
CFC Chlorofluorocarbon
CFC-11 Trichlorofluoromethane
DSC Differential Scanning Calorimetry
EtOH Ethanol 60
FDA Food and Drug Administration
FPF Fine particle fraction
FT Fourier transform
He-Ne Helium-neon
HFA Hydrofluoroalkane 65
HFA-134a 1,1,1,2-tetrafluoroethane
HFA-227 1,1,1,2,3,3,3-heptafluoropropane
HPLC High performance liquid chromatography
IR Infrared
ITC Isothermal titration calorimetry 70
MS Mass spectroscopy
NDAs New drug applications
O-H Oxygen-hydrogen
RH Relative humidity
pMDI Pressurised metered dose inhaler 75
SI International System of Units
STP Standard Temperature and Pressure
TAM Thermal Activity Monitor
UV Ultraviolet
80

4
1. Introduction
The pressurised metered dose inhaler (pMDI) is one of the oldest and most commonly
prescribed therapeutic systems for drug delivery to the lungs 1. The popularity of this drug
delivery system can be appreciated when observing its scale of growth in the global drug
delivery market. The pMDI sector is expected to account for 59% of the global market, 85
worth $22 billion, for drug delivery systems by 2017 2. The development of the first
commercial pMDI began in 1955 by Riker Laboratories (now 3M Pharmaceuticals, St Paul,
Minnesota) 3 and the original Medihaler design had key features (metering valve, canister,
actuator orifice and mouthpiece) which are still present in modern devices 1. Since the
original introduction in 1955, pMDI formulations and inhaler designs have evolved to solve 90
technical problems, notably patients’ uncoordinated inhalation technique 4, high
oropharangeal deposition, addition of dose counters 5 and the replacement of
chlorofluorocarbon (CFC) with more ‘ozone friendly’ hydrofluoroalkane (HFA) propellants
6.
95
The phasing out of CFC propellants in medical devices actively began in 1998 and was a
slow, gradual process. The last two CFC inhalers, Combivent Inhalation Aerosol (Boehringer
Ingelheim) and the Maxair Autohaler (Medicis Pharmaceutical Corporation) were taken off
the US market in July 2013 and December 2013, respectively 7. Advancements in pMDI
technology have focused on the delivery of drug with greater efficiency (including dosing 100
reproducibility, delivering combination therapy and formulating proteins/peptides into
pMDIs) and improving valve, elastomer and gasket design 8-10. A list of Food and Drug
Administration (FDA) approved products containing HFA, which are currently marketed in
the US, is shown in Table 2.
105
Drugs are formulated in either solution or suspension (Table 2). Drugs that exhibit a small
degree of solubility in HFA (i.e. have high enough solubility to be at risk from Ostwald
ripening) are solubilised with co-solvents (usually ethanol) and formulated in solution. Drugs
that are insoluble in HFA and ethanol co-solvent systems are prepared as a micron-sized
suspension in HFA11. In order to reach the lung successfully, aerosols from pMDIs must 110
generate particles of an appropriate size for their target. For conducting airway deposition this
is generally agreed to be between 3-6 µm and for small airways < 3 µm 11, 12. The
reproducibility of emitted dose and aerodynamic endpoints of the product are the primary
outcomes for successful formulation and are critically dependent upon the physical stability
5
of the active drug within the formulation. It is well known that suspension pMDI 115
formulations have the propensity to undergo either size-specific particle growth (Ostwald
ripening), especially if the drug has a small degree of solubility in HFA, or agglomeration
upon settling (flocculation and sediment compaction). These phenomena lead to variation in
emitted dose and aerosol size distribution, which will be detrimental to aerosol performance.
An excellent discussion on particle growth mechanisms in pulmonary dispersion formulations 120
is provided in a recent review article by O’Donnell et al 13.
The chemical stability of drugs in HFA is a further drug-specific issue, which must be
thoroughly screened. For example, the phenylalkylamino derivatives (eg. formoterol,
salbutamol) are prone to degradation due to their susceptibility to oxidative conditions 14. 125
Chemical instability is more likely to affect solution MDI products however 15, as
degradation rates in the solid state are generally orders of magnitude slower than in solution.
Furthermore, since water is likely to be present during the formulation process or during
storage (via water ingression) 16, hydrolytic degradation is a possibility 15. Polymorphic
screening of the active pharmaceutical ingredient must be performed as different 130
polymorphic forms have the potential to influence the performance and stability of the final
product 17.
1.1 Existing Basic Testing Requirements for pMDI stability
The chemical and physical properties of the drug determined prior to submission to the FDA 135
include density, particle size distribution, particle morphology, solvates and hydrates,
polymorphs, amorphous form, solubility profiles, moisture and residual solvent content,
microbial quality, dissociation constants and specific rotation of the drug. Assays to detect
impurities or degradation products are commonly performed, with liquid or gas
chromatography, and are either compared with products spiked with known impurities or 140
samples stored under relevant stress conditions (light, heat, humidity, acid/base hydrolysis
and oxidation) 18. Peak purity tests (diode array, mass spectroscopy) are typically included
in the latter case as impurity or degradation standards are not available in this situation 18.
For suspension formulations, tests to determine the particle size distribution and physical
properties (shape, crystal habit, morphology, surface texture) of the active are also essential, 145
as these parameters are fundamental for drug product reproducibility and performance.
Assays for preservatives or stabilisers are also included in the submission documentation, as

6
well as associated microbiological tests to determine if the formulation is susceptible to
microbial contamination and colonisation.
Stability testing is a crucial step to identify likely degradation products under the influence of 150
common stresses (temperature, humidity and light) and so by extension to assess the intrinsic
stability of the drug. A detailed stability protocol, based on ICH guidelines, is also required
for a minimum of 6 months for intermediate and accelerated storage conditions, and 12
months at long term stability studies prior to the submission to the FDA. Ongoing re-tests
intended for long-term ambient temperature and humidity studies are also conducted until the 155
point of product expiry, or re-testing at the 12 month mark for products which exhibit
instability during accelerated and intermediate studies 18. Stress testing is often repeated when
manufacturing processes and analytical processes are refined 19.
The analytical procedures to determine product acceptability for submission to the FDA and 160
ongoing stability studies include ultraviolet (UV) and infrared (IR) spectroscopy studies, high
performance liquid chromatography/mass spectroscopy (HPLC/MS), tests for identification
of the active drug, concentration assays and chirality assays to detect racemization if
applicable 20. The preferred method to detect degradation products is through reverse-phase
HPLC (with a UV detector or coupled to MS), as it is compatible with aqueous and organic 165
solutions, highly precise and sensitive. Samples held under stress conditions are commonly
screened with gradient method HPLC with varying mobile phase composition (usually low
organic to high organic solvent) to assess the elution pattern of degradation products and/or
related substances 21.
170
Arguably, several limitations exist for conventional stability testing. Conventional techniques
for determining drug degradation rates rely on product storage at elevated temperatures to
accelerate the process. In conducting these trials, it is assumed that the degradation process
follows the Arrhenius relationship 22. This may not be true as drug could undergo a phase
transition 23, moisture redistribution or a change in reaction mechanism. Consequently there 175
may be two or more reactions occurring simultaneously 24, or there may be alternative
decomposition mechanisms that are activated only at high temperatures. For example,
hydrate drugs or compounds that contain unbound water are prone to losing water at elevated
temperatures and therefore will display different degradation mechanisms at these
temperatures 25. Extrapolation to determine rate constants would most likely result in error in 180
calculating stability at ambient conditions. Other limitations include the sampling frequency;
7
if degradation plots have significant curvature or scatter, three or four data points may be
insufficient to determine linear fit of data. Thus many time points are required.
In addition to the aforementioned limitations, current techniques are dependent upon the
chosen sampling time within the ICH guidelines. The compatibility of the drug as a solution 185
or suspension in HFA is virtually unknown until the time of testing. Real-time analysis of
degradation and incompatibility would quicken product development and increase data
contribution to the Quality by Design (QbD) approach. There is an industrial need for novel
techniques that are capable of online monitoring and that could screen the compatibility of
new compounds/formulations with HFA propellant rapidly. This would prevent potentially 190
flawed products undergoing lengthy and costly stability studies. The subsequent sections of
this review will discuss techniques used to detect solid-state stability, and stability of drug in
both solution and suspension pMDIs.
2. Rapid screening approaches for MDI stability 195
2.1 Laser diffraction
2.1.1 Laser Diffraction – ex valve measurement
Laser diffraction is a standard method in particle sizing and is used commonly in the
pharmaceutical industry due to its short analytical time, reproducibility and high precision.
Briefly, laser diffraction measures particle size distributions by measuring the angular 200
scattering of light as it passes through a dispersed particulate sample. The changes in laser
projection after the particle interaction are complex, and vary as a function of the scattering
angle, particle size and shape and refractive index. The resultant diffraction pattern is
converted into a volume-based size, derived using mathematical algorithms, normally the
Lorenz-Mie theory of light scattering or the simplified Fraunhofer approximation 26, 27. The 205
reader is directed to the ISO standard for further discussion on the operation principles of
laser diffraction and information regarding the Mie theory and the Fraunhofer approximation
28.
Several research groups have investigated the in situ geometric growth of crystalline drugs
suspended in HFA propellant and the relation to aerosolisation and product stability post 210
actuation using laser diffraction systems. Smyth et al. investigated the effects of different
ratios of EtOH:HFA-134a and the subsequent effects on geometric and aerodynamic particle
size using both laser diffraction and an Anderson cascade impactor (ACI) 29. The fine particle
fractions (FPF) derived from both techniques were in striking agreement, although marked

8
differences in the raw values for mass median diameter were shown. Similarly, a study by 215
Haynes et al. highlighted the need to develop further the existing Sympatec unit to achieve
closer agreement with ACI data 27. Berry et al. have previously established the link between
increasing geometric particle size, measured as an aerosolised dry powder with a Sympatec
HELOS compact laser diffraction system, with increased aerodynamic particle size
distribution 30. This study was conducted on different production batches of corticosteroid 220
material and only the influence of geometric particle size upon aerodynamic particle size
diameter was assessed. Furthermore, sample pMDI formulations containing larger geometric-
sized particles were shown to be less stable under temperature cycling conditions, as particles
shifted towards a larger aerodynamic particle size and decreased stage recovery.
These laser diffraction methods have usually been conducted ‘ex valve’. However, to 225
investigate particle size and stability inside the canister extensive modification of the particle
size instrument is required to allow pressurized measurement.
2.1.2 In situ Laser Diffraction – in situ measurement in propellant
Jones et al. also manufactured two types of pressure cells designed to be used with a 230
Mastersizer X laser diffraction instrument (Malvern Instruments, Inc., Southborough, MA) 31.
The first type of pressure cell was a single sealed unit consisting of a plastic cell with two
optical borosilicate glass surfaces through which powder was first placed inside the unit and
HFA 134a propellant later filled through a specially adapted valve. The second unit was a
pressurized cell manufactured by Malvern instruments, which incorporated a re-circulatory 235
system and filling apparatus. Two methods of recirculation were used in the measurement of
the particle size distribution in HFA 134a suspension; continuous recirculation or stop flow
circulation. The novel pressure cell sizing system showed a linear correlation with twin-
stage impactor results (r2 = 0.8894; n=10) for particles < 6.4 µm for 8 novel HFA based
pMDIs and 2 commercial HFA pMDIs. The degree of shear applied to the re-circulation 240
system was a source of potential measurement error; if the degree of shear supplied was
insufficient there was a tendency to oversize the particles and likewise a process of over-
shearing resulted in the under sizing of particles. The authors obtained a strong correlation
between laser diffraction and impaction results with method optimization.
245
In summary the in situ laser diffraction method is well positioned to analyse the real-time
physical stability of suspended micro particles in HFA as a function of particle size. Laser

9
diffraction is reliable and capable of ongoing and online monitoring. Of significant
importance is the ability to use “real propellants” to mirror the drug stability in a commercial
product and its use can be expanded to study propellant combinations, titrations of surfactant 250
quantities or propellant-ethanol combinations. However laser light scattering also suffers
from a number of disadvantages, limiting its more widespread use in stability studies. Ex-
valve laser diffraction measurements are prone to beam steering as a result of propellant
vapour evaporation during the measurement. Beam steering may lead to changes in the
refractive index of the gas phase within the spray, which result in the overestimation of the 255
particle size distribution. The laser diffraction method for in situ pMDI particle size
measurements is restricted to suspension formulations, which accounts for just over half of all
currently marketable products in the US (Table 2). Whilst the technique is suited to detect
fast-occuring physical processes that happen internally in the pMDI canister in the analysis
time-frame, it is unsuited to detection of chemical processes, except in the situation of 260
particle size changes because of solvate formation. The mathematical calculation of the
volume based size measurement also assumes all the particles are spherical, whereas in
reality crystal growth will more commonly follow a needle-like or plate-like morphology and
display high axial ratio (length to width ratio) growth 32. The measurement of anisotropic
particles or irregular-shaped particles can lead to inaccuracies in the particle size distribution 265
33. Although the accuracy of laser diffraction measurement is absolutely necessary for the
correlation of geometric data to aerodynamic particle size or for submission purposes to the
FDA, the application of a fast-screening method only calls for the detection of significant
deviation from time point zero, so as to signal whether to progress with the formulation. “It
is important to note that any in situ laser diffraction measurement method must first be 270
optimized to ensure that particles are completely de-agglomerated to fully assess any changes
in the primary particle size distribution that may occur as a result of Ostwald ripening.
However it is also important to note that excessive shear in a re-circulation laser diffraction
system may prevent agglomeration that may have occurred as a result of formulation
instability. Suitable method development which reflects the level of shear stress inflicted by 275
patient on the canister prior to actuation would be a pre-requisite prior to using this technique
as an online monitoring tool. It is envisioned that further time-dependent ex-valve particle
size distribution measurements or direct APSD measurements can be made once a
formulation passes the initial in-situ stability screen.”
280
2.2 The mechanism and application of Raman spectroscopy to MDIs

10
Raman spectroscopy is an established technique for pharmaceutical and biopharmaceutical
applications and can provide a characteristic “fingerprint” of intramolecular vibrations, which
can be used to identify the molecular species, composition, the degree of order and disorder,
structure and conformation 34. Intermolecular interactions can also be identified through 285
Raman scattering. Raman spectroscopy is most sensitive to symmetrical covalent bonds, as
strong Raman scattering occurs with a larger change in the polarisability of the distribution of
the electron cloud. By extension, Raman spectroscopy can provide data on phases and phase
transitions, hydrogen bonding, polymorphs, hydrates, anhydrates, molecular conformation,
polymer chain confirmation 35, 36 and foreign particulate contamination 37. “Raman may also 290
have utility in the measurement of amorphous content in formulations with high sensitivity.
Vehring et al has previously used dispersive Raman technique to identify mixtures of
amorphous mannitol with a limit of quantification of 5% w/w 38. The use of dispersive
Raman spectroscopy in particular may be more sensitive than FT-Raman, as Raman
scattering cross sections and charge coupled device detector sensitivity increase with lower 295
excitation wavelengths.
Raman spectroscopy is also ideal for aqueous systems as highly polar bonds (eg. O – H
bonds) have a weak vibration and low Raman scattering due to their low polarisabilityRaman
is less susceptible to convolution by water compared with IR methods. Further discussion of
the theoretical aspects of Raman scattering is provided by Ozaki et al. 39 and an excellent 300
overview of the different types of Raman spectroscopy with respect to drug delivery systems
is given by Mansour et al. 35.
Raman scattering has been used to measure size, composition and temperature gradients of
drying droplets 34, 40-42 such as the evaporation of water from mixed water/glycerol droplets 305
43, ethanol/water droplets 41, 44, 45, methanol/water droplets 41, 1-propanol/water droplets 41,
coagulation of droplets 46, phase transitions of inorganic salts particles 47, 48 and chemical
reactions between binary droplets 45, 47. Raman spectroscopy can be used to elucidate
intermolecular interactions in the condensed phase, such as the hydrogen bonding that occurs
in liquid water 49, 50. 310
Quinn et al. were the first to use Fourier Transform Raman (FT – Raman) spectroscopy as an
analytical tool to assess lysozyme protein conformation in suspension formulations in the
HFA propellants tetrafluoroethane (HFA-134a) and heptafluoropropane (HFA-227) 51.
Additionally, this study was the first to capture the background Raman spectra of both HFA-315

11
134a and HFA-227 with excellent signal-to-noise ratio. Descriptions of vibrational modes
(e.g. stretch, deformation) were assigned to particular wavenumber bands. The structural
integrity of lysozyme in HFA-134a and HFA-227 was elucidated by subtracting the spectra
of the blank propellants from the Raman spectra of the HFA – lysozyme suspensions. FT –
Raman spectroscopy provided structural information of the lysozyme backbone, disulfide 320
bonds and C-C stretching vibrations.
Hot-stage Raman spectroscopy has been used by Bouhroum et al. to study beclomethasone
dipropionate – CFC-11 clathrate stability as a function of temperature 52. The release of
propellant CFC-11 from the clathrate structure was successfully captured by examining the 325
wavenumber shift corresponding to the carbonyl peak of the clathrate.
Raman chemical imaging has been used to map the chemical composition of combination
pMDI deposition patterns 53, 54. For example, Steele et al., studied the Raman shift of
salbutamol and beclomethasone from a Ventide combination formulation on stages 3 and 5 of
an Anderson Cascade impactor and correlated the data with conventional analytical 330
methodologies 53. Similarly, Raman chemical imaging of salmeterol xinafoate and fluticasone
propionate from combination inhalers suggested interparticulate agglomeration and chemical
synergy whilst budesonide/formoterol formulation spectra showed the distribution of the two
drugs on the ACI to be separate 54.
335
Raman characterisation is also applicable to the detection of bioaerosols and could contribute
to future screening techniques for microbial contamination of MDIs. Aerosolised aqueous
suspensions of Escherichia coli, Pseudomonas aeruginosa and Salmonella typhimurium have
been examined using Surface-enhanced Raman spectroscopy (SERS) at concentrations as low
as 103 cfu/mL 55. SERS suppresses fluorescence, which originates from biomaterial 340
fluorophores, and amplifies the Raman signal 56. Recently Schwarzmeier et al. developed a
label-free microarray readout based on SERS which was capable of detecting an Escherichia
coli laced nebulizer suspension at a limit of detection of 144 organisms per cubic centimetre
57. This detection method is beneficial and time saving, since the standard array methods are
based on incubation on agar plates, impaction and filtration. 345
Theoretically, the use of Raman spectroscopy for the online monitoring of drug stability in
inhalers confers a number of advantages. The Raman analysis sampling time is short and
therefore would expedite formulation development and the QbD approach. Spectra can be

12
obtained non-invasively with little sample preparation, thus avoiding costs and errors due to 350
preparation (eg. evaporation of propellant and grinding of drug sample which could lead to
changes in solid state). The major disadvantage of Raman scattering is that it is a weak effect,
as the incident photon is not absorbed and therefore is much smaller than the molecular
disturbance for fluorescence or infrared 58. Shifting the laser wavelength to the near infrared
spectral region (800 – 2500 nm or 12500 to 4000 cm-1 wavenumber) can avoid the 355
fluorescence overlap in most cases. The measurement container must also be transparent to
visible or near-infrared laser light to minimize spectra interference.
2.3 Isothermal calorimetry
Calorimetry operates on the principle of detecting heat (a universal accompaniment to 360
chemical and physical change). A material may change its physical form or chemical
structure through the interaction with another species or as a result of environmental
conditions. The measurement of this change is crucial to determining the time frame in which
the transformation would occur. Measurement of the heat output from a process (q, SI units
Joules) will give thermodynamic information, while the measurement of heat output with 365
time (dq/dt) conveys kinetic information. Thermodynamics, which is the study and
quantification of transformations of energy, is a core principle on which calorimetry is based.
Thermodynamics is concerned with heat (q) and its relation to the two process-dependent
terms: energy (U) and work (w), and macroscopic variables of volume, pressure and
temperature associated with those systems. Further explanation of thermodynamics in 370
relation to calorimetry is given by Gaisford and O’Neill 59, 60.
As heat is a universal accompaniment to chemical and physical change, calorimetry is well
placed to study non-destructively long-term chemical and physical events such chemical
degradation, ageing, recrystallisation or the formation of hydrates/solvates. The technique 375
itself is sufficiently sensitive to allow detection of degradation directly under storage
conditions, which is a major advantage when checking product viability. The sensitivity of
isothermal calorimetry has been proven to be a useful method to confirm solid-state
degredation rates. Its precision exceeds standard methods such as determination of
degredation through time course chemical degredation studies followed by HPLC to 380
determine activation energies 23, 25 and overcome limitations such as the need for a suitable
chromophore and the requirement to measure in solution form 59. Three types of isothermal

13
calorimetry instrumentation are discussed in the sections below: ampoule calorimetry,
titration calorimetry and gas perfusion calorimetry.
385
2.3.1 Ampoule calorimetry
Ampoule calorimetry is the most common type of isothermal experiment. The setup involves
sealing the material or test subject in an ampoule, typically constructed from glass or metal.
Ampoules typically contain up to 20 mL of sample 61. Pharmaceutically, this is the most
direct method to study heterogeneous systems (e.g. creams and emulsions) as well as solids 390
and liquids 60.
Several studies have compared ampoule calorimetry with the established HPLC technique to
assess its potential to measure long-term solid-state stability 23, 25, 62, 63. Koenigbauer utilized
the Arrhenius equation (Equation 5) to estimate the degradation rate using data obtained by
both HPLC and ampoule isothermal calorimetry. 395
𝑘 = 𝐴𝑒−𝐸𝑎/𝑅𝑇
ln 𝑘 = ln 𝐴 −𝐸𝑎
𝑅𝑇 (Equation 5)
Where k = initial rate constant
A = pre-exponential factor
R = gas constant 400
T = absolute temperature
Ea = activation energy
The heat output (q) was recorded for drugs sealed in calorimetric ampoules at varying
measuring temperatures ranging from 40 °C to 80 °C. Assuming a zero-order reaction rate, 405
the relationship between heat output and rate constant is as such: (Equation 6).
𝑞
𝐷0= −∆𝐻𝛽𝑘 = 𝐶 = 𝑐𝑜𝑛𝑠𝑡𝑎𝑛𝑡
q = rate of heat output (Joules)
D0 = initial amount of drug present
ΔH = enthalpy change for the reaction 410
β = reactive portion of the sample
k = initial rate constant (Equation 6)

14
If enthalpy (∆H) and the reactive portion of the sample (β) are assumed not to be a function 415
of temperature, it is apparent that the rate constant (k) is proportional to heat output (q)
(Equation 7).
q = Ck (Equation 7)
By plotting ln k against the reciprocal of temperature it is possible to extrapolate back to
ambient temperature and determine the rate constant at that temperature. The findings by 420
Koenigbauer demonstrated that isothermal calorimetry was proven to be more precise than
conventional HPLC and could determine slow degradation rates that could not be determined
with HPLC (e.g. phenytoin, triamterene, diltiazem, theophylline) 25. Otsuka et al. applied
ampoule isothermal calorimetry to study two different mechanisms of degradation: oxidation
and hydrolysis 62. Meclofexonate hydrochloride was the drug of choice to study degradation 425
by hydrolysis and dl-α-tocopherol was chosen to model the oxidation process. Ampoule
calorimetry was compared with the traditional HPLC method. The degradation rate constant
for meclofexonate hydrocholoride was shown to follow first order rate kinetics in an aqueous
environment, and was calculated to be 1.29 x 10⁻⁴ s-1 by HPLC and 1.14 x 10⁻⁴ s-1 by the
calorimetric method. This indicates that calorimetry is well placed to accurately determine 430
degradation constants.
Dl-α-tocopherol, a viscous liquid, was exposed to varying intervals of oxygen before sealing
and measuring with the calorimeter. An Arrhenius plot was derived from a combination of
both HPLC and isothermal calorimetry methods, with HPLC used to determine degradation 435
rates from temperatures 80 - 50°C and isothermal calorimetry 40 – 23 °C. No marked
discrepancy was observed in the linear regression drawn between the two methods. The study
further concluded that the HPLC method would require a period of one year or more to
determine the dl-α-tocopherol rate constant at lower temperatures (23 °C) and thus isothermal
calorimetry was suggested to be highly advantageous in this circumstance. Tan et al. used 440
microcalorimetry to investigate the solid state stability of 13-cis-retinoic acid and 13-trans-
retinoic acid in the presence and absence of oxygen 63. Rates of degradation of both
compounds were determined through microcalorimetry and confirmed with HPLC. Both
half-life and shelf lives at room temperature could be extrapolated from rates of degradation.
Samples in the absence of oxygen displayed first order reaction kinetics from 445
microcalorimetry, but HPLC analysis showed no degradation, which suggests that
microcalorimetry was able to detect a physical change.

15
Similarly, an ampoule isothermal calorimetry study was conducted by Pikal et al. on
cephalosporins in the solid state form which concluded that the technique was capable of 450
detecting decomposition rates as low as 1% per year with an overnight experiment 23. All of
the studied amorphous compounds and the crystalline non-stoichiometric hydrate of
ceftazidime showed decreased stability at higher water content, which was expected as water
is a likely reactant in the decomposition of cephalosporins. Pikal also theorized that the
annealing process, which is the decrease in energy of an amorphous solid as a function of 455
storage time, contributes to the thermal activity of amorphous solids but its contribution
decreases as a sample approaches equilibrium.
Recently, a study by D’sa et al., sought to utilise ampoule isothermal calorimetry to expedite
the detection of instability of MDI formulations 64. The authors cold-filled aluminium 460
ampoules with HFA-134a and later added model drugs, spray-dried beclomethasone
dipropionate and spray-dried formoterol fumarate, to assess the viability of the isothermal
calorimetry method. Three parameters were identified to be crucial in obtaining an accurate
signal: the preconditioning of the ampoule O-ring, the hermetic sealing of the ampoule and
the HFA-134a fill volume. The authors provided an advance in utilizing the ‘real’ propellant 465
intended for MDI formulation and, provided solutions for issues with propellant leakages.
The method presented is currently the most direct method to study thermal interactions
arising from drug-propellant interactions. However the equilibration period (up to 30 min)
limits the method from fully capturing crystallization events, especially those that occur
rapidly. The addition of amorphous drug to a cooled HFA environment may also lower the 470
rate of crystallization, and therefore artificially lower the heat output (q) (Equation 6) 65.
2.3.2 Titration calorimetry
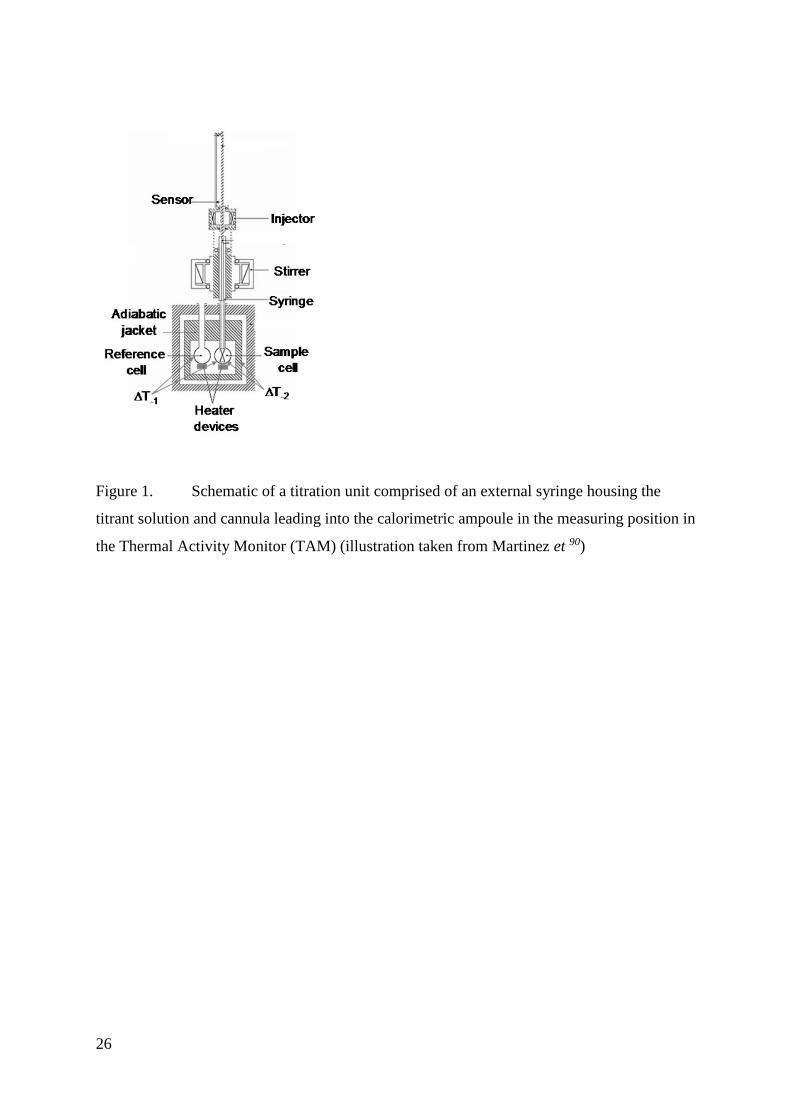
In isothermal titration calorimetry (ITC), small volumes of titrant solution are added
sequentially to a solution of substrate held within the calorimetric vessel (Figure 1). The 475
number of titrations is calculated to ensure the reaction progresses past its end point.
Integration of the data allows construction of a binding isotherm, from which the binding
constant can be determined. Several control experiments are needed to take into account
dilution of the substrate and dilution of the ligand. An example of ITC used to study pMDI
formulations is provided in Figure 2; the surfactant polyethylene glycol was titrated into a 480

16
suspension containing spray dried salbutamol sulphate in decafluoropentane to ascertain the
ideal ratio of surfactant coverage to surface area of drug.
As heat is ubiquitous, isothermal calorimetric data are limited in specificity, but conversely
the technique is ideally suited to study complex, heterogeneous samples. Isothermal titration 485
calorimetry has been extensively employed to academically study the self-assembly of
micellar systems 66-69, drug – surfactant interactions 70-72, polymer – surfactant interactions 73,
74, ligand binding 75-77, enzyme activity 78, 79, protein – protein reactions 80, 81, lipid – lipid
systems 82 and lipid – small molecule interactions 83. A broader summary of isothermal
titration calorimetry applications from 2010 can be found in Ghai et al. 84. Multiple studies 490
have utilised isothermal titration calorimetry to investigate the energetics of surfactant-based
systems 71, 85, 86. The majority of these studies have been conducted in an aqueous medium;
however there is one key study that is of relevance to pMDI systems. Blackett et al.
investigated the absorption of oleic acid and Span 85 onto amorphous and crystalline
salbutamol sulphate in an attempt to assess the effect of surface energy properties on 495
surfactant – drug interactions in Arcton-113, a model propellant (1,1,2-tri-chloro-tri-fluoro-
ethane) 86. Three batches of salbutamol sulphate were used; freshly milled, milled and stored
at 78% relative humidity (RH) for 72 hours to encourage re-crystallisation, or stored at 78%
RH for 72 hours and returned to 0% RH for at least 24 hours to reproduce an “aged dry
sample”. Samples (50 mg) of each batch of salbutamol sulphate were suspended in Arcton-500
113. It was established that the freshly milled sample was partially amorphous, whilst the
crystalline samples were shown to be > 99.7% crystalline (the detection limit for crystalline
materials using ampoule isothermal calorimetry). Two solutions, oleic acid and Span 85 in
Arcton-113, were titrated separately into the calorimeter ampoule containing the suspension
of drug in the non-polar model propellant. Calorimetric data revealed that adsorption of both 505
surfactants onto partially amorphous surfaces produced a net endotherm as surfactant
concentration increased, which was a result of a combination of exothermic (surfactant
adsorption) and endothermic (particle deaggregation) events. Crystalline samples did not
disperse when surfactant was added, which therefore resulted in a net exothermic event with
respect to surfactant concentration. Titration calorimetry was a suitable technique to probe 510
liquid-surfactant-drug interactions in the model pMDI system in real time.
Despite the promise for the detection of key events associated with pMDI stability, ITC
suffers from a lack of ability to use commercial propellants, which are only liquid under

17
elevated pressure, and requires redevelopment to withstand pressures up to and beyond 6.7
Bar. 515
2.3.3 Gas perfusion calorimetry
Gas perfusion calorimetry involves the controlled flow of vapour over a solid sample in the
measuring ampoule of the calorimeter. The vapour is commonly an organic solvent or
humidified air and is specifically chosen to interact with the sample in some way. The vapour 520
is transported using a carrier gas, usually nitrogen, which passes through two solvent
reservoirs prior to the measuring ampoule. A second gas line is used to carry a dry gas, also
usually nitrogen. Mass flow controllers are used to regulate gas flow along the two line;
defined partial pressures of vapour can be created by proportional control of the flow rates.
Partial pressure can be altered either in steps or a linear ramp. Typical examples of gas 525
perfusion calorimetry include the use of vapour to probe specific binding sites on the sample
surface, wetting the sample to induce the formation of hydrates or solvates and inducing
recrystallisation of an amorphous material 60.
Originally, the determination of amorphous content in powders was conducted by introducing 530
a glass hydrostat containing either a reservoir of pure water or salt solution into an ampoule
calorimeter 87. The first published study, conducted by Briggner et al., utilised isothermal
calorimetry to investigate the crystallisation of spray-dried and micronised lactose
monohydrate 87. It was found that the amount of amorphous material produced by
micronisation was directly proportional to the microcalorimetric observations correlated to 535
the recrystallisation of lactose in response to humidity exposure. It was proved that the
detection limit of the percentage of amorphous material was 1% or less, which far exceeded
the 5-10% limit of detection for differential scanning calorimetry (DSC) and X-ray Powder
Diffraction (XPRD) 22. Ahmed et al. investigated the use of gas isothermal calorimetry
using organic vapours to characterize the amorphous content of drugs with poor aqueous 540
tolerability. The study agreed with previous literature, and identified a detection limit of 1%
amorphicity 88. With the advent of the gas perfusion device, the exact RH or relative vapour
pressure experienced by the sample can be controlled by adjusting the flow rates of the purge
gas through the dual lines 59.
545

18
The isothermal gas perfusion apparatus has been used in a recent study by Ooi et al. to
investigate the interaction of model propellant 2H,3H-decafluoropentane with
beclomethasone dipropionate and salbutamol sulphate 89. The early stages of beclomethasone
dipropionate-decafluoropentane clathrate formation were successfully captured. The stability
of salbutamol sulphate in HFA-227 was also predicted using microcalorimetry coupled with 550
multiple analytical methods. The disadvantage of this technique is the inability to currently
utilize pressurized liquids at STP. The substitution of HFA with the higher molecular weight
HPFP model propellant gives an indication of API stability in HFA but a shift towards
utilizing true HFA propellants is necessary for the further development of this technique.
The replacement of the internal perfusion shaft O-rings and the redesign of the mass flow 555
controllers are factors to consider when developing gas perfusion calorimetry to withstand
fluorinated propellants.Broadening the selection of powders to include commercially
manufactured active pharmaceutical ingredients for gas perfusion testing is necessary to
compare this method with traditional long-term studies.
560

19
3. Conclusions
This review has examined the use of analytical techniques, such as Raman spectroscopy,
isothermal ampoule microcalorimetry, titration calorimetry and gas perfusion calorimetry, in
the context of their potential use by the pharmaceutical industry in pharmaceutical 565
development of pMDI formulations. The main focus was to determine their potential use for
screening the compatibility of active pharmaceutical ingredients, excipients and propellant in
metered dose inhalers, particularly as fast-screening technologies for accelerating the
development time of pMDI formulations.
570
Each technique has a set of unique advantages and disadvantages. The in situ laser
diffraction method is well positioned to analyze real-time physical stability as a function of
particle size. It is simple to operate and cost effective, however the analysis is restricted to
only pMDI suspension formulations and more suited to fast-occurring physical processes,
which happen in the analysis time-frame. Theoretically it may be possible to correlate 575
particle growth rate to the shelf-life of the product, if the API undergoes a prolonged rate of
degradation.
Raman spectroscopy is effective as it is non-invasive, requires little sample preparation and
can potentially be used to attain chemical stability data from both suspension and solution 580
pMDIs as the spectra for hydrofluoroalkanes has already been documented. . Whilst
component-specific Raman chemical imaging have been recently made available, current
techniques rely on assessing the particle size distribution and chemical composition after
propellant evaporation and particle impaction onto an ACI stage. This current technique is
suited for indirectly assessing drug-drug and drug-excipient aggregation, after the 585
evaporation of the propellant vehicle. The next logical step in the development of Raman
characterization for drugs in propellant vehicles is to begin in situ solid state analysis. It has
already been shown that FT-Raman is suitable for analysis of in situ protein stability in HFA
suspensions as it is cost effective, reproducible, efficient and requires little sample
pretreatment. Opportunities to develop an online Raman characterization method rely on 590
further organic drug compound studies in HFAs to assess the method’s sensitivity in
determining chemical changes in real time and in situ.
Calorimetry is effective as it is able to detect both chemical and physical degradation of an
API as a function of heat; however it is unfortunately unable to distinguish between the two

20
processes. Whilst this is not absolutely necessary if calorimetry is to be used as a fast-screen 595
method for API-propellant compatibility, additional tests will be required to determine the
reason for drug instability. Ampoule calorimetry, whilst it can be adapted to be filled with
pressurized HFA, is unable to detect rapidly occurring degradation events, as an initial
calibration and temperature stabilization of the sample ampoule is required prior to
measurement. It is thus challenging to determine accurately the overall rate of degradation. 600
Loss of the initial data does not occur when gas perfusion calorimetry or titration calorimetry
are used. Both gas perfusion and titration calorimetry are currently well placed to measure
solid-gas or solid-liquid interactions and have been used with model HFA propellants, but
require re-development to withstand pressures of up to and beyond 6.7 Bar to mirror
pressures in a typical liquid HFA-134a environment. The correlation of enthalpy to particular 605
formulation parameters, namely the EtOH-HFA ratio, drug-surfactant ratio, drug degradation
rates, canister pressure and excipient compatibility are areas that could be assessed with this
dual system and quicken formulation development. The possibility of studying elastomer
swelling or valve degradation in pressurized hydrofluoroalkane is another possibility and can
be achieved by substituting the powdered sample for the elastomer or valve material in the 610
TAM ampoule. Future TAM studies will need to utilize high percentage crystallinity
particles with clean, predictable surface characteristics to mirror more closely an industrial
micronized drug product. The “whole system approach” of ampoule calorimetry combined
with the investigations of the initial propellant-drug reaction with gas perfusion calorimetry is
best placed to fast-screen for drug-propellant compatibility and has the most extensive 615
application set for pMDI testing within a commercial lab. The study of the phase
transformations of organic compounds under pressure is another area of development that is
complementary to thermal analysis. Further developments on the kinetics of propellant
mediated phase transformation of organic compounds with synchrotron SAXS/WAXS
radiation will be beneficial in identifying intermediate organic phases and contributing to the 620
a high throughput for formulation development.
21
Expert Opinion
Understanding the factors that affect API stability in hydrofluoroalkanes has been the focus 625
of much empirical research within the last 20 years, since the switch from the
chlorofluorocarbons to hydrofluoroalkane propellant vehicle. Previous pMDI research has
focused on separate failure modes for pMDIs, including solubilisation properties of the
hydrofluoroalkanes and propellants, the interaction of propellant and active pharmaceutical
ingredients, the chemical interaction between multiple pharmaceutical ingredients in a 630
propellant environment, the interaction of ingredients with device components and the effects
of water and leachables.
The achievement of a functional online monitoring tool seeks to detect formulation defects,
which may involve more than one mode of failure. The detection of issues with formulation
quality prior to stability testing will benefit the pharmaceutical industry immensely, in terms 635
of improving manufacturing efficiency, reducing waste and shortening the development time
for new products. There are also immediate, practical and financial benefits associated with
pulling products which are deemed unsuccessful prior to undergoing lengthy stability studies.
Substantial progress has been made towards developing online monitoring tools for pMDI
production; the key chemical and physical properties of propellants have been documented 640
along with compatibility studies involving elastomers and plastics and solubility studies with
APIs. Background infra-red and raman spectra of propellants have been documented by
academic groups. In situ experiments involving characterisation of APIs in a pressurised
propellant environment have been developed using laser diffraction, isothermal calorimetry,
and Raman spectroscopy. Key findings in the literature indicate that there is practical 645
application of the aforementioned methods to stability testing as these methods are relatively
fast, easy to operate, require little sample preparation and are capable of being integrated into
pMDI formulation development or batch testing.
However, several challenges are apparent in above approaches for stability testing. Firstly,
they are not designed to detect pMDI failures associated with the device, which includes 650
batch to batch variations on pMDI seals and gaskets, slight leakages, leachables from both
sealing and canister materials, canister material properties and coatings or actuator
malfunctions. The possibility of studying elastomer swelling or valve degradation in
pressurized HFAs can be achieved by substituting the powdered sample for the elastomer or
valve material in the calorimetric ampoule. It is also possible to mimic the canister surface in 655

22
calorimetric experiments by coating the internal surfaces of sample and reference ampoules
with polymeric materials. If the latter is chosen, recalibration of the instruments will be
required to take the different heat conduction properties into account. Calorimetric methods
may be the most sensitive method to determine both chemical and physical stability, however
further developmental work must be performed to define the enthalpy limits for in situ 660
crystallisation, agglomeration and/or dissolution. Another disadvantage for the screening
methods is that the reason for pMDI failure may not be readily apparent. The inclusion of
ethanol in metered dose inhaler formulation is another dimension which must be considered;
solubilisation of the API via ethanol will transform the suspension into a solution, thus
causing in situ laser diffraction measurements to be ineffective. 665
Future work in this field of study must be directed to determine the limit of detection for the
above methods, and attempt to establish a relationship between the residual aerodynamic
particle size distribution and the rate of in situ API crystallisation, sedimentation or
agglomeration. Despite the technical challenges encountered for predicting formulation
stability in pMDIs, pre-emptive screening approaches are highly sought after due to the 670
immediate benefits for manufacturing efficiency, waste reduction strategies and pMDI
formulation.

23
Technique Typical
outcome
measured
Special
equipment
needed
Advantages Disadvantages
Laser
diffraction
Size by volume
diameter
Modification
to allow
pressurized
measurement
(in-situ
measurement)
Transparent
portal to
allow for
measurement
Real time
measurement and
ability to extract
kinetic data
Correlation between
laser diffraction data
(ex-valve)
measurements and
aerodynamic particle
diameter in some
circumstances 29, 30
Methodology, in particular
levels of shear, needs to be
assessed in a recirculation
in situ system
Unable to characterize
solution MDIs
Prone to beam steering
Measurement of
anisotropic particles can be
inaccurate
Unsuited to detect chemical
processes, except processes
involving change in
geometric diameter
Raman
spectroscopy
Solid state
characterization:
phase
transformations,
polymorphs,
hydrates,
anhydrates,
molecular
conformation,
polymer chain
confirmation
Transparent
measurement
container
Non invasive
Little sample
preparation
Applicable to
bioaerosols and can
be potentially used
for microbial
screening
Potential for online
monitoring of solid
state changes
Raman scattering is a weak
effect. May require
method development to
reduce spectra interference
Isothermal
calorimetry
Thermodynamic
and kinetic
information, and
probing of
liquid-surface-
drug
interactions in
pMDI systems
Modification
to allow
pressurized
measurement
(in-situ
measurement)64
Determination of
degradation through
time for both
chemical and
physical degradation
studies
Ability to
extrapolate long
term stability data
Equilibration period for
ampoule calorimetry
required, during which the
material may have
undergone change
Table 1. Advantages, disadvantages and special equipment required for the discussed
techniques. 675

24
Approva
l Date
Year
Approved
Drug
Name
Active Ingredient Formulatio
n
Company Strength Route
15-Aug 1996 Proventil-
HFA
Albuterol Sulfate Suspension 3M Eq 0.09mg Base/Inh Inhalation
24-Dec 1997 Sclerosol Talc Suspension Bryan 400mg/Spray Intrapleural
15-Sep 2000 Qvar Beclomethasone
Dipropionate
Solution Teva Branded Pharm 0.04mg/Inh
0.08mg/Inh
Inhalation
19-Apr 2001 Ventolin
HFA
Albuterol Sulfate Suspension Glaxo Grp Ltd Eq 0.09mg Base/Inh Inhalation
17-Nov 2004 Atrovent
HFA
Ipratropium Bromide Solution Boehringer Ingelheim 0.021mg/Inh Inhalation
14-May 2004 Flovent
HFA
Fluticasone Propionate Suspension Glaxo Grp Ltd 0.22mg/Inh
0.11mg/Inh
0.044mg/Inh
Inhalation
29-Oct 2004 Proair
HFA
Albuterol Sulfate Suspension Teva Branded Pharm Eq 0.09mg Base/Inh Inhalation
11-Mar 2005 Xopenex
HFA
Levalbuterol Tartrate Suspension Sunovion Eq 0.045mg Base/Inh Inhalation
8-Jun 2006 Advair
HFA
Fluticasone Propionate &
Salmeterol Xinafoate
Suspension Glaxo Grp Ltd 0.045mg/Inh & Eq
0.021mg Base/Inh
0.115mg/Inh & Eq
Inhalation

25
0.021mg Base/Inh
0.23mg/Inh & Eq
0.021mg Base/Inh
27-Jan 2006 Aerospan
HFA
Flunisolide Solution Acton Pharms Eq 78mg Base/Inh Inhalation
21-Jul 2006 Symbicor
t
Budesonide &
Formoterol Fumarate
Dihydrate
Suspension Astrazeneca 0.08mg/Inh &
0.0045mg/Inh
0.16mg/Inh
&0.0045mg/Inh
Inhalation
10-Jan 2008 Alvesco Ciclesonide Solution Takeda Gmbh 0.08mg/Inh
0.16mg/Inh
Inhalation
22-Jun 2010 Dulera Formoterol Fumarate
Mometasone Furoate
Suspension Merck Sharp Dohme 0.005mg/Inh &
0.1mg/Inh
0.005mg/Inh &
0.2mg/Inh
Inhalation
23-Mar 2012 Qnasl Beclomethasone
Dipropionate
Solution Teva Branded Pharm 0.08mg/Actuation Nasal
20-Jan 2012 Zetonna Ciclesonide Solution Takeda Gmbh 0.037mg/Inh Nasal
Table 2. FDA approved products containing HFA which are currently marketed in the US
26
Figure 1. Schematic of a titration unit comprised of an external syringe housing the
titrant solution and cannula leading into the calorimetric ampoule in the measuring position in
the Thermal Activity Monitor (TAM) (illustration taken from Martinez et 90)

27
Figure 2. Titration thermogram of polyethylene glycol 300 into model propellant
decafluoropentane.

28
References
1. Stein SW, Sheth P, Hodson PD, Myrdal PB. Advances in metered dose inhaler technology: hardware development. AAPS PharmSciTech 2014 Apr;15(2):326-38. 2. Research G. Drug Delivery Devices to 2017- Metered Dose Inhalers and Infusion Pumps to be Key Revenue Generators. Medical Devices, Industry Report. http://www.gbiresearch.com/ 2011. 3. Grossman J. The Evolution of Inhaler Technology. Journal of Asthma 1994;31(1):55-64. 4. Price D, Thomas M, Mitchell G, Niziol C, Featherstone R. Improvement of Asthma Control with a Breath-actuated Pressurised Metred Dose Inhaler (BAI): A Prescribing Claims Study of 5556 Patients Using a Traditional Pressurised Metred Dose Inhaler (MDI) or a Breath-actuated Device. Respiratory medicine 2003 Jan;97(1):12-9. 5. Administration FaD. Integration of Dose-Counting Mechanisms into MDI Drug Products. Guidance for Industry. http://www.fda.gov/downloads/Drugs/GuidanceComplianceRegulatoryInformation/Guidances/ucm071731.pdf 2003. 6. Secretariat O. The Montreal Protocol on Substances that Deplete the Ozone layer. United Nations Environment Programme, Nairobi, Kenya 2000. 7. Administration FaD. Users of Last CFC Inhalers Must Soon Switch. Consumer Health Information 2013. 8. Cummings RH. Pressurized Metered Dose Inhalers: Chlorofluorocarbon to Hydrofluoroalkane Transition-Valve Performance. Journal of Allergy and Clinical Immunology 1999 Dec;104(6):S230-6. 9. Leach CL. The CFC to HFA Transition and its Impact on Pulmonary Drug Development. Respiratory care 2005 Sep;50(9):1201-8. 10. Newman SP. Principles of Metered-dose Inhaler Design. Respiratory care 2005;50(9):1177-90. 11. Pritchard JN. The Influence of Lung Deposition on Clinical Response. Journal of Aerosol Medicine 2001;14 Suppl 1:S19-26. 12. Carvalho TC, Peters JI, Williams RO, 3rd. Influence of Particle Size on Regional Lung Deposition--What Evidence is There? International journal of pharmaceutics 2011 Mar 15;406(1-2):1-10. 13. O'Donnell KP, Williams RO, 3rd. Pulmonary Dispersion Formulations: the Impact of Dispersed Powder Properties on Pressurized Metered Dose Inhaler Stability. Drug development and industrial pharmacy 2013 Mar;39(3):413-24. 14. Lewis D, Ganderton D, Meakin B, Brambilla G, Ferraris A, inventors; Chiesi Farmaceutici S.P.A, assignee. Stable Pharmaceutical Solution Formulations for Pressurized Metered Dose Inhalers patent 6,716,414. 2004 April 6, 2004. 15. Soine W, Blondino F, Byron P. Chemical Stability in Pressurized Inhalers Formulated as Solutions. Journal of Biopharmaceutical Sciences 1992;3:41-7. 16. Williams RO, Hu C. Moisture Uptake and Its Influence on Pressurized Metered-Dose Inhalers. Pharmaceutical Development and Technology 2000;5(2):153-62. 17. Newman AW, Byrn SR. Solid-state analysis of the active pharmaceutical ingredient in drug products. Drug discovery today 2003 Oct 1;8(19):898-905. 18. Guideline IHT. Stability Testing of New Drug Substances and Products. Recommended for Adoption at Step 2003. 19. Alsante KM, Martin L, Baertschi SW. A Stress Testing Benchmarking Study. Pharmaceutical Technology 2003;27(2):60-73. 20. Food and Drug Administration CfDEaR. Nasal Spray and Inhalation Solution, Suspension,and Spray Drug Products — Chemistry, Manufacturing, and Controls Documentation. Guidance for Industry 2002. 21. Maheswaran R. FDA Perspectives: Scientific Considerations of Forced Degradation Studies in ANDA Submissions. Pharmaceutical Technology 2012;36(5):73-80.
29
22. Phipps MA, Mackin LA. Application of Isothermal Microcalorimetry in Solid State Drug Development. Pharmaceutical Science & Technology Today 2000;3(1):9-17. 23. Pikal MJ, Dellerman KM. Stability Testing of Pharmaceuticals by High-sensitivity Isothermal Calorimetry at 25 C: Cephalosporins in the Solid and Aqueous Solution States. International journal of pharmaceutics 1989;50(3):233-52. 24. Zografi G, Grandolfi GP, Kontny MJ, Mendenhall DW. Prediction of Moisture Transfer in Mixtures of Solids: Transfer via the Vapor Phase. International journal of pharmaceutics 1988;42(1):77-88. 25. Koenigbauer MJ, Brooks SH, Rullo G, Couch RA. Solid-State Stability Testing of Drugs by Isothermal Calorimetry. Pharmaceutical research 1992 Jul;9(7):939-44. 26. Triballier K, Dumouchel C, Cousin J. A Technical Study on the Spraytec Performances: Influence of Multiple Light Scattering and Multi-modal Drop-size Distribution Measurements. Exp Fluids 2003 Oct;35(4):347-56. 27. Haynes A, Shaik MS, Krarup H, Singh M. Evaluation of the Malvern Spraytec (R) with inhalation cell for the measurement of particle size distribution from metered dose inhalers. J Pharm Sci-Us 2004 Feb;93(2):349-63. 28. Jones RM. Particle Size Analysis by Laser Diffraction: ISO 13320, Standard Operating Procedures, and Mie Theory. Am Lab 2003 Jan;35(1):44-+. 29. Smyth HD, Hickey AJ. Multimodal Particle Size Distributions Emitted from HFA-134a Solution Pressurized Metered-dose Inhalers. AAPS PharmSciTech 2003;4(3):E38. 30. Berry J, Kline LC, Sherwood JK, Chaudhry S, Obenauer-Kutner L, Hart JL, et al. Influence of the Size of Micronized Active Pharmaceutical Ingredient on the Aerodynamic Particle Size and Stability of a Metered Dose Inhaler. Drug development and industrial pharmacy 2004 Aug;30(7):705-14. 31. Jones SA, Martin GP, Brown MB. High-pressure aerosol suspensions--a novel laser diffraction particle sizing system for hydrofluoroalkane pressurised metered dose inhalers. Int J Pharm 2005 Sep 30;302(1-2):154-65. 32. Phillips EM, Byron PR, Dalby RN. Axial-Ratio Measurements for Early Detection of Crystal-Growth in Suspension-Type Metered Dose Inhalers. Pharmaceutical research 1993 Mar;10(3):454-56. 33. Hamilton P, Littlejohn D, Nordon A, Sefcik J, Slavin P. Validity of Particle Size Analysis Techniques for Measurement of the Attrition that Occurs During Vacuum Agitated Powder Drying of Needle-shaped Particles. Analyst 2012;137(1):118-25. 34. Reid JP, Meresman H, Mitchem L, Symes R. Spectroscopic Studies of the Size and Composition of Single Aerosol Droplets. Int Rev Phys Chem 2007 Jan-Mar;26(1):139-92. 35. Mansour HM, Hickey AJ. Raman Characterization and Chemical Imaging of Biocolloidal Self-assemblies, Drug Delivery Systems, and Pulmonary Inhalation Aerosols: A Review. AAPS PharmSciTech 2007;8(4). 36. Olkhovyk O. Polymorph Identification of Drug Particles in Orally Inhaled and Nasal Drug Products (OINDPs). Respiratory Drug Delivery Europe. Berlin, Germany 2013:295-8. 37. Valet O. MDI Foreign Particulate Matter Raman Determination Method Validation According to ICH Parameters. Respiratory Drug Delivery Europe 2011. Berlin, Germany 2011:419-24. 38. Vehring R. Red-excitation dispersive Raman spectroscopy is a suitable technique for solid-state analysis of respirable pharmaceutical powders. Appl Spectrosc 2005 Mar;59(3):286-92. 39. Ozaki Y, šašić S. Introduction to Raman Spectroscopy. Pharmaceutical Applications of Raman Spectroscopy: John Wiley & Sons, Inc. 2007:1-28. 40. Buehler MF, Allen TM, Davis EJ. Microparticle Raman-Spectroscopy of Multicomponent Aerosols. J Colloid Interf Sci 1991 Oct 1;146(1):79-89. 41. Hopkins RJ, Reid JP. A Comparative Study of the Mass and Heat Transfer Dynamics of Evaporating Ethanol/water, Methanol/water, and 1-propanol/water Aerosol Droplets. J Phys Chem B 2006 Feb 23;110(7):3239-49.

30
42. Mitchem L, Buajarern J, Hopkins RJ, Ward AD, Gilham RJJ, Johnston RL, et al. Spectroscopy of Growing and Evaporating Water Droplets: Exploring the Variation in Equilibrium Droplet Size with Relative Humidity. J Phys Chem A 2006 Jul 6;110(26):8116-25. 43. Davies JF, Haddrell AE, Reid JP. Time-Resolved Measurements of the Evaporation of Volatile Components from Single Aerosol Droplets. Aerosol Sci Tech 2012;46(6):666-77. 44. Hopkins RJ, Reid JP. Evaporation of Ethanol/water Droplets: Examining the Temporal Evolution of Droplet Size, Composition and Temperature. J Phys Chem A 2005 Sep 8;109(35):7923-31. 45. Hopkins RJ, Symes R, Sayer RM, Reid JP. Determination of the Size and Composition of Multicomponent Ethanol/water Droplets by Cavity-enhanced Raman Scattering. Chem Phys Lett 2003 Oct 28;380(5-6):665-72. 46. Mitchem L, Buajarern J, Ward AD, Reid JP. A Strategy for Characterizing the Mixing State of Immiscible Aerosol Components and the Formation of Multiphase Aerosol Particles through Coagulation. J Phys Chem B 2006 Jul 20;110(28):13700-03. 47. Widmann JF, Aardahl CL, Davis EJ. Microparticle Raman spectroscopy. Trac-Trend Anal Chem 1998 Jun-Jul;17(6):339-45. 48. Tang IN, Fung KH. Characterization of Inorganic Salt Particles by Raman-Spectroscopy. J Aerosol Sci 1989;20(5):609-17. 49. Smith JD, Cappa CD, Wilson KR, Cohen RC, Geissler PL, Saykally RJ. Unified Description of Temperature-dependent Hydrogen-bond Rearrangements in Liquid Water. P Natl Acad Sci USA 2005 Oct 4;102(40):14171-74. 50. Zhang JX, Aiello D, Aker PM. Hydrogen-Bonding at the Aerosol Interface. J Phys Chem-Us 1995 Jan 12;99(2):721-30. 51. Quinn EA, Forbes RT, Williams AC, Oliver MJ, McKenzie L, Purewal TS. Protein conformational stability in the hydrofluoroalkane propellants tetrafluoroethane and heptafluoropropane analysed by Fourier transform Raman spectroscopy. International journal of pharmaceutics 1999 Sep 10;186(1):31-41. 52. Bouhroum A, Champness NR, Jinks PA, Williams PM, Roberts CJ. An Investigation of Ostwald Ripening of Beclomethasone Dipropionate (BDP) in a Model Suspension Metered Dose Inhaler Formulation. Respiratory Drug Delivery 2010. Orlando, Florida 2010:847-52. 53. Steele DF, Young PM, Price R, Smith T, Edge S, Lewis D. The Potential use of Raman Mapping to Investigate In Vitro Deposition of Combination Pressurized Metered-dose Inhalers. Aaps J 2004;6(4). 54. Rogueda PG, Price R, Smith T, Young PM, Traini D. Particle Synergy and Aerosol Performance in Non-aqueous Liquid of Two Combinations Metered Dose Inhalation Formulations: an AFM and Raman Investigation. Journal of Colloid Interface Science 2011 Sep 15;361(2):649-55. 55. Sengupta A, Laucks ML, Davis EJ. Surface-enhanced Raman Spectroscopy of Bacteria and Pollen. Applied spectroscopy 2005 Aug;59(8):1016-23. 56. Sengupta A, Brar N, Davis EJ. Bioaerosol Detection and Characterization by Surface-enhanced Raman Spectroscopy. Journal of Colloid Interface Science 2007 May 1;309(1):36-43. 57. Schwarzmeier K, Knauer M, Ivleva NP, Niessner R, Haisch C. Bioaerosol analysis based on a label-free microarray readout method using surface-enhanced Raman scattering. Anal Bioanal Chem 2013 Jun;405(16):5387-92. doi: 10.1007/s00216-013-6984-0. Epub 2013 May 9. 58. Schweiger G. Raman-Scattering on Single Aerosol-Particles and on Flowing Aerosols - a Review. J Aerosol Sci 1990;21(4):483-509. 59. O'Neill MAA, Gaisford S. Application and Use of Isothermal Calorimetry in Pharmaceutical Development. International journal of pharmaceutics 2011 Sep 30;417(1-2):83-93. 60. Gaisford S, O'Neill MA. Pharmaceutical Isothermal Calorimetry: Informa Healthcare. 61. Streng WH. Characterization of Compounds in Solution: Theory and Practice. New York: Kluwer Academic/Plenum Publishers, 2001.

31
62. Otsuka T, Yoshioka S, Aso Y, Terao T. Application of Microcalorimetry to Stability Testing of Meclofenoxate Hydrochloride and Dl-Alpha-Tocopherol. Chem Pharm Bull 1994 Jan;42(1):130-32. 63. Tan XY, Meltzer N, Lindenbaum S. Solid-State Stability Studies of 13-Cis-Retinoic Acid and All-Trans-Retinoic Acid Using Microcalorimetry and HPLC Analysis. Pharmaceutical research 1992 Sep;9(9):1203-08. 64. D’Sa D, Lechuga-Ballesteros D, Chan HK. Isothermal Microcalorimetry of Pressurized Systems I: A Rapid Method to Evaluate Pressurized Metered Dose Inhaler Formulations. Pharmaceutical research 2014:1-8. 65. Craig DQM, Royall PG, Kett VL, Hopton ML. The Relevance of the Amorphous State to Pharmaceutical Dosage Forms: Glassy Drugs and Freeze Dried Systems. International journal of pharmaceutics 1999 Mar 15;179(2):179-207. 66. Beyer K, Leine D, Blume A. The Demicellization of Alkyltrimethylammonium Bromides in 0.1 M Sodium Chloride Solution Studied by Isothermal Titration Calorimetry. Colloid Surface B 2006 Apr 15;49(1):31-39. 67. Dai S, Tam KC. Isothermal Titration Calorimetric Studies on the Temperature Dependence of Binding Interactions between Poly(propylene glycol)s and Sodium Dodecyl Sulfate. Langmuir 2004 Mar 16;20(6):2177-83. 68. Hildebrand A, Neubert R, Garidel P, Blume A. Bile Salt Induced Solubilization of Synthetic Phosphatidylcholine Vesicles Studied by Isothermal Titration Calorimetry. Langmuir 2002 Apr 2;18(7):2836-47. 69. Bai GY, Wang YJ, Nichifor M, Bastos M. Critical Role of the Degree of Substitution in the Interaction of Biocompatible Cholic Acid-Modified Dextrans with Phosphatidylcholine Liposomes. Langmuir 2013 Oct 29;29(43):13258-68. 70. Patel R, Buckton G, Gaisford S. The Use of Isothermal Titration Calorimetry to Assess the Solubility Enhancement of Simvastatin by a Range of Surfactants. Thermochim Acta 2007 May 15;456(2):106-13. 71. Waters LJ, Hussain T, Parkes GMB. Titration Calorimetry of Surfactant-drug Interactions: Micelle Formation and Saturation Studies. J Chem Thermodyn 2012 Oct;53:36-41. 72. Mun S, Rho SJ, Kim YR. Study of Inclusion Complexes of Cycloamylose with Surfactants by Isothermal Titration Calorimetry. Carbohyd Polym 2009 Jun 10;77(2):223-30. 73. Diab C, Winnik FM, Tribet C. Enthalpy of Interaction and Binding Isotherms of Non-ionic Surfactants onto Micellar Amphiphilic Polymers (amphipols). Langmuir 2007 Mar 13;23(6):3025-35. 74. Dai S, Tam KC. Isothermal Titration Calorimetry Studies of Binding Interactions between Polyethylene Glycol and Ionic Surfactants. J Phys Chem B 2001 Nov 8;105(44):10759-63. 75. Jelesarov I, Bosshard HR. Isothermal Titration Calorimetry and Differential Scanning Calorimetry as Complementary Tools to Investigate the Energetics of Biomolecular Recognition. J Mol Recognit 1999 Jan-Feb;12(1):3-18. 76. Freyer MW, Lewis EA. Isothermal Titration Calorimetry: Experimental Design, Data Analysis, and Probing Macromolecule/Ligand Binding and Kinetic Interactions. Method Cell Biol 2008;84:79-113. 77. Saboury AA. A Review on the Ligand Binding Studies by Isothermal Titration Calorimetry. J Iran Chem Soc 2006 Mar;3(1):1-21. 78. Olsen SN. Applications of Isothermal Titration Calorimetry to Measure Enzyme Kinetics and Activity in Complex Solutions. Thermochim Acta 2006 Sep 1;448(1):12-18. 79. Todd MJ, Gomez J. Enzyme Kinetics Determined Using Calorimetry: A General Assay for Enzyme Activity? Anal Biochem 2001 Sep 15;296(2):179-87. 80. Pierce MM, Raman CS, Nall BT. Isothermal Titration Calorimetry of Protein-protein Interactions. Methods 1999 Oct;19(2):213-21. 81. Liang Y. Applications of Isothermal Titration Calorimetry in Protein Science. Acta Bioch Bioph Sin 2008 Jul;40(7):565-76. 82. Paleos CM, Tsiourvas D. Interaction Between Complementary Liposomes: a Process Leading to Multicompartment Systems Formation. J Mol Recognit 2006 Jan-Feb;19(1):60-67.

32
83. Moreno MJ, Martins PT, Velazquez-Campoy A. Applications of Isothermal Titration Calorimetry in the Characterization of the Energetics, and Kinetics, of the Interaction of Amphiphiles with Lipid Bilayers. Biophys J 2013 Jan 29;104(2):86a-86a. 84. Ghai R, Falconer RJ, Collins BM. Applications of Isothermal Titration Calorimetry in Pure and Applied Research—Survey of the Literature from 2010. J Mol Recognit 2012;25(1):32-52. 85. Bouchemal K, Agnely F, Koffi A, Djabourov M, Ponchel G. What Can Isothermal Titration Microcalorimetry Experiments Tell us about the Self-organization of Surfactants into Micelles? J Mol Recognit 2010 Jul-Aug;23(4):335-42. 86. Blackett PM, Buckton G. A Microcalorimetric Investigation of the Interaction of Surfactants with Crystalline and Partially Crystalline Salbutamol Sulfate in a Model Inhalation Aerosol System. Pharmaceutical research 1995 Nov;12(11):1689-93. 87. Briggner LE, Buckton G, Bystrom K, Darcy P. The Use of Isothermal Microcalorimetry in the Study of Changes in Crystallinity Induced during the Processing of Powders. International journal of pharmaceutics 1994 May 2;105(2):125-35. 88. Ahmed H, Buckton G, Rawlins DA. The use of Isothermal Microcalorimetry in the Study of Small Degrees of Amorphous Content of a Hydrophobic Powder. International journal of pharmaceutics 1996 Mar 22;130(2):195-201. 89. Ooi J, Gaisford S, Boyd BJ, Young PM, Traini D. Isothermal Calorimetry: A Predictive Tool to Model Drug-propellant Interactions in Pressurized Metered Dose Systems. International journal of pharmaceutics 2014 Jan 30;461(1-2):301-09. 90. Martinez JC, Murciano-Calles J, Cobos ES, Iglesias-Bexiga M, Luque I, Ruiz-Sanz J. Isothermal Titration Calorimetry: Thermodynamic Analysis of the Binding Thermograms of Molecular Recognition Events by Using Equilibrium Models. InTech, 2013.