determination of the “sweet spot” of a cricket bat using … · 2016-11-18 · important in bat...
TRANSCRIPT
Determination of the “Sweet Spot” of a Cricket Bat using COMSOL
Multiphysics® Y. Mulchand1, A. Pooransingh1 and R. Latchman1 1The University of the West Indies – St. Augustine Campus, St. Augustine, Trinidad and Tobago [email protected], [email protected], [email protected]
Abstract: The aim of this paper is to determine
the location of the “sweet spot” for a selected
cricket bat commonly used in the sport.
Knowledge of the “sweet spot” is important in
delivering a shot that utilizes the optimal zone of
the bat that corresponds to the maximum power of
the stroke. A COMSOL model of the cricket bat
was constructed in the structural mechanics
module and utilized the Eigenfrequency analysis
which aided in determining the “sweet spot” of
the cricket bat. The COMSOL model determined
the mode shapes and the Eigenfrequencies at
which they occur. Simulated results showed that
the “sweet spot” was located in the region of 10
cm to 15 cm from the toe of the bat at the center.
Keywords: Sweet spot, cricket bat,
Eigenfrequency, mode shape
1. Introduction
Over the years, the game of cricket has
tremendously evolved and is now one of the most
commercialized sports in the world. In cricket,
there is an increasing trend to monitor the
performance of the athlete. Currently there is
increasing research on monitoring the
performance of the batsman (Busch and James
2007) and the bowler (Portus, et al. 2004). These
studies focus on using signal processing
technology in perfecting the elite athlete. Cricket
is a traditional “bat and ball” sport like baseball
and tennis. Some studies, (Latchman and
Pooransingh 2015), (Fontes 2014), scientifically
explored the limits of the motion of the ball.
However limited studies have focused on the bat
(Boochie 2015) (D. A. Russell 2006) with less
specifically on the cricket bat (Hariharan and
Srinivasan 2012) (John and Bang Li 2002) (S.
Knowles 1996) (Sarkar, et al. 2012).
The aim of this paper is to determine the “sweet
spot” of a cricket bat. The “sweet spot” can be
defined as the position of the bat where the
maximum energy is conveyed with the least
vibration (D. A. Russell 2015). Knowledge of the
location of the “sweet spot” on the bat aids the
batsman in improving their batting ability and
delivering optimal shots in attaining maximum
power with the least effort. Additionally, this can
also aid coaches during coaching sessions.
Russell (2015) utilized a special force hammer
and an accelerometer. The accelerometer
measures the vibrations produced by the baseball
bat when it is struck by the force hammer to
determine the “sweet spot”. All the results
obtained were then analyzed offline to show the
vibrations and the frequency response. Cheng and
Ku (2015) built upon Cross (1998) who proposed
two methods utilizing triaxial accelerometers. For
the first method, the accelerometer was mounted
onto a hand-held stationary cricket bat. The bat
was then tapped in the upper, middle and lower
regions along its length. The second method
aimed to identify the “sweet spot” of five players
performing defensive drives along the ground
which analyzed cricket shots by using
accelerometers.
2. Theory
The main vibrational modes of the
performance of a bat are the bending modes of a
bat. A freely supported bat exhibits several
bending modes of vibrations when compared to a
hand held bat which can be treated as a clamped
cantilever beam (D. A. Russell 2006). According
to Russell (2015) while the hands quickly dampen
the vibrations from the bat, the vibrational
frequencies or the mode shape does not change
with a tightly gripped bat. Figure 1 shows the first
four (4) bending modes of a baseball bat.
According to Russell (2006) the first bending
mode occurs at a frequency of 170 Hz as shown
in Figure 2. This mode is very important in the
performance of the bat since it helps in the
location of the “sweet spot” where the node is
about 5-7 inches from the barrel end (toe) of the
bat. Impacts at this point on the bat would not
cause any vibrations to be produced and thus none
of the initial energy of the ball would be lost to the
bat due to deformation and the player would not
feel any vibrations at this frequency. Russell
(2006) also stated that the second bending mode
occurs at a frequency of 600 Hz and is also
Excerpt from the Proceedings of the 2016 COMSOL Conference in Boston

important in bat performance since it has a node
about 5-7 inches from the barrel end of the bat.
With this node and the previously mentioned
node, a “sweet zone” is established in between the
two bending modes as shown in Figure 3. Impacts
in this region would cause minimal vibrations felt
by the player, and the ball would not lose all of its
energy to the bat’s vibrations (D. A. Russell
2006).
Figure 1 – Showing the Bending Modes of a Baseball
Bat (D. A. Russell 2015)
Figure 2 - Mode shapes for the first two bending
vibrational modes in a 32-inch youth baseball bat (D.
A. Russell 2006).
Figure 3 – Showing the sweet zone of a Baseball Bat
(D. A. Russell 2006)
The coefficient of restitution (COR) is used to
measure the elasticity or inelasticity of two
objects when they make contact with each other
in the case of a cricket bat as it strikes a cricket
ball (Cheng and Ku 2015).
The coefficient of restitution e is define as
follows:
𝑒 = 𝑣𝐵𝑓 − 𝑣𝐴𝑓
𝑣𝐵𝑖 − 𝑣𝐴𝑖
where A and B are two objects with mass MA and
MB, initial velocity VAi and VBi and final velocity
VAf and VBf respectively.
When the COR has a value of one (1), the system
is considered to be perfectly elastic and there is no
energy loss due to deformation of the colliding
objects. However, when the COR has a value of
zero (0), the system is considered to be perfectly
plastic and there is no velocity left in the two
objects after collision.
The “sweet spot” can be defined and located in
numerous ways. There are a multitude of
definitions of the “sweet spot”. These include the
following:
1) The region where least vibration sensation
(sting) in the batsman’s hand is produced, in
addition, the locality where maximum batted
ball speed is produced and where maximum
energy is conveyed to the ball is located.
2) The region of maximum coefficient of
restitution also known as the centre of
percussion.
3) The node of the fundamental vibration mode.
4) The region between nodes of the first two
vibration modes (D. A. Russell 2015).
Figure 4 – Showing the Profile of a Cricket Bat
Figure 4 shows the profile of a typical cricket bat.
The handle of the bat is the most susceptible to
strain when a ball is being played. The edge of a
cricket bat is generally 2 – 3 inches thick.
According to Jones (2015) a thicker edge
Excerpt from the Proceedings of the 2016 COMSOL Conference in Boston
increases the durability of the bat and as a result it
reduces the likelihood of the bat becoming worn.
The “sweet spot” is distributed over a wider area
of the bat as the swell position and depth changes
as there is more wood behind the blade as seen in
Figure 4. This leads to improved rebounding
qualities and greater force is transferred to the ball
when struck. Jones (2015) also stated that
knowledge of the swell position is important
when selecting a bat to play these particular shots
most effectively. The back profile of the bat aid in
the pick-up and the balance of the bat. (Jones
2015).
3. Governing Equations
According to COMSOL (2013)
eigenfrequency analysis also referred to as free
vibration of a structure, is used to find the damped
and undamped eigenfrequencies and eigenmode
shapes of a model. When performing an
eigenfrequency analysis in structural mechanics
context, the fundamental eigenvalue, 𝜆, mode, i,
and the eigenfrequency, f, is more commonly
used.
𝑓 = −𝜆
2𝜋𝑖
It is possible to compute eigenfrequencies for
structures which are not fully constrained, this
referred to as free-free modes. For a 3-
dimensional structure there is a possibility of six
(6) rigid body modes which comprises of three (3)
translations and three (3) rotations. If rigid body
modes are present in the model, only the shape
and not the size of the modes have physical
significance (COMSOL 2013).
3.1 Linear Elastic Materials
According to COMSOL (2013) the total strain
tensor, 𝜖, in terms of the displacement
gradient, ∇𝑢, and temperature, T, is written as:
𝜖 = 1
2 (∇𝑢 + (∇𝑢)𝑇)
Or in components as:
𝜖 = 1
2 (
𝜕𝑢𝑚
𝜕𝑥𝑛
+𝜕𝑢𝑛
𝜕𝑥𝑚
)
The Duhamel-Hooke’s law relates the stress
tensor to the strain tensor and temperature:
𝑠 = 𝑠0 + 𝐶 ∶ (𝜖 − 𝜖0 − 𝛼𝜃)
Where C is the 4th order elasticity tensor, “:” is
the double-dot tensor product, 𝑠0 and 휀0 are initial
stresses and strains, 𝜃 = 𝑇 − 𝑇𝑟𝑒𝑓 and 𝛼 is the
thermal expansion tensor (COMSOL 2013).
3.2 Degrees of Freedom and Natural
Frequencies of Vibration
According to Stokey (1988) system with mass and
elastic parts are characterized by a finite number
of degrees of freedom and some degree of
elasticity. The number of natural frequencies of
vibration of any system corresponds to the
number of degrees of freedom. With each natural
frequency is an associated shape this is commonly
known as the natural mode shape which is
assumed by the system during free vibration at the
corresponding frequency (Stokey 1988).
For many elastic bodies, the Rayleigh method is
most appropriate in finding an approximation to
the fundamental natural frequency. All the energy
associated with vibration is in the form of elastic
strain energy. (Stokey 1988).The Strain energy. V
and Kinetic Energy, T of a uniform beam in
bending can be found by using the following:
𝑉 =𝐸𝐼
2∫ (
𝛿2𝑦
𝛿𝑥2)
2
𝑑𝑥𝑙
0
𝑇𝑔𝑒𝑛𝑒𝑟𝑎𝑙 =𝑆𝛾
2𝑔∫ (
𝛿𝑦
𝛿𝑡)
2
𝑑𝑥𝑙
0
𝑇𝑚𝑎𝑥𝑖𝑚𝑢𝑚 =𝑆𝛾𝜔𝑛
2
2𝑔∫ (𝑌)2𝑑𝑥
𝑙
0
𝜔𝑛 = 2𝜋𝑓𝑛 Where:
E = modulus of elasticity
I = moment of inertia of beam
l = length of beam
S = area of cross section
γ = weight density
g = modulus of rigidity
y = lateral deflection of beam
(Stokey 1988).
The natural frequency,𝑓𝑛 of a uniform cantilever
beam with mass on the end can be found by using
the following:
𝑓𝑛 = √𝑘
𝑀 + 0.23𝑚
Excerpt from the Proceedings of the 2016 COMSOL Conference in Boston

𝑘 = 3𝐸𝐼
𝑚3
Where:
M = mass
m = length of the beam
k = stiffness
I = Moment of inertia
(Stokey 1988).
4. Method and Use of COMSOL
Multiphysics® Software
4.1 Selecting the Physics
A 3-dimensional conceptual model of the cricket
bat used was constructed using the Structural
Mechanics of the COMSOL Multiphysics
software. The importance of the structural
mechanics modules is for analyzing deformations,
stresses and strains of solid structures. Solid
Mechanics was chosen since it is based on solving
equations and computed results for
displacements, stresses and strains of the cricket
bat. Eigenfrequency was then chosen for the study
since it is used to compute Eigenmodes and
Eigenfrequencies of a linearized model. In solid
mechanics, the Eigenfrequency corresponds to the
natural frequencies of vibrations and the
Eigenmodes corresponds to the normalized
deformed shapes at the Eigenfrequencies.
Figure 5- Model of the cricket bat with dimensions
constructed using COMSOL Multiphysics software
4.2 Defining Geometry
Firstly the handle of the cricket bat was
constructed based on the parameters outlined
above. This was done by constructing a cylinder
of radius 0.01727 m and length 0.254 m. Then the
upper end of the handle was constructed by
placing a cylinder of radius 0.01776 m and length
0.02032 m. The base of the bat was also
represented as a cylinder of radius 0.05715 m and
length 0.5588. Figure 6 (a) to (d) shows the
progression of the stages in the construction of the
bat using COMSOL.
(a)
(b)
(c)
(d)
Figure 6- Construction stages for the Cricket Bat model
After the bat was constructed, materials were then
added to the bat to replicate an actual cricket bat.
From research conducted from Northgate Ltd
(2016) cricket bats are made of a fibrous wood
known as willow wood. Northgate Ltd (2016) also
stated that carbon fiber is commonly used in the
handles of cricket bats since it acts as an absorber
from the shock when the bat is impacted.
Titanium was also used in the handles of the bat
as an added support and reinforcement, thus
added to more power in striking the ball.
However, for this experiment, only willow was
used throughout the entire bat.
Excerpt from the Proceedings of the 2016 COMSOL Conference in Boston
4.3 Defining Materials
To apply the material properties of the bat
structure which was previously constructed. The
function to add material was selected and wood
was searched. The only type of wood found was
kingwood and was applied it to the entire
structure. Some parameters were missing such as
Poisson’s ration and Young’s modulus. These
were added based on research for willow wood
since the material used for the construction of a
cricket bat is willow.
4.4 Setting up the physics
The bat was set as being free object everywhere
except at the handle where it is fixed in space.
In the solid mechanics physics, Linear Elastic
Material was applied to the entire bat. This
generated the Eigenfrequencies for the entire
structure using the following equation from
COMSOL:
−𝜌𝜔2𝑢 = ∇ ∙ 𝑠 + 𝐹𝑣
𝑠 = 𝑆0 + 𝐶 ∶ (𝜖 − 𝜖0 − 𝜖𝑖𝑛𝑒𝑙)
𝜖 = 1
2 (∇𝑢 + (∇𝑢)𝑇)
Initial Values was applied to the entire bat and the
Displacement field and Structural Velocity field
was all set to zero. This was to denote the
equilibrium position where the bat did not
undergo any deformation. The handle was then set
as a Fixed Constraint. This would set the
displacement for the Eigenfrequency to zero (u =
0).
4.5 Meshing
The free tetrahedral mesh was chosen for this
analysis. An extra fine mesh was chosen to
achieve a more accurate result. Extremely fine
wasn’t chosen since it took longer for the model
to mesh and the results to compute. An edge mesh
was also done on the model, this was to ensure
that all the edges of the bat was properly meshed.
4.6 Simulation
The Eigenfrequency mode was chosen in the
study mode, with a preset value of six (6)
Eigenfrequencies. This meant that the program
would look for the first six (6) Eigenfrequency of
the system during the simulation. The results were
computed allowing the program to solve
differential equations for each point on the mesh.
5. Results
The following figures shows the first six mode
shapes of the model of the cricket bat created
using the COMSOL simulation. Figure (7 - 12)
shows the first six Eigenmodes and
Eigenfrequencies of the cricket bat model in solid
mechanics in COMSOL simulation. These
Eigenmodes correspond to the normalized
deformations of the cricket bat at the
Eigenfrequencies. The Eigenfrequencies
correspond to the natural frequencies at which
these vibrations occurs. Below are the
eigenmodes and corresponding eigenfrequencies.
Eigenmode Eigenfrequency /Hz
1 1.1075
2 1.5165
3 9.6195
4 10.344
5 17.217
6 27.884
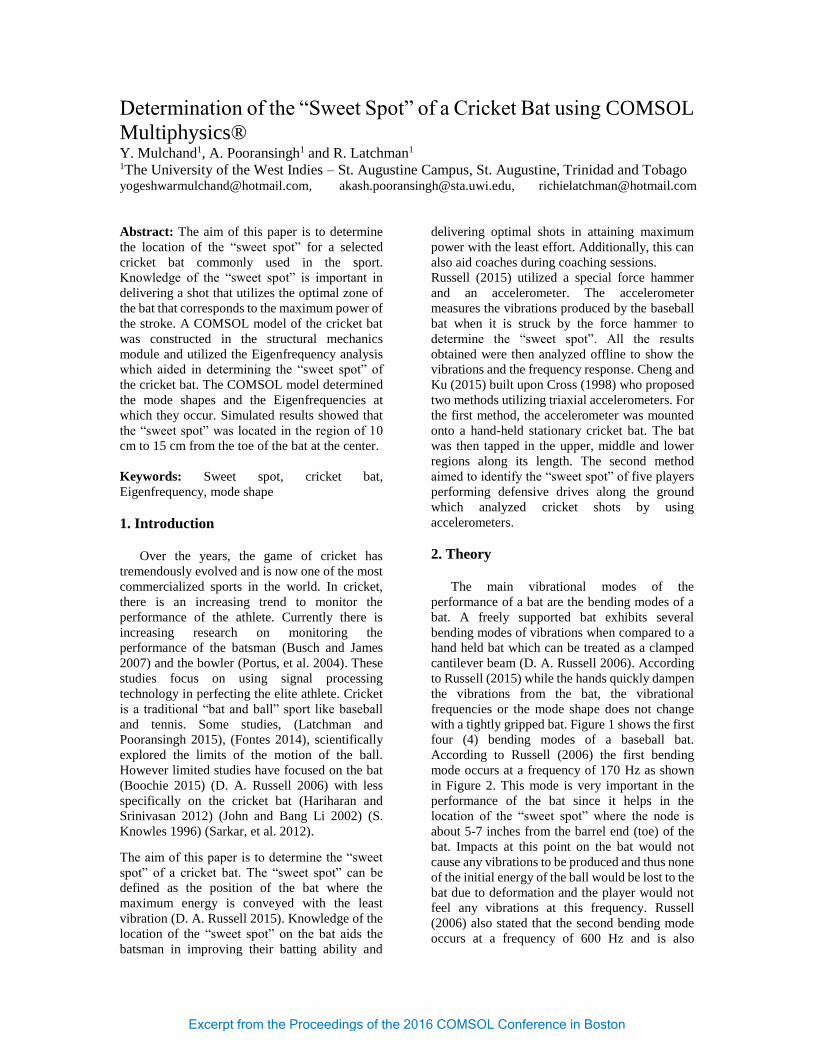
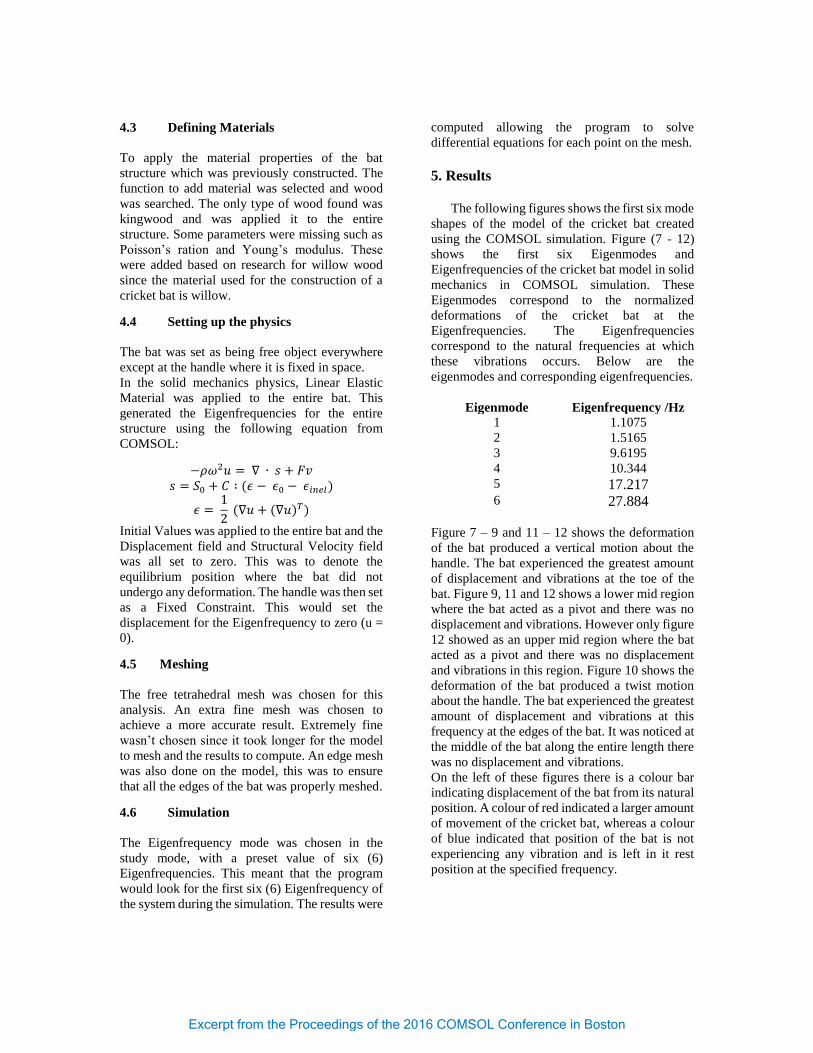
Figure 7 – 9 and 11 – 12 shows the deformation
of the bat produced a vertical motion about the
handle. The bat experienced the greatest amount
of displacement and vibrations at the toe of the
bat. Figure 9, 11 and 12 shows a lower mid region
where the bat acted as a pivot and there was no
displacement and vibrations. However only figure
12 showed as an upper mid region where the bat
acted as a pivot and there was no displacement
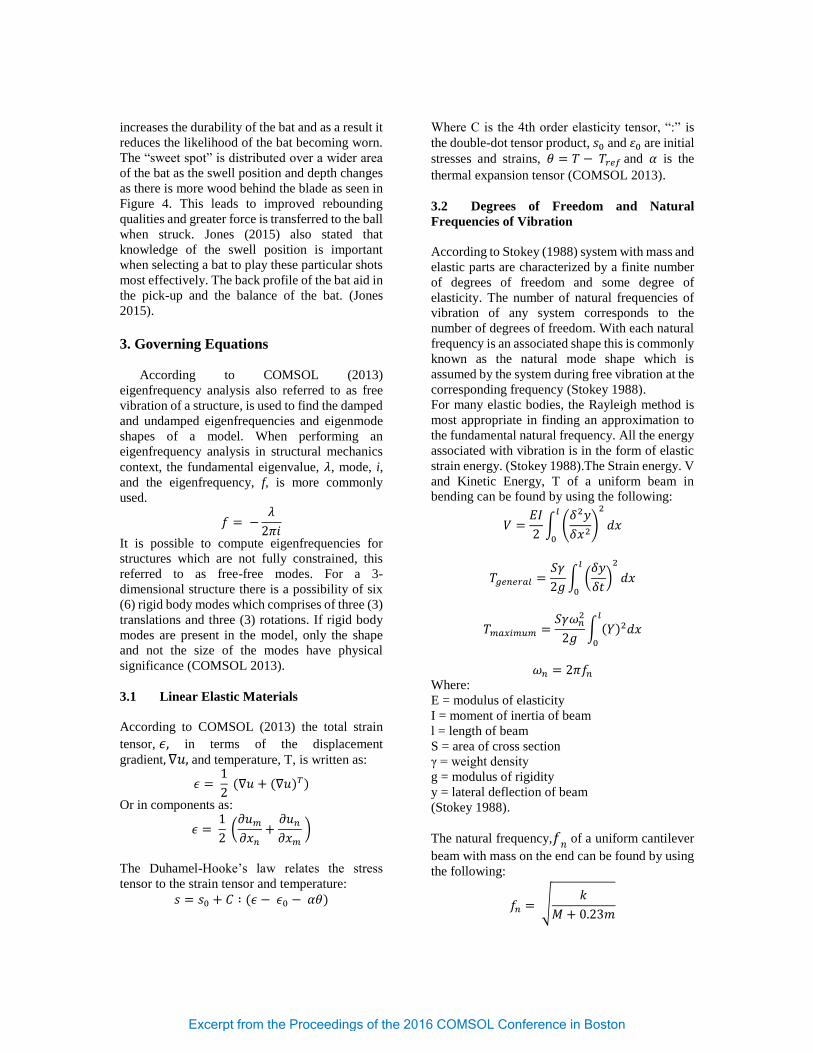
and vibrations in this region. Figure 10 shows the
deformation of the bat produced a twist motion
about the handle. The bat experienced the greatest
amount of displacement and vibrations at this
frequency at the edges of the bat. It was noticed at
the middle of the bat along the entire length there
was no displacement and vibrations.
On the left of these figures there is a colour bar
indicating displacement of the bat from its natural
position. A colour of red indicated a larger amount
of movement of the cricket bat, whereas a colour
of blue indicated that position of the bat is not
experiencing any vibration and is left in it rest
position at the specified frequency.
Excerpt from the Proceedings of the 2016 COMSOL Conference in Boston
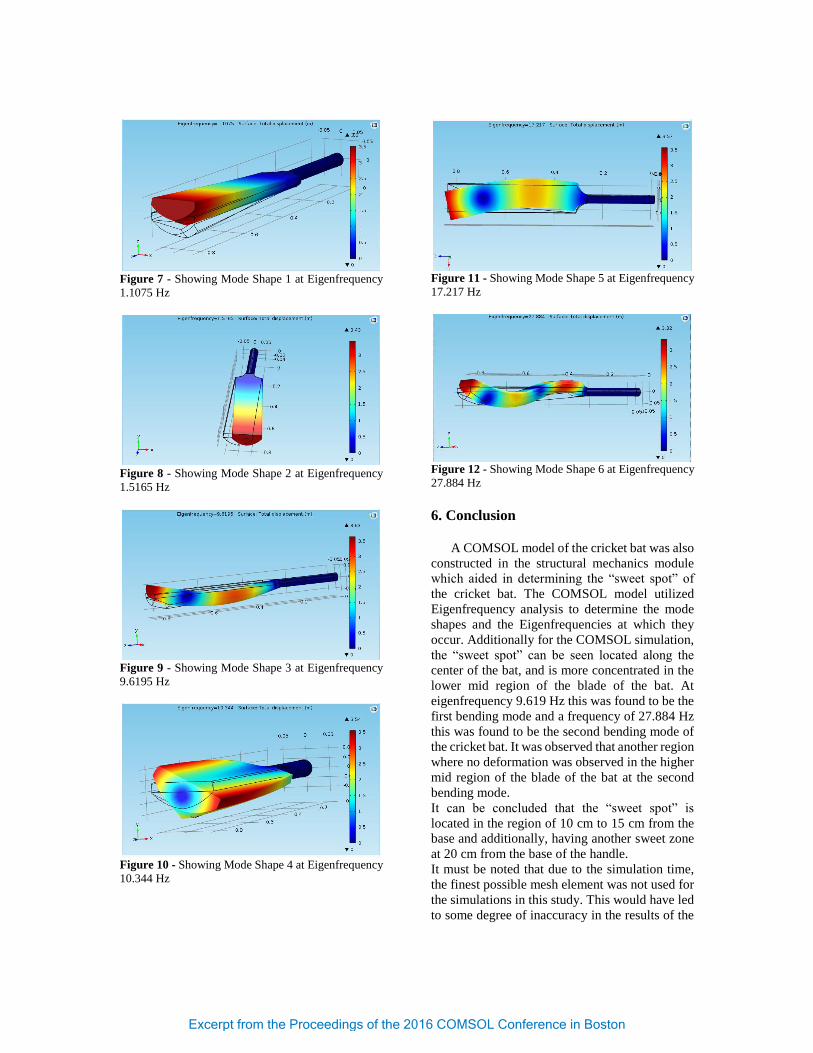
Figure 7 - Showing Mode Shape 1 at Eigenfrequency
1.1075 Hz
Figure 8 - Showing Mode Shape 2 at Eigenfrequency
1.5165 Hz
Figure 9 - Showing Mode Shape 3 at Eigenfrequency
9.6195 Hz
Figure 10 - Showing Mode Shape 4 at Eigenfrequency
10.344 Hz
Figure 11 - Showing Mode Shape 5 at Eigenfrequency
17.217 Hz
Figure 12 - Showing Mode Shape 6 at Eigenfrequency
27.884 Hz
6. Conclusion
A COMSOL model of the cricket bat was also
constructed in the structural mechanics module
which aided in determining the “sweet spot” of
the cricket bat. The COMSOL model utilized
Eigenfrequency analysis to determine the mode
shapes and the Eigenfrequencies at which they
occur. Additionally for the COMSOL simulation,
the “sweet spot” can be seen located along the
center of the bat, and is more concentrated in the
lower mid region of the blade of the bat. At
eigenfrequency 9.619 Hz this was found to be the
first bending mode and a frequency of 27.884 Hz
this was found to be the second bending mode of
the cricket bat. It was observed that another region
where no deformation was observed in the higher
mid region of the blade of the bat at the second
bending mode.
It can be concluded that the “sweet spot” is
located in the region of 10 cm to 15 cm from the
base and additionally, having another sweet zone
at 20 cm from the base of the handle.
It must be noted that due to the simulation time,
the finest possible mesh element was not used for
the simulations in this study. This would have led
to some degree of inaccuracy in the results of the
Excerpt from the Proceedings of the 2016 COMSOL Conference in Boston

simulations. Also assumptions made were that the
simulated cricket bat were of the exact
dimensions of the actual cricket bat used in the
sport and the material used in COMSOL were
similar to that used to construct the cricket bat.
Additionally, age of the cricket bat was not taken
into consideration for this simulation.
7. References
[1] A. Busch and D. A. James, "Analysis of
Cricket Shots using Inertial Sensors," in
The Impact of Technology on Sport, (2007).
[2] M. R. Portus, R. B. Mason, C. B. Elliott, C.
M. Pfitzner and P. R. Done, "Technique
factors related to ball release speed and
trunk injuries in high performance Cricket
fast bowlers," in Sports Biomechanics, vol.
3, (2004).
[3] R. Latchman and A. Pooransingh,
"Modeling Conventional Swing of a
Cricket Ball Using COMSOL
Multiphysics," in COMSOL Conference,
Boston, (2015).
[4] E. Fontes, "The Magnus Effect and the
World Cup Match Ball," Available:
https://www.comsol.com/blogs/magnus-
effect-world-cup-match-ball/ (2014).
[5] F. Boochie, "The Physics of Tennis Racket
Sweet Spots," Available:
https://www.comsol.com/blogs/the-
physics-of-tennis-racket-sweet-spots/
(2015).
[6] D. A. Russell, "Bending Modes, Damping,
and the Sensation," in The Engineering of
Sport 6, vol. 1, S. Haake and E. F. Moritz,
Eds., Flint, Michigan: Springer, (2006).
[7] V. Hariharan and D. P. S. S. Srinivasan,
"Inertial and Vibration Characteristics of a
Cricket bat," ResearchGate, Tamil Nadu,
India, (2012).
[8] S. John and Z. Bang Li, "Multi-directional
Vibration Analysis of Cricket bats," The
Engineering of Sport 4, Bundoora, Vic.
3083, Australia, (2002).
[9] F. B. J. S. B. M. S. Knowles, "Novel Design
of Sports Equipment through Impact
Vibration Analysis," pp. 390-396. (1996)
[10] A. K. Sarkar, D. A. James, A. W. Busch and
D. V. Thiel, "Cricket Bat Acceleration
Profile from Sweet-Spot Impacts," in 9th
Conference of the International Sports
Engineering Association (ISEA) , Lowell,
(2012).
[11] D. D. A. Russell, "Physics and Acoustics of
Baseball and Softball Bats," Available:
http://www.acs.psu.edu/drussell/bats.html,
(2015).
[12] L. Cheng and Z. Ku, "Scientific Research
An Academic Publisher," Dynamic Model
with Application to the Analysis of the
Sweet Spot on a Baseball Bat, pp. 459-466,
(2015).
[13] R. Cross, "The sweet spot of a baseball bat,"
in American Journal of Physics, pp. 772-
779, (1998).
[14] D. Jones, "Spartan," Available:
http://spartansports.com.au/bat-features/,
(2015).
[15] COMSOL, Structural Mechanics Module
User’s Guide, vol. 4.3b, pp. 54-55, (2013).
[16] COMSOL, COMSOL Multiphysics
Reference Manual, vol. 4.3b, p. 1090,
(2013).
[17]
[18]
Northgate Ltd, "Cricket Equipment Guide,"
Available:
http://www.cricketequipmentguide.co.uk/,
(2016).
Stokey, William F., "Vibration of Systems
having Distributed mass and
elasticity." Shock and vibration
Handbook. (1988).
8. Acknowledgement
The authors would like to acknowledge the
contribution of Mr. Randall Ali for his concept
and guidance of this study.
Excerpt from the Proceedings of the 2016 COMSOL Conference in Boston