determination of the calorific value and moisture … · determination of the calorific value and...
TRANSCRIPT
Oil Shale, 2018, Vol. 35, No. 4, pp. 339–355 ISSN 0208-189X doi: https://doi.org/10.3176/oil.2018.4.04 © 2018 Estonian Academy Publishers
DETERMINATION OF THE CALORIFIC VALUE
AND MOISTURE CONTENT OF CRUSHED
OIL SHALE BY LIBS
MÄRT AINTS(a), PEETER PARIS(a), IRAM TUFAIL(a,b), INDREK JÕGI(a), HARDI AOSAAR(c), HELLA RIISALU(d), MATTI LAAN(a)*
(a) Institute of Physics, University of Tartu, Ostwaldi 1, 50411 Tartu, Estonia (b) Department of Cybernetics, Tallinn University of Technology, Akadeemia
tee 21, 12618 Tallinn, Estonia (c) Eesti Energia AS, Lelle 22, 11318 Tallinn, Estonia (d) Virumaa College, Tallinn University of Technology, Järveküla tee 75, 30322
Kohtla-Järve, Estonia*
Abstract. Laser-induced breakdown spectroscopy (LIBS) was used for the
quantitative assessment of the calorific value of Estonian oil shale. Samples
were collected from different layers of oil shale and limestone from Narva
open cast mine, Estonia.
Lumps of crushed oil shale without any special preparation were tested on
a mock-up of a moving conveyor belt. The moisture content of oil shale
samples was varied. Multivariate regression analysis was applied for pro-
cessing of spectroscopic data. The results obtained using the bomb calori-
metric method were used for calibration. The method for selecting the
optimal number of spectral lines for data processing is presented. The
standard deviation of prediction of the calorific value was 1.76 MJ/kg and
the moisture content was 1.94%.
Keywords: crushed oil shale, calorific value, moisture content, laser-induced
breakdown spectroscopy.
1. Introduction
Estonian oil shale is used for oil production [1] as well as a fuel in power plants [2]. Both the yield of oil and the efficiency of boilers depend on the organic and moisture content of raw material. At present the calorific value, which characterizes the oil shale organic content, is mostly measured using oxygen bomb calorimeters. The respective laboratory method is sufficiently precise but the periodic grab sampling and time-consuming laboratory * Corresponding author: e-mail [email protected]
Märt Aints et al.
340
testing could not meet the requirement of real-time control and optimization of industrial processes. Moreover, the calorific value of oil shale may vary considerably within a deposit [3] which in turn confirms the urgent need for a rapid on-line monitoring of the continuous flow of raw material.
Nowadays, industry uses three on-line methods for quality control. In coal industry, X-ray fluorescence (XRF) as well as prompt gamma neutron activation analysis (PGAA) have proven their efficiency and sufficient speed for continuous monitoring. The third method, laser-induced breakdown spectroscopy (LIBS), has also shown acceptable accuracy and precision. Besides, LIBS is safer and has lower installation and operating costs compared with the abovementioned two other methods [4].
LIBS is a method of emission spectroscopy where a pulse of the laser beam (laser shot) evaporates a small amount of the sample and a plasma plume forms at the sample surface. The plume emits light whose spectrum reflects the elemental composition of sample [5]. Application of LIBS for characterization of coals and lignite is the subject of many papers. An over-view can be found, for example, in the paper by Romero and De Saro [6] and references therein. The LIBS testing was carried out in conditions which were close to those of the conveyer belt and the calibration curves for elements were built [7]. In addition to elemental composition, other important properties of coal, such as ash content, ash fusion temperature, or even calorific value, which has a complicated relation to elemental com-position, are calculated on the basis of LIBS spectra using multivariate analysis methods [8–10].
As reported earlier, moisture content has a considerable impact on LIBS results, decreasing the intensity of spectral lines of most elements [11]. This dependence of LIBS spectra on moisture allows one to use the said analysis technology for the moisture content measurement as demonstrated in case of coal [10]. Thus, in principle, LIBS spectra can be used for the simultaneous determination of the calorific value and moisture content.
Contrary to numerous studies dealing with LIBS diagnostics of coals and lignite, papers related to the similar diagnostics of oil shale are rather few. LIBS-induced pyrolysis has been used for determination of oil shale characteristics [12, 13]. An important advantage of the method is that the decay of intensities of hydrogen (H) and carbon (C) lines with the growth of laser shot number allowed a clear separation of H and C present in the organic part of oil shale from its inorganic part. The elemental composition of Marcellus Shale was determined with a high precision using LIBS spectra coupled with multivariate analysis [14]. Aints et al. [15] investigated the applicability of LIBS for determination of the calorific value of Estonian oil shale. As an extra task, the LIBS-based estimation of the oil shale chemical composition was done. Air-dry pellets with different known calorific values pressed from homogenized powder (particle size < 60 µm) were tested. Measurements were done in ambient air and LIBS spectra were recorded from different spots at the rotating pellet surface. The study showed that
Determination of the Calorific Value and Moisture Content of Crushed Oil Shale by LIBS
341
LIBS diagnostics in laboratory conditions combined with multivariate regression analysis gives reliable results for homogenized dry pellets. The root mean square error of calorific value prediction by LIBS was 0.24 MJ/kg. This value is comparable with the uncertainty of the calorific value determined using the ISO 1928:2009 bomb calorimetric method, 0.13 MJ/kg. Paris et al. [16] studied the qualitative effect of moisture on LIBS spectra of Estonian oil shale samples. It appeared that the moisture had a strong effect on these spectra, which complicated the distinction between oil shale and limestone.
The aim of the present paper was to evaluate the feasibility of using LIBS for determination of calorific value and moisture content in conditions comparable to industrial ones. Differently from previous studies, crushed oil shale without any special preparation was tested by LIBS on a mock-up of a moving conveyor belt. Besides, LIBS was used for the quantitative determination of the moisture content.
2. Samples
Samples for the study were collected by an exploration geologist from Narva open cast mine, Estonia, from layers A–F2 of the 7th trench’s west-side exposure (outcrop). Altogether 11 samples from different oil shale layers and limestone interlayers were taken. Oil shale layers A, B and E of the mineable seam are the richest in organic matter, containing up to 60% kerogen. Other oil shale layers contain large- or small-scale limestone concretions [17]. The organic content of layers A’ and F is the lowest, while interlayers A’/B, B/C, C/D and D/E consist mostly of barren limestone with minor kerogen content. A more detailed overview about the composition of Estonian oil shale and its stratification and layers in the deposit is provided by Ots [2].
In addition, four samples with different calorific values sorted by density in a floatation tank were taken from the stopped conveyor belt of the beneficiation plant of the Estonia underground mine. These samples are labelled EST.
The samples selected for this study covered the whole vertical extent of the currently mineable Estonian oil shale deposit and the main product ranges of the Estonia underground mine beneficiation plant.
All samples were crushed in a jaw crusher to a fraction of around 0–25 mm. The weight of individual samples varied from 2.5 to 7.7 kg. Each sample was divided into two equal parts. The laboratory of Virumaa College, Tallinn University of Technology, determined the calorific value of the samples by using the bomb calorimetric method (ISO 1928:2009). The calorific values Qd of dry samples are presented in Table 1 in ascending order.
An about 0.5 kg portion of each sample was used for LIBS measure-ments. For variation of moisture content, the samples were placed in
Märt Aints et al.
342
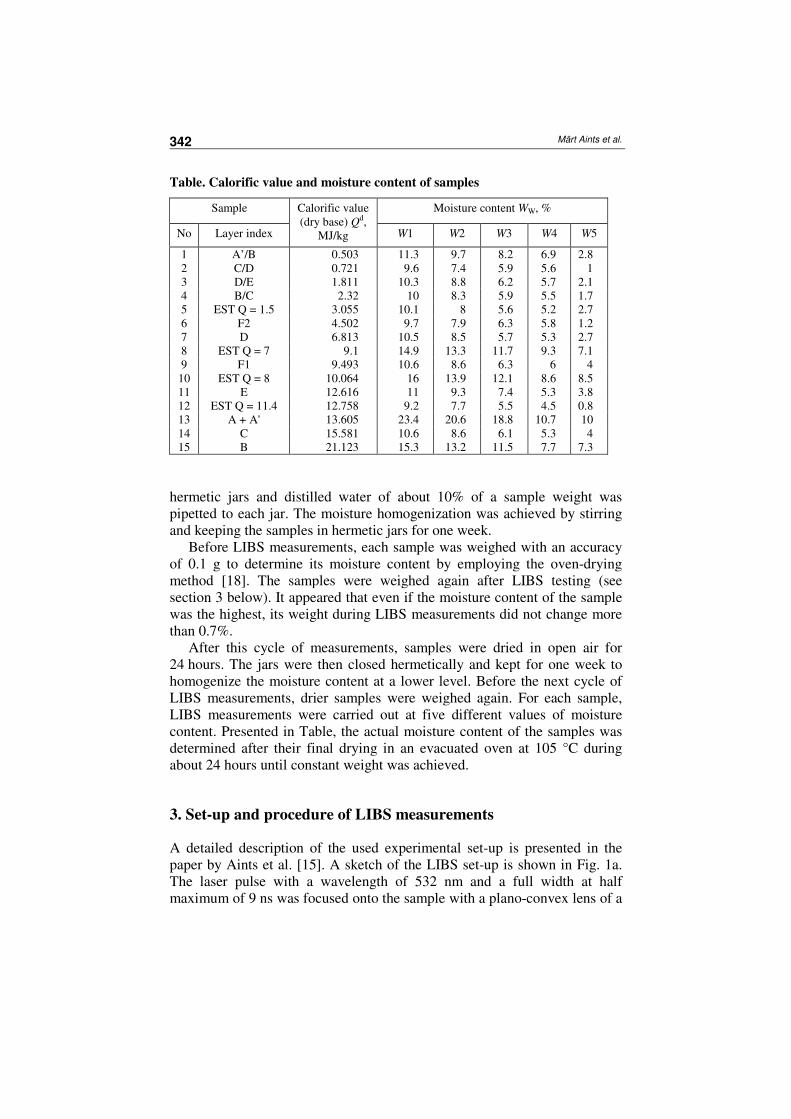
Table. Calorific value and moisture content of samples
Sample Calorific value (dry base) Qd,
MJ/kg
Moisture content WW, %
No Layer index W1 W2 W3 W4 W5
1 A’/B 0.503 11.3 9.7 8.2 6.9 2.8 2 C/D 0.721 9.6 7.4 5.9 5.6 1 3 D/E 1.811 10.3 8.8 6.2 5.7 2.1 4 B/C 2.32 10 8.3 5.9 5.5 1.7 5 EST Q = 1.5 3.055 10.1 8 5.6 5.2 2.7 6 F2 4.502 9.7 7.9 6.3 5.8 1.2 7 D 6.813 10.5 8.5 5.7 5.3 2.7 8 EST Q = 7 9.1 14.9 13.3 11.7 9.3 7.1 9 F1 9.493 10.6 8.6 6.3 6 4
10 EST Q = 8 10.064 16 13.9 12.1 8.6 8.5 11 E 12.616 11 9.3 7.4 5.3 3.8 12 EST Q = 11.4 12.758 9.2 7.7 5.5 4.5 0.8 13 A + A' 13.605 23.4 20.6 18.8 10.7 10 14 C 15.581 10.6 8.6 6.1 5.3 4 15 B 21.123 15.3 13.2 11.5 7.7 7.3
hermetic jars and distilled water of about 10% of a sample weight was pipetted to each jar. The moisture homogenization was achieved by stirring and keeping the samples in hermetic jars for one week.
Before LIBS measurements, each sample was weighed with an accuracy of 0.1 g to determine its moisture content by employing the oven-drying method [18]. The samples were weighed again after LIBS testing (see section 3 below). It appeared that even if the moisture content of the sample was the highest, its weight during LIBS measurements did not change more than 0.7%.
After this cycle of measurements, samples were dried in open air for 24 hours. The jars were then closed hermetically and kept for one week to homogenize the moisture content at a lower level. Before the next cycle of LIBS measurements, drier samples were weighed again. For each sample, LIBS measurements were carried out at five different values of moisture content. Presented in Table, the actual moisture content of the samples was determined after their final drying in an evacuated oven at 105 °C during about 24 hours until constant weight was achieved.
3. Set-up and procedure of LIBS measurements
A detailed description of the used experimental set-up is presented in the paper by Aints et al. [15]. A sketch of the LIBS set-up is shown in Fig. 1a. The laser pulse with a wavelength of 532 nm and a full width at half maximum of 9 ns was focused onto the sample with a plano-convex lens of a
Determination of the Calorific Value and Moisture Content of Crushed Oil Shale by LIBS
343
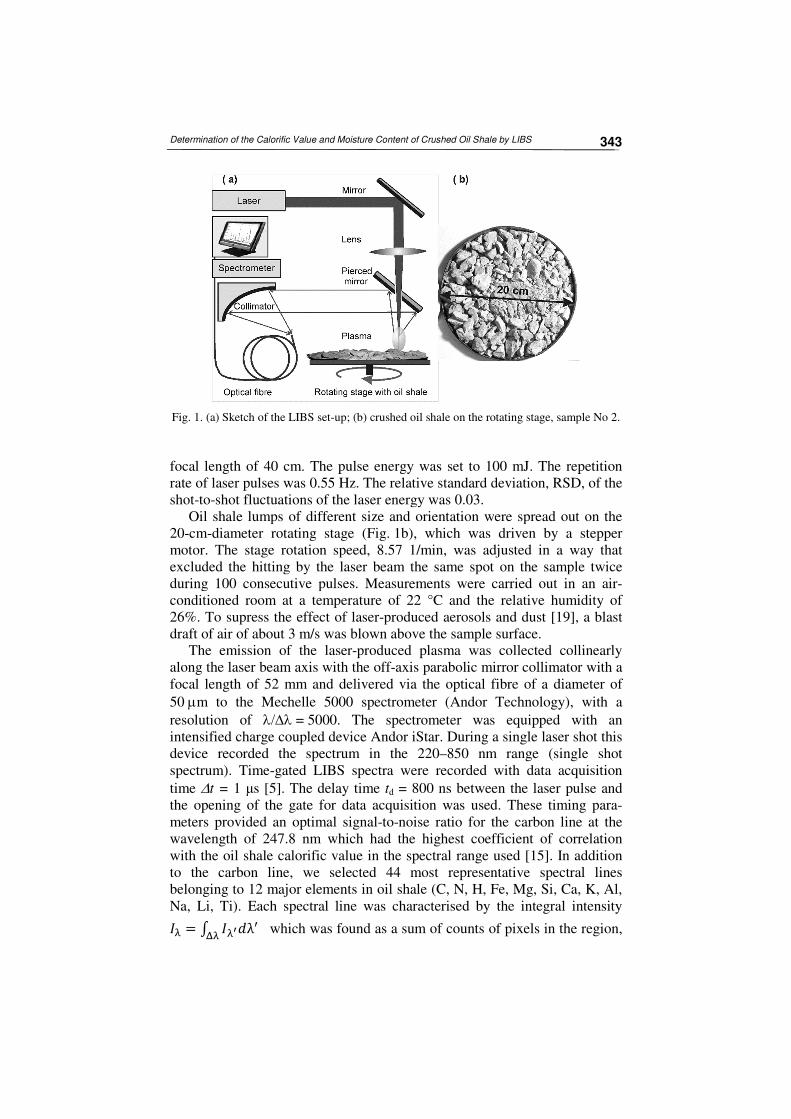
Fig. 1. (a) Sketch of the LIBS set-up; (b) crushed oil shale on the rotating stage, sample No 2.
focal length of 40 cm. The pulse energy was set to 100 mJ. The repetition rate of laser pulses was 0.55 Hz. The relative standard deviation, RSD, of the shot-to-shot fluctuations of the laser energy was 0.03.
Oil shale lumps of different size and orientation were spread out on the 20-cm-diameter rotating stage (Fig. 1b), which was driven by a stepper motor. The stage rotation speed, 8.57 1/min, was adjusted in a way that excluded the hitting by the laser beam the same spot on the sample twice during 100 consecutive pulses. Measurements were carried out in an air-conditioned room at a temperature of 22 °C and the relative humidity of 26%. To supress the effect of laser-produced aerosols and dust [19], a blast draft of air of about 3 m/s was blown above the sample surface.
The emission of the laser-produced plasma was collected collinearly along the laser beam axis with the off-axis parabolic mirror collimator with a focal length of 52 mm and delivered via the optical fibre of a diameter of 50 m to the Mechelle 5000 spectrometer (Andor Technology), with a resolution of = 5000. The spectrometer was equipped with an intensified charge coupled device Andor iStar. During a single laser shot this device recorded the spectrum in the 220–850 nm range (single shot spectrum). Time-gated LIBS spectra were recorded with data acquisition time t = 1 μs [5]. The delay time td = 800 ns between the laser pulse and the opening of the gate for data acquisition was used. These timing para-meters provided an optimal signal-to-noise ratio for the carbon line at the wavelength of 247.8 nm which had the highest coefficient of correlation with the oil shale calorific value in the spectral range used [15]. In addition to the carbon line, we selected 44 most representative spectral lines belonging to 12 major elements in oil shale (C, N, H, Fe, Mg, Si, Ca, K, Al, Na, Li, Ti). Each spectral line was characterised by the integral intensity
�� � � ����� which was found as a sum of counts of pixels in the region,
Märt Aints et al.
344
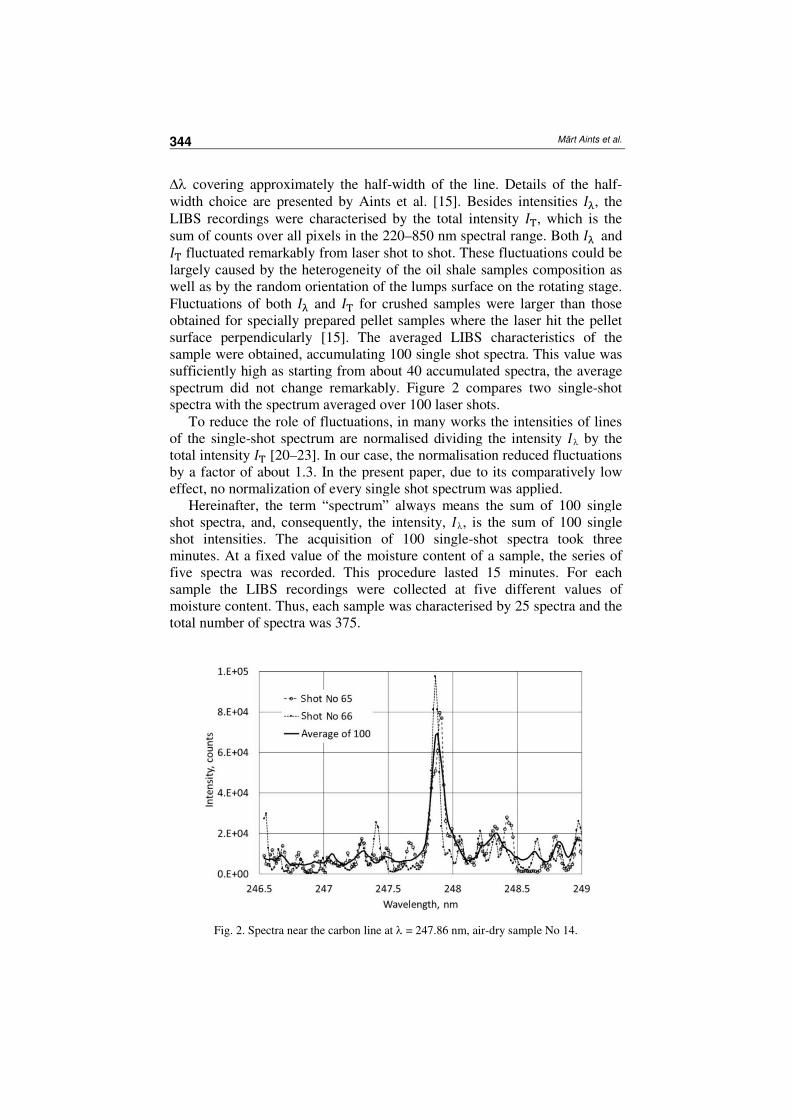
covering approximately the half-width of the line. Details of the half-width choice are presented by Aints et al. [15]. Besides intensities ��, the LIBS recordings were characterised by the total intensity �, which is the sum of counts over all pixels in the 220–850 nm spectral range. Both �� and � fluctuated remarkably from laser shot to shot. These fluctuations could be largely caused by the heterogeneity of the oil shale samples composition as well as by the random orientation of the lumps surface on the rotating stage. Fluctuations of both �� and � for crushed samples were larger than those obtained for specially prepared pellet samples where the laser hit the pellet surface perpendicularly [15]. The averaged LIBS characteristics of the sample were obtained, accumulating 100 single shot spectra. This value was sufficiently high as starting from about 40 accumulated spectra, the average spectrum did not change remarkably. Figure 2 compares two single-shot spectra with the spectrum averaged over 100 laser shots.
To reduce the role of fluctuations, in many works the intensities of lines of the single-shot spectrum are normalised dividing the intensity � by the total intensity � [20–23]. In our case, the normalisation reduced fluctuations by a factor of about 1.3. In the present paper, due to its comparatively low effect, no normalization of every single shot spectrum was applied.
Hereinafter, the term “spectrum” always means the sum of 100 single shot spectra, and, consequently, the intensity, �, is the sum of 100 single shot intensities. The acquisition of 100 single-shot spectra took three minutes. At a fixed value of the moisture content of a sample, the series of five spectra was recorded. This procedure lasted 15 minutes. For each sample the LIBS recordings were collected at five different values of moisture content. Thus, each sample was characterised by 25 spectra and the total number of spectra was 375.
Fig. 2. Spectra near the carbon line at = 247.86 nm, air-dry sample No 14.
Determination of the Calorific Value and Moisture Content of Crushed Oil Shale by LIBS
345
4. Correlation between spectral line intensity and moisture of
samples
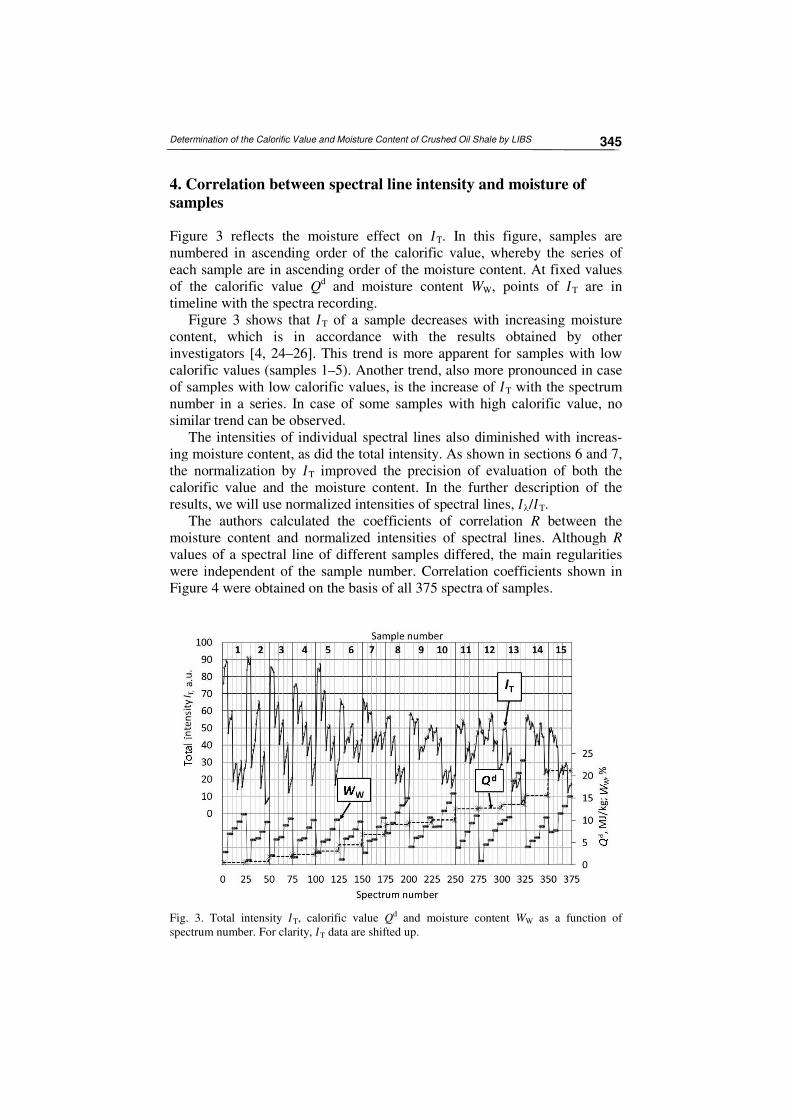
Figure 3 reflects the moisture effect on �T. In this figure, samples are numbered in ascending order of the calorific value, whereby the series of each sample are in ascending order of the moisture content. At fixed values of the calorific value Q
d and moisture content WW, points of �T are in timeline with the spectra recording.
Figure 3 shows that �T of a sample decreases with increasing moisture content, which is in accordance with the results obtained by other investigators [4, 24–26]. This trend is more apparent for samples with low calorific values (samples 1–5). Another trend, also more pronounced in case of samples with low calorific values, is the increase of �T with the spectrum number in a series. In case of some samples with high calorific value, no similar trend can be observed.
The intensities of individual spectral lines also diminished with increas-ing moisture content, as did the total intensity. As shown in sections 6 and 7, the normalization by �T improved the precision of evaluation of both the calorific value and the moisture content. In the further description of the results, we will use normalized intensities of spectral lines, �/�T.
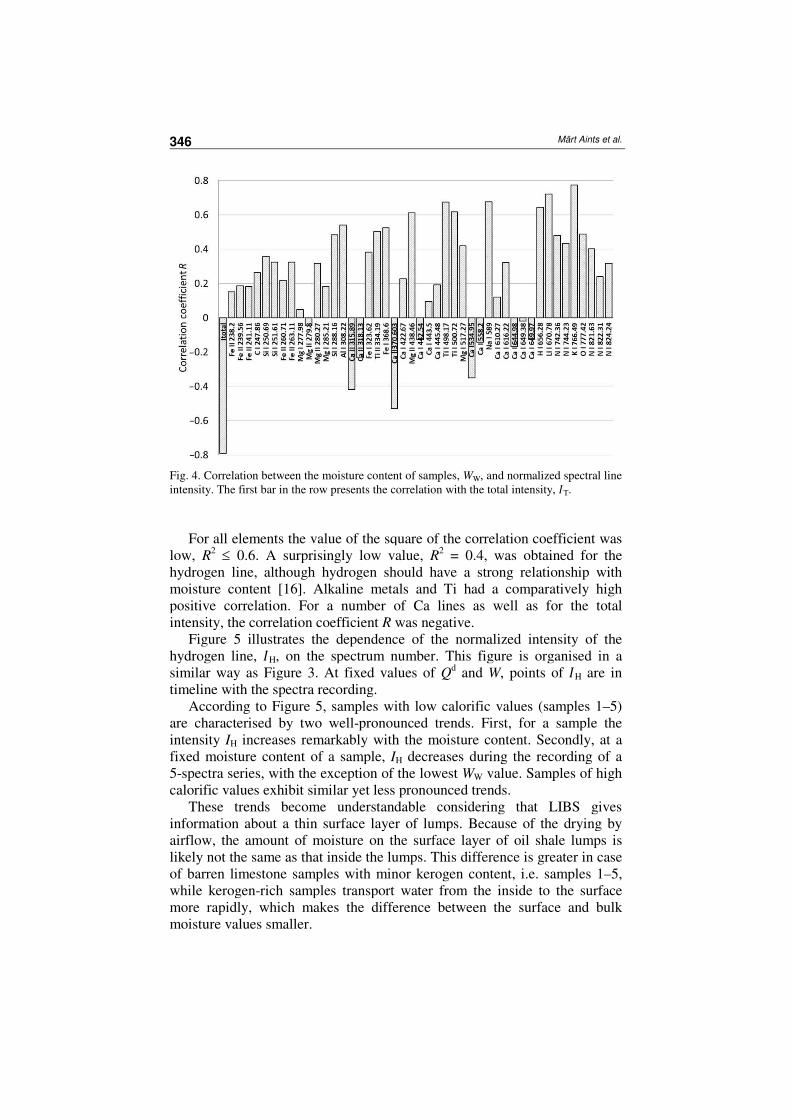
The authors calculated the coefficients of correlation R between the moisture content and normalized intensities of spectral lines. Although R values of a spectral line of different samples differed, the main regularities were independent of the sample number. Correlation coefficients shown in Figure 4 were obtained on the basis of all 375 spectra of samples.
Fig. 3. Total intensity �T, calorific value Qd and moisture content WW as a function of spectrum number. For clarity, �T data are shifted up.
Märt Aints et al.
346
Fig. 4. Correlation between the moisture content of samples, WW, and normalized spectral line intensity. The first bar in the row presents the correlation with the total intensity, �T.
For all elements the value of the square of the correlation coefficient was
low, R2 0.6. A surprisingly low value, R
2 = 0.4, was obtained for the hydrogen line, although hydrogen should have a strong relationship with moisture content [16]. Alkaline metals and Ti had a comparatively high positive correlation. For a number of Ca lines as well as for the total intensity, the correlation coefficient R was negative.
Figure 5 illustrates the dependence of the normalized intensity of the hydrogen line, �H, on the spectrum number. This figure is organised in a similar way as Figure 3. At fixed values of Q
d and W, points of �H are in timeline with the spectra recording.
According to Figure 5, samples with low calorific values (samples 1–5) are characterised by two well-pronounced trends. First, for a sample the intensity IH increases remarkably with the moisture content. Secondly, at a fixed moisture content of a sample, IH decreases during the recording of a 5-spectra series, with the exception of the lowest WW value. Samples of high calorific values exhibit similar yet less pronounced trends.
These trends become understandable considering that LIBS gives information about a thin surface layer of lumps. Because of the drying by airflow, the amount of moisture on the surface layer of oil shale lumps is likely not the same as that inside the lumps. This difference is greater in case of barren limestone samples with minor kerogen content, i.e. samples 1–5, while kerogen-rich samples transport water from the inside to the surface more rapidly, which makes the difference between the surface and bulk moisture values smaller.
Determination of the Calorific Value and Moisture Content of Crushed Oil Shale by LIBS
347
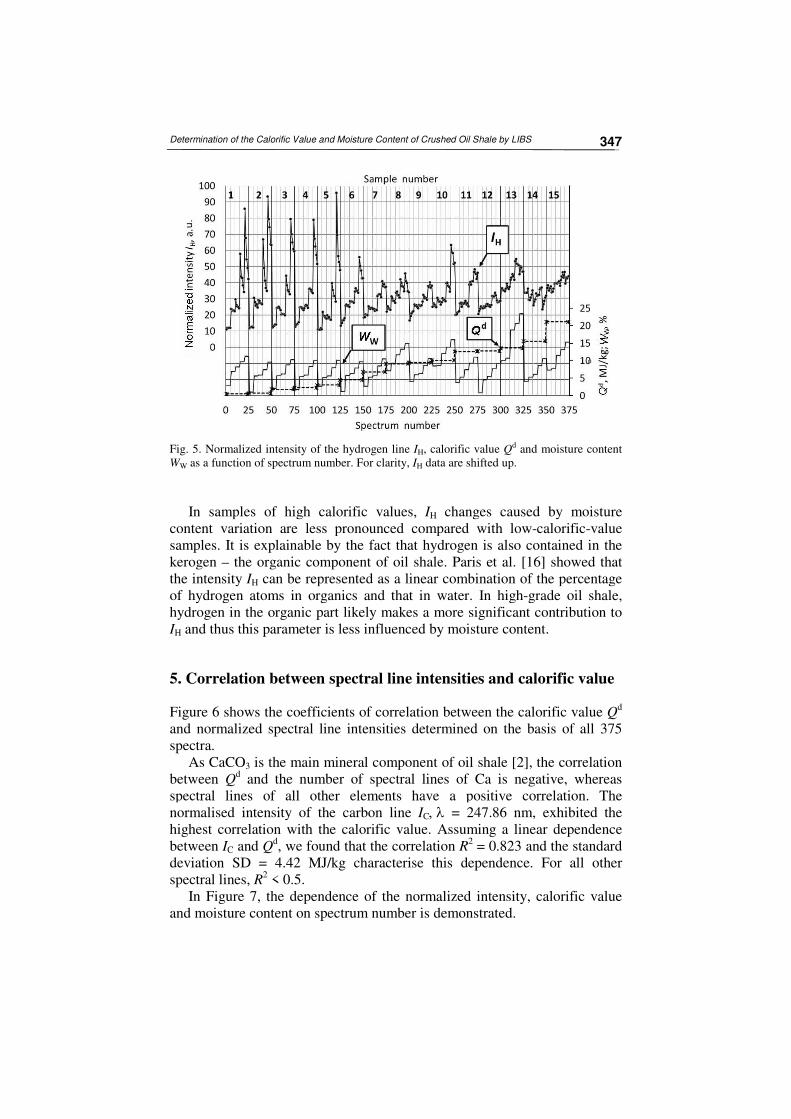
Fig. 5. Normalized intensity of the hydrogen line IH, calorific value Qd and moisture content WW as a function of spectrum number. For clarity, IH data are shifted up.
In samples of high calorific values, IH changes caused by moisture
content variation are less pronounced compared with low-calorific-value samples. It is explainable by the fact that hydrogen is also contained in the kerogen – the organic component of oil shale. Paris et al. [16] showed that the intensity IH can be represented as a linear combination of the percentage of hydrogen atoms in organics and that in water. In high-grade oil shale, hydrogen in the organic part likely makes a more significant contribution to IH and thus this parameter is less influenced by moisture content.
5. Correlation between spectral line intensities and calorific value
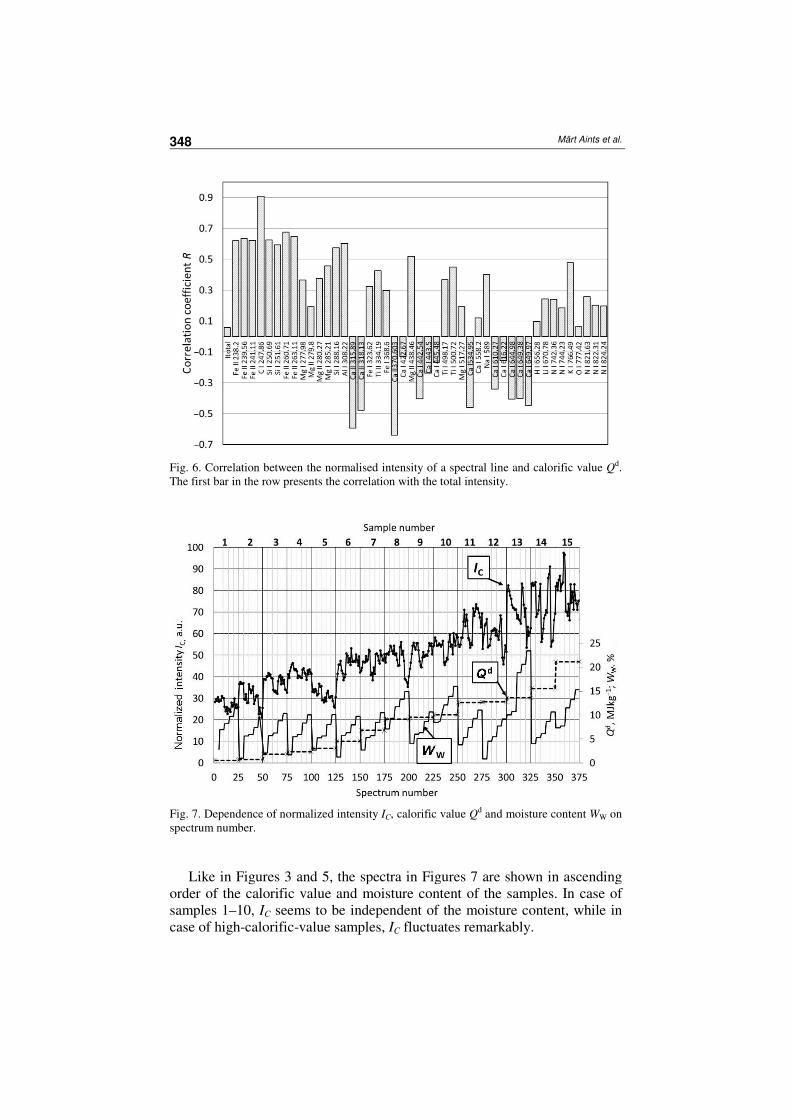
Figure 6 shows the coefficients of correlation between the calorific value Qd and normalized spectral line intensities determined on the basis of all 375 spectra.
As CaCO3 is the main mineral component of oil shale [2], the correlation between Q
d and the number of spectral lines of Ca is negative, whereas spectral lines of all other elements have a positive correlation. The normalised intensity of the carbon line IC = 247.86 nm, exhibited the highest correlation with the calorific value. Assuming a linear dependence between IC and Qd, we found that the correlation R2 = 0.823 and the standard deviation SD = 4.42 MJ/kg characterise this dependence. For all other spectral lines, R2 < 0.5.
In Figure 7, the dependence of the normalized intensity, calorific value and moisture content on spectrum number is demonstrated.
Märt Aints et al.
348
Fig. 6. Correlation between the normalised intensity of a spectral line and calorific value Qd. The first bar in the row presents the correlation with the total intensity.
Fig. 7. Dependence of normalized intensity IC, calorific value Qd and moisture content WW on spectrum number.
Like in Figures 3 and 5, the spectra in Figures 7 are shown in ascending
order of the calorific value and moisture content of the samples. In case of samples 1–10, IC seems to be independent of the moisture content, while in case of high-calorific-value samples, IC fluctuates remarkably.
Determination of the Calorific Value and Moisture Content of Crushed Oil Shale by LIBS
349
6. Multivariate linear regression model for calorific value
The standard deviation, 4.42 MJ/kg, obtained for calorific value by the carbon line only, is unacceptably high for many applications. Considering this, we further applied for the prediction of calorific value and moisture content the model of multivariate linear regression [27].
Like Aints et al. [15], we assumed that the calorific value of a sample could be expressed as a linear combination of measured spectral line intensities:
� � ∙ �, (1)
where � denotes the calorific value of a sample, vector � elements �� are intensities of spectral lines, and vector elements �� are coefficients whose values must be found during the calibration [15]. The index � has values 0… � where � is the number of spectral lines chosen for calibration.
Coefficients were calculated according to the ordinary least square regression as follows:
� (� ∙ �)�� ∙ � ∙ �, (2)
where � is an � × � matrix whose elements ��,� are normalised intensities of spectral lines used in the course of calibration, � is the number of spectra used for calibration, � is an � element vector whose elements are known values of calorific values of samples used for calibration, the superscript T denotes the transposed matrix.
The predictive power of the model was evaluated using the leave one out cross-validation method [28]. We used spectra of 14 samples, each with five different moisture contents (altogether 350 spectra) for calibration, i.e. for calculation of coefficients X according to Equation (2). Using these coefficients and the set of 25 spectra of the test sample, the calorific value was calculated according to Equation (1). This procedure was repeated, leaving out from calibration, one by one, each of 15 samples.
The standard deviation error of prediction (SDEP) was used to evaluate the predictive power of the model:
SDEP � "�# ∑ (�%
& −#% ( � �%))*, (3)
where �%) denotes the calorific value of a test sample measured with a bomb calorimeter and �%
& was calculated using Equation (1), K is the total number of measurements (K = 375).
Altogether 20 preselected lines, which had an acceptable signal-to-back-ground ratio and were not interfered with by other lines, were used for determination of the optimal number of spectral lines (variables) for the linear regression model. The optimal number of spectral lines was found by including them in the model, one at a time [28]. The first variable introduced in the regression was the intensity of the carbon line, IC, which had the best
Märt Aints et al.
350
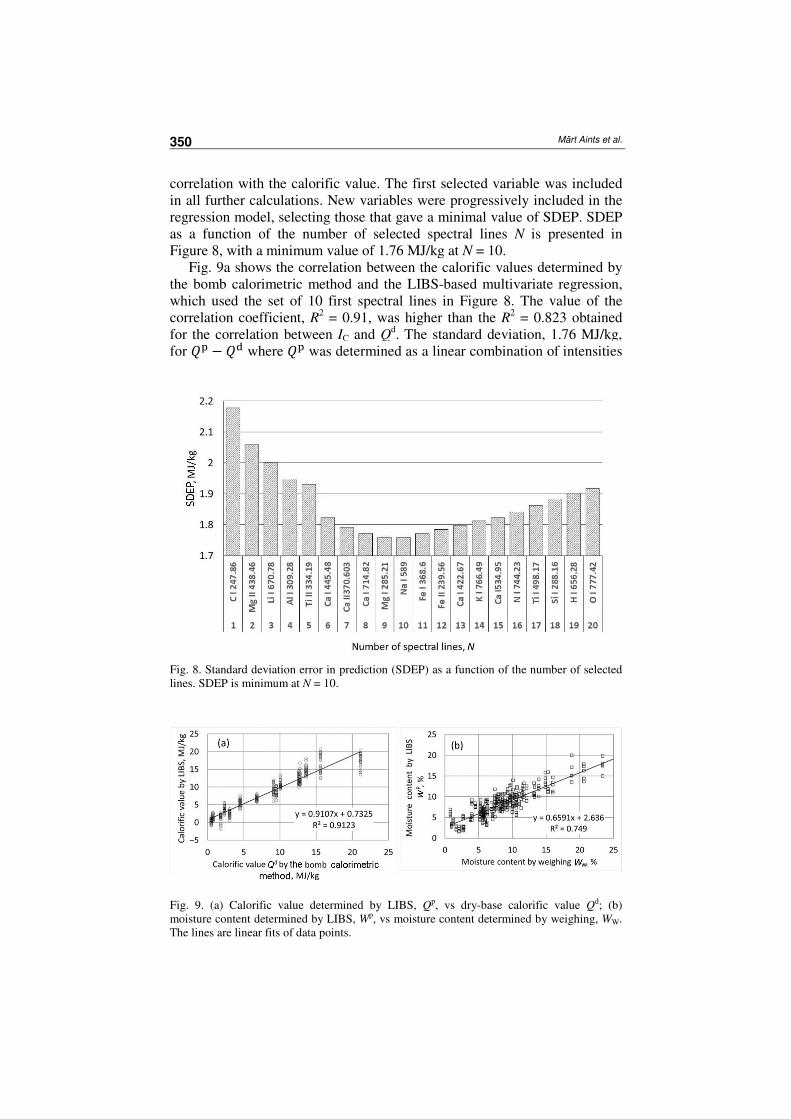
correlation with the calorific value. The first selected variable was included in all further calculations. New variables were progressively included in the regression model, selecting those that gave a minimal value of SDEP. SDEP as a function of the number of selected spectral lines N is presented in Figure 8, with a minimum value of 1.76 MJ/kg at N = 10.
Fig. 9a shows the correlation between the calorific values determined by the bomb calorimetric method and the LIBS-based multivariate regression, which used the set of 10 first spectral lines in Figure 8. The value of the correlation coefficient, R2 = 0.91, was higher than the R2 = 0.823 obtained for the correlation between IC and Qd. The standard deviation, 1.76 MJ/kg, for �& − �) where �& was determined as a linear combination of intensities
Fig. 8. Standard deviation error in prediction (SDEP) as a function of the number of selected lines. SDEP is minimum at N = 10.
Fig. 9. (a) Calorific value determined by LIBS, Qp, vs dry-base calorific value Qd; (b) moisture content determined by LIBS, Wp, vs moisture content determined by weighing, WW. The lines are linear fits of data points.
Determination of the Calorific Value and Moisture Content of Crushed Oil Shale by LIBS
351
of 10 spectral lines, was also much higher than that for the single carbon line. When using only air-dry samples for the prediction of the calorific value, the correlation R2 = 0.96 and the standard deviation was 1.1 MJ/kg. Our calculations also demonstrated that the normalization of spectral line intensities influenced the results. In case of non-normalised intensities, SD(�& − �)) � 2.92 MJ/kg.
The finding that only 10 lines were needed for determination of calorific value would allow in further studies a considerable simplification of the detection set-up.
7. Multivariate regression model for moisture content
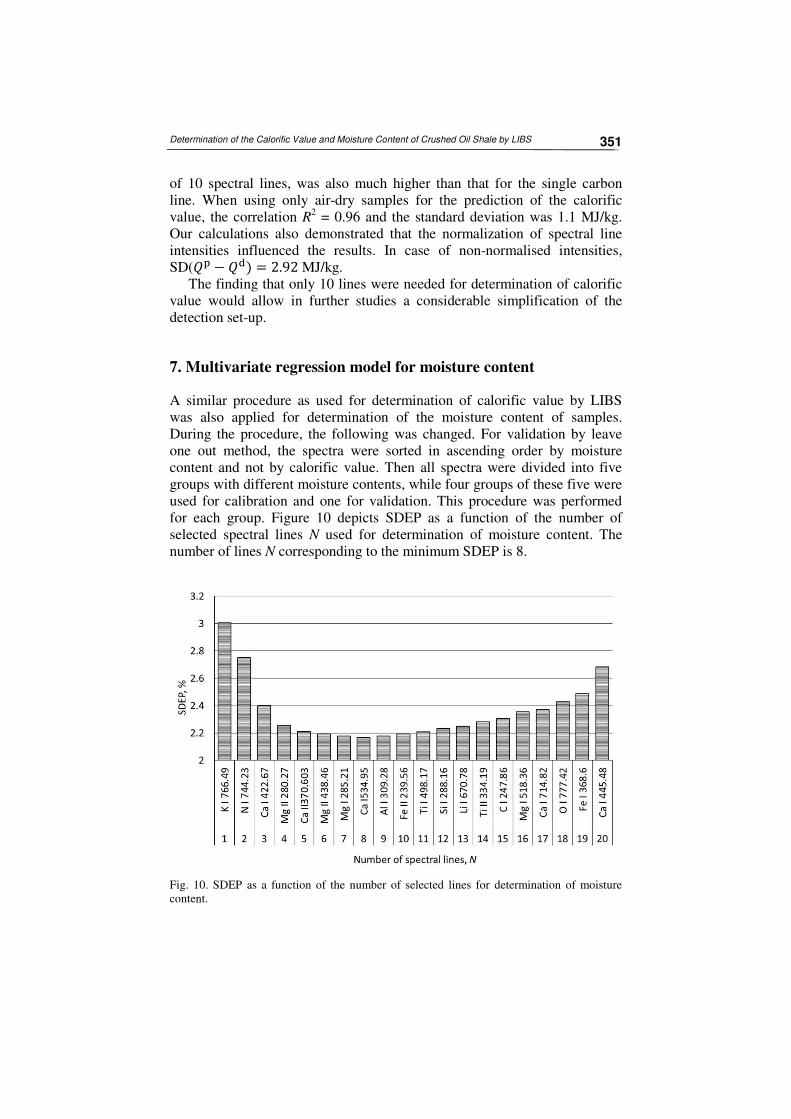
A similar procedure as used for determination of calorific value by LIBS was also applied for determination of the moisture content of samples. During the procedure, the following was changed. For validation by leave one out method, the spectra were sorted in ascending order by moisture content and not by calorific value. Then all spectra were divided into five groups with different moisture contents, while four groups of these five were used for calibration and one for validation. This procedure was performed for each group. Figure 10 depicts SDEP as a function of the number of selected spectral lines N used for determination of moisture content. The number of lines N corresponding to the minimum SDEP is 8.
Fig. 10. SDEP as a function of the number of selected lines for determination of moisture content.
Märt Aints et al.
352
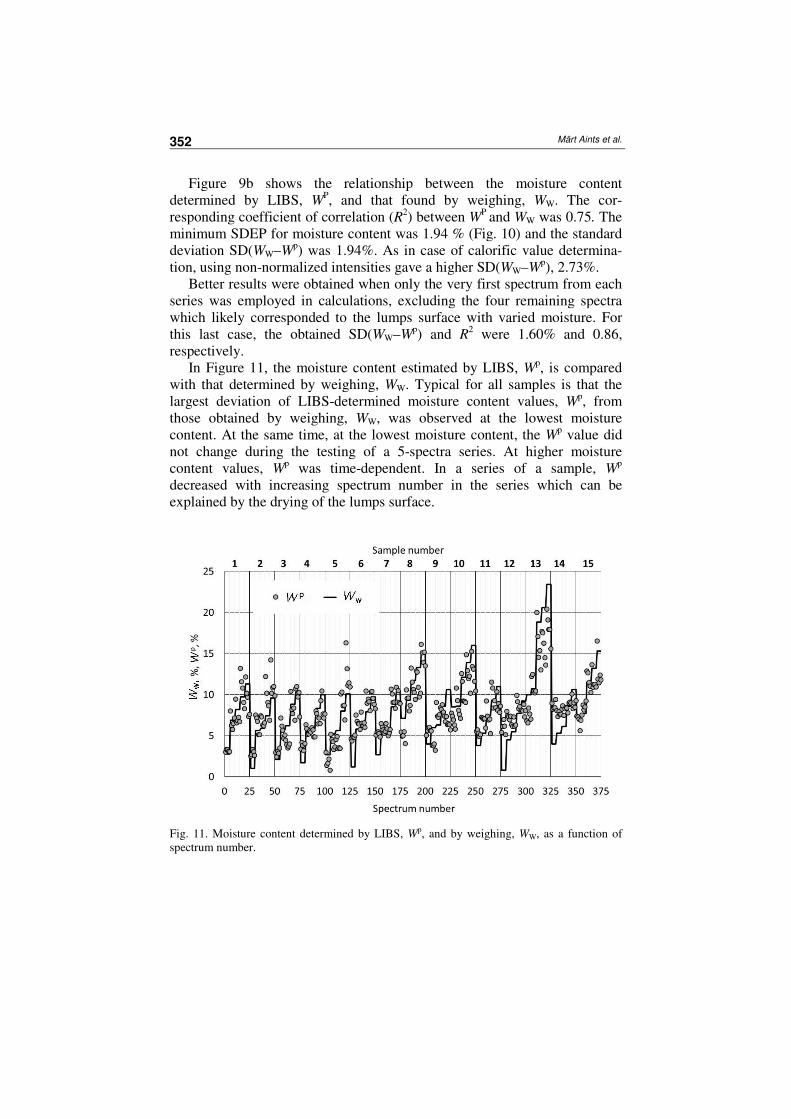
Figure 9b shows the relationship between the moisture content determined by LIBS, W
P, and that found by weighing, WW. The cor-responding coefficient of correlation (R2) between WP and WW was 0.75. The minimum SDEP for moisture content was 1.94 % (Fig. 10) and the standard deviation SD(WW–W
p) was 1.94%. As in case of calorific value determina-tion, using non-normalized intensities gave a higher SD(WW–W
p), 2.73%. Better results were obtained when only the very first spectrum from each
series was employed in calculations, excluding the four remaining spectra which likely corresponded to the lumps surface with varied moisture. For this last case, the obtained SD(WW–W
p) and R2 were 1.60% and 0.86,
respectively. In Figure 11, the moisture content estimated by LIBS, Wp, is compared
with that determined by weighing, WW. Typical for all samples is that the largest deviation of LIBS-determined moisture content values, W
p, from those obtained by weighing, WW, was observed at the lowest moisture content. At the same time, at the lowest moisture content, the Wp value did not change during the testing of a 5-spectra series. At higher moisture content values, W
p was time-dependent. In a series of a sample, Wp
decreased with increasing spectrum number in the series which can be explained by the drying of the lumps surface.
Fig. 11. Moisture content determined by LIBS, Wp, and by weighing, WW, as a function of spectrum number.
Determination of the Calorific Value and Moisture Content of Crushed Oil Shale by LIBS
353
8. Conclusions
Differently from all previous tests on oil shale by using laser-induced breakdown spectroscopy, the present study applied no preliminary samples preparation, lumps of the tested material were of different size and their facets had a random orientation against the laser beam. Measurements were carried out using the mock-up of the conveyer belt. Overall 75 objects with different calorific values and/or moisture contents were tested. The average of 100 spectra recorded from different spots of an object was used as a unit in data analysis and each object was characterised by the series of five such units.
LIBS results were compared with the calorific value found by the bomb calorimetric method and the moisture content found by the oven-drying method.
Applying the ordinary multivariate regression analysis, the calorific value and moisture content were determined on the basis of LIBS spectra. The optimal set of spectral lines needed for characterisation of oil shale quality was determined.
The root mean square error of the predicted calorific value of crude material was 1.76 MJ/kg (R2 = 0.91). The root mean square error of the predicted moisture content was 1.94 % (R2 = 0.75).
The main factor influencing the accuracy of the LIBS determination of the moisture content was the drying of the lumps surface by airflow. During a measurement series the drying led to the difference between the surface and bulk moisture amounts of lumps.
The drying effect caused by airflow will be less pronounced in case of a real running conveyer belt. Another way of decreasing the influence of difference between the surface and bulk properties of oil shale lumps is the application of a double pulse laser whose first pulse removes the thin top layer of a lump and during the second one a spectrum is recorded. Together with the improvement of the accuracy of moisture content determination, also the root mean square error of the predicted calorific value will be decreased.
The present study demonstrated that the same data recorded by laser-induced breakdown spectroscopy can be used for obtaining express information about calorific value and moisture content in conditions close to those at the conveyer belt in industry.
Acknowledgements
This work was financially supported by the Environmental Investment Centre of Estonia (project No 7594).
Märt Aints et al.
354
REFERENCES
1. Aarna, I. Developments in production of synthetic fuels out of Estonian oil shale. Energy
Environ., 2011, 22(5), 541–552. 2. Ots, A. Estonian oil shale properties and utilization in power plants. Energetika, 2007,
53(4), 8–18. 3. Valgma, I., Reinsalu, E., Sabanov, S., Karu, V. Quality control of oil shale production in
Estonian mines. Oil Shale, 2010, 27(3), 239–249. 4. Gaft, M., Dvir, E., Modiano, H., Schone, U. Laser induced breakdown spectroscopy
machine for online ash analyses in coal. Spectrochim. Acta B, 2008, 63(10), 1177–1182. 5. Hahn, D. W., Omenetto, N. Laser-induced breakdown spectroscopy (LIBS), part II:
review of instrumental and methodological approaches to material analysis and applications to different fields. Appl. Spectrosc., 2012, 66(4), 347–419.
6. Romero, E. C., De Saro, R. LIBS analysis for coal. In: Laser-Induced Breakdown
Spectroscopy: Theory and Applications (Musazzi, S., Perini, U., eds). Springer, Berlin-Heidelberg, 2014, 511–529.
7. Redoglio, D., Golinelli, E., Musazzi, S., Perini, U., Barberis, F. A large depth of field LIBS measuring system for elemental analysis of moving samples of raw coal. Spectrochim. Acta Part B At. Spectrosc., 2016, 116, 46–50.
8. Craparo, J., De Saro, R., Romero, C., Yao, Z., Whitehouse, A., Weisberg, A. Measuring thermal properties of coal with a commercial bench top LIBS system. In: Applied.
Industrial Optics: Spectroscopy, Imaging and Metrology. AIO, 2012, 4–6. 9. Yao, S., Lu, J., Dong, M., Chen, K., Li, J., Li, J. Extracting coal ash content from laser-
induced breakdown spectroscopy (LIBS) spectra by multivariate analysis. Appl.
Spectrosc., 2011, 65(10), 1197–1201. 10. Yuan, T., Wang, Z., Lui, S.-L., Fu, Y., Li, Z., Liu, J., Ni, W. Coal property analysis
using laser-induced breakdown spectroscopy. J. Anal. At. Spectrom., 2013, 28(7), 1045–1053.
11. Chen, M., Yuan, T., Hou, Z., Wang, Z., Wang, Y. Effects of moisture content on coal analysis using laser-induced breakdown spectroscopy. Spectrochim. Acta B, 2015, 112, 23–33.
12. Birdwell, J. E., Washburn, K. E. Rapid analysis of kerogen hydrogen-to-carbon ratios in shale and mudrocks by laser-induced breakdown spectroscopy. Energ. Fuel., 2015, 29(11), 6999–7004.
13. Washburn, K. E. Rapid geochemical and mineralogical characterization of shale by laser-induced breakdown spectroscopy. Org. Geochem., 2015, 83–84, 114–117.
14. Sanghapi, H. K., Jain, J., Bol’shakov, A., Lopano, C., McIntyre, D., Russo, R. Determination of elemental composition of shale rocks by laser induced breakdown spectroscopy. Spectrochim. Acta B, 2016, 122, 9–14.
15. Aints, M., Paris, P., Laan, M., Piip, K., Riisalu, H., Tufail, I. Determination of heating value of Estonian oil shale by laser-induced breakdown spectroscopy. J. Spectrosc., 2018, Article ID 4605925, 1–10.
16. Paris, P., Piip, K., Lepp, A., Lissovski, A., Aints, M., Laan, M. Discrimination of moist oil shale and limestone using laser induced breakdown spectroscopy. Spectrochim. Acta
B, 2015, 107, 61–66. 17. Väli, E., Valgma, I., Reinsalu, E. Usage of Estonian oil shale. Oil Shale, 2008, 25(2S),
101–114. 18. O’Kelly, B. C. Oven-drying characteristics of soils of different origins. Dry. Technol.,
2005, 23(5), 1141–1149. 19. Wisbrun, R., Schechter, I., Niessner, R., Schroder, H., Kompa, K. L. Detector for trace
elemental analysis of solid environmental samples by laser plasma spectroscopy. Anal.
Chem., 1994, 66(18), 2964–2975. 20. Bolger, J. A. Semi-quantitative laser-induced breakdown spectroscopy for analysis of
mineral drill core. Appl. Spectrosc., 2000, 54(2), 181–189.
Determination of the Calorific Value and Moisture Content of Crushed Oil Shale by LIBS
355
21. Feng, J., Wang, Z., Li, Z., Ni, W. Study to reduce laser-induced breakdown spectroscopy measurement uncertainty using plasma characteristic parameters. Spectrochim. Acta B, 2010, 65(7), 549–556.
22. Senesi, G. S. Laser-induced breakdown spectroscopy (LIBS) applied to terrestrial and extraterrestrial analogue geomaterials with emphasis to minerals and rocks. Earth-Sci.
Rev., 2014, 139, 231–267. 23. Tucker, J. M., Dyar, M. D., Schaefer, M. W., Clegg, S. M., Wiens, R. C. Optimization of
laser-induced breakdown spectroscopy for rapid geochemical analysis. Chem. Geol., 2010, 277(1–2), 137–148.
24. Bublitz, J., Dölle, C., Schade, W., Hartmann, A., Horn, R. Laser-induced breakdown spectroscopy for soil diagnostics. Eur. J. Soil Sci., 2001, 52(2), 305–312.
25. Chen, M., Yuan, T. Hou, Z., Wang, Z., Wang, Y. Effects of moisture content on coal analysis using laser-induced breakdown spectroscopy. Spectrochim. Acta B, 2015, 112, 23–33.
26. Kim, G., Kwak, J., Kim, K.-R., Lee, H., Kim, K.-W., Yang, H., Park, K. Rapid detection of soils contaminated with heavy metals and oils by laser induced breakdown spectroscopy (LIBS). J. Hazard. Mater., 2013, 263, 754–760.
27. Martens, H., Naes, T. Multivariate Calibration. John Wiley Sons, Chichester, 1989. 28. Shahlaei, M. Descriptor selection methods in quantitative structure–activity relationship
studies: A review study. Chem. Rev., 2013, 113(10), 8093–8103.
Presented by V. Oja, A. Konist, and A. Siirde
Received May 3, 2018