determination of the cost levels of wind farms (and their
TRANSCRIPT

Determination of the cost levels of wind farms (and their grid connections) in new offshore wind energy search areas

LCOE STUDY FOR OFFSHORE WIND ENERGY SEARCH AREAS
2
From: BLIX Consultancy BV & partners
Reference: Determination of the cost levels of wind farms (and their grid connections) in new offshore wind energy search areas, WOZ2180096
To: Ministry of Economic Affairs and Climate Policy, Netherlands Enterprise Agency (RVO), Ministry of Infrastructure and Water Management and The Directorate-General for Public Works and Water Management
Authors: BLIX Consultancy: I. Maassen van den Brink Msc, N. Olijve MSc
Pondera: W. Pustjens MSc
Review committee: BLIX Consultancy: B. de Sonneville Msc
Pondera: S. Geujen MSc
Version: Final
Date: 15 December 2020

LCOE STUDY FOR OFFSHORE WIND ENERGY SEARCH AREAS
3
Table of contents
List of Figures 5
List of Tables 8
Abbreviations and Terms 9
1 Introduction 10
1.1 Background 10
1.2 Study objective 11
1.3 Structure of report 11
2 Approach 15
2.1 Team & partners 15
2.2 Study approach 15
3 General starting points and assumptions 18
3.1 Introduction 18
3.2 General starting points 18
3.3 Main parameters of wind farm zones and wind farm sites 18
3.4 Site conditions 20
3.5 Wind farm layouts and yield calculations 30
3.6 LCoE modelling 32
Part I 37
4 Introduction Part I 38
5 Wind farm layouts 39
6 Yield analysis 42
6.1 Yield results of the wind farm zones 42
6.2 Yield results of the power density sensitivity 43
7 Comparison of levelized cost of energy 45
7.1 Relative LCoE impact of the Offshore Wind Farm (OWF) 45
7.2 Power density sensitivity of the OWF LCoE results 50
Part II 53
8 Introduction Part II 54
LCOE STUDY FOR OFFSHORE WIND ENERGY SEARCH AREAS
4
9 Wind farm layouts 56
10 Yield analysis 61
10.1 Yield results 61
10.2 Wake effects 64
11 Comparison of levelized cost of energy 70
11.1 Relative overall LCoE impact 70
11.2 Relative LCoE impact of the Offshore Wind Farm (OWF) 72
11.3 Relative LCoE impact of the Grid Connection System (GCS) 74
11.4 Landing area sensitivity of the GCS LCoE results 76
12 Discussion 79
12.1 Limitations of current approach 79
13 Conclusion 80
13.1 Conclusions 80
13.2 Recommendations 81
Reference List 83
Appendix A: Wind climate of all wind farm zones at 140 m hub height 84
Appendix B: LCoE comparison between sites 91
Relative overall LCoE impact 91
Relative LCoE impact of the Offshore Wind Farm (OWF) 93
Relative LCoE impact of the Grid Connection System (GCS) 95

LCOE STUDY FOR OFFSHORE WIND ENERGY SEARCH AREAS
5
List of Figures
Figure 1: Overview of the wind farm search areas studied in Part I 13
Figure 2: Overview of the wind farm search areas, IJVN, HKNW and HKZW studied in Part II 14
Figure 3: Overview of the wind farm zones and export cable landing sites 17
Figure 4: Graphical summary of wind climate at IJmuiden Ver at 140 m height 23
Figure 5: Water depth across all wind farm zones of Part I 24
Figure 6: Water depth across all wind farm zones of Part II 25
Figure 7: Mean significant wave height at all studied wind farm zones 26
Figure 8: Obstructions wind farm zones Part I 28
Figure 9: Obstructions wind farm zones Part II 29
Figure 10: Overview of the wind farm search areas studied in Part I 38
Figure 11: Layout WFZ IJmuiden Ver 39
Figure 12: Layout WFZ Zone 1 39
Figure 13: Layout WFZ Zone 2 40
Figure 14: Layout WFZ Zone 3 40
Figure 15: Layout WFZ Zone 5 40
Figure 16: Layout WFZ Zone 5 (mb) 40
Figure 17: Layout WFZ Zone 6 41
Figure 18: Layout WFZ Zone 7 41
Figure 19: Layout WFZ Zone 5 (mb) assuming 7 MW/km2 41
Figure 20: Layout WFZ Zone 6 assuming 6 MW/km2 41
Figure 21: Relative LCoE WFZ IJV 45
Figure 22: Relative LCoE WFZ Zone 1 45
Figure 23: Relative LCoE WFZ Zone 2 46
Figure 24: Relative LCoE WFZ Zone 3 46
Figure 25: Relative LCoE WFZ Zone 5 46
Figure 26: Relative LCoE WFZ Zone 5 (mb) 46
Figure 27: Relative LCoE WFZ Zone 6 47
Figure 28: Relative LCoE WFZ Zone 7 47
Figure 29: LCoE of the new search areas wind farm sites and IJmuiden Ver A and B 48
Figure 30: LCoE of the new search areas wind farm zones and IJmuiden Ver 50
Figure 31: Relative LCoE WFZ Zone 5 (mb) assuming 10 MW/km2 51
Figure 32: Relative LCoE WFZ Zone 5 (mb) assuming 7 MW/km2 51
Figure 33: Relative LCoE WFZ Zone 6 assuming 10 MW/km2 51
LCOE STUDY FOR OFFSHORE WIND ENERGY SEARCH AREAS
6
Figure 34: Relative LCoE WFZ Zone 6 assuming 6 MW/km2 51
Figure 35: LCoE impact of reduced densities for wind farm zones Zone 5 (mb) and Zone 6 52
Figure 36: Overview of the wind farm search areas studied in Part II 55
Figure 37: Layout Zone IJV (reference) 56
Figure 38: Layout Zone IJVN 56
Figure 39: Layout Zone 1 57
Figure 40: Layout Zone 2 57
Figure 41: Layout Zone 3 57
Figure 42: Layout Zone 4 57
Figure 43: Layout Zone 5 58
Figure 44: Layout Zone 5 clearway 58
Figure 45: Layout Zone 5 (mb) 58
Figure 46: Layout Zone 6 58
Figure 47: Layout Zone 7 59
Figure 48: Layout Zone 8 59
Figure 49: Layout Zone HKW 60
Figure 50: Layout Zone HKNW 60
Figure 51: Layout Zone HKZW 60
Figure 52: Wake losses Zone IJV 64
Figure 53: Wake losses Zone IJVN 64
Figure 54: Wake losses Zone 1 65
Figure 55: Wake losses Zone 2 65
Figure 56: Wake losses Zone 3 65
Figure 57: Wake losses Zone 4 65
Figure 58: Wake losses Zone 5 66
Figure 59: Wake losses Zone 5 clearway 66
Figure 60: Wake losses Zone 5 (mb) 66
Figure 61: Wake losses Zone 6 66
Figure 62: Wake losses Zone 7 67
Figure 63: Wake losses Zone 8 67
Figure 64: Wake losses Zone HKW (reference) 68
Figure 65: Wake losses Zone HKNW 68
Figure 66: Wake losses Zone HKZW 68
Figure 67: Wake losses of all wind farm zones in Part II 69
Figure 68: Comparison of the overall LCoE of the HVDC wind farm zones and IJmuiden Ver 71

LCOE STUDY FOR OFFSHORE WIND ENERGY SEARCH AREAS
7
Figure 69: Comparison of the overall LCoE of the HVAC wind farm zones and IJmuiden Ver 72
Figure 70: Comparison of the OWF LCoE of the HVDC wind farm zones and IJmuiden Ver 73
Figure 71: Comparison of the OWF LCoE of the HVAC wind farm zones and IJmuiden Ver 74
Figure 72: Comparison of the GCS LCoE of the HVDC wind farm zones and IJmuiden Ver 75
Figure 73: Comparison of the GCS LCoE of the HVAC wind farm zones and IJmuiden Ver 76
Figure 74: Overview of the offshore wind energy search areas (studied in Part II) 77
Figure 75: Wind climate at WFZ IJmuiden Ver at 140 m hub height 84
Figure 76: Wind climate at Zone 1 at 140 m hub height 85
Figure 77: Wind climate at Zone 2 at 140 m hub height 85
Figure 78: Wind climate at Zone 3 at 140 m hub height 86
Figure 79: Wind climate at Zone 4 at 140 m hub height 86
Figure 80: Wind climate at Zone 5 at 140 m hub height 87
Figure 81: Wind climate at Zone 6 at 140 m hub height 87
Figure 82: Wind climate at Zone 7 at 140 m hub height 88
Figure 83: Wind climate at Zone 8 at 140 m hub height 88
Figure 84: Wind climate at IJVN at 140 m hub height 89
Figure 85: Wind climate at HKW at 140 m hub height 89
Figure 86: Wind climate at HKNW at 140 m hub height 90
Figure 87: Wind climate at HKZW at 140 m hub height 90
Figure 88: Comparison of the overall LCoE of the HVDC wind farm sites and IJmuiden Ver A 91
Figure 89: Comparison of the overall LCoE of the HVAC wind farm sites and IJmuiden Ver A 92
Figure 90: Comparison of the OWF LCoE of the HVDC wind farm sites and IJmuiden Ver A 93
Figure 91: Comparison of the OWF LCoE of the HVAC wind farm sites and IJmuiden Ver A 94
Figure 92: Comparison of the GCS LCoE of the HVDC wind farm sites and IJmuiden Ver A 95
Figure 93: Comparison of the GCS LCoE of the HVAC wind farm sites and IJmuiden Ver A 96

LCOE STUDY FOR OFFSHORE WIND ENERGY SEARCH AREAS
8
List of Tables
Table 1: Wind farm zones considered in Part I 10
Table 2: Wind farm Zones considered in Part II 10
Table 3: Main parameters for the wind farms that vary between the wind farm zones and sites 19
Table 4: Main parameters for the GCS that vary between the wind farm zones and sites 19
Table 5: Wind parameters for all wind farm zones of Part I 21
Table 6: Wind parameters for all HVDC wind farm zones of Part II 22
Table 7: Wind parameters for all HVAC wind farm zones of Part II 22
Table 8: Assumed soil parameters 26
Table 9: Technical assumptions for wind farm layouts and yield 30
Table 10: Costs assumptions for OWF LCoE 34
Table 11: Costs assumptions for financial model 35
Table 12: Wind farm zones considered in Part I 38
Table 13: Wind farm layout and yield characteristics of new search areas and IJmuiden Ver 42
Table 14: Wind farm layout and yield characteristics of power density sensitivity analysis 43
Table 15: LCoE of the new search areas wind farm sites and IJmuiden Ver A and B 48
Table 16: LCoE of the new search areas wind farm zones and IJmuiden Ver 50
Table 17: Wind farm Zones considered in Part II 54
Table 18: Wind farm layout and yield characteristics of HVDC wind farm zones and IJV 62
Table 19: Wind farm layout and yield characteristics of HVAC wind farm zones and HKW 63
Table 20: Comparison of the overall LCoE of the HVDC wind farm zones and IJmuiden Ver 71
Table 21: Comparison of the overall LCoE of the HVAC wind farm zones and IJmuiden Ver 72
Table 22: Comparison of the OWF LCoE of the HVDC wind farm zones and IJmuiden Ver 73
Table 23: Comparison of the OWF LCoE of the HVAC wind farm zones and IJmuiden Ver 74
Table 24: Comparison of the GCS LCoE of the HVDC wind farm zones and IJmuiden Ver 75
Table 25: Comparison of the GCS LCoE of the HVAC wind farm zones and IJmuiden Ver 76
Table 26: Distances from the offshore substation of the wind farm sites to the landing areas 77
Table 27: Relative GCS LCoE of the HVDC sites compared to IJV A for different landing areas 78
Table 28: Comparison of the overall LCoE of the HVDC wind farm sites and IJmuiden Ver A 91
Table 29: Comparison of the overall LCoE of the HVAC wind farm sites and IJmuiden Ver A 93
Table 30: Comparison of the OWF LCoE of the HVDC wind farm sites and IJmuiden Ver A 93
Table 31: Comparison of the OWF LCoE of the HVAC wind farm sites and IJmuiden Ver A 95
Table 32: Comparison of the GCS LCoE of the HVDC wind farm sites and IJmuiden Ver A 95
Table 33: Comparison of the GCS LCoE of the HVAC wind farm sites and IJmuiden Ver A 97

LCOE STUDY FOR OFFSHORE WIND ENERGY SEARCH AREAS
9
Abbreviations and Terms
List of abbreviations and terms with their definitions:
Abbreviation or term
Definition
AEP Annual Energy Production
Capex Capital expenditure
Devex Development expenditure
DOWA Dutch Offshore Wind Atlas
GCS Grid Connection System
HVAC High Voltage Alternating Current
HVDC High Voltage Direct Current
IA Inter-Array
IRR Internal Rate of Return
KNMI Koninklijk Nederlands Meteorologisch Instituut
KNW Atlas KNMI North Sea Wind Atlas
LCoE Levelized Cost of Energy
Opex Operational expenditure
Overall LCoE Sum of the OWF LCoE and GCS LCoE
OVHS Offshore High Voltage Station
OWF Offshore Wind Farm
Search area An area that is being explored for possible assignment as Wind Farm Zone
String A group of wind turbines connected to a substation with the same cable
TSO Transmission System Operator
WACC Weighted Average Cost of Capital
WDC Wake Decay Constant
WFS Wind Farm Site, part of a Wind Farm Zone
WFZ Wind Farm Zone, zone officially assigned for development of offshore wind energy
Working group
Netherlands Enterprise Agency, The Ministry of Economic Affairs and Climate Policy, Ministry of Infrastructure and Water Management and The Directorate-General for Public Works and Water Management
WTG Wind Turbine Generator

LCOE STUDY FOR OFFSHORE WIND ENERGY SEARCH AREAS
10
1 INTRODUCTION
1.1 Background
BLIX Consultancy & partners were asked by the Netherlands Enterprise Agency (RVO), The Ministry of Economic Affairs and Climate Policy, Ministry of Infrastructure and Water Management and The Directorate-General for Public Works and Water Management, referred to as “Working group”, to determine the cost levels of offshore wind farms and their grid connection systems in new offshore wind energy search areas by performing a Levelized Cost of Energy (“LCoE”) study.
The reference for this study is IJmuiden Ver as this wind farm zone (in Dutch: “windenergiegebied”) is the last of the currently allocated wind farm zones within the 2030 Roadmap that will be developed and because IJmuiden Ver will be connected with 2 GW High Voltage Direct Current (“HVDC”) grid connection systems, currently also assumed for wind farm zones in the new search areas.
The report consists of two parts, in which newly considered wind farm zones consisting of one or more wind farm sites (in Dutch: “kavels”) are defined and assessed for two different layouts (with varying size, location and orientation) of the search areas. A distinction is made between the LCoE of the offshore wind farm (“OWF”) and the grid connection system (“GCS”).
Part I contains the results from a first study into the OWF LCoE of the offshore wind energy search areas with the assumed wind farm zones and sites listed in Table 1 and shown in Figure 1, compared to the OWF LCoE of Wind Farm Zone IJmuiden Ver.
Table 1: Wind farm zones considered in Part I
Wind Farm Zone Abbreviation Number of sites Total capacity
IJmuiden Ver IJV 2 4 GW
Zone 1 4 8 GW
Zone 2 3 6 GW
Zone 3 1 2 GW
Zone 5 5 10 GW
Zone 5 (mb) 4 8 GW
Zone 6 6 12 GW
Zone 7 4 8 GW
TOTAL 29 58 GW
After and during this study the offshore wind energy search areas were altered in shape, orientation and size based on new insights from Part I of this study, other studies commissioned by the Working group and following discussions with stakeholders.
Part II contains the results from the follow-up LCoE study of the OWF, the GCS and the sum of both (“overall LCoE”) of the defined wind farm zones and sites of the adapted search areas, IJmuiden Ver (noord), Hollandse Kust (noordwest) and Hollandse Kust (zuidwest) compared to the reference zone IJmuiden Ver and Hollands Kust (west). Table 2 lists and Figure 2 shows the wind farm zones studied in Part II with their subdivision into sites. Figure 3 shows both the wind farm zones of Part I and Part II.
Table 2: Wind farm zones considered in Part II
Wind Farm Zone Abbreviation Number of sites Total capacity
High Voltage Direct Current
IJmuiden Ver (reference) IJV 2 4 GW
IJmuiden Ver (noord) IJVN 1 2 GW
Zone 1 3 6 GW

LCOE STUDY FOR OFFSHORE WIND ENERGY SEARCH AREAS
11
Zone 2* 3 6 GW
Zone 3* 1 2 GW
Zone 4 5 10 GW
Zone 5 2 4 GW
Zone 5 clearway 2 4 GW
Zone 5 (mb) 1 2 GW
Zone 6 5 10 GW
Zone 7 5 8 GW
Zone 8 1 2 GW
High Voltage Alternating Current
Hollandse Kust (west) HKW 3 2.1 GW
Hollandse Kust (noordwest) HKNW 2 1.4 GW
Hollandse Kust (zuidwest) HKZW 2 1.4 GW
TOTAL 38 64.9 GW
*Size, location and orientation of this zone is not adapted after Part I analysis.
1.2 Study objective
The objective of this study is to assess the Levelized Cost of Energy (LCoE) of offshore wind farms and grid connection systems in the new search areas, IJVN, HKNW and HKZW in relation to IJmuiden Ver in order to support the selection of new search areas and unused parts of existing wind farm zones for future exploration of offshore wind energy. This exercise specifically focuses on the relative comparison of wind farm zones and wind farm sites and does not intend to provide an absolute LCoE analysis. Absolute LCoE analyses would require a more in-depth study with consideration of long-term offshore wind innovations and site-specific optimizations.
The sub-objectives of this LCoE study are as follows:
1. Determine the relative LCoE of the wind farm zones and wind farm sites at the new searchareas, IJVN, HKNW and HKZW, both for the offshore wind farm (OWF) and the gridconnection system (GCS), compared to the reference Wind Farm Zone IJmuiden Ver.
2. Determine which cost and yield parameters have the largest influence on the LCoEdifferences.
3. Investigate the sensitivity of the results with a wind farm site density of 6 MW/km2 insteadof the default 10 MW/km2 (Part I only).
4. Investigate the sensitivity of the GCS LCoE results with different landing areas for the exportcable instead of the default landing areas closest to the offshore substation (Part II only).
1.3 Structure of report
This report contains two consecutive studies on the Levelized Cost of Energy of various wind farm zones. The report is divided into general chapters which apply to both studies and study-specific chapters. Chapter 2 describes the approach and the project team. The general starting points and assumptions are described in Chapter 3.
The report follows with a Part I of the study which contains the chapters specific to the LCoE study results of the initial layouts of the new wind energy search areas. Chapter 4 shortly describes the content of Part I in the introduction, followed by the sites and layouts in Chapter 5. In Chapter 6 the yield results are presented. Finally, the OWF LCoE associated with each wind farm zone and site is described Chapter 7, together with the power density sensitivity results.

LCOE STUDY FOR OFFSHORE WIND ENERGY SEARCH AREAS
12
Part II of the study contains the chapters specific to the LCoE study results of the updated search areas, IJVN, HKNW and HKZW. Chapter 8 shortly describes the content of Part II in the introduction, followed by in Chapter 9 the sites and layouts. The yield results are presented in Chapter 10. Finally, the overall, OWF and GCS LCoE comparison results associated with each wind farm zone are described in Chapter 11.
The report is finalized with a discussion in Chapter 12 and conclusions in Chapter 13 which reflect on both studies.
The report is written in such a way that Part II can be read and understood without the reader having to have read Part I.

LCOE STUDY FOR OFFSHORE WIND ENERGY SEARCH AREAS
13
Figure 1: Overview of the wind farm search areas studied in Part I

LCOE STUDY FOR OFFSHORE WIND ENERGY SEARCH AREAS
14
Figure 2: Overview of the wind farm search areas, IJVN, HKNW and HKZW studied in Part II
LCOE STUDY FOR OFFSHORE WIND ENERGY SEARCH AREAS
15
2 APPROACH
2.1 Team & partners
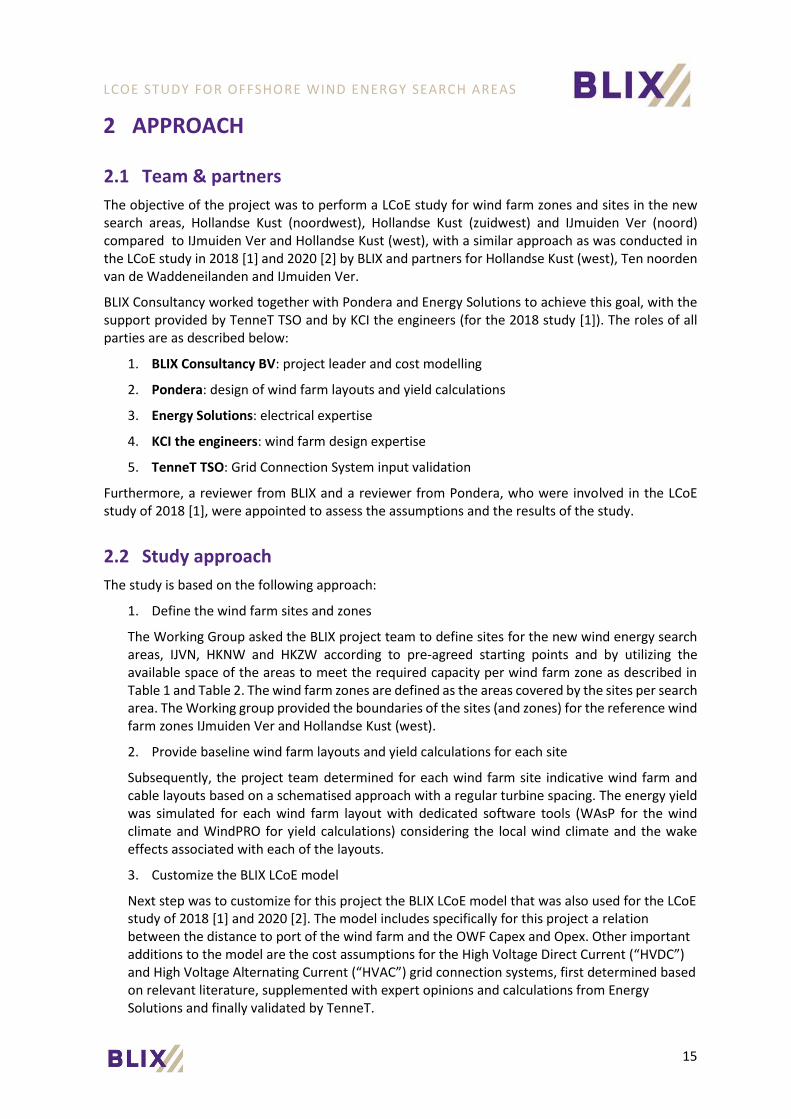
The objective of the project was to perform a LCoE study for wind farm zones and sites in the new search areas, Hollandse Kust (noordwest), Hollandse Kust (zuidwest) and IJmuiden Ver (noord) compared to IJmuiden Ver and Hollandse Kust (west), with a similar approach as was conducted in the LCoE study in 2018 [1] and 2020 [2] by BLIX and partners for Hollandse Kust (west), Ten noorden van de Waddeneilanden and IJmuiden Ver.
BLIX Consultancy worked together with Pondera and Energy Solutions to achieve this goal, with the support provided by TenneT TSO and by KCI the engineers (for the 2018 study [1]). The roles of all parties are as described below:
1. BLIX Consultancy BV: project leader and cost modelling
2. Pondera: design of wind farm layouts and yield calculations
3. Energy Solutions: electrical expertise
4. KCI the engineers: wind farm design expertise
5. TenneT TSO: Grid Connection System input validation
Furthermore, a reviewer from BLIX and a reviewer from Pondera, who were involved in the LCoE study of 2018 [1], were appointed to assess the assumptions and the results of the study.
2.2 Study approach
The study is based on the following approach:
1. Define the wind farm sites and zones
The Working Group asked the BLIX project team to define sites for the new wind energy search areas, IJVN, HKNW and HKZW according to pre-agreed starting points and by utilizing the available space of the areas to meet the required capacity per wind farm zone as described in Table 1 and Table 2. The wind farm zones are defined as the areas covered by the sites per search area. The Working group provided the boundaries of the sites (and zones) for the reference wind farm zones IJmuiden Ver and Hollandse Kust (west).
2. Provide baseline wind farm layouts and yield calculations for each site
Subsequently, the project team determined for each wind farm site indicative wind farm and cable layouts based on a schematised approach with a regular turbine spacing. The energy yield was simulated for each wind farm layout with dedicated software tools (WAsP for the wind climate and WindPRO for yield calculations) considering the local wind climate and the wake effects associated with each of the layouts.
3. Customize the BLIX LCoE model
Next step was to customize for this project the BLIX LCoE model that was also used for the LCoE study of 2018 [1] and 2020 [2]. The model includes specifically for this project a relation between the distance to port of the wind farm and the OWF Capex and Opex. Other important additions to the model are the cost assumptions for the High Voltage Direct Current (“HVDC”) and High Voltage Alternating Current (“HVAC”) grid connection systems, first determined based on relevant literature, supplemented with expert opinions and calculations from Energy Solutions and finally validated by TenneT.

LCOE STUDY FOR OFFSHORE WIND ENERGY SEARCH AREAS
16
4. Calculate the LCoE of each wind farm site
The BLIX LCoE model was used to calculate and compare the LCoE for the OWF and GCS for each wind farm site within the wind farm zones. The OWF LCoE, GCS LCoE, overall LCoE (sum of OWF LCoE and GCS LCoE) and the impact of the parameters on the LCoE differences was analysed per site and conclusions are drawn regarding the average LCoE of the different wind farm zones. This provides a basis for decisions on the size and subdivision of the new search areas.
5. Perform sensitivity analysis on the LCoE results
Part I of the study performed a sensitivity analysis on the impact of the power density (in MW / km2) on the OWF LCoE results and Part II examined the sensitivity of the GCS LCoE results for the selected export cable landing area.
2.2.1 Power density sensitivity analysis
All scenarios assume a grid of 5.5 by 5.5 times the rotor diameter (1,210 m by 1,210 m) based on a wind farm density of 10 MW/km2. Allowing more space between wind turbines leads a reduction in wind farm density and wake losses.
This sensitivity analysis investigates the effect of a reduced wind farm density on the LCoE at Zone 5 (mb) and Zone 6. These two zones are selected because they are considered representative for all wind farm zones. Both sites have comparable LCoE results, the only difference between the sites is the effect of wake losses. This is especially useful as wake losses are most affected by differences in power density. Zone 5 is one of the zones with the highest wake losses and Zone 6 has the lowest wake losses after Zone 3, which consists of only 1 site and is therefore less representative for the other zones.
The distance between wind turbines is increased to 7.2 rotor diameters, or a grid of 1,580 m by 1,580 m, which leads to a wind farm density of 6 MW/km2.
2.2.2 Landing area sensitivity analysis
Part II includes the results of a sensitivity analysis to investigate the impact of the various export cable landing sites on the GCS LCoE of the wind farm zones. Hereto, TenneT provided the selection of landing sites considered per wind farm site. In alignment with the Working Group the base assumption of the landing site for each wind farm site was chosen based on the shortest distance to the onshore substation. In practise, the actual landing site of a wind farm site is determined by TenneT based on an effect analysis which takes into account varying factors such as the remaining connection capacity of the onshore substation or the transport capacity of the onshore grid.
The starting point for the sensitivity analysis is that the export cables of Zone 1, 2, 3, 7, 8, IJVN A and IJVN B are connected to the West coast of the Netherlands and Zone 4, 5, 5 clearway and 5 (mb) are connected to the landing site Eemshaven.
The landing sites are listed below and depicted in Figure 3:
• Noordzeekanaalgebied (NZK)
• Rijnmondgebied (RNM)
• Zeeland/West-Brabant (Z/W)
• Eemshaven-Delfzijl (E-D)

LCOE STUDY FOR OFFSHORE WIND ENERGY SEARCH AREAS
17
Figure 3: Overview of the wind farm zones and export cable landing sites

LCOE STUDY FOR OFFSHORE WIND ENERGY SEARCH AREAS
18
3 GENERAL STARTING POINTS AND ASSUMPTIONS
3.1 Introduction
This chapter describes the main general starting points and assumptions for the study applicable to both Part I and Part II. First the starting points are described, followed by an assessment of the main parameters that vary between the wind farm zones/sites and their influence on the LCoE. Then the local site conditions (wind climate, hydrodynamic and soil parameters) and the technical assumptions are elaborated upon, followed by the assumptions for the wind farm layouts and yield calculations.
3.2 General starting points
The following general starting points were agreed upon with the Working group:
1. The aim of the LCoE modelling is to compare relative differences between the different windfarm zones and sites, not to obtain realistic absolute values of the LCoE. Therefore, onlyrelative differences are shown in the present report.
2. The wind farm layouts should be considered indicative (not optimised) and based on aschematised regular pattern to allow a fair comparison between the wind farm zones andsites. In reality, there may be optimisations possible based on more detailed assessmentsand more available site data. These optimisations are not part of the scope of the presentstudy.
3. At the request of the Working group, the same OWF model assumptions were used as usedfor the 2018 LCoE study [1] and 2020 HKW LCoE study [2] so that the results of all studiescan be directly compared with each other and to meet the tight schedule of the project. TheOWF model inputs are based on the latest projects BLIX participated in at that time, such asthe Dutch offshore wind tenders (Borssele I&II, III&IV and Hollandse Kust (zuid) I&II),German offshore tenders and UK offshore tenders, plus experts’ forecasts1.
4. The cost modelling for the GCSs of Part II consists of an offshore substation, export cableand onshore substation. The export cable length of the grid connection is based on thedistance to one of four potential landing areas and does not take into account potentiallimitations of the onshore grid (for detailed explanation please see paragraph 3.3.1). Theanalysis in Part I does not include the GCS.
5. The wind farm size is based on the standardised grid connection systems currently used byTenneT, i.e. 2 GW for high voltage direct current (“HVDC”) connections and 700 MW for highvoltage alternating current (“HVAC”) connections excluding overplanting).
3.3 Main parameters of wind farm zones and wind farm sites
The study analyses results on two levels: on the wind farm zone level and on the wind farm site level. The wind farm zone level is used for comparing zones, and the wind farm site level is used for comparing sites within a zone.
1 BLIX has supported development of several projects that will be constructed post 2020. Based on this knowledge, estimations/extrapolations have been made for wind farms that will be constructed in the period around 2025 and later.

LCOE STUDY FOR OFFSHORE WIND ENERGY SEARCH AREAS
19
As a first step of the model schematisation, an assessment was performed of the parameters that differ between wind farm zones and wind farm sites and their expected qualitative impact on the LCoE. These are described below in Table 3 for the OWF parameters and Table 4 for the GCS parameters.
Table 3: Main parameters for the wind farms that vary between the wind farm zones and sites
Parameter Wind farm zone level Wind farm site level
Wake losses High Differs significantly between wind zones; influences the net yield.
High Differs significantly between wind sites; influences the net yield.
Water depth of wind farm zone
High Differs between zones; affects the foundation cost, particularly in case of large water depth variations.
Low Limited differences between sites; affects the foundation cost, particularly in case of large water depth variations.
Infield cable length
Low Limited differences between zones; influences the cable installation cost.
Medium Differs between sites; influences the cable installation cost.
Number of cable crossings
Low Differs between zones; slightly influences the cable installation cost.
Low Differs between sites; slightly influences the cable installation cost.
IA cable losses Low Differs slightly between zones; string length and number of turbines on string influence the cable (transmission) losses.
Low Differs slightly between sites; string length and number of turbines on string influence the cable (transmission) losses.
Wave conditions
Low Limited differences between zones; affects the foundation cost. Assumed negligible.
Low Limited differences between sites; affects the foundation cost. Assumed negligible.
Mean wind speed
Medium Differs between zones, with slightly higher wind speeds at northern WFZs; influences gross yield.
Low Limited wind speed gradient across zones, leading to minor differences per site; influences gross yield.
Distance to port (marshalling harbours)
High Differs between zones. Influences the Capex (installation) and Opex of the WTG and foundation.
Medium Differs between sites. Influences the Capex (installation) and Opex of the WTG and foundation.
Table 4: Main parameters for the GCS that vary between the wind farm zones and sites
Parameter Wind farm zone level Wind farm site level
Water depth of wind farm zone
Medium Differs between zones; affects the OHVS foundation costs.
Low Limited differences between sites; affects the OHVS foundation costs.
Distance to onshore substation
High Differs significantly between zones; affects the export cable length which affects export cable Capex, export cable Opex, export cable losses and availability.
Medium Can differ between sites depending on the shape and location of the wind farm zone; affects the export cable Capex, export cable Opex, export cable losses and availability.
Distance to port Limited Limited impact on the OHVS Opex. Planned maintenance is performed in longer timeslots reducing the effect of distance. Unplanned
Limited Limited impact on the OHVS Opex. Planned maintenance is performed in longer timeslots reducing the effect of distance. Unplanned

LCOE STUDY FOR OFFSHORE WIND ENERGY SEARCH AREAS
20
maintenance is done by helicopter (HVDC only). Neglected in this study.
maintenance is done by helicopter (HVDC only). Neglected in this study.
Water depth of cable route
Limited Does not significantly affect the installation costs. Opex generally consists of surveys which are also unaffected by water depth at the assumed water depths within this study. Neglected in this study.
Limited Does not significantly affect the installation costs. Opex generally consists of surveys which are also unaffected by water depth. Neglected in this study.
Wind farm size High Differs significantly between HVDC and HVAC zones. 700 MW HVAC wind farms have a relatively high Capex compared to the 2 GW HVDC wind farms due to economies of scale, indicated by wind farm size costs.
High Differs significantly between HVDC and HVAC sites. 700 MW HVAC wind farms have a relatively high Capex compared to the 2 GW HVDC wind farms due to economies of scale, indicated by wind farm size costs.
Transmission type
High Significantly affects the Capex of the whole GCS, especially of the OHVS. In the study these additional costs for HVDC systems are indicated as transmission type costs.
High Significantly affects the Capex of the whole GCS, especially of the OHVS. In the study these additional costs for HVDC systems are indicated as transmission type costs.
3.3.1 Distance to port
The distance of the wind farm sites to the closest marshalling harbours was newly added to the list of main varying parameters that influence the OWF LCoE (compared the approach followed in the 2018 [1] and 2020 LCoE study). The following assumptions have been made in relation to the ports for the determination of the factors in the LCoE study:
• All distances have been based on the shortest connection between the site and the closestmarshalling harbour. A small correction has been applied for additional traveling distancebased due to already present obstacles and infrastructure, such as shipping routes,pipelines and electrical cables.
• Gradual scales were used for the distance to the ports, with thresholds based on thepreferred type of vessel (Crew Transfer Vessels or Service Operating Vessel) and the traveltime.
• All hardware and equipment to be installed is assumed to be located at the marshallingharbour. No additional costs are taken into account other than in the supply costs.
3.4 Site conditions
The site conditions can be divided into the following categories: wind climate, water depth, wave conditions, soil conditions and current obstructions and stakeholders.
3.4.1 Wind climate
The wind climate is assessed as reference for the yield calculations and is determined using long-term mesoscale data of the KNMI North Sea Wind (KNW) Atlas. The KNW Atlas is based on the ERA-Interim reanalysis dataset and it covers the period 1979-2019 (up to August) with hourly intervals. The KNW Atlas has been validated against publicly available wind measurements from three tall

LCOE STUDY FOR OFFSHORE WIND ENERGY SEARCH AREAS
21
offshore wind masts: OWEZ, FINO1 and MMIJ (Meteorological Mast IJmuiden). In this study a dataset of 15 full years in the period 01-01-2004 to 31-12-2018 is analysed.
KNMI recently launched the Dutch Offshore Wind Atlas (DOWA) as a successor to the KNW Atlas, containing 10 years of wind climatology (2008 - 2017). As 15 years of data is commonly accepted as a minimum for long-term reference for wind resource assessments, the DOWA data is not considered for this study.
At the edges of every WFZ, a selection of ‘data nodes’ of the KNW dataset are used to find the horizontal gradient of the wind climate. The annual mean wind speed at each wind turbine location is determined using the nearest KNW node. Appendix A shows Weibull distributions and wind roses for every wind farm zone.
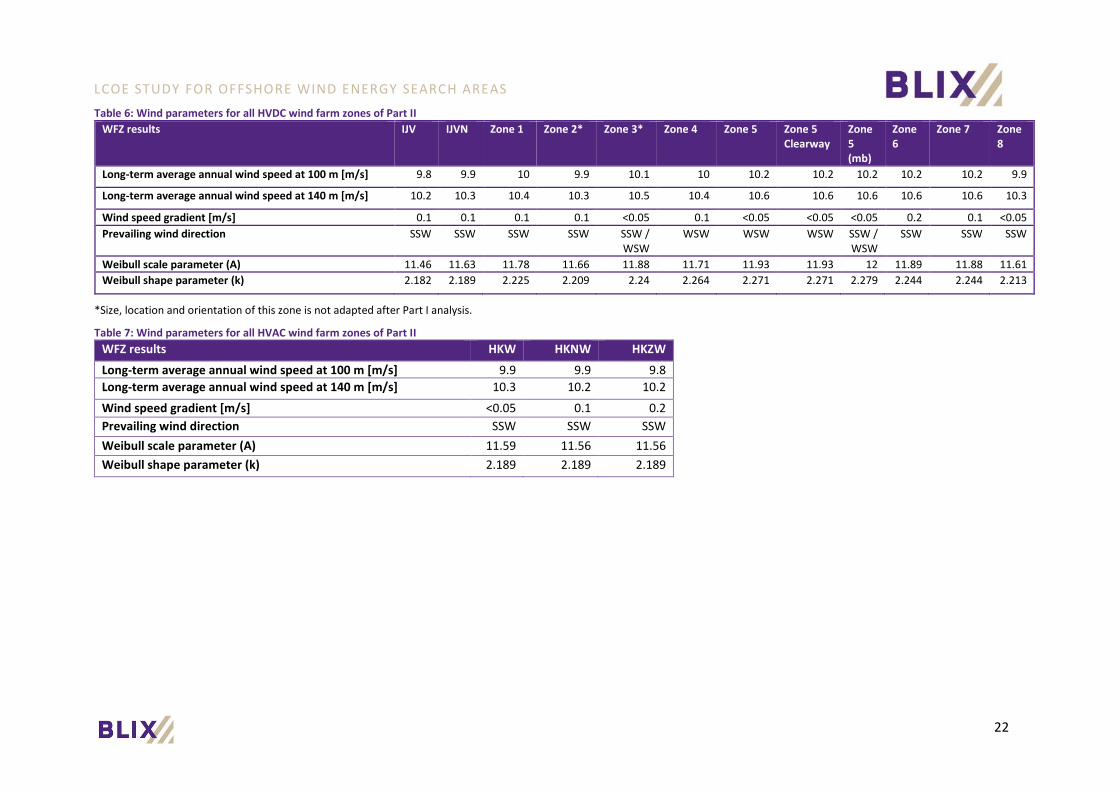
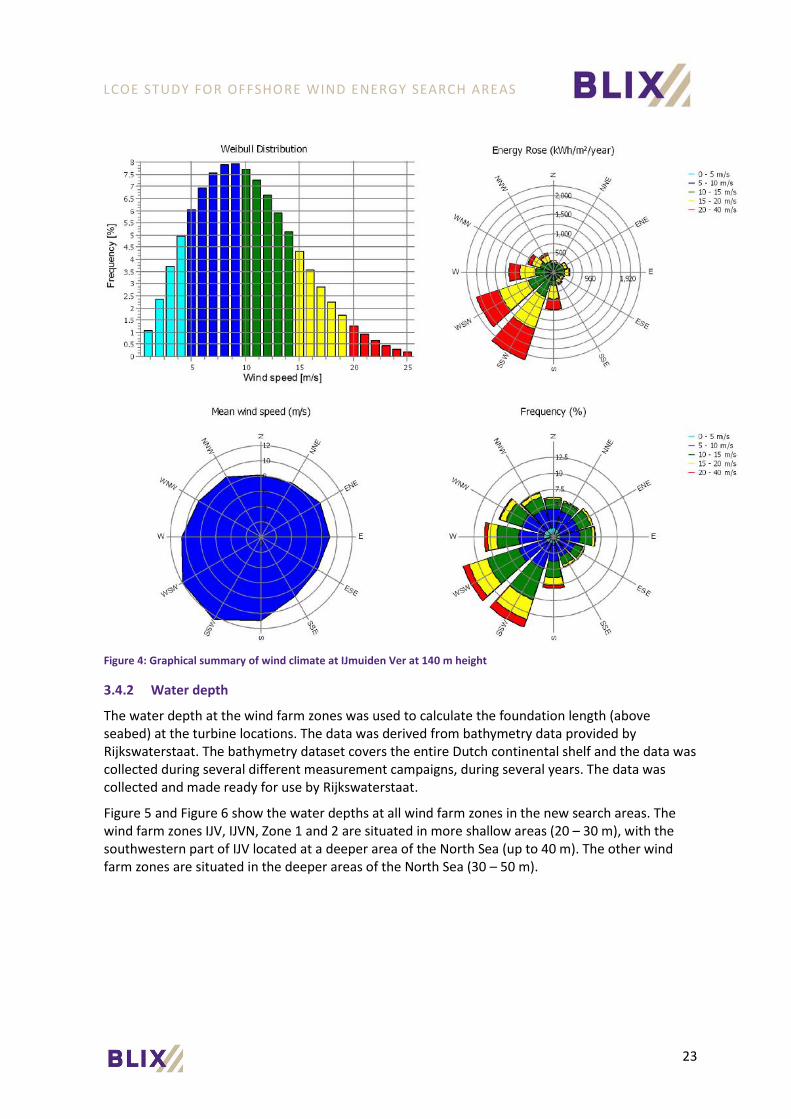
Table 5, Table 6 and Table 7 summarize the most important parameters and values found in the wind resource assessment of the wind farm zones. Parameters given in the tables below are from wind climate nodes closest to shore at 140 m height. A 0.4 m/s wind speed gradient at 140 m height (Zone 5, 5 clearway, 5 (mb), 6 and 7) is observed between IJmuiden Ver and northern wind farm zone locations (Zone 5 and Zone 7). Moreover, the prevailing wind direction in the southernmost wind farm zones (IJV, IJVN, Zone 1 and Zone 2) is south-south-west; the western and west-south-western wind directions become more dominant further towards the north and northeast of the North Sea. Figure 4 graphically summarizes the wind climate at the IJmuiden Ver wind farm zone.
Table 5: Wind parameters for all wind farm zones of Part I
WFZ results IJV Zone 1 Zone 2*
Zone 3* Zone 5 Zone 5 (mb)
Zone 6 Zone 7
Long-term average annual wind speed at wind farm area at 100 m height [m/s]
9.8 10.0 9.9 10.1 10.2 10.2 10.2 10.1
Long-term average annual wind speed at wind farm area at 140 m height [m/s]
10.2 10.4 10.3 10.5 10.6 10.6 10.7 10.6
Wind speed gradient across wind farm zone [m/s]
0.1 0.1 0.1 <0.05 0.2 0.1 0.1 <0.05
Prevailing wind direction SSW SSW SSW SSW / WSW
WSW WSW WSW WSW / SSW
Weibull scale parameter (A) 11.46 11.78 11.66 11.88 11.96 11.98 11.98 11.91
Weibull shape parameter (k)
2.182 2.225 2.209 2.240 2.268 2.256 2.256 2.244
*Size, location and orientation of this zone is not adapted after Part I analysis.
LCOE STUDY FOR OFFSHORE WIND ENERGY SEARCH AREAS
22
Table 6: Wind parameters for all HVDC wind farm zones of Part II
WFZ results IJV IJVN Zone 1 Zone 2* Zone 3* Zone 4 Zone 5 Zone 5 Clearway
Zone 5 (mb)
Zone 6
Zone 7 Zone 8
Long-term average annual wind speed at 100 m [m/s] 9.8 9.9 10 9.9 10.1 10 10.2 10.2 10.2 10.2 10.2 9.9
Long-term average annual wind speed at 140 m [m/s] 10.2 10.3 10.4 10.3 10.5 10.4 10.6 10.6 10.6 10.6 10.6 10.3
Wind speed gradient [m/s] 0.1 0.1 0.1 0.1 <0.05 0.1 <0.05 <0.05 <0.05 0.2 0.1 <0.05
Prevailing wind direction SSW SSW SSW SSW SSW / WSW
WSW WSW WSW SSW / WSW
SSW SSW SSW
Weibull scale parameter (A) 11.46 11.63 11.78 11.66 11.88 11.71 11.93 11.93 12 11.89 11.88 11.61
Weibull shape parameter (k) 2.182 2.189 2.225 2.209 2.24 2.264 2.271 2.271 2.279 2.244 2.244 2.213
*Size, location and orientation of this zone is not adapted after Part I analysis.
Table 7: Wind parameters for all HVAC wind farm zones of Part II
WFZ results HKW HKNW HKZW
Long-term average annual wind speed at 100 m [m/s] 9.9 9.9 9.8
Long-term average annual wind speed at 140 m [m/s] 10.3 10.2 10.2
Wind speed gradient [m/s] <0.05 0.1 0.2
Prevailing wind direction SSW SSW SSW
Weibull scale parameter (A) 11.59 11.56 11.56
Weibull shape parameter (k) 2.189 2.189 2.189
LCOE STUDY FOR OFFSHORE WIND ENERGY SEARCH AREAS
23
Figure 4: Graphical summary of wind climate at IJmuiden Ver at 140 m height
3.4.2 Water depth
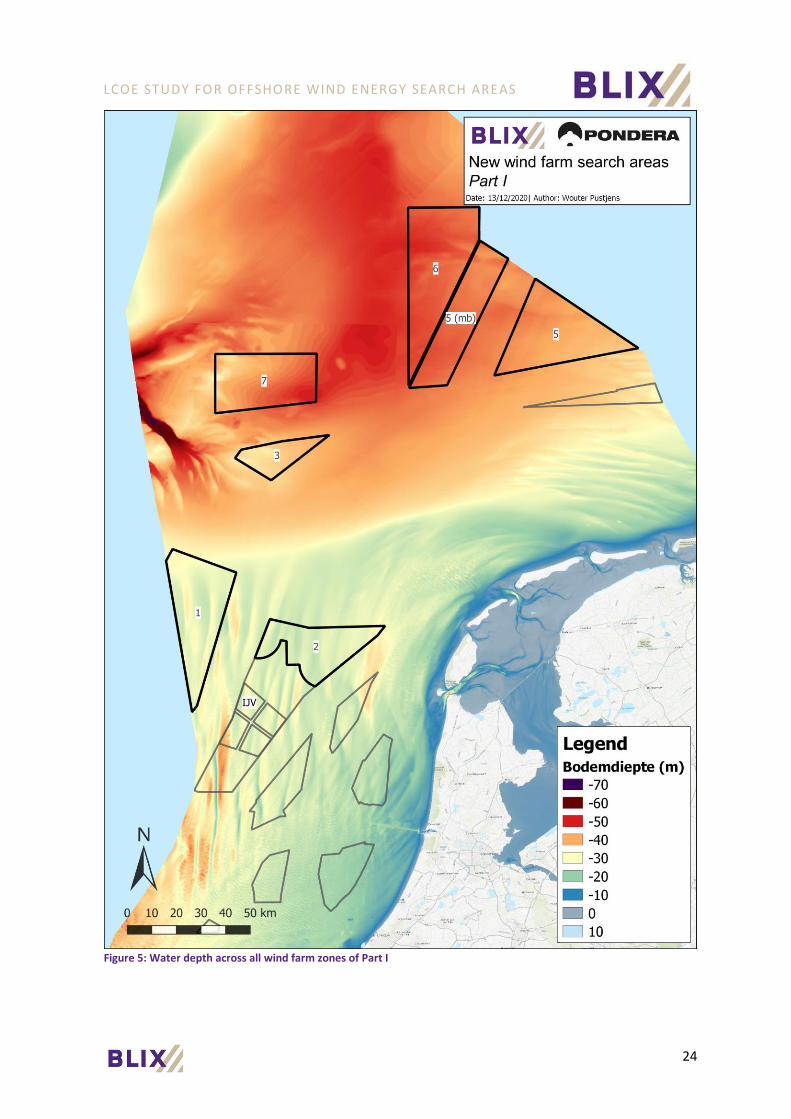
The water depth at the wind farm zones was used to calculate the foundation length (above seabed) at the turbine locations. The data was derived from bathymetry data provided by Rijkswaterstaat. The bathymetry dataset covers the entire Dutch continental shelf and the data was collected during several different measurement campaigns, during several years. The data was collected and made ready for use by Rijkswaterstaat.
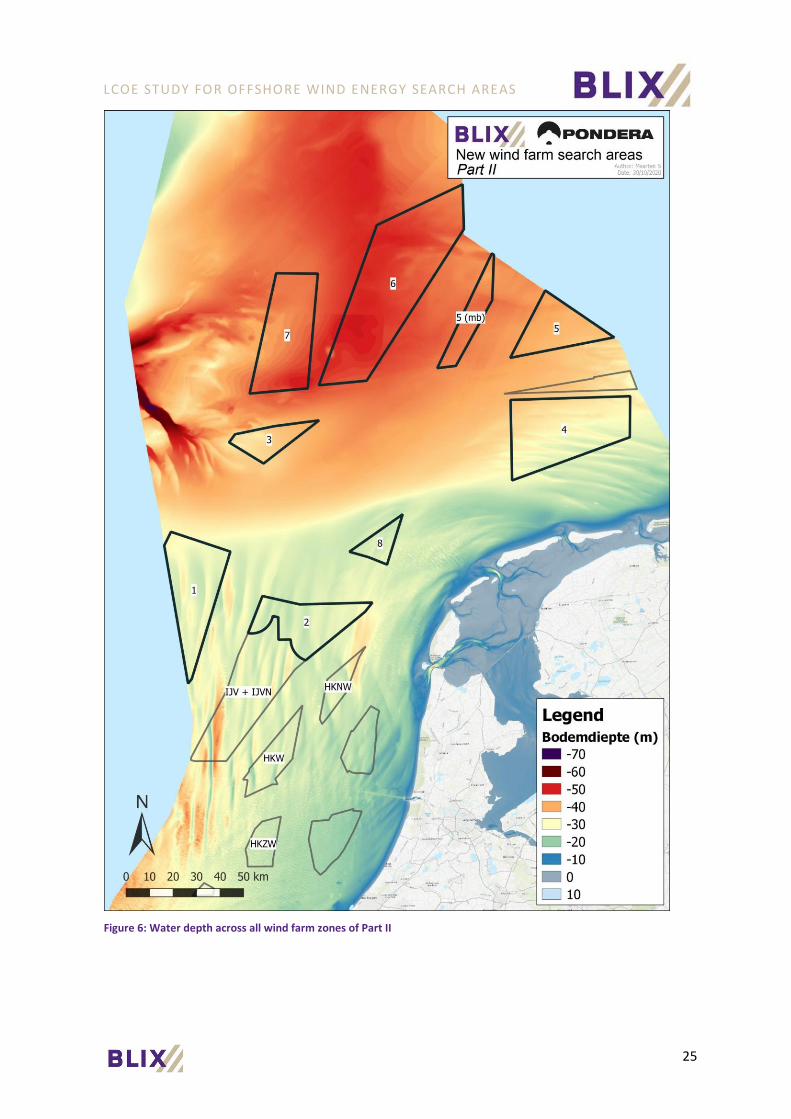
Figure 5 and Figure 6 show the water depths at all wind farm zones in the new search areas. The wind farm zones IJV, IJVN, Zone 1 and 2 are situated in more shallow areas (20 – 30 m), with the southwestern part of IJV located at a deeper area of the North Sea (up to 40 m). The other wind farm zones are situated in the deeper areas of the North Sea (30 – 50 m).
LCOE STUDY FOR OFFSHORE WIND ENERGY SEARCH AREAS
24
Figure 5: Water depth across all wind farm zones of Part I
LCOE STUDY FOR OFFSHORE WIND ENERGY SEARCH AREAS
25
Figure 6: Water depth across all wind farm zones of Part II
LCOE STUDY FOR OFFSHORE WIND ENERGY SEARCH AREAS
26
3.4.3 Wave conditions
The wave conditions affect the loads on the foundation of a wind turbine. No site specific metocean studies have been performed, but online hindcast data is consulted.
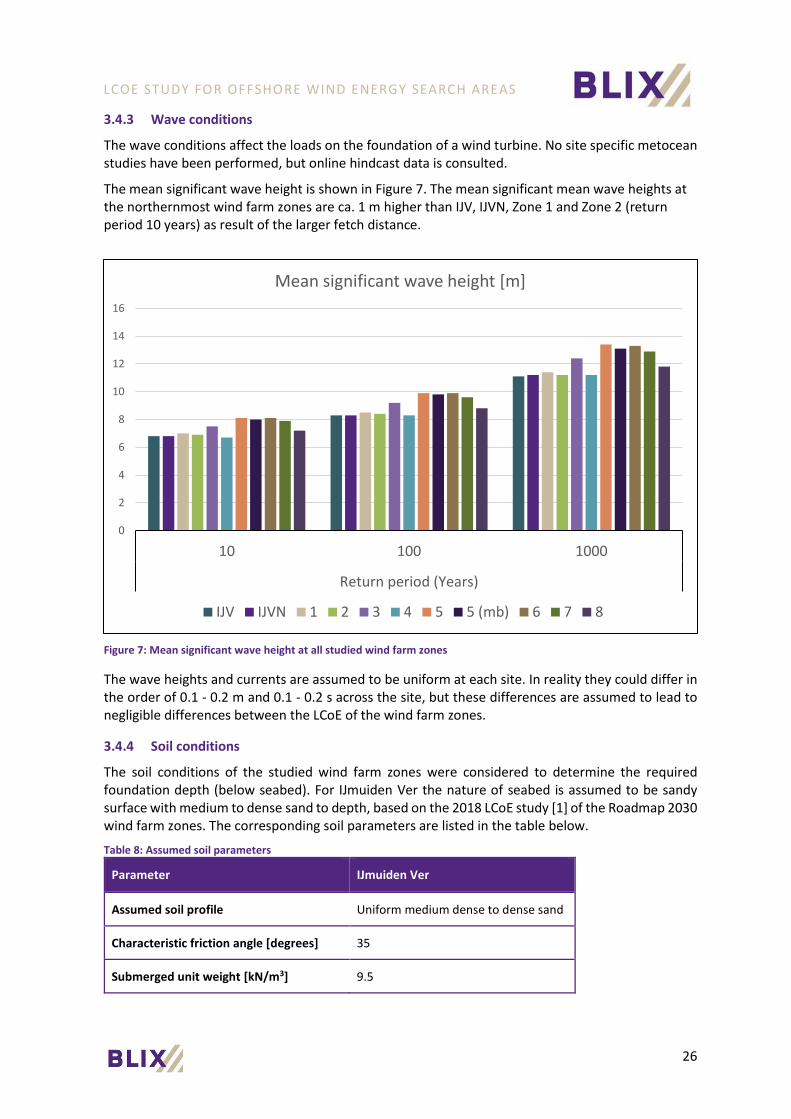
The mean significant wave height is shown in Figure 7. The mean significant mean wave heights at the northernmost wind farm zones are ca. 1 m higher than IJV, IJVN, Zone 1 and Zone 2 (return period 10 years) as result of the larger fetch distance.
Figure 7: Mean significant wave height at all studied wind farm zones
The wave heights and currents are assumed to be uniform at each site. In reality they could differ in the order of 0.1 - 0.2 m and 0.1 - 0.2 s across the site, but these differences are assumed to lead to negligible differences between the LCoE of the wind farm zones.
3.4.4 Soil conditions
The soil conditions of the studied wind farm zones were considered to determine the required foundation depth (below seabed). For IJmuiden Ver the nature of seabed is assumed to be sandy surface with medium to dense sand to depth, based on the 2018 LCoE study [1] of the Roadmap 2030 wind farm zones. The corresponding soil parameters are listed in the table below.
Table 8: Assumed soil parameters
Parameter IJmuiden Ver
Assumed soil profile Uniform medium dense to dense sand
Characteristic friction angle [degrees] 35
Submerged unit weight [kN/m3] 9.5
0
2
4
6
8
10
12
14
16
10 100 1000
Return period (Years)
Mean significant wave height [m]
IJV IJVN 1 2 3 4 5 5 (mb) 6 7 8

LCOE STUDY FOR OFFSHORE WIND ENERGY SEARCH AREAS
27
Standard API P-y curves for sand were used, which were generated automatically using SACS software. Detailed soil information of the new search areas was not available at the time of this study and therefore the same nature of seabed is assumed as for IJmuiden Ver.
In reality the soil conditions may differ across the site, but in the absence of detailed soil information at the time of this study the soil parameters were assumed to be uniform.
3.4.5 Current obstructions and stakeholders
Figure 8 and Figure 9 show the current obstructions and stakeholders in and near the wind farm zones. Nature 2000 areas were not treated as exclusion zones in wind farm zones but are regarded as possible stakeholders. All wind farm zones are outside the Nature 2000 areas except for Zone 5 in Part I, which overlaps with the north-western part of Nature 2000 area ‘Friese Front’.

LCOE STUDY FOR OFFSHORE WIND ENERGY SEARCH AREAS
28
Figure 8: Obstructions wind farm zones Part I2
2 Two additional fiberoptics cables crossing the zones 5, 5 (mb) and 6 are incorrectly not been included in the spatial obstruction analysis and figure of Part I. The impact of relocation of the concerned turbines on the LCoE results of the wind farm zones is neglectable (<0.1%).

LCOE STUDY FOR OFFSHORE WIND ENERGY SEARCH AREAS
29
Figure 9: Obstructions wind farm zones Part II

LCOE STUDY FOR OFFSHORE WIND ENERGY SEARCH AREAS
30
3.5 Wind farm layouts and yield calculations
3.5.1 Introduction
Indicative wind farm- and infield cable lay-outs were designed to determine the relative LCoE differences between the wind farm zones and sites. This level of detail allows the determination of yields and costs on a wind turbine level, instead of crude assumptions based on a reduction in available area for wind turbines. This level of detail is required to obtain results that distinguish detailed differences between the wind farm sites and zones and allows us to draw substantiated conclusions.
3.5.2 Key assumptions
The key assumption for every wind farm layout is a power density of 10 MW/km2. Assuming a symmetrical grid for the placement of the turbines, this is translated to a fixed rectangular turbine grid of 5.5 rotor diameters by 5.5 rotor diameters. In Part I, the rectangular grids are oriented along the longest boundary of each wind farm zone. In Part II, the grids are oriented along the boundary of each wind farm zone closest to the shore, in line with the methodology used for the filling of the search areas. (The impact of this change in grid orientation methodology is considered limited; a sensitivity analysis performed on IJmuiden Ver (noord) with the grid oriented in southwest and south direction respectively showed a difference in average wake losses of the wind farm zone of ~0.1%.)
The installed capacity for each HVDC wind farm site is 2,010 MW (134 turbines with a capacity of 15 MW) and for each HVAC wind farm site 750 MW (50 turbines with a capacity of 15 MW). In case of overcapacity, wind turbines located furthest from the coast have been removed from the wind farm zone to keep the OWF Opex and export cable costs, losses and non-availability as low as possible. This ensures each wind farm zone to have at least one wind farm site with the desired amount of installed capacity, located as close to the coast as possible. Figure 1 and Figure 2 show all wind farm zones and their subdivision in sites.
The shape of the wind farm zones is mainly determined by the IMO shipping lanes running through the North Sea. The layouts comply with applicable rules and regulations; i.a. wind turbine positions comply with maintenance distances from existing pipelines and telecommunication cables (500 m), nor do turbine blades exceed the boundaries of the WFZ. Helicopter routes in the North Sea are not considered as obstructions in this assignment, as possibilities exist to adapt these routes. Nature 2000 areas were not treated as exclusion zones in wind farm zones, but are regarded as possible stakeholders. The 5.5 rotor diameter difference assures technical feasibility (i.e. staying below turbulence limits).
The wind farm layouts and yield calculations are based on the technical assumptions described in Table 9.
Table 9: Technical assumptions for wind farm layouts and yield
Parameter Assumption Reference
Wind turbine
Wind Turbine capacity 15 MW Power curve generalised and extrapolated based on current state of technology.
Rotor diameter 220 m Based on currently available information.
Hub height 140 m Based on 30 m clearance.
Power curve Confidential Upscaled version based on available prototype.
Wind farm layout
Power density 10 MW / km2 (translated to a fixed grid size)
In consultation with the Working group

LCOE STUDY FOR OFFSHORE WIND ENERGY SEARCH AREAS
31
Turbine grid size 5.5 by 5.5 rotor diameters Fixed rectangular grid, in consultation with the Working group
Turbine grid orientation Part I: Along the longest boundary of each wind farm zone Part II: Along the boundary of each wind farm zone closest to shore
In consultation with the Working group
Filling of search area with sites
From the boundary of the wind farm zone closest to shore
In consultation with the Working group
Distance to existing cables and pipelines
500 m In consultation with the Working group
Distance wind turbine from WFZ boundary
110 m (blade length) In consultation with the Working group
Electrical layout
Capacity per wind farm site HVDC: 2 x 1,005 MW (2 transformers on 1 OHVS) HVAC: 1 x 750 MW
Overplanting is assumed as reference in consultation with the Working group.
Infield cables 66 kV, 6 WTG/string Based on assessment of Ensol (assuming 800A switchgear in turbines).
Construction & maintenance ports
Rotterdam, Eemshaven, IJmuiden (maintenance only), Den Helder (maintenance only).
Based on currently available information.
Export cable routes Not taken into account. In consultation with the Working group
Model parameters
Wake losses NO Jensen 2005 model, using offshore Wake Decay Constant (WDC) 0.03.
Industry standard for basic AEP calculations, with WDC following EMD recommendations and practical experience from nearby projects.
IA cable losses Use of an increased losses formula when more wind turbines feed power over an inter-array cable. Formula is confidential.
Provided by Ensol.
3.5.3 OWF yield assumptions
After determination of the wind farm layouts, the cabling layout is defined. The locations of the TenneT substations of the two IJmuiden Ver sites were provided by the client in close collaboration with TenneT. The locations of the substations of the wind farm zones were, after agreement with the client, positioned by the project team in the centre of the sites.
Each station contains two transformers with a combined capacity of 2,010 MW resp. 750 MW. The wind turbines are connected to the substation through array cabling. Each array cable connects six 15 MW wind turbines to the substation. The detailed wind farm and cabling layouts are shown in paragraph 5.2.
With turbine positions and cabling determined, the gross annual energy yield for each turbine has been calculated using WindPRO and WAsP. The calculations included the present, albeit relatively small, wind speed gradients across the wind farm zones. Each wind turbine is assigned to the closest wind climate node to calculate its gross annual energy yield.
The net annual energy yield is calculated by subtracting loss factors from the gross annual energy yield via the relation (1-loss1)*(1-loss2)*(1-…). The following loss factors are considered:
Wake losses
The dominant OWF loss factor is the wake effect and is described as the aggregated influence on the energy production of the wind farm, which results from the changes in wind speed caused by the impact of the wind turbines on each other. In consultation with the client it was decided to consider each wind farm zone without its neighbouring wind farm zones in new search areas. The existing offshore wind farms Windpark Egmond aan Zee (OWEZ), Prinses Amalia wind farm, Luchterduinen

LCOE STUDY FOR OFFSHORE WIND ENERGY SEARCH AREAS
32
windfarm, Gemini 1&2, Hollandse Kust (noord), Hollandse Kust (zuid) were included, in order to include their wake effects in the calculations. The actual built wind turbine types and hub heights were used for these wind farms. The wake effects of the already planned wind farms of IJmuiden Ver and Hollandse Kust (west) were also taken into account in the modelling, based on indicative wind farm layouts. The wind farm zone from neighbour countries (e.g. United Kingdom and Germany) were not taken into account.
Inter-array cable losses
Electrical losses in power cables occur due to heat build-up in the cables, increasing the cable resistance. The inter-array cable losses have been calculated for each wind farm zone specifically and are listed in Table 13.
Wind turbine non-availability
This production loss concerns the periods that a wind turbine is not in operation due to maintenance, malfunctions and repositioning of the wind turbine nacelle. The non-availability of offshore wind turbines is assumed to be 5%.
Other losses
Wind turbines suffer from several environment-related losses such as blade degradation losses due to contamination and deterioration, shutdown events due to lightning or hail or wind speed hysteresis (fluctuations of wind speeds around cut-off wind speed). In the model a total loss of 1.5% is taken into account for these losses.
3.5.4 GCS yield assumptions
The addition of grid connection systems to the scope of Part II results in several additional parameters affecting the yield calculations. The GCS yield parameters that have been added in Part II are listed below.
Export cable losses
The export cable losses differ between HVDC and HVAC systems. For DC export cables the losses are considered linear whereas for the AC export cables the losses are relatively higher for larger distances. In this study the cable losses are based on 100% power transmission not based on modelling the full wind climate. The impact of this simplification on the results is assumed to be small.
GCS non-availability
The GCS non-availability consists of the non-availability of the onshore and offshore substation (e.g. due to planned and unplanned maintenance) and the non-availability of the export cable. The latter differs per wind farm zone and site since there is a larger risk for failures with a longer export cable The substation non-availability is equal for wind farm zones with the same GCS. For HVDC systems the non-availability is higher than for HVAC systems due the higher complexity of the system and higher number of components.
3.6 LCoE modelling
The LCoE calculations have been conducted with the BLIX LCoE model. This model has been developed throughout the years, used for many projects, and has been validated several times for projects BLIX worked on. Due to the in-depth and diverse market insights that BLIX has gained in offshore wind projects, this model and its inputs are particularly well equipped for conducting LCoE comparison studies.
LCOE STUDY FOR OFFSHORE WIND ENERGY SEARCH AREAS
33
The GCS model inputs are based on the reports (Deliverable 1.3: Synthesis of available studies on offshore meshed HVDC grids, 2020) [3] for the HVDC system and (Connecting Offshore Wind Farms, 2019) [4] for the HVAC system, supplemented with expert opinions and calculations from Energy Solutions. Subsequently, the study inputs were validated by TenneT.
For this study it is assumed that the wind farm and grid connection is financed on a balance sheet basis (an alternative approach would be to assume project finance3). This approach gives the cleanest approach of the LCoE of the offshore wind farms.
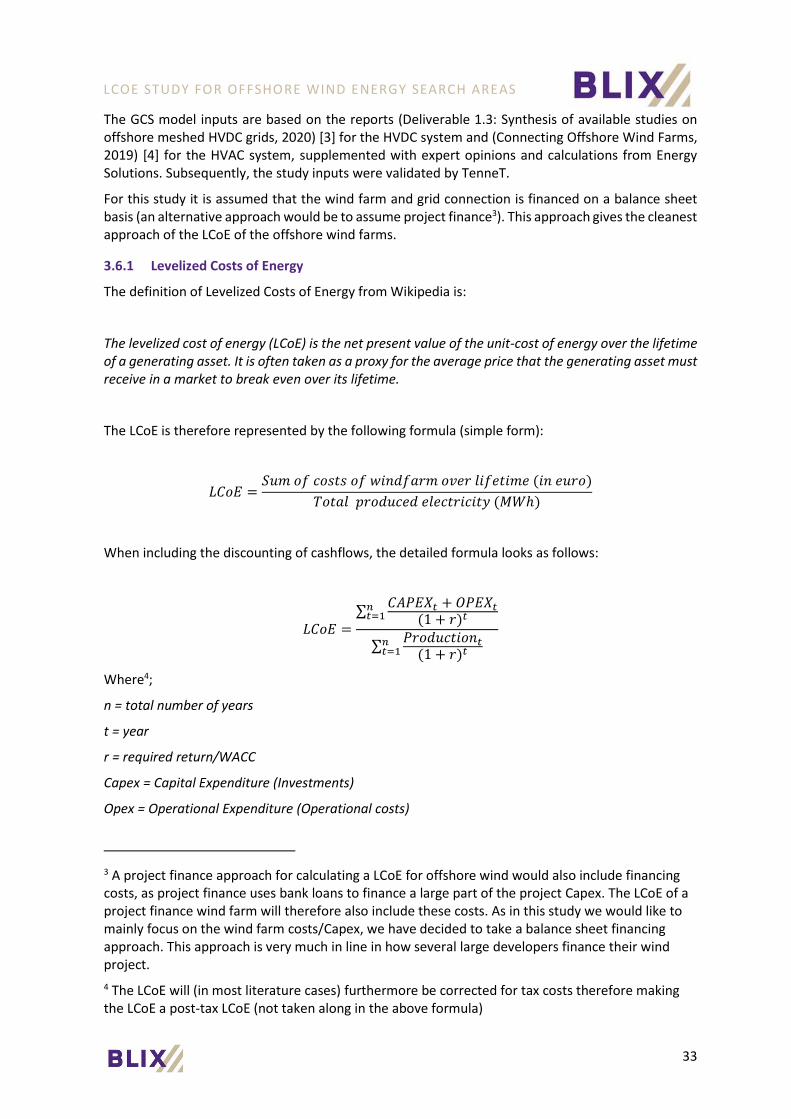
3.6.1 Levelized Costs of Energy
The definition of Levelized Costs of Energy from Wikipedia is:
The levelized cost of energy (LCoE) is the net present value of the unit-cost of energy over the lifetime of a generating asset. It is often taken as a proxy for the average price that the generating asset must receive in a market to break even over its lifetime.
The LCoE is therefore represented by the following formula (simple form):
𝐿𝐶𝑜𝐸 =𝑆𝑢𝑚 𝑜𝑓 𝑐𝑜𝑠𝑡𝑠 𝑜𝑓 𝑤𝑖𝑛𝑑𝑓𝑎𝑟𝑚 𝑜𝑣𝑒𝑟 𝑙𝑖𝑓𝑒𝑡𝑖𝑚𝑒 (𝑖𝑛 𝑒𝑢𝑟𝑜)
𝑇𝑜𝑡𝑎𝑙 𝑝𝑟𝑜𝑑𝑢𝑐𝑒𝑑 𝑒𝑙𝑒𝑐𝑡𝑟𝑖𝑐𝑖𝑡𝑦 (𝑀𝑊ℎ)
When including the discounting of cashflows, the detailed formula looks as follows:
𝐿𝐶𝑜𝐸 =
∑𝐶𝐴𝑃𝐸𝑋𝑡 + 𝑂𝑃𝐸𝑋𝑡
(1 + 𝑟)𝑡𝑛𝑡=1
∑𝑃𝑟𝑜𝑑𝑢𝑐𝑡𝑖𝑜𝑛𝑡
(1 + 𝑟)𝑡𝑛𝑡=1
Where4;
n = total number of years
t = year
r = required return/WACC
Capex = Capital Expenditure (Investments)
Opex = Operational Expenditure (Operational costs)
3 A project finance approach for calculating a LCoE for offshore wind would also include financing costs, as project finance uses bank loans to finance a large part of the project Capex. The LCoE of a project finance wind farm will therefore also include these costs. As in this study we would like to mainly focus on the wind farm costs/Capex, we have decided to take a balance sheet financing approach. This approach is very much in line in how several large developers finance their wind project.
4 The LCoE will (in most literature cases) furthermore be corrected for tax costs therefore making the LCoE a post-tax LCoE (not taken along in the above formula)

LCOE STUDY FOR OFFSHORE WIND ENERGY SEARCH AREAS
34
3.6.2 OWF cost assumptions
In below Table 10 the main cost assumptions of the offshore wind farm are briefly explained. As mentioned in previous chapters, most of these items will not impact the relative LCoE analysis. Therefore, most attention has been paid to the items that do impact the relative LCoE.
Table 10: Costs assumptions for OWF LCoE
Parameter Assumption Reference
Capital Expenditure (Capex)
Cost of turbine Includes supply, transport & installation and dependency on distance to port. Costs are confidential
Based on BLIX price database
Foundation method Monopiles Expected to be economically favourable in the considered water depths
Steel prices Based on latest market prices Based on BLIX price database
Foundation weight Use of formula that is based on specific soil conditions and relation water depth and wave conditions. Formula is confidential
Based on BLIX price database
Foundation costs Includes supply, transport & installation of foundations and dependency on distance to port. Costs are confidential
Based on BLIX price database
Inter-array cable costs Based on aluminium inter array cables. Costs are confidential
Based on BLIX price database
Cost for cable crossings Based on number of crossings per site. Costs are confidential
Based on BLIX price database
Other Capex Various items (e.g. port facilities & construction management). Costs are confidential
Based on BLIX price database
Capex Contingency level Based on market conform levels Based on BLIX price database
Insurances during construction
Delay Start-Up, Construction All-Risk, Third Party Liability. Rates are confidential
Based on BLIX price database
Development expenditure (Devex)
Confidential Based on BLIX price database
Operational Expenditure (Opex)
Management costs Based on small operational team Based on BLIX price database
WTG maintenance Use of Service Maintenance Agreement (SMA) with turbine supplier. Includes dependency on distance to port. Costs are confidential
Based on BLIX price database
Insurances during operations
Operational All-Risk, Business Interruption, Third Party Liability. Rates are confidential
Based on BLIX price database
Balance of Plant maintenance
Based on maintenance service provider costs. Costs are confidential
Based on BLIX price database
Opex contingency level Based on market conform levels Based on BLIX price database
Other Assumptions
Financing Project is financed on balance sheet Deemed most representative
Required return on investment
Based on market conform levels Based on experience
Revenues Not required for LCoE calculations
Indexation levels 2% a year Based on BLIX price database
LCOE STUDY FOR OFFSHORE WIND ENERGY SEARCH AREAS
35
Depreciation period 20 years Based on BLIX price database
The inputs of Table 10 feed into the wind farm cost part of this formula and are discounted based on the required return over the lifetime of the wind farm. The LCoE per site is calculated by dividing the discounted costs by the discounted yield per site. After calculating the LCoE per site, the LCoE per wind farm zone will be determined, compared and analysed.
The yield and costs are calculated on a per wind turbine basis. The main varying parameters are the yield (through wake losses), the foundation costs (through water depth differences and distance to port), inter-array cable length and losses, number of inter-array cable crossings and wind turbine installation and maintenance costs (through distance to port). Other Capex such as the turbine prices do have a large impact on the absolute level of LCoE but are not expected to differ (significantly) between the wind farm zones and sites. This is because these costs will not be affected by changing the layout (these costs are primarily driven by the type of turbine, and these are the same for every wind farm zone and site).
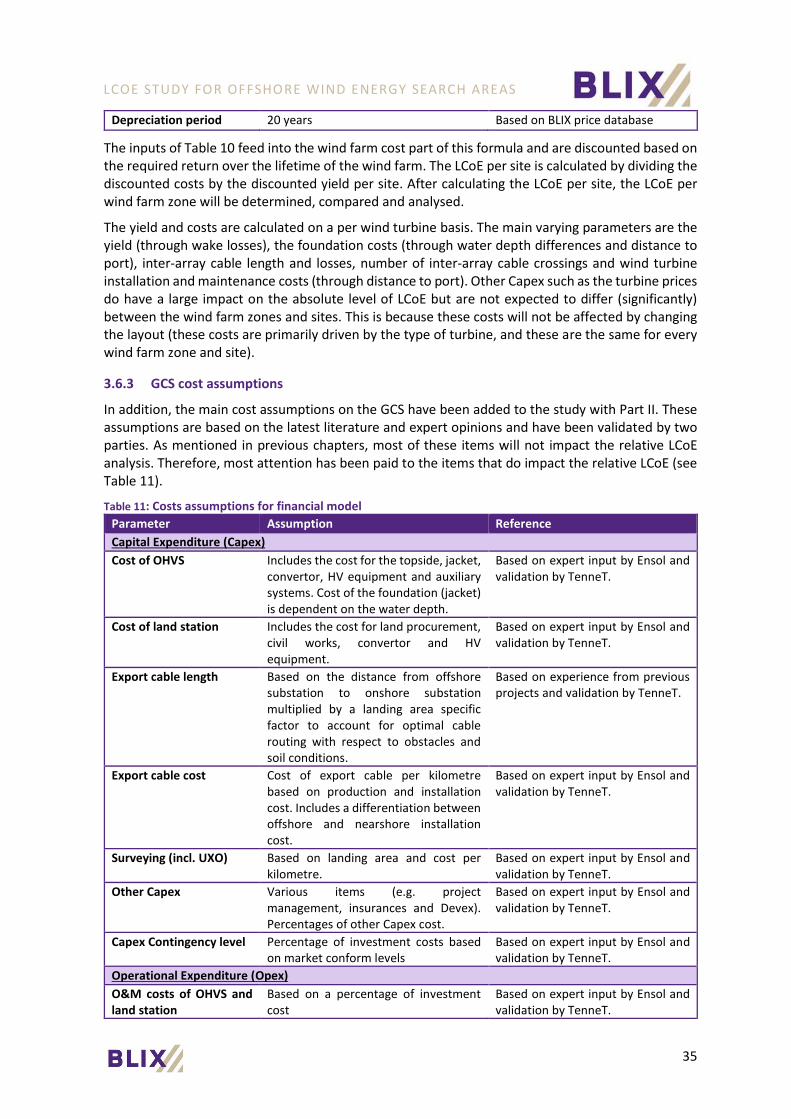
3.6.3 GCS cost assumptions
In addition, the main cost assumptions on the GCS have been added to the study with Part II. These assumptions are based on the latest literature and expert opinions and have been validated by two parties. As mentioned in previous chapters, most of these items will not impact the relative LCoE analysis. Therefore, most attention has been paid to the items that do impact the relative LCoE (see Table 11).
Table 11: Costs assumptions for financial model
Parameter Assumption Reference
Capital Expenditure (Capex)
Cost of OHVS Includes the cost for the topside, jacket, convertor, HV equipment and auxiliary systems. Cost of the foundation (jacket) is dependent on the water depth.
Based on expert input by Ensol and validation by TenneT.
Cost of land station Includes the cost for land procurement, civil works, convertor and HV equipment.
Based on expert input by Ensol and validation by TenneT.
Export cable length Based on the distance from offshore substation to onshore substation multiplied by a landing area specific factor to account for optimal cable routing with respect to obstacles and soil conditions.
Based on experience from previous projects and validation by TenneT.
Export cable cost Cost of export cable per kilometre based on production and installation cost. Includes a differentiation between offshore and nearshore installation cost.
Based on expert input by Ensol and validation by TenneT.
Surveying (incl. UXO) Based on landing area and cost per kilometre.
Based on expert input by Ensol and validation by TenneT.
Other Capex Various items (e.g. project management, insurances and Devex). Percentages of other Capex cost.
Based on expert input by Ensol and validation by TenneT.
Capex Contingency level Percentage of investment costs based on market conform levels
Based on expert input by Ensol and validation by TenneT.
Operational Expenditure (Opex)
O&M costs of OHVS and land station
Based on a percentage of investment cost
Based on expert input by Ensol and validation by TenneT.

LCOE STUDY FOR OFFSHORE WIND ENERGY SEARCH AREAS
36
O&M costs of export cable
Based on a percentage of investment cost
Based on expert input by Ensol and validation by TenneT.
Other Assumptions
GCS electrical losses Includes electrical losses for transformers, reactors and auxiliary equipment as a percentage of electricity production. Cable losses are based on a percentage per kilometre.
Based on expert input by Ensol and validation by TenneT.
GCS non-availability Includes non-availability for convertors, transformers and export cable non-availability. Export cable non-availability depends on export cable length.
Based on expert input by Ensol and validation by TenneT.

LCOE STUDY FOR OFFSHORE WIND ENERGY SEARCH AREAS
37
Part I

LCOE STUDY FOR OFFSHORE WIND ENERGY SEARCH AREAS
38
4 INTRODUCTION PART I
Part I contains the results from a first study into the LCoE of offshore wind farms at the search areas, LCoE analyses of the grid connection systems was not included in this assessment. The wind farm zones and sites are listed in Table 12 and shown in Figure 10.
Table 12: Wind farm zones considered in Part I
Wind farm zone Abbreviation Number of sites Total capacity
IJmuiden Ver IJV 2 4 GW
Zone 1 4 8 GW
Zone 2 3 6 GW
Zone 3 1 2 GW
Zone 5 5 10 GW
Zone 5 (mb) 4 8 GW
Zone 6 6 12 GW
Zone 7 4 8 GW
Figure 10: Overview of the wind farm search areas studied in Part I

LCOE STUDY FOR OFFSHORE WIND ENERGY SEARCH AREAS
39
5 WIND FARM LAYOUTS
As indicated in paragraph 3.4, the same fixed rectangular grid of 5.5 by 5.5 rotor diameters is used for the layout of every wind farm zone. The offshore wind energy search areas are filled with a multitude of sites with a connection capacity of 2,010 MW from the boundary closest to shore. The remaining part of the search area is excluded from the design. The orientation of the applied turbine grid for the analysis of Part I is along the longest boundary of each wind farm zone.
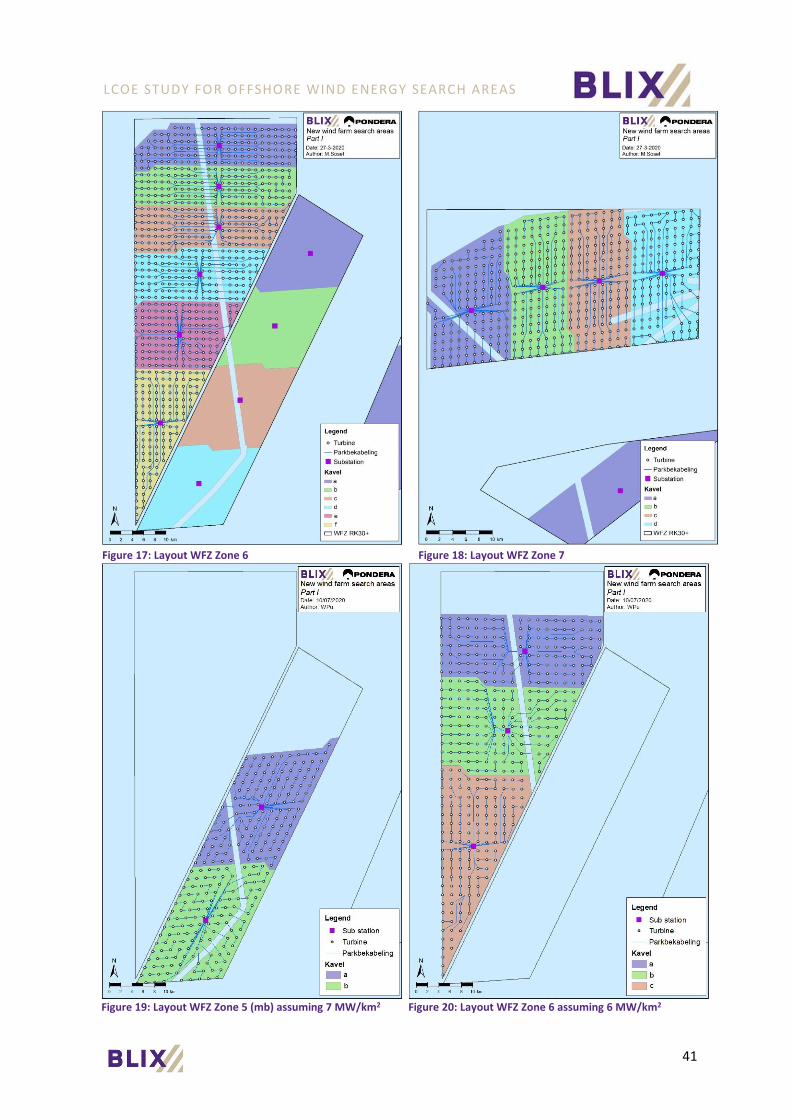
The wind farm layouts of all wind farm zones are shown below, in Figure 11 to Figure 18.
The layouts of the zones analysed for the power density sensitivity are shown in Figure 19 and Figure 20.
Figure 11: Layout WFZ IJmuiden Ver Figure 12: Layout WFZ Zone 1

LCOE STUDY FOR OFFSHORE WIND ENERGY SEARCH AREAS
40
Figure 13: Layout WFZ Zone 2 Figure 14: Layout WFZ Zone 3
Figure 15: Layout WFZ Zone 5 Figure 16: Layout WFZ Zone 5 (mb)
LCOE STUDY FOR OFFSHORE WIND ENERGY SEARCH AREAS
41
Figure 17: Layout WFZ Zone 6 Figure 18: Layout WFZ Zone 7
Figure 19: Layout WFZ Zone 5 (mb) assuming 7 MW/km2 Figure 20: Layout WFZ Zone 6 assuming 6 MW/km2
LCOE STUDY FOR OFFSHORE WIND ENERGY SEARCH AREAS
42
6 YIELD ANALYSIS
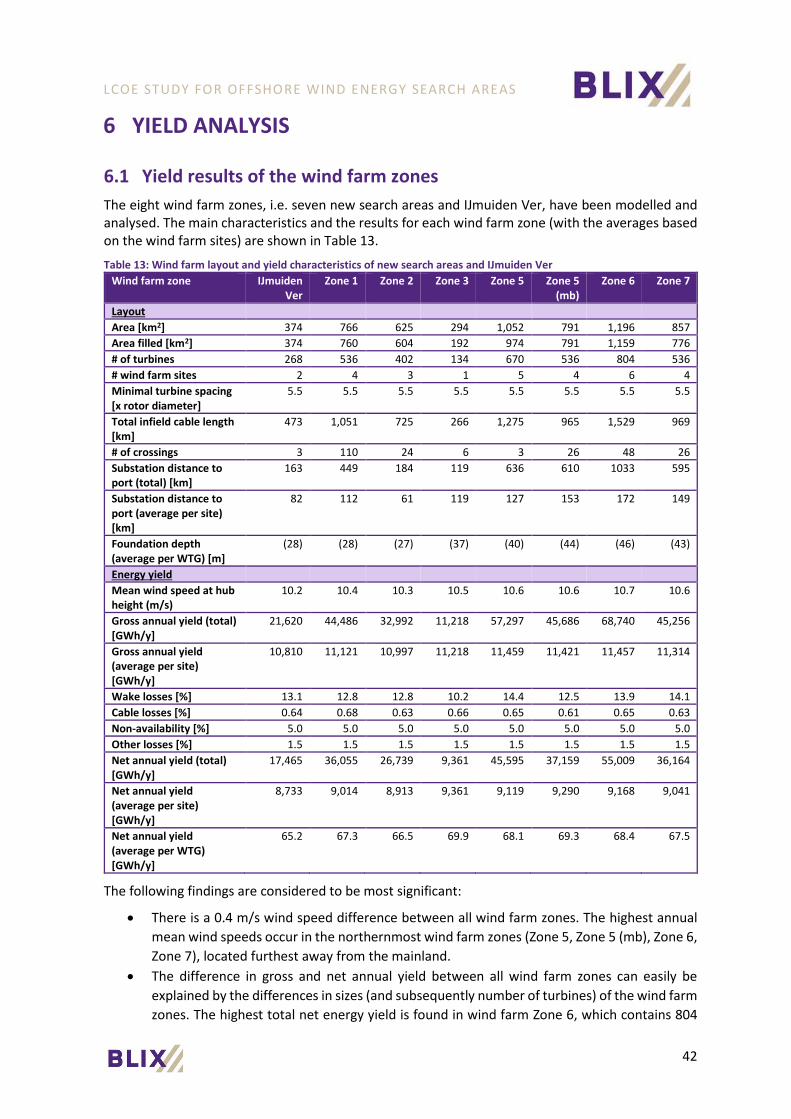
6.1 Yield results of the wind farm zones
The eight wind farm zones, i.e. seven new search areas and IJmuiden Ver, have been modelled and analysed. The main characteristics and the results for each wind farm zone (with the averages based on the wind farm sites) are shown in Table 13.
Table 13: Wind farm layout and yield characteristics of new search areas and IJmuiden Ver
Wind farm zone IJmuiden Ver
Zone 1 Zone 2 Zone 3 Zone 5 Zone 5 (mb)
Zone 6 Zone 7
Layout
Area [km2] 374 766 625 294 1,052 791 1,196 857
Area filled [km2] 374 760 604 192 974 791 1,159 776
# of turbines 268 536 402 134 670 536 804 536
# wind farm sites 2 4 3 1 5 4 6 4
Minimal turbine spacing [x rotor diameter]
5.5 5.5 5.5 5.5 5.5 5.5 5.5 5.5
Total infield cable length [km]
473 1,051 725 266 1,275 965 1,529 969
# of crossings 3 110 24 6 3 26 48 26
Substation distance to port (total) [km]
163 449 184 119 636 610 1033 595
Substation distance to port (average per site) [km]
82 112 61 119 127 153 172 149
Foundation depth (average per WTG) [m]
(28) (28) (27) (37) (40) (44) (46) (43)
Energy yield
Mean wind speed at hub height (m/s)
10.2 10.4 10.3 10.5 10.6 10.6 10.7 10.6
Gross annual yield (total) [GWh/y]
21,620 44,486 32,992 11,218 57,297 45,686 68,740 45,256
Gross annual yield (average per site) [GWh/y]
10,810 11,121 10,997 11,218 11,459 11,421 11,457 11,314
Wake losses [%] 13.1 12.8 12.8 10.2 14.4 12.5 13.9 14.1
Cable losses [%] 0.64 0.68 0.63 0.66 0.65 0.61 0.65 0.63
Non-availability [%] 5.0 5.0 5.0 5.0 5.0 5.0 5.0 5.0
Other losses [%] 1.5 1.5 1.5 1.5 1.5 1.5 1.5 1.5
Net annual yield (total) [GWh/y]
17,465 36,055 26,739 9,361 45,595 37,159 55,009 36,164
Net annual yield (average per site) [GWh/y]
8,733 9,014 8,913 9,361 9,119 9,290 9,168 9,041
Net annual yield (average per WTG) [GWh/y]
65.2 67.3 66.5 69.9 68.1 69.3 68.4 67.5
The following findings are considered to be most significant:
• There is a 0.4 m/s wind speed difference between all wind farm zones. The highest annual
mean wind speeds occur in the northernmost wind farm zones (Zone 5, Zone 5 (mb), Zone 6,
Zone 7), located furthest away from the mainland.
• The difference in gross and net annual yield between all wind farm zones can easily be
explained by the differences in sizes (and subsequently number of turbines) of the wind farm
zones. The highest total net energy yield is found in wind farm Zone 6, which contains 804
LCOE STUDY FOR OFFSHORE WIND ENERGY SEARCH AREAS
43
wind turbines (55,009 GWh/yr), while the highest average net energy yield per wind farm
site is found for Zone 3 (9,361 GWh/yr).
• The differences in wake effects can be explained by the size, shape and orientation of the
wind farm zone.
Larger wind farm zones with many sites suffer from more severe wake effects than smaller
wind farm zones. For example, wind farm Zone 3 is relatively small and consists of only one
site and therefore experiences lower wake losses (10.2%). Wind farm zones Zone 5, Zone 6
and Zone 7 have multiple sites (5, 6, and 4 resp.) and experience higher wake losses (~14%).
Also, the shape and orientation of the wind farm zones, or more precisely the border length-
to-area ratio in relation to the prevailing wind direction, influences the average wake effect.
For instance, wind farm Zone 5 (mb) is stretched from north to south. This layout contains
many wind turbines at the edge of the wind farm zone compared to the amount of wind
turbines inside the wind farm zone. The wind turbines at the borders do not suffer from wake
effects in certain wind directions, reducing the site’s overall (wind sector-weighted) wake
loss. Square-shaped or triangular-shaped wind farm zones, such as Zone 5 and Zone 7
respectively, have fewer wind turbines at the border of the wind farm zone and more inside
the wind farm zone compared to Zone 5 (mb); this means that more wind turbines suffer
from wake effects from wind turbines in all wind directions. The orientation of the borders
with respect to the prevailing wind direction (SSW to WSW) is especially important here. A
long border will be extra effective if aligned perpendicular to the main wind direction – e.g.
in NW-SE direction.
• Because of the lower wake losses and (to lesser extent) wind speed differences, the highest
net yield per wind turbine is found in wind farm zones Zone 3 and Zone 5 (mb) (69.3 and 69.9
GWh/WTG/yr respectively).
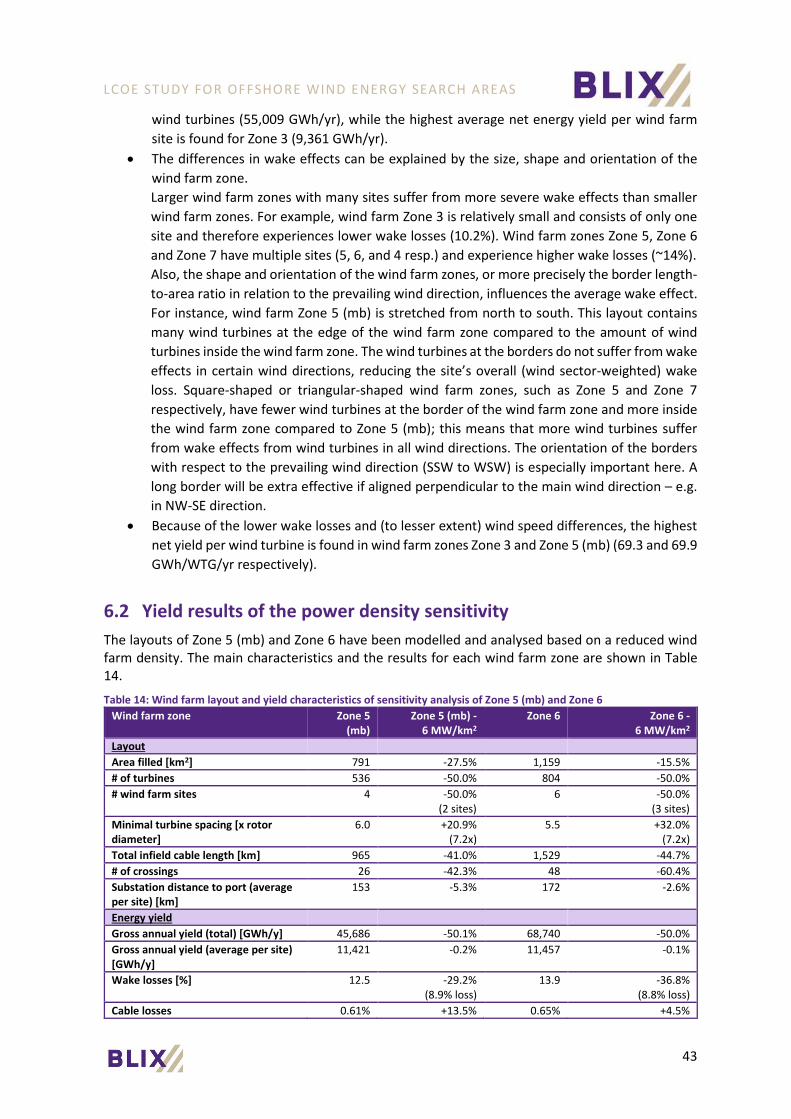
6.2 Yield results of the power density sensitivity
The layouts of Zone 5 (mb) and Zone 6 have been modelled and analysed based on a reduced wind farm density. The main characteristics and the results for each wind farm zone are shown in Table 14.
Table 14: Wind farm layout and yield characteristics of sensitivity analysis of Zone 5 (mb) and Zone 6
Wind farm zone Zone 5 (mb)
Zone 5 (mb) - 6 MW/km2
Zone 6 Zone 6 - 6 MW/km2
Layout
Area filled [km2] 791 -27.5% 1,159 -15.5%
# of turbines 536 -50.0% 804 -50.0%
# wind farm sites 4 -50.0%(2 sites)
6 -50.0%(3 sites)
Minimal turbine spacing [x rotor diameter]
6.0 +20.9%(7.2x)
5.5 +32.0%(7.2x)
Total infield cable length [km] 965 -41.0% 1,529 -44.7%
# of crossings 26 -42.3% 48 -60.4%
Substation distance to port (average per site) [km]
153 -5.3% 172 -2.6%
Energy yield
Gross annual yield (total) [GWh/y] 45,686 -50.1% 68,740 -50.0%
Gross annual yield (average per site) [GWh/y]
11,421 -0.2% 11,457 -0.1%
Wake losses [%] 12.5 -29.2%(8.9% loss)
13.9 -36.8%(8.8% loss)
Cable losses 0.61% +13.5% 0.65% +4.5%

LCOE STUDY FOR OFFSHORE WIND ENERGY SEARCH AREAS
44
Net annual yield (total) [GWh/y] 37,159 -48.0% 55,009 -47.1%
Net annual yield (average per site) [GWh/y]
9,290 +2.9% 9,168 +2.9%
Net annual yield (average per WTG) [GWh/y]
69.3 +3.9% 68.4 +5.9%
The following findings are considered to be most significant:
• A lower wind farm density leads to a less efficient filling of the wind farm zones, as the
remainder of the wind farm zone cannot contain a 2x1 GW wind farm site. The number of
sites is reduced by -50% with the lower densities for both Zone 5 (mb) and Zone 6, containing
2 and 3 sites respectively.
• The average net area per site for Zone 6 with a density of 6 MW/km2 is 69% larger than for
the Zone 6 sites with a 10 MW/km2 wind farm density. For Zone 5 (mb) the average net area
per site is 45% larger with a density of 6 MW/km2 than with a 10 MW/km2 wind farm density.
• The overall net annual yield of wind farm Zone 6 decreases with -47.1% with a reduced wind
farm density of 6 MW/km2. For Zone 5 (mb), the overall net annual yield of the wind farm
zone is -48.0% with a reduced density of 6 MW/km2.
• The net average annual yield per wind turbine increases with the lower densities with +5.9%
for Zone 6 and +3.9% for Zone 5 (mb), which are a result of lower wake losses of -5.1%-point
and -3.7%-point respectively compared to the benchmark density of 10 MW/km2.
Based on these results, for the other wind farm zones an increase in average annual yield per wind
turbine between +4%-point and +6%-point is to be expected with a density of 6 MW/km2 instead of
10 MW / km2 (except for Zone 3, which consists of only 1 site).
LCOE STUDY FOR OFFSHORE WIND ENERGY SEARCH AREAS
45
7 COMPARISON OF LEVELIZED COST OF ENERGY
7.1 Relative LCoE impact of the Offshore Wind Farm (OWF)
For an in-depth comparison of the wind farm zones we investigated the relative LCoE of the OWF per turbine and compared the average relative LCoE impact per site and per wind farm zone with the reference IJmuiden Ver.
The following paragraphs describe the relative LCoE per wind turbine, the results of the comparison between wind farm sites and between wind farm zones. Finally, the last paragraph summarizes the results of the sensitivity analysis performed on the density of the wind farm zones.
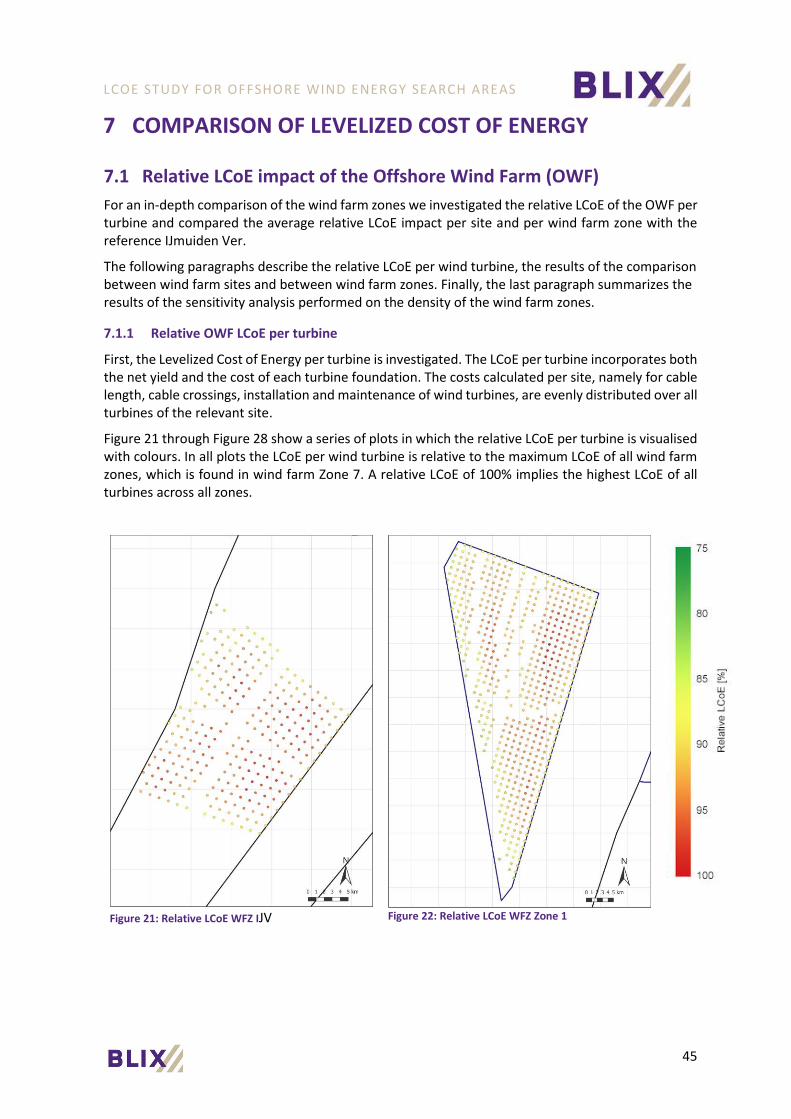
7.1.1 Relative OWF LCoE per turbine
First, the Levelized Cost of Energy per turbine is investigated. The LCoE per turbine incorporates both the net yield and the cost of each turbine foundation. The costs calculated per site, namely for cable length, cable crossings, installation and maintenance of wind turbines, are evenly distributed over all turbines of the relevant site.
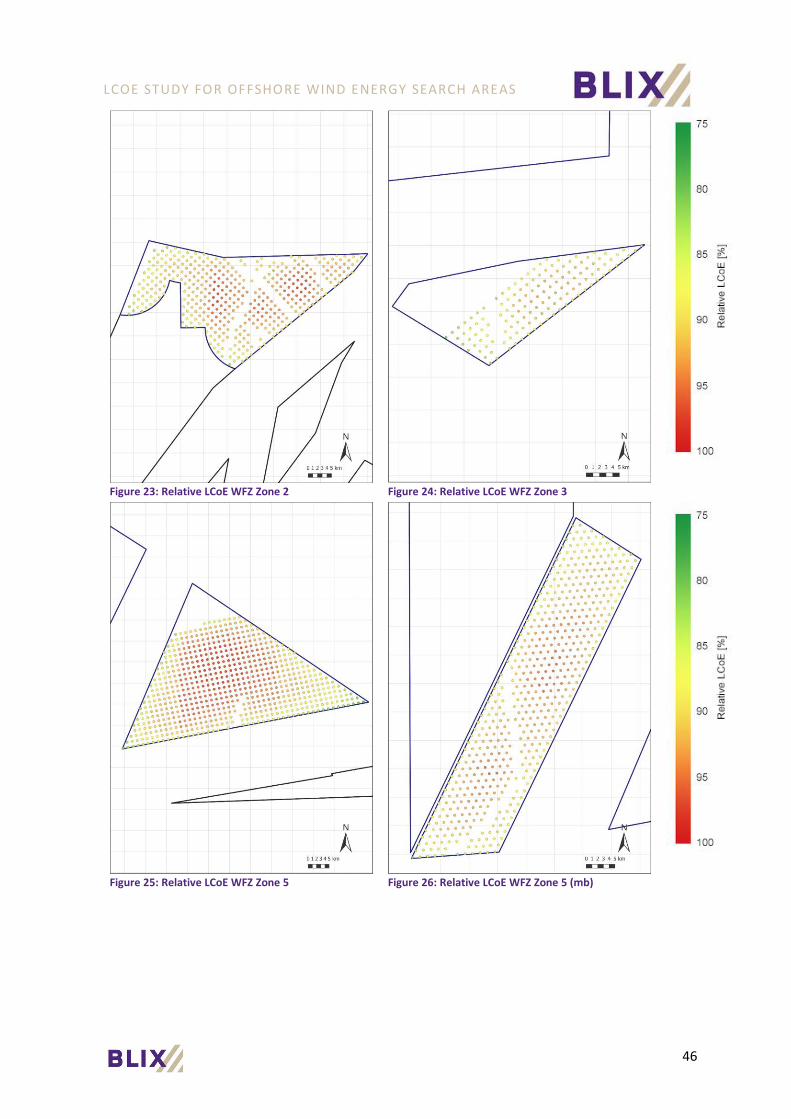
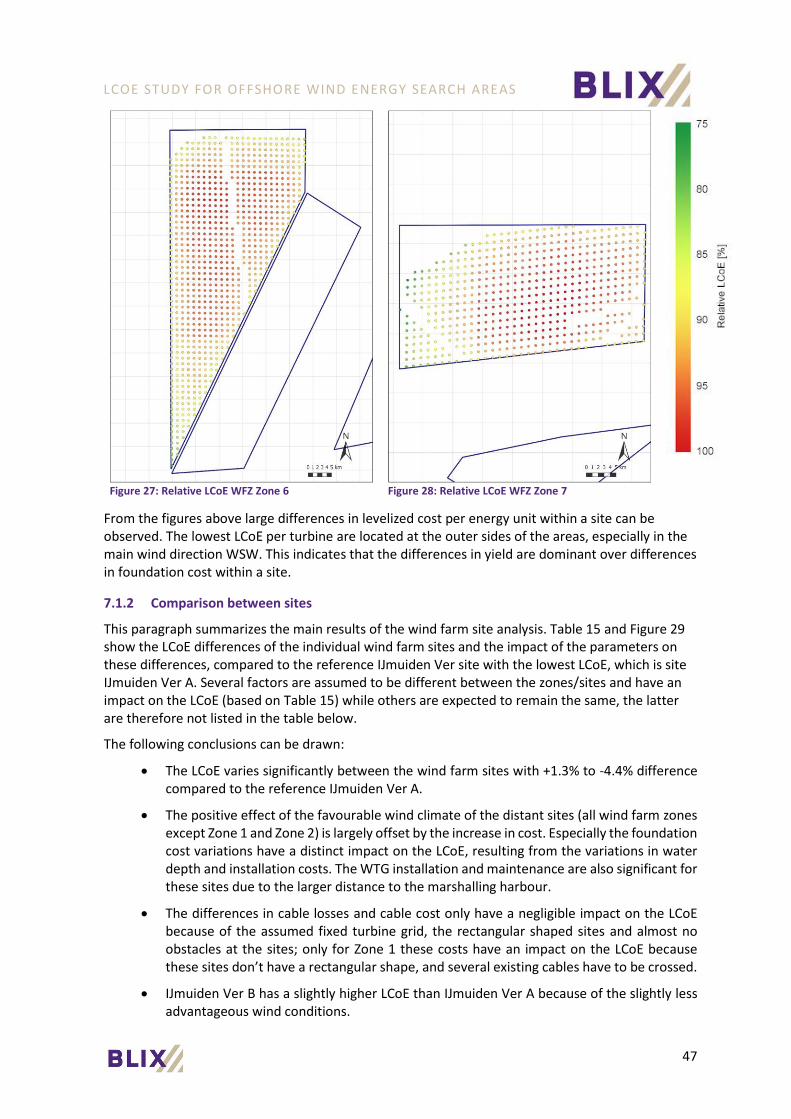
Figure 21 through Figure 28 show a series of plots in which the relative LCoE per turbine is visualised with colours. In all plots the LCoE per wind turbine is relative to the maximum LCoE of all wind farm zones, which is found in wind farm Zone 7. A relative LCoE of 100% implies the highest LCoE of all turbines across all zones.
Figure 21: Relative LCoE WFZ IJV Figure 22: Relative LCoE WFZ Zone 1
LCOE STUDY FOR OFFSHORE WIND ENERGY SEARCH AREAS
46
Figure 23: Relative LCoE WFZ Zone 2 Figure 24: Relative LCoE WFZ Zone 3
Figure 25: Relative LCoE WFZ Zone 5 Figure 26: Relative LCoE WFZ Zone 5 (mb)
LCOE STUDY FOR OFFSHORE WIND ENERGY SEARCH AREAS
47
Figure 27: Relative LCoE WFZ Zone 6 Figure 28: Relative LCoE WFZ Zone 7
From the figures above large differences in levelized cost per energy unit within a site can be observed. The lowest LCoE per turbine are located at the outer sides of the areas, especially in the main wind direction WSW. This indicates that the differences in yield are dominant over differences in foundation cost within a site.
7.1.2 Comparison between sites
This paragraph summarizes the main results of the wind farm site analysis. Table 15 and Figure 29 show the LCoE differences of the individual wind farm sites and the impact of the parameters on these differences, compared to the reference IJmuiden Ver site with the lowest LCoE, which is site IJmuiden Ver A. Several factors are assumed to be different between the zones/sites and have an impact on the LCoE (based on Table 15) while others are expected to remain the same, the latter are therefore not listed in the table below.
The following conclusions can be drawn:
• The LCoE varies significantly between the wind farm sites with +1.3% to -4.4% differencecompared to the reference IJmuiden Ver A.
• The positive effect of the favourable wind climate of the distant sites (all wind farm zonesexcept Zone 1 and Zone 2) is largely offset by the increase in cost. Especially the foundationcost variations have a distinct impact on the LCoE, resulting from the variations in waterdepth and installation costs. The WTG installation and maintenance are also significant forthese sites due to the larger distance to the marshalling harbour.
• The differences in cable losses and cable cost only have a negligible impact on the LCoEbecause of the assumed fixed turbine grid, the rectangular shaped sites and almost noobstacles at the sites; only for Zone 1 these costs have an impact on the LCoE becausethese sites don’t have a rectangular shape, and several existing cables have to be crossed.
• IJmuiden Ver B has a slightly higher LCoE than IJmuiden Ver A because of the slightly lessadvantageous wind conditions.

LCOE STUDY FOR OFFSHORE WIND ENERGY SEARCH AREAS
48
• The LCoE of Zone 3 A is the lowest and 4.4% lower than the LCoE of IJmuiden Ver A evenconsidering the similar density. This is due to the favourable shape and orientation, andthe lack of neighbouring sites, resulting in low wake losses. (The numbers in Table 15 andTable 16 and Figure 29 and Figure 30 differ slightly because of the difference in comparingwith the site IJmuiden Ver A only or with the WFZ IJmuiden Ver including IJmuiden Ver B.)
• Sites in the middle of the wind farm Zone 5 (B, C, D), Zone 6 (B, C, D) and Zone 7 (B, C) havethe highest LCoE because these sites experience the negative wake effects of neighbouringsites. However, the gross yield for these sites is relatively high so the LCoE difference is stillless than +/-0.1%, except for site Zone 7 C, which has the highest LCoE and 1.3% higherthan the reference LCoE of IJmuiden Ver A.
• The LCoE is significantly lower for the wind farm sites Zone 3 A, Zone 5 A, Zone 5 (mb) D,Zone 6 F and Zone 7 A compared to IJmuiden Ver A, with an LCoE between –3.0% and –4.4%. These sites are all located in the windy northern part of the North Sea), closest to aport (compared to other sites within their zone) and at an outer edge of a zone (without aneighbouring site in the dominant wind direction WSW that causes wake losses).
Figure 29: LCoE of the new search areas wind farm sites and IJmuiden Ver A and B
Table 15: LCoE of the new search areas wind farm sites and IJmuiden Ver A and B
Site Net LCoE impact
Cable costs
Foundation costs
WTG Capex
WTG Opex
Gross yield
Wake
losses
Cable
losses
IJV A - - - - - - - -
IJV B 0.3% -0.0% 0.1% - - 0.5% -0.3% -0.0%
Zone 1 A -2.4% 0.4% 0.2% 0.3% 0.7% -2.9% -1.2% 0.1%
Zone 1 B -0.7% 0.4% 0.0% 0.3% 0.7% -2.6% 0.5% 0.1%
Zone 1 C -1.6% 0.2% -0.0% 0.3% 0.7% -2.5% -0.2% 0.0%
Zone 1 D -2.3% 0.0% 0.1% 0.3% 0.7% -2.1% -1.3% -0.0%
Zone 2 A -2.9% -0.0% -0.2% - - -1.6% -1.0% -0.0%
Zone 2 B -1.5% 0.0% -0.2% - - -1.5% 0.2% -0.0%
Zone 2 C -1.7% 0.1% 0.0% - - -1.2% -0.6% 0.0%
-
-4.4%
1.3%
-8.0%
-6.0%
-4.0%
-2.0%
0.0%
2.0%
4.0%
6.0%
8.0%
IJV
A
IJV
B
Zon
e 1
A
Zon
e 1
B
Zon
e 1
C
Zon
e 1
D
Zon
e 2
A
Zon
e 2
B
Zon
e 2
C
Zon
e 3
A
Zon
e 5
A
Zon
e 5
B
Zon
e 5
C
Zon
e 5
D
Zon
e 5
E
Zon
e 5
(m
b)
A
Zon
e 5
(m
b)
B
Zon
e 5
(m
b)
C
Zon
e 5
(m
b)
D
Zon
e 6
A
Zon
e 6
B
Zon
e 6
C
Zon
e 6
D
Zon
e 6
E
Zon
e 6
F
Zon
e 7
A
Zon
e 7
B
Zon
e 7
C
Zon
e 7
D
Incr
eas
e in
LC
oE
(%)
WTG Opex WTG Capex Foundation costs Cable costs
Cable losses Wake losses Gross yield Net LCoE impact

LCOE STUDY FOR OFFSHORE WIND ENERGY SEARCH AREAS
49
Zone 3 A -4.4% 0.2% 1.2% 0.3% 0.7% -3.4% -3.4% 0.0%
Zone 5 A -3.5% 0.2% 1.8% 0.3% 0.7% -5.0% -1.4% 0.0%
Zone 5 B -0.4% 0.1% 1.7% 0.3% 0.7% -5.4% 2.2% 0.0%
Zone 5 C -0.2% 0.2% 1.6% 0.3% 0.7% -5.5% 2.5% 0.1%
Zone 5 D -0.6% 0.1% 1.5% 0.3% 0.7% -5.5% 2.3% 0.0%
Zone 5 E -3.1% -0.0% 1.3% 0.3% 0.7% -5.6% 0.3% -0.0%
Zone 5 (mb) A -2.9% -0.0% 1.9% 0.5% 1.4% -5.7% -0.9% -0.0%
Zone 5 (mb) B -1.2% -0.0% 2.0% 0.5% 1.4% -5.2% 0.0% -0.0%
Zone 5 (mb) C -2.5% 0.1% 2.2% 0.3% 0.7% -5.1% -0.7% -0.0%
Zone 5 (mb) D -3.4% 0.1% 2.2% 0.3% 0.7% -4.4% -2.3% -0.0%
Zone 6 A -1.6% 0.2% 2.3% 0.5% 1.4% -5.7% -0.4% 0.0%
Zone 6 B 0.9% 0.2% 2.5% 0.5% 1.4% -5.7% 2.0% 0.0%
Zone 6 C 0.7% 0.2% 2.4% 0.5% 1.4% -5.7% 1.7% 0.0%
Zone 6 D 0.3% 0.1% 2.3% 0.5% 1.4% -5.4% 1.4% 0.0%
Zone 6 E -0.2% -0.1% 2.4% 0.5% 1.4% -5.2% 0.9% -0.1%
Zone 6 F -3.5% 0.1% 2.4% 0.3% 0.7% -4.7% -2.3% -0.0%
Zone 7 A -3.0% 0.0% 1.4% 0.3% 0.7% -4.2% -1.2% -0.0%
Zone 7 B 0.6% 0.0% 1.8% 0.3% 0.7% -4.2% 2.1% -0.0%
Zone 7 C 1.3% -0.0% 2.1% 0.3% 0.7% -4.2% 2.5% -0.0%
Zone 7 D -0.8% 0.1% 2.4% 0.3% 0.7% -4.2% -0.0% 0.0%
7.1.3 Comparison between zones
In this paragraph the main results of the analysis on wind farm zone level are described. For the wind farm zones of the new search areas, the average LCoE differences of the wind farm zone with respect to the reference alternative wind area IJmuiden Ver and the impact of the different parameters are shown in Table 16 and Figure 30.
The following main conclusions can be drawn:
• The LCoE is in general lowest for the wind farm zones with the lowest wake losses. This
observation also indicates that the effect of yield is dominant over variations in cost.
• The LCoE vary considerably between the wind farm zones but they all have an LCoE lowerthan the reference IJmuiden Ver; -0.6% to -4.6% difference compared to the referenceIJmuiden Ver mainly due to the higher gross yield resulting from the more favourable windclimate at these zones.
• Zone 3 and Zone 5 (mb) have on average the lowest LCoE with –4.6% and –2.7% comparedto IJmuiden Ver, followed by the wind farm zones Zone 2 and Zone 1 with –2.1% and –1.9%. These differences are mainly caused by the higher gross yield and relatively low wakeeffects compared to IJmuiden Ver. Wind farm Zone 5 also has a significantly lower LCoE of-1.7% compared to the reference, especially due to the high gross yield.
• Zone 7 and Zone 6 have on average a slightly lower Levelized Cost of Energy than IJmuidenVer, -0.6% and -0.7% respectively. The average gross yields are substantially higher forthese wind farm zones but this is largely offset by the higher wake effect and higherfoundation costs. There is however a large variation between the sites in these zones.

LCOE STUDY FOR OFFSHORE WIND ENERGY SEARCH AREAS
50
Figure 30: LCoE of the new search areas wind farm zones and IJmuiden Ver
Table 16: LCoE of the new search areas wind farm zones and IJmuiden Ver
WFZ Net LCoE impact
Cable costs
Foundation costs
WTG Capex
WTG Opex
Gross yield
Wake
losses
Cable
losses
IJV - - - - - - - -
Zone 1 -1.9% 0.3% 0.0% 0.3% 0.7% -2.8% -0.4% 0.0%
Zone 2 -2.1% 0.1% -0.2% - - -1.7% -0.3% 0.0%
Zone 3 -4.6% 0.2% 1.1% 0.3% 0.7% -3.6% -3.3% 0.0%
Zone 5 -1.7% 0.1% 1.6% 0.3% 0.7% -5.7% 1.3% 0.0%
Zone 5 (mb) -2.7% 0.1% 2.1% 0.4% 1.0% -5.4% -0.8% -0.0%
Zone 6 -0.7% 0.1% 2.3% 0.5% 1.3% -5.7% 0.7% 0.0%
Zone 7 -0.6% 0.1% 1.9% 0.3% 0.7% -4.5% 1.0% -0.0%
The black dots in Figure 30 show the net LCoE impact, matching the numbers in the first column of the tables.
7.2 Power density sensitivity of the OWF LCoE results
A sensitivity analysis was performed to investigate the impact of the wind turbine density on the average levelized cost of energy of the wind farm Zone 6 and Zone 5 (mb)
Figure 31 to Figure 34 show the relative LCoE per turbine of Zone 6 and Zone 5 (mb) with densities of 10 MW/km2 and 6 MW/km2. In Figure 35 a breakdown of the average LCoE differences of Zone 6 and Zone 5 (mb) with 6 MW/km2 are presented with respect to the benchmark 10 MW/km2 sites.
-1.9%-2.1%
-4.6%
-1.7%-2.7%
-0.7%-0.6%
-8.0%
-6.0%
-4.0%
-2.0%
0.0%
2.0%
4.0%
6.0%
IJV Zone 1 Zone 2 Zone 3 Zone 5 Zone 5 (mb) Zone 6 Zone 7
Incr
eas
e in
LC
oE
(%)
Gross yield Wake losses Cable losses Cable costs Foundation costs WTG Capex WTG Opex Net LCoE impact

LCOE STUDY FOR OFFSHORE WIND ENERGY SEARCH AREAS
51
Figure 31: Relative LCoE WFZ Zone 5 (mb) assuming 10 MW/km2
Figure 32: Relative LCoE WFZ Zone 5 (mb) assuming 6 MW/km2
Figure 33: Relative LCoE WFZ Zone 6 assuming 10 MW/km2
Figure 34: Relative LCoE WFZ Zone 6 assuming 6 MW/km2
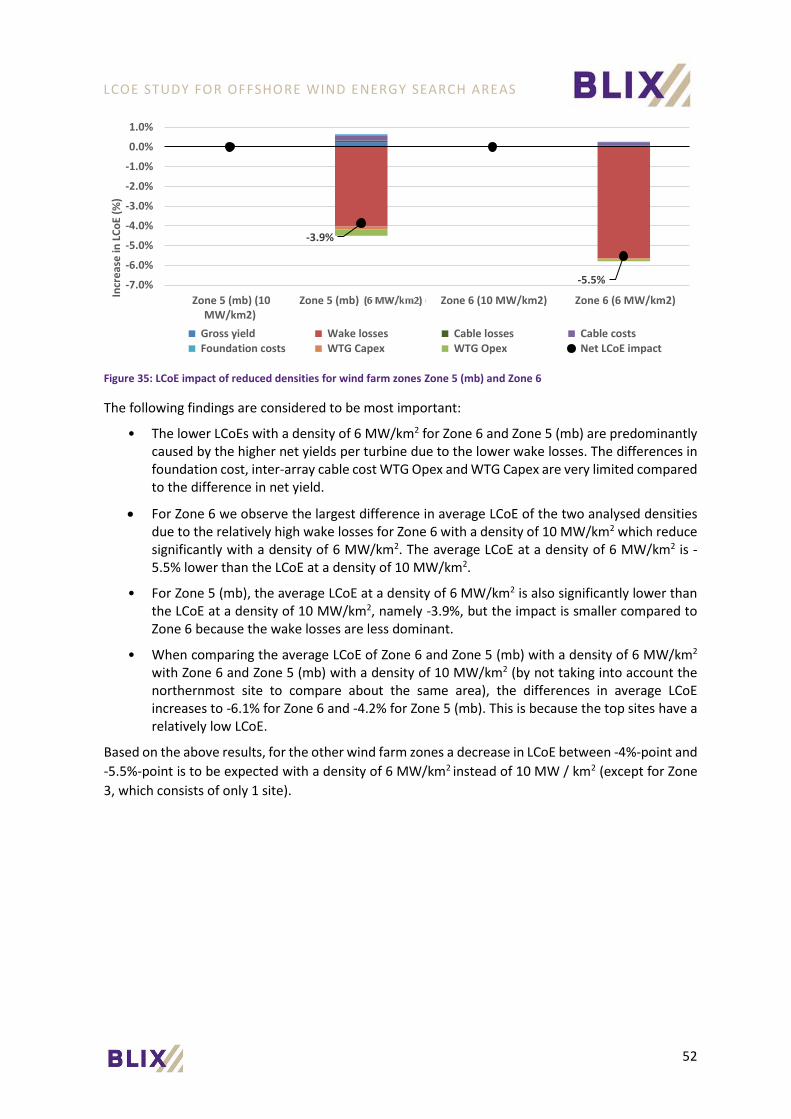
LCOE STUDY FOR OFFSHORE WIND ENERGY SEARCH AREAS
52
Figure 35: LCoE impact of reduced densities for wind farm zones Zone 5 (mb) and Zone 6
The following findings are considered to be most important:
• The lower LCoEs with a density of 6 MW/km2 for Zone 6 and Zone 5 (mb) are predominantlycaused by the higher net yields per turbine due to the lower wake losses. The differences infoundation cost, inter-array cable cost WTG Opex and WTG Capex are very limited comparedto the difference in net yield.
• For Zone 6 we observe the largest difference in average LCoE of the two analysed densitiesdue to the relatively high wake losses for Zone 6 with a density of 10 MW/km2 which reducesignificantly with a density of 6 MW/km2. The average LCoE at a density of 6 MW/km2 is -5.5% lower than the LCoE at a density of 10 MW/km2.
• For Zone 5 (mb), the average LCoE at a density of 6 MW/km2 is also significantly lower thanthe LCoE at a density of 10 MW/km2, namely -3.9%, but the impact is smaller compared toZone 6 because the wake losses are less dominant.
• When comparing the average LCoE of Zone 6 and Zone 5 (mb) with a density of 6 MW/km2
with Zone 6 and Zone 5 (mb) with a density of 10 MW/km2 (by not taking into account thenorthernmost site to compare about the same area), the differences in average LCoEincreases to -6.1% for Zone 6 and -4.2% for Zone 5 (mb). This is because the top sites have arelatively low LCoE.
Based on the above results, for the other wind farm zones a decrease in LCoE between -4%-point and
-5.5%-point is to be expected with a density of 6 MW/km2 instead of 10 MW / km2 (except for Zone
3, which consists of only 1 site).
-3.9%
-5.5%-7.0%
-6.0%
-5.0%
-4.0%
-3.0%
-2.0%
-1.0%
0.0%
1.0%
Zone 5 (mb) (10MW/km2)
Zone 5 (mb) (7 MW/km2) Zone 6 (10 MW/km2) Zone 6 (6 MW/km2)
Incr
eas
e in
LC
oE
(%)
Gross yield Wake losses Cable losses Cable costs Foundation costs WTG Capex WTG Opex Net LCoE impact

LCOE STUDY FOR OFFSHORE WIND ENERGY SEARCH AREAS
53
Part II
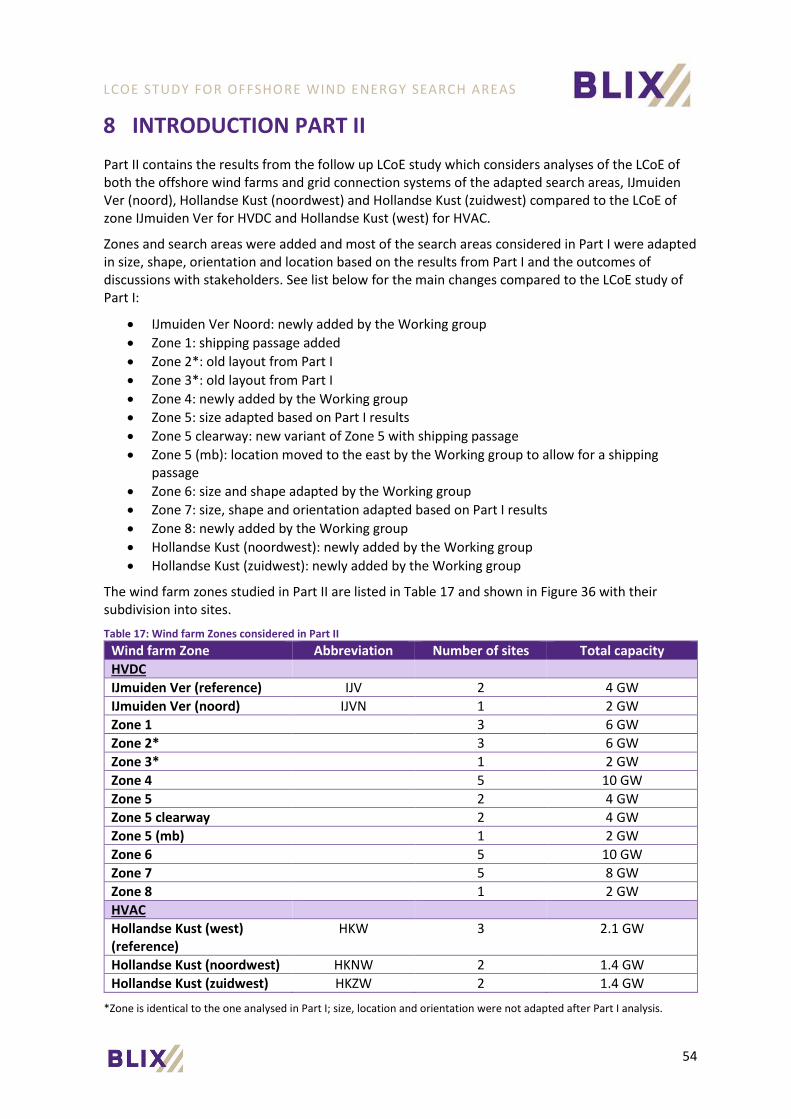
LCOE STUDY FOR OFFSHORE WIND ENERGY SEARCH AREAS
54
8 INTRODUCTION PART II
Part II contains the results from the follow up LCoE study which considers analyses of the LCoE of both the offshore wind farms and grid connection systems of the adapted search areas, IJmuiden Ver (noord), Hollandse Kust (noordwest) and Hollandse Kust (zuidwest) compared to the LCoE of zone IJmuiden Ver for HVDC and Hollandse Kust (west) for HVAC.
Zones and search areas were added and most of the search areas considered in Part I were adapted in size, shape, orientation and location based on the results from Part I and the outcomes of discussions with stakeholders. See list below for the main changes compared to the LCoE study of Part I:
• IJmuiden Ver Noord: newly added by the Working group
• Zone 1: shipping passage added
• Zone 2*: old layout from Part I
• Zone 3*: old layout from Part I
• Zone 4: newly added by the Working group
• Zone 5: size adapted based on Part I results
• Zone 5 clearway: new variant of Zone 5 with shipping passage
• Zone 5 (mb): location moved to the east by the Working group to allow for a shippingpassage
• Zone 6: size and shape adapted by the Working group
• Zone 7: size, shape and orientation adapted based on Part I results
• Zone 8: newly added by the Working group
• Hollandse Kust (noordwest): newly added by the Working group
• Hollandse Kust (zuidwest): newly added by the Working group
The wind farm zones studied in Part II are listed in Table 17 and shown in Figure 36 with their subdivision into sites.
Table 17: Wind farm Zones considered in Part II
Wind farm Zone Abbreviation Number of sites Total capacity
HVDC
IJmuiden Ver (reference) IJV 2 4 GW
IJmuiden Ver (noord) IJVN 1 2 GW
Zone 1 3 6 GW
Zone 2* 3 6 GW
Zone 3* 1 2 GW
Zone 4 5 10 GW
Zone 5 2 4 GW
Zone 5 clearway 2 4 GW
Zone 5 (mb) 1 2 GW
Zone 6 5 10 GW
Zone 7 5 8 GW
Zone 8 1 2 GW
HVAC
Hollandse Kust (west) (reference)
HKW 3 2.1 GW
Hollandse Kust (noordwest) HKNW 2 1.4 GW
Hollandse Kust (zuidwest) HKZW 2 1.4 GW
*Zone is identical to the one analysed in Part I; size, location and orientation were not adapted after Part I analysis.

LCOE STUDY FOR OFFSHORE WIND ENERGY SEARCH AREAS
55
Figure 36: Overview of the wind farm search areas studied in Part II
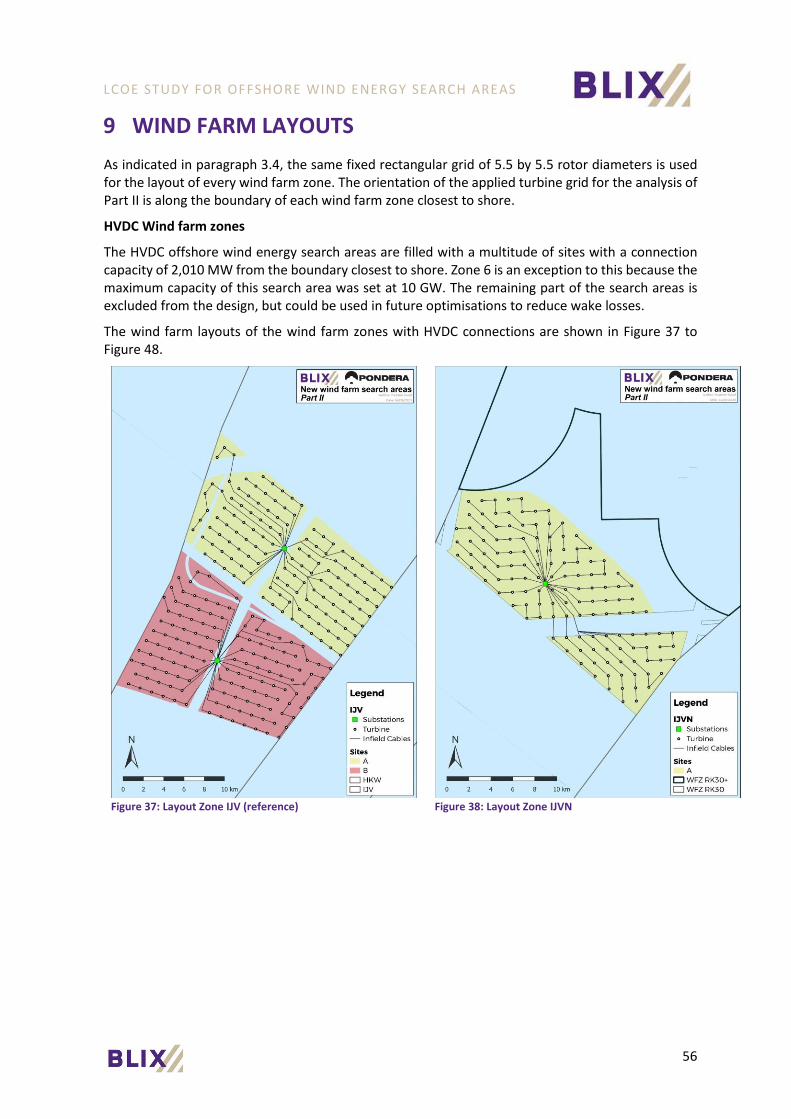
LCOE STUDY FOR OFFSHORE WIND ENERGY SEARCH AREAS
56
9 WIND FARM LAYOUTS
As indicated in paragraph 3.4, the same fixed rectangular grid of 5.5 by 5.5 rotor diameters is used for the layout of every wind farm zone. The orientation of the applied turbine grid for the analysis of Part II is along the boundary of each wind farm zone closest to shore.
HVDC Wind farm zones
The HVDC offshore wind energy search areas are filled with a multitude of sites with a connection capacity of 2,010 MW from the boundary closest to shore. Zone 6 is an exception to this because the maximum capacity of this search area was set at 10 GW. The remaining part of the search areas is excluded from the design, but could be used in future optimisations to reduce wake losses.
The wind farm layouts of the wind farm zones with HVDC connections are shown in Figure 37 to Figure 48.
Figure 37: Layout Zone IJV (reference) Figure 38: Layout Zone IJVN

LCOE STUDY FOR OFFSHORE WIND ENERGY SEARCH AREAS
57
Figure 39: Layout Zone 1 Figure 40: Layout Zone 2
Figure 41: Layout Zone 3 Figure 42: Layout Zone 4

LCOE STUDY FOR OFFSHORE WIND ENERGY SEARCH AREAS
58
Figure 43: Layout Zone 5 Figure 44: Layout Zone 5 clearway
Figure 45: Layout Zone 5 (mb) Figure 46: Layout Zone 6

LCOE STUDY FOR OFFSHORE WIND ENERGY SEARCH AREAS
59
Figure 47: Layout Zone 7 Figure 48: Layout Zone 8
HVAC Wind farm zones
The HVAC offshore wind farm zones are filled with a multitude of sites with a connection capacity of 750 MW from the boundary closest to shore, with the remaining part of the zones excluded from the design.
The wind farm zone layouts with HVAC connections are shown in Figure 49, Figure 50 and Figure 51.

LCOE STUDY FOR OFFSHORE WIND ENERGY SEARCH AREAS
60
Figure 49: Layout Zone HKW Figure 50: Layout Zone HKNW
Figure 51: Layout Zone HKZW

LCOE STUDY FOR OFFSHORE WIND ENERGY SEARCH AREAS
61
10 YIELD ANALYSIS
10.1 Yield results
HVDC Wind farm zones
The HVDC zones IJV, IJVN and the wind farm zones in search areas 1 to 8 have been modelled and analysed. IJmuiden Ver serves as the reference for the other wind farm zones. The main characteristics and the results for each wind farm zone are shown in Table 18 (averages based on the wind farm sites).
The following findings are considered to be most significant:
• There is a 0.4 m/s wind speed difference between all wind farm zones. The highest annualmean wind speeds are found in the northernmost wind farm zones (5 to 7), locatedfurthest away from the mainland. The wind speeds are lowest at the zones IJVN, 2 and 8,which are closest to the mainland.
• The difference in gross and net annual yield between the wind farm zones can simply beexplained by the differences in sizes (and subsequently numbers of turbines) of the windfarm zones. The highest total net energy yield is found in wind farm zones 4 and 6 (43,32and 44,032 GWh respectively) which both contain 804 wind turbines, while the highestaverage net energy yield per wind farm site is found for Zone 5 (mb) (9,144 GWh/yr).
• The differences in wake effects can be explained by the size, shape and orientation of thewind farm zone. Larger wind farm zones with many sites suffer from more severe wakeeffects than smaller wind farm zones. For example, wind farm zones 3 and 5 (mb) arerelatively small and consist of only one site and therefore experience lower wake losses(10.2% and 11.1% respectively). Also, the shape and orientation of the wind farm zones, ormore precisely the border length-to-area ratio in relation to the prevailing wind direction,influences the average wake effect. Wake losses are lower at wind farm zones that containmany wind turbines at the edge of the wind farm zone compared to the amount of windturbines inside the wind farm zone. The wind turbines at the borders do not suffer fromwake effects in certain wind directions, reducing the sites overall (wind sector-weighted)wake loss. For example, wind farm Zone 8 also has 1 wind farm site, similar to Zone 3 and 5,but as the shape of this site is less stretched (i.e. more compact) than the sites of Zones 3and 5, higher wake effects are observed at the centre of the wind farm, thereby increasingthe overall wake loss.
• Because of the lower wake losses and wind speed differences, the highest net yield per windturbine is found in wind farm Zone 5 (71.14 GWh/WTG/year).

LCOE STUDY FOR OFFSHORE WIND ENERGY SEARCH AREAS
62
Table 18: Wind farm layout and yield characteristics of HVDC wind farm zones and IJV
Wind farm zone IJV IJVN 1 2 3 4 5 5 Clearway
5 (mb) 6 7 8
Layout
Area [km2] 374 280 665 625 294 1,184 538 391 344 2,189 1,028 154
Area filled [km2] 374 188 606 604 192 986 382 389 201 991 803 151
# of turbines 268 134 402 402 134 670 268 268 134 670 536 134
# wind farm sites 2 1 3 3 1 5 2 2 1 5 4 1
Minimal turbine spacing [x rotor diameter] 5.5 5.5 5.5 5.5 5.5 5.5 5.5 5.5 5.5 5.5 5.5 4.8
Total infield cable length [km] 473 224 828 725 266 1,240 521 534 274 1,199 927 206
# of crossings 3 7 62 24 6 55 9 18 - 16 15 6
Substation distance to port (total) [km] 163 72 356 184 119 577 303 309 142 801 623 58
Substation distance to port (average per site) [km]
82 72 119 61 119 115 151 154 142 160 156 58
Foundation depth (average per WTG) [m] (28) (27) (28) (27) (37) (30) (39) (39) (44) (47) (44) (26)
Energy yield
Mean wind speed at hub height [m/s] 10.2 10.3 10.4 10.3 10.5 10.4 10.6 10.6 10.6 10.6 10.6 10.3
Gross annual yield (total) [GWh/y] 21,620 10,940 33,267 32,992 11,218 56,098 21,718 22,818 11,395 56,771 45,176 10,984
Gross annual yield (average per site) [GWh/y]
10,810 10,940 11,089 10,997 11,218 11,220 10,859 11,409 11,395 11,354 11,294 10,984
Wake losses [%] 13.1 0.6 11.8 12.8 10.2 14.3 13.1 11.1 10.0 12.6 13.6 12.9
IA Cable losses [%] 0.6 0.6 0.7 0.6 0.7 0.6 0.7 0.7 0.7 0.6 0.6 0.5
WTG non-availability [%] 5.0 5.0 5.0 5.0 5.0 5.0 5.0 5.0 5.0 5.0 5.0 5.0
WF Other losses [%] 1.5 1.5 1.5 1.5 1.5 1.5 1.5 1.5 1.5 1.5 1.5 1.5
Export cable losses [%] 0.7 0.7 0.6 0.5 0.7 0.4 0.5 0.5 0.7 0.8 1.0 0.5
GCS non-availabilities [%] 3.5 3.5 3.3 2.8 3.7 2.7 3.1 3.1 3.4 3.8 4.2 3.0
Net annual yield (total of the zone) [GWh/y] 16,740 8,567 26,188 25,875 8,950 43,325 17,969 18,178 9,144 44,032 34,451 8,594
Net annual yield (average per site) [GWh/y] 8,370 8,567 8,729 8,625 8,950 8,665 8,985 9,089 9,144 8,807 8,613 8,594
Net annual yield (average per WTG) [GWh/y]
62.46 63.93 65.14 64.37 66.79 64.66 67.05 67.83 68.24 65.72 64.28 64.13
Net annual yield (average per WTG) [GWh/y]
62.46 63.93 65.14 64.37 66.79 64.66 67.05 67.83 68.24 65.72 64.28 64.13
Note: The differences in net yield results for IJV, Zone 2 and Zone 3 compared to Table 13 of Part I are the logical result of taking into account the GCS of each zone and thus including the export cable losses and GCS non-availability losses.
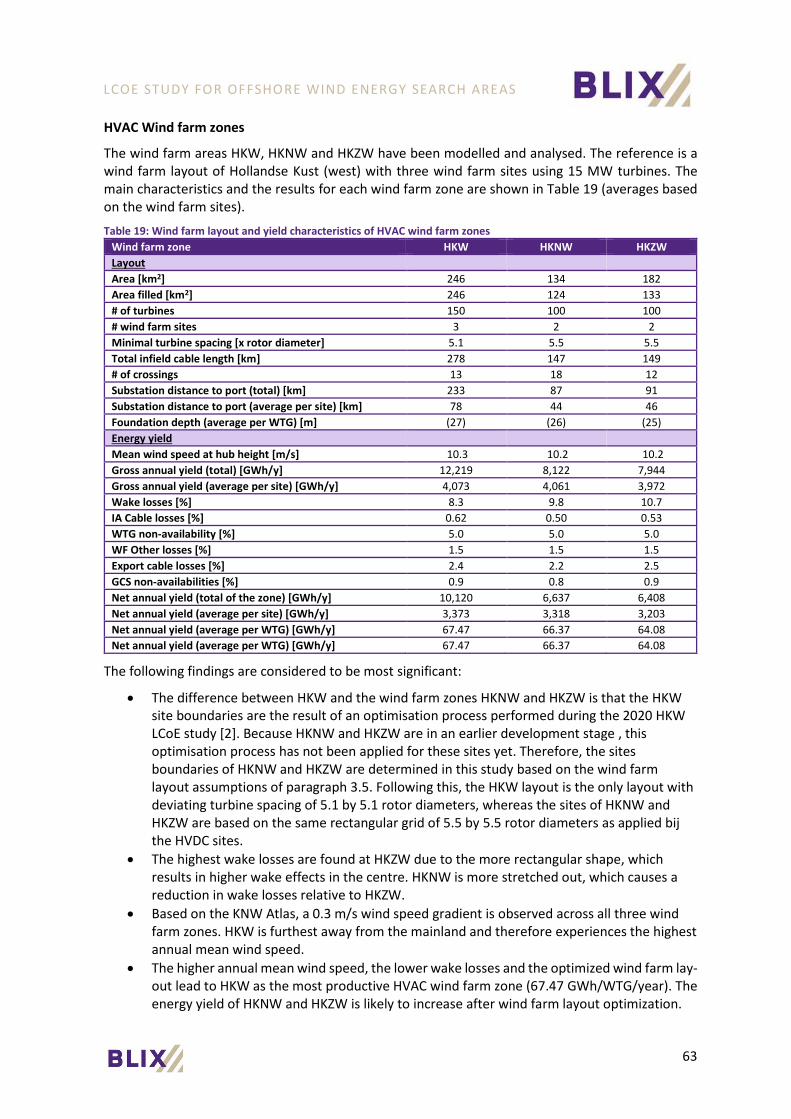
LCOE STUDY FOR OFFSHORE WIND ENERGY SEARCH AREAS
63
HVAC Wind farm zones
The wind farm areas HKW, HKNW and HKZW have been modelled and analysed. The reference is a wind farm layout of Hollandse Kust (west) with three wind farm sites using 15 MW turbines. The main characteristics and the results for each wind farm zone are shown in Table 19 (averages based on the wind farm sites).
Table 19: Wind farm layout and yield characteristics of HVAC wind farm zones
Wind farm zone HKW HKNW HKZW
Layout
Area [km2] 246 134 182
Area filled [km2] 246 124 133
# of turbines 150 100 100
# wind farm sites 3 2 2
Minimal turbine spacing [x rotor diameter] 5.1 5.5 5.5
Total infield cable length [km] 278 147 149
# of crossings 13 18 12
Substation distance to port (total) [km] 233 87 91
Substation distance to port (average per site) [km] 78 44 46
Foundation depth (average per WTG) [m] (27) (26) (25)
Energy yield
Mean wind speed at hub height [m/s] 10.3 10.2 10.2
Gross annual yield (total) [GWh/y] 12,219 8,122 7,944
Gross annual yield (average per site) [GWh/y] 4,073 4,061 3,972
Wake losses [%] 8.3 9.8 10.7
IA Cable losses [%] 0.62 0.50 0.53
WTG non-availability [%] 5.0 5.0 5.0
WF Other losses [%] 1.5 1.5 1.5
Export cable losses [%] 2.4 2.2 2.5
GCS non-availabilities [%] 0.9 0.8 0.9
Net annual yield (total of the zone) [GWh/y] 10,120 6,637 6,408
Net annual yield (average per site) [GWh/y] 3,373 3,318 3,203
Net annual yield (average per WTG) [GWh/y] 67.47 66.37 64.08
Net annual yield (average per WTG) [GWh/y] 67.47 66.37 64.08
The following findings are considered to be most significant:
• The difference between HKW and the wind farm zones HKNW and HKZW is that the HKWsite boundaries are the result of an optimisation process performed during the 2020 HKWLCoE study [2]. Because HKNW and HKZW are in an earlier development stage , thisoptimisation process has not been applied for these sites yet. Therefore, the sitesboundaries of HKNW and HKZW are determined in this study based on the wind farmlayout assumptions of paragraph 3.5. Following this, the HKW layout is the only layout withdeviating turbine spacing of 5.1 by 5.1 rotor diameters, whereas the sites of HKNW andHKZW are based on the same rectangular grid of 5.5 by 5.5 rotor diameters as applied bijthe HVDC sites.
• The highest wake losses are found at HKZW due to the more rectangular shape, whichresults in higher wake effects in the centre. HKNW is more stretched out, which causes areduction in wake losses relative to HKZW.
• Based on the KNW Atlas, a 0.3 m/s wind speed gradient is observed across all three windfarm zones. HKW is furthest away from the mainland and therefore experiences the highestannual mean wind speed.
• The higher annual mean wind speed, the lower wake losses and the optimized wind farm lay-out lead to HKW as the most productive HVAC wind farm zone (67.47 GWh/WTG/year). Theenergy yield of HKNW and HKZW is likely to increase after wind farm layout optimization.

LCOE STUDY FOR OFFSHORE WIND ENERGY SEARCH AREAS
64
10.2 Wake effects
HVDC Wind farm zones
Figure 52 to Figure 63 show a series of plots in which the individual wake losses per wind turbine have been visualised. The wake losses have been expressed as percentages related to the gross energy yield. The legends in all figures have been normalised, i.e. the colours in all maps correspond to the same loss percentages.
The highest wake losses are generally found in the centre of wind farm zones. An exception is wind farm Zone 1, where the highest losses are found more towards the northeast of the zone. This is due to the shipping passage and the maintenance zones of existing infrastructure, which reduce the accumulation of wake effects of multiple rows, as seen from the southwest.
Figure 52: Wake losses Zone IJV Figure 53: Wake losses Zone IJVN

LCOE STUDY FOR OFFSHORE WIND ENERGY SEARCH AREAS
65
Figure 54: Wake losses Zone 1 Figure 55: Wake losses Zone 2
Figure 56: Wake losses Zone 3 Figure 57: Wake losses Zone 4

LCOE STUDY FOR OFFSHORE WIND ENERGY SEARCH AREAS
66
Figure 58: Wake losses Zone 5 Figure 59: Wake losses Zone 5 clearway
Figure 60: Wake losses Zone 5 (mb) Figure 61: Wake losses Zone 6
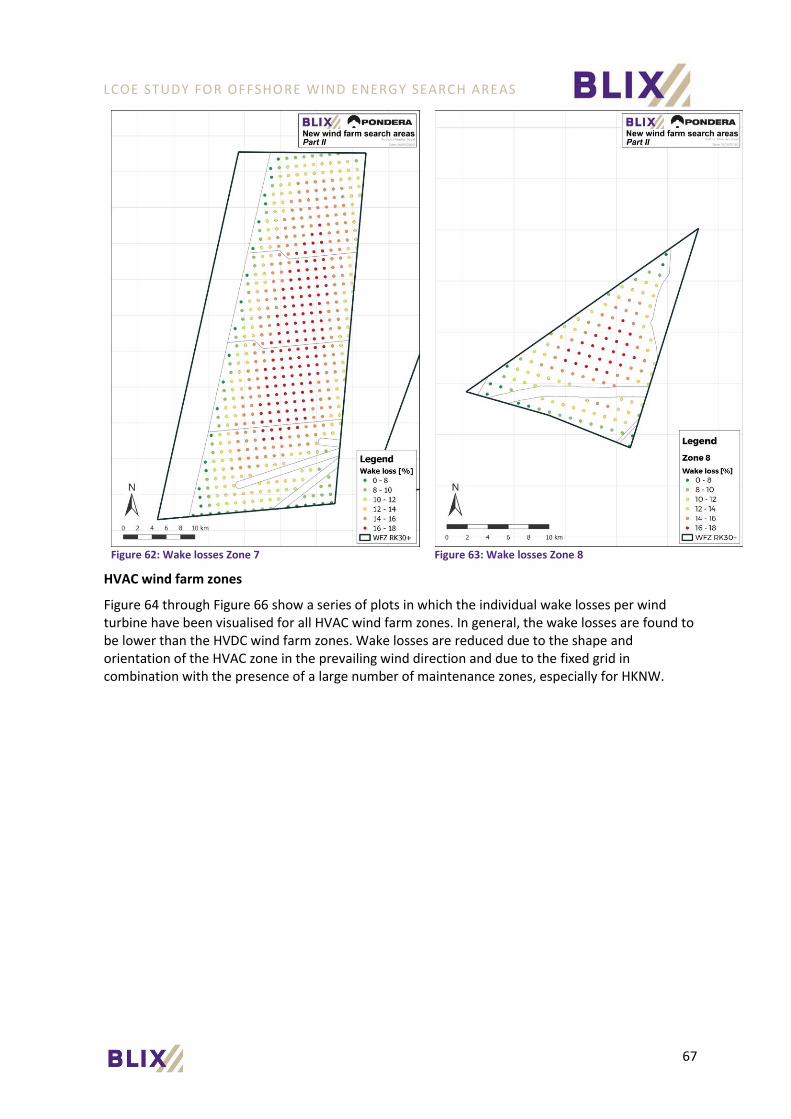
LCOE STUDY FOR OFFSHORE WIND ENERGY SEARCH AREAS
67
Figure 62: Wake losses Zone 7 Figure 63: Wake losses Zone 8
HVAC wind farm zones
Figure 64 through Figure 66 show a series of plots in which the individual wake losses per wind turbine have been visualised for all HVAC wind farm zones. In general, the wake losses are found to be lower than the HVDC wind farm zones. Wake losses are reduced due to the shape and orientation of the HVAC zone in the prevailing wind direction and due to the fixed grid in combination with the presence of a large number of maintenance zones, especially for HKNW.

LCOE STUDY FOR OFFSHORE WIND ENERGY SEARCH AREAS
68
Figure 64: Wake losses Zone HKW (reference) Figure 65: Wake losses Zone HKNW
Figure 66: Wake losses Zone HKZW

LCOE STUDY FOR OFFSHORE WIND ENERGY SEARCH AREAS
69
A wake map of all wind farm zones is shown in Figure 67. Please take note that all wind farm zones have been modelled individually. This means that accumulation of wake effects from one wind farm zone to the other are disregarded in this analysis.
Figure 67: Wake losses of all wind farm zones in Part II

LCOE STUDY FOR OFFSHORE WIND ENERGY SEARCH AREAS
70
11 COMPARISON OF LEVELIZED COST OF ENERGY
For an in-depth comparison of the wind energy search areas, IJVN, HKNW and HKZW we investigated the overall LCoE, the LCoE of the Offshore Wind Farm (OWF) and the LCoE of the Grid Connection System (GCS) per site and compared the results per site and per wind farm zone with respectively the reference site IJmuiden Ver A and the reference zone IJmuiden Ver. In addition, the impact of the different yield and cost parameters on the LCoE differences is determined.
The following paragraphs describe the results of the LCoE comparison between wind farm zones of the overall LCoE (paragraph 11.1), OWF LCoE (paragraph 11.2) and GCS LCoE (paragraph 11.3). Finally, the last paragraph (paragraph 11.4) summarizes the results of the export cable landing area sensitivity analysis performed on the GCS LCoE of the wind farm sites.
The results of the LCoE comparison between wind farm sites of the overall LCoE, OWF LCoE and GCS LCoE can be found in Appendix B. These results can support a follow-up study for the further optimization of the search areas.
11.1 Relative overall LCoE impact
In this paragraph the relative “overall LCoE” (defined as the LCoE of the OWF plus the LCoE of the GCS) are described with a comparison between zones.
Please see paragraphs 11.2 and 11.3 for a comprehensive LCoE impact analysis of the yield and cost parameters.
HVDC zones
In Figure 68 and Table 20, the overall LCoE comparison results of the HVDC zones are shown compared to reference IJmuiden Ver.
The following main conclusions can be drawn on wind farm zone level for the HVDC zones:
• All HVDC zones have a net overall LCoE (OWF + GCS) lower than the reference IJmuiden Ver,except Zone 7. Due to the relatively high GCS and OWF costs, Zone 7 has an overall LCoE of 2.3%higher than IJmuiden Ver.
• Of the HVDC zones, Zones 2, 4 and 5, 5 clearway and 5(mb) have the lowest net overall LCoEdue to the high (net) yield and low GCS costs.
• Differences in yield and GCS costs are dominant over differences in OWF costs.
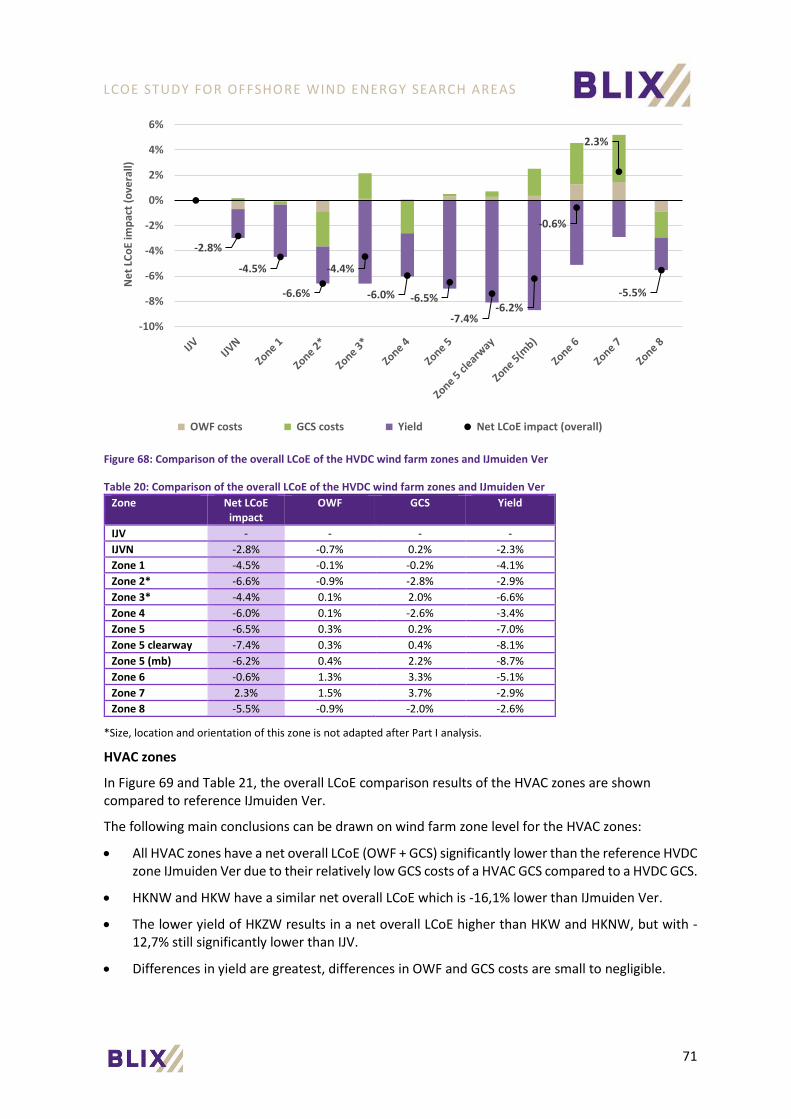
LCOE STUDY FOR OFFSHORE WIND ENERGY SEARCH AREAS
71
Figure 68: Comparison of the overall LCoE of the HVDC wind farm zones and IJmuiden Ver
Table 20: Comparison of the overall LCoE of the HVDC wind farm zones and IJmuiden Ver
Zone Net LCoE impact
OWF GCS Yield
IJV - - - -
IJVN -2.8% -0.7% 0.2% -2.3%
Zone 1 -4.5% -0.1% -0.2% -4.1%
Zone 2* -6.6% -0.9% -2.8% -2.9%
Zone 3* -4.4% 0.1% 2.0% -6.6%
Zone 4 -6.0% 0.1% -2.6% -3.4%
Zone 5 -6.5% 0.3% 0.2% -7.0%
Zone 5 clearway -7.4% 0.3% 0.4% -8.1%
Zone 5 (mb) -6.2% 0.4% 2.2% -8.7%
Zone 6 -0.6% 1.3% 3.3% -5.1%
Zone 7 2.3% 1.5% 3.7% -2.9%
Zone 8 -5.5% -0.9% -2.0% -2.6%
*Size, location and orientation of this zone is not adapted after Part I analysis.
HVAC zones
In Figure 69 and Table 21, the overall LCoE comparison results of the HVAC zones are shown compared to reference IJmuiden Ver.
The following main conclusions can be drawn on wind farm zone level for the HVAC zones:
• All HVAC zones have a net overall LCoE (OWF + GCS) significantly lower than the reference HVDCzone IJmuiden Ver due to their relatively low GCS costs of a HVAC GCS compared to a HVDC GCS.
• HKNW and HKW have a similar net overall LCoE which is -16,1% lower than IJmuiden Ver.
• The lower yield of HKZW results in a net overall LCoE higher than HKW and HKNW, but with -12,7% still significantly lower than IJV.
• Differences in yield are greatest, differences in OWF and GCS costs are small to negligible.
-2.8%
-4.5%
-6.6%
-4.4%
-6.0% -6.5%
-7.4%-6.2%
-0.6%
2.3%
-5.5%
-10%
-8%
-6%
-4%
-2%
0%
2%
4%
6%N
et
LCo
E im
pac
t (o
vera
ll)
OWF costs GCS costs Yield Net LCoE impact (overall)
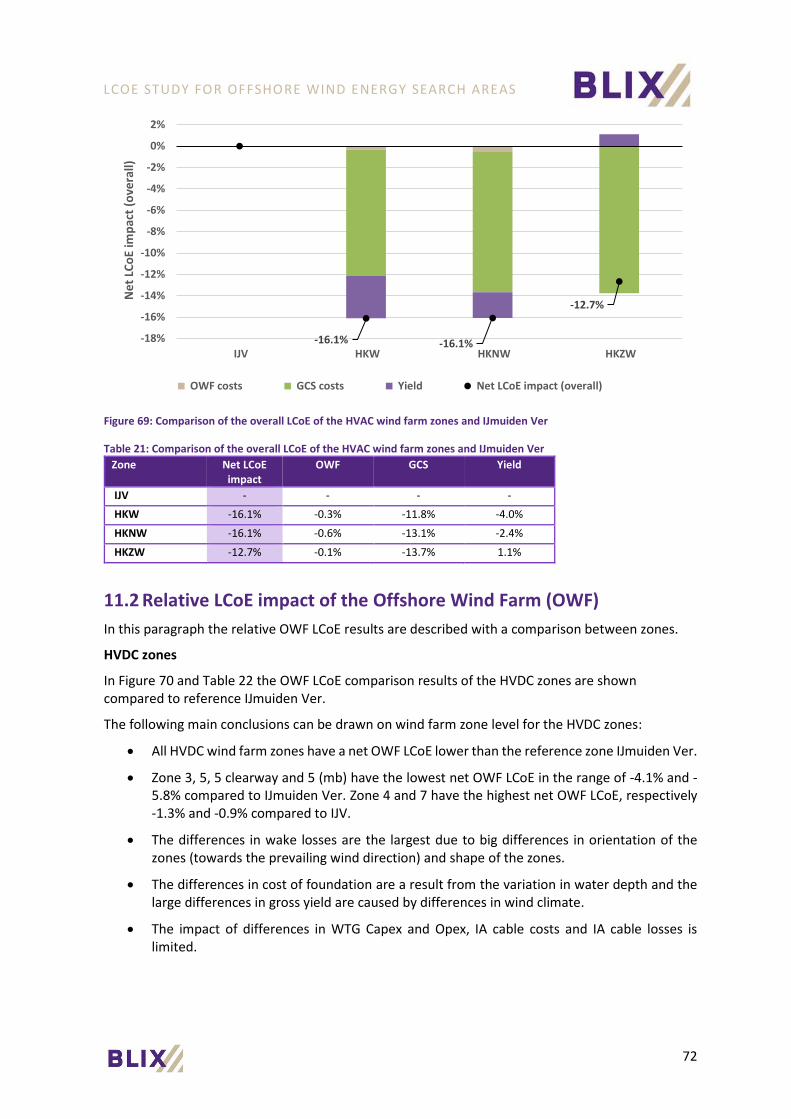
LCOE STUDY FOR OFFSHORE WIND ENERGY SEARCH AREAS
72
Figure 69: Comparison of the overall LCoE of the HVAC wind farm zones and IJmuiden Ver
Table 21: Comparison of the overall LCoE of the HVAC wind farm zones and IJmuiden Ver
Zone Net LCoE impact
OWF GCS Yield
IJV - - - -
HKW -16.1% -0.3% -11.8% -4.0%
HKNW -16.1% -0.6% -13.1% -2.4%
HKZW -12.7% -0.1% -13.7% 1.1%
11.2 Relative LCoE impact of the Offshore Wind Farm (OWF)
In this paragraph the relative OWF LCoE results are described with a comparison between zones.
HVDC zones
In Figure 70 and Table 22 the OWF LCoE comparison results of the HVDC zones are shown compared to reference IJmuiden Ver.
The following main conclusions can be drawn on wind farm zone level for the HVDC zones:
• All HVDC wind farm zones have a net OWF LCoE lower than the reference zone IJmuiden Ver.
• Zone 3, 5, 5 clearway and 5 (mb) have the lowest net OWF LCoE in the range of -4.1% and -5.8% compared to IJmuiden Ver. Zone 4 and 7 have the highest net OWF LCoE, respectively-1.3% and -0.9% compared to IJV.
• The differences in wake losses are the largest due to big differences in orientation of thezones (towards the prevailing wind direction) and shape of the zones.
• The differences in cost of foundation are a result from the variation in water depth and thelarge differences in gross yield are caused by differences in wind climate.
• The impact of differences in WTG Capex and Opex, IA cable costs and IA cable losses islimited.
-16.1% -16.1%
-12.7%
-18%
-16%
-14%
-12%
-10%
-8%
-6%
-4%
-2%
0%
2%
IJV HKW HKNW HKZW
Ne
t LC
oE
imp
act
(ove
rall)
OWF costs GCS costs Yield Net LCoE impact (overall)

LCOE STUDY FOR OFFSHORE WIND ENERGY SEARCH AREAS
73
Figure 70: Comparison of the OWF LCoE of the HVDC wind farm zones and IJmuiden Ver
Table 22: Comparison of the OWF LCoE of the HVDC wind farm zones and IJmuiden Ver
Zone Net LCoE impact (OWF)
Cable costs
Foundation costs
WTG Capex
WTG Opex
Gross yield
Wake
losses
Cable
losses
IJV - - - - - - - -
IJVN -2.7% -0.1% -0.1% -0.0% -0.2% -1.2% -1.0% -0.0%
Zone 1 -2.9% 0.3% 0.1% 0.1% 0.5% -2.5% -1.4% 0.1%
Zone 2* -2.5% 0.1% -0.2% -0.1% -0.3% -1.7% -0.3% 0.0%
Zone 3* -4.9% 0.2% 1.1% 0.1% 0.5% -3.6% -3.2% 0.0%
Zone 4 -1.3% 0.1% 0.3% 0.1% 0.5% -3.7% 1.3% 0.0%
Zone 5 -4.1% 0.1% 1.5% 0.2% 0.5% -5.1% -1.4% 0.0%
Zone 5 clearway -5.0% 0.2% 1.5% 0.3% 0.5% -5.3% -2.3% 0.0%
Zone 5 (mb) -5.8% 0.2% 2.0% 0.2% 0.5% -5.1% -3.5% 0.0%
Zone 6 -2.4% 0.0% 2.4% 0.3% 0.5% -4.8% -0.8% -0.0%
Zone 7 -0.9% -0.0% 2.2% 0.3% 0.5% -4.3% 0.5% -0.0%
Zone 8 -2.6% -0.2% -0.3% -0.0% -0.2% -1.6% -0.2% -0.1%
*Size, location and orientation of this zone is not adapted after Part I analysis.
HVAC zones
In Figure 71 and Table 23 the OWF LCoE comparison results of the HVAC zones are shown compared to reference IJmuiden Ver.
The following main conclusions can be drawn on wind farm zone level for the HVAC zones:
• The HVAC zone HKNW has a -1.5% lower net OWF LCoE, while HKZW has a 1.6% higher netOWF LCoE than IJmuiden Ver. This difference between the two HVAC zones is mainly causedby the differences in gross yield and wake losses.
• The HVAC zones experience less wake losses than IJV due to their favourable shape andorientation with respect to the prevailing wind direction.
• The parameter “wind farm size costs” represents the relative high costs for the 700 MW HVACwind farms compared to the 2 GW HVDC wind farms of IJV, due to economies of scale.
-2.7%-2.9%
-2.5%
-4.9%
-1.3%
-4.1%-5.0%
-5.8%
-2.4%-0.9%
-2.6%
-10%
-8%
-6%
-4%
-2%
0%
2%
4%
6%
IJV IJVN Zone 1 Zone 2* Zone 3* Zone 4 Zone 5 Zone 5clearway
Zone5(mb)
Zone 6 Zone 7 Zone 8
Gross yield Wake losses Cable losses Cable costs Foundation costs WTG Capex WTG Opex Net LCoE impact (OWF)

LCOE STUDY FOR OFFSHORE WIND ENERGY SEARCH AREAS
74
Figure 71: Comparison of the OWF LCoE of the HVAC wind farm zones and IJmuiden Ver
Table 23: Comparison of the OWF LCoE of the HVAC wind farm zones and IJmuiden Ver
Zone Net LCoE impact (OWF)
Cable costs
Foundation costs
WTG Capex
WTG Opex
Wind farm size
costs
Gross yield
Wake losses
Cable losses
IJV - - - - - - - - -
HKW -2.5% 0.8% -0.2% -0.0% -0.1% 3.5% -1.0% -5.6% -0.0%
HKNW -1.5% 0.6% -0.3% -0.1% -0.4% 3.4% -0.7% -3.9% -0.1%
HKZW 1.6% 0.6% -0.5% -0.1% -0.4% 3.3% 1.6% -2.8% -0.1%
11.3 Relative LCoE impact of the Grid Connection System (GCS)
In this paragraph the relative LCoE results of the GCS are described with a comparison between zones.
HVDC zones
In Figure 72 and Table 24 the GCS LCoE comparison results of the HVDC zones are shown compared to reference IJmuiden Ver.
The following main conclusions can be drawn on wind farm zone level for the HVDC zones:
• The HVDC zones 1, 2, 4, 5, 5 clearway, 5 (mb) and 8 have a substantially lower net GCS LCoE (inthe range between -3.6% and -14.5%) than the reference IJmuiden Ver, while Zone 3 has acomparable net LCoE (-0.9%) and the zones 6 and 7 a significantly higher net GCS LCoE than IJV(+2.9% and +6.4% respectively).
• The differences in net LCoE compared to IJV can mainly be explained by large variations in theexport cable costs due to large differences in the length of the export cables (corresponding tothe distance of the offshore substations to the onshore substation at the landing area multipliedby a landing area specific factor to account for obstacles and soil conditions in the optimalrouting).
• The LCoE impact of variations in the other costs, such as surveying (incl. UXO), projectmanagement, insurance and Devex, and O&M costs are also considerable (up to +/- 2.4%), whilethe LCoE impact of variation in the platform costs, export cable losses and GCS non-availabilitiesare small (less than +/- 1.0%).
-2.5%
-1.5%
1.6%
-8%
-6%
-4%
-2%
0%
2%
4%
6%
8%
IJV HKW HKNW HKZW Gross yield Wake losses Cable losses Cable costs Foundation costs WTG Capex WTG Opex Wind farm size costs Net LCoE impact (OWF)
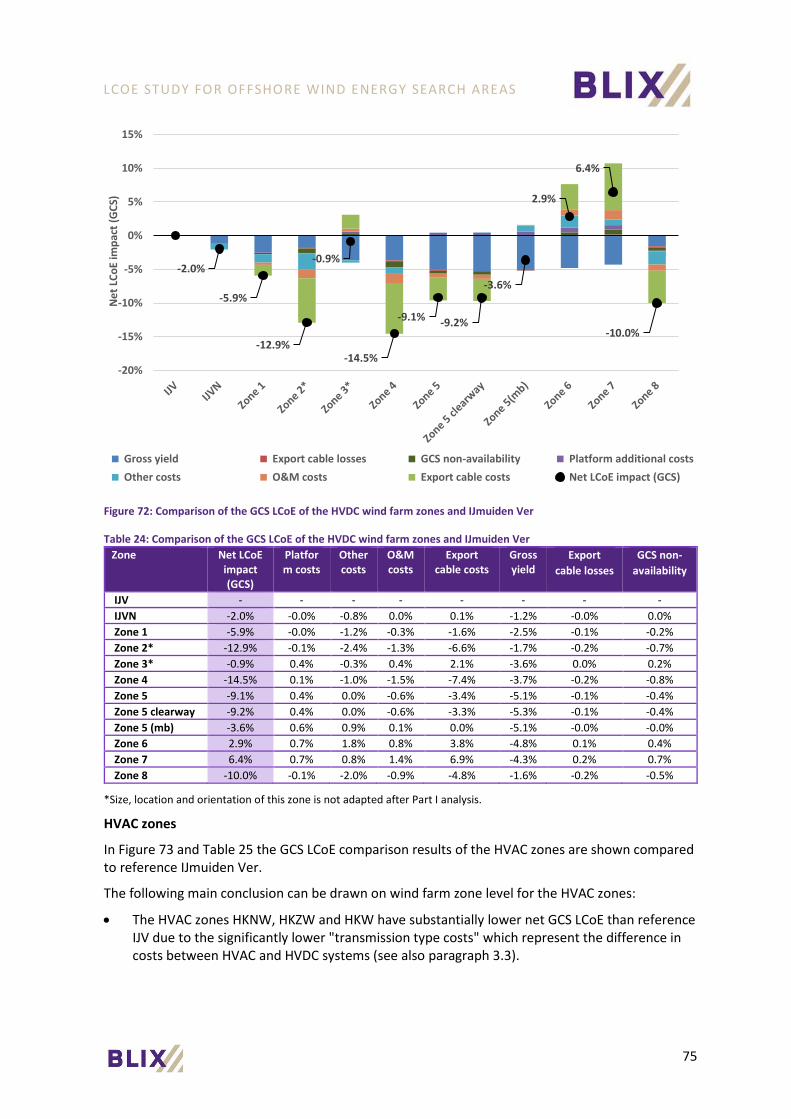
LCOE STUDY FOR OFFSHORE WIND ENERGY SEARCH AREAS
75
Figure 72: Comparison of the GCS LCoE of the HVDC wind farm zones and IJmuiden Ver
Table 24: Comparison of the GCS LCoE of the HVDC wind farm zones and IJmuiden Ver
Zone Net LCoE impact (GCS)
Platform costs
Other costs
O&M costs
Export cable costs
Gross yield
Export
cable losses
GCS non-
availability
IJV - - - - - - - -
IJVN -2.0% -0.0% -0.8% 0.0% 0.1% -1.2% -0.0% 0.0%
Zone 1 -5.9% -0.0% -1.2% -0.3% -1.6% -2.5% -0.1% -0.2%
Zone 2* -12.9% -0.1% -2.4% -1.3% -6.6% -1.7% -0.2% -0.7%
Zone 3* -0.9% 0.4% -0.3% 0.4% 2.1% -3.6% 0.0% 0.2%
Zone 4 -14.5% 0.1% -1.0% -1.5% -7.4% -3.7% -0.2% -0.8%
Zone 5 -9.1% 0.4% 0.0% -0.6% -3.4% -5.1% -0.1% -0.4%
Zone 5 clearway -9.2% 0.4% 0.0% -0.6% -3.3% -5.3% -0.1% -0.4%
Zone 5 (mb) -3.6% 0.6% 0.9% 0.1% 0.0% -5.1% -0.0% -0.0%
Zone 6 2.9% 0.7% 1.8% 0.8% 3.8% -4.8% 0.1% 0.4%
Zone 7 6.4% 0.7% 0.8% 1.4% 6.9% -4.3% 0.2% 0.7%
Zone 8 -10.0% -0.1% -2.0% -0.9% -4.8% -1.6% -0.2% -0.5%
*Size, location and orientation of this zone is not adapted after Part I analysis.
HVAC zones
In Figure 73 and Table 25 the GCS LCoE comparison results of the HVAC zones are shown compared to reference IJmuiden Ver.
The following main conclusion can be drawn on wind farm zone level for the HVAC zones:
• The HVAC zones HKNW, HKZW and HKW have substantially lower net GCS LCoE than referenceIJV due to the significantly lower "transmission type costs" which represent the difference incosts between HVAC and HVDC systems (see also paragraph 3.3).
-2.0%
-5.9%
-12.9%
-0.9%
-14.5%
-9.1% -9.2%
-3.6%
2.9%
6.4%
-10.0%
-20%
-15%
-10%
-5%
0%
5%
10%
15%
Ne
t LC
oE
imp
act
(GC
S)
Gross yield Export cable losses GCS non-availability Platform additional costs
Other costs O&M costs Export cable costs Net LCoE impact (GCS)
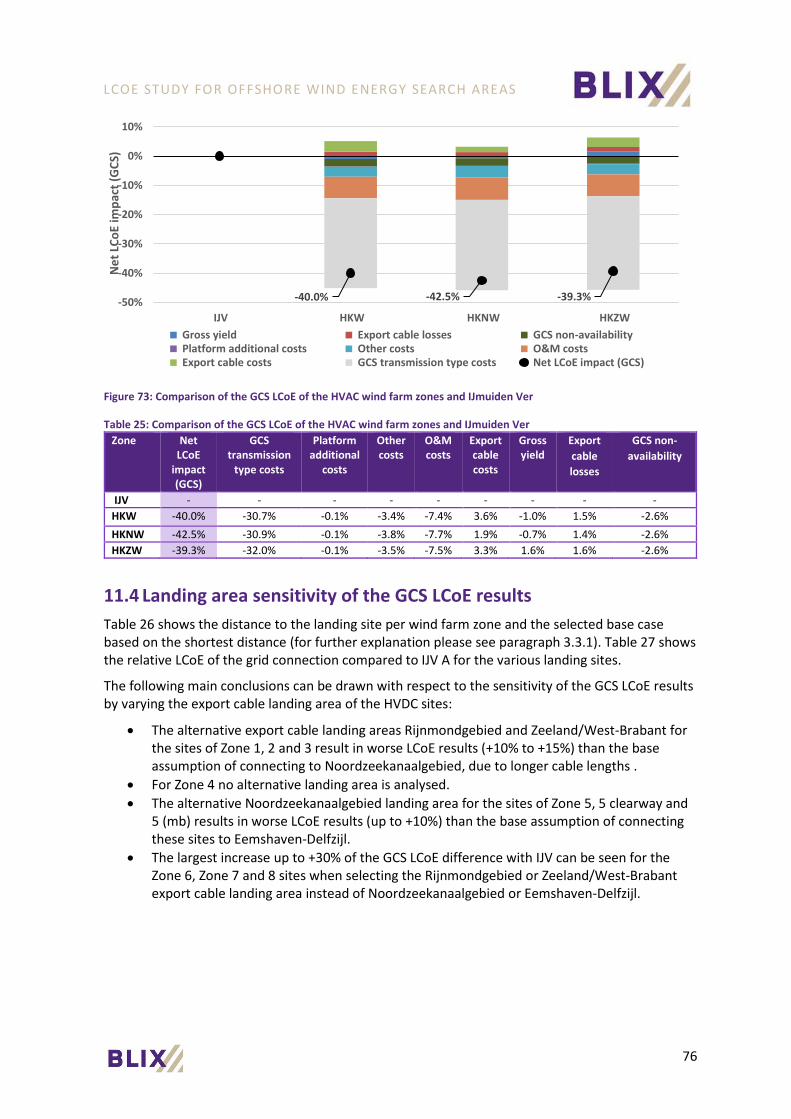
LCOE STUDY FOR OFFSHORE WIND ENERGY SEARCH AREAS
76
Figure 73: Comparison of the GCS LCoE of the HVAC wind farm zones and IJmuiden Ver
Table 25: Comparison of the GCS LCoE of the HVAC wind farm zones and IJmuiden Ver
Zone Net LCoE
impact (GCS)
GCS transmission
type costs
Platform additional
costs
Other costs
O&M costs
Export cable costs
Gross yield
Export
cable
losses
GCS non-
availability
IJV - - - - - - - - -
HKW -40.0% -30.7% -0.1% -3.4% -7.4% 3.6% -1.0% 1.5% -2.6%
HKNW -42.5% -30.9% -0.1% -3.8% -7.7% 1.9% -0.7% 1.4% -2.6%
HKZW -39.3% -32.0% -0.1% -3.5% -7.5% 3.3% 1.6% 1.6% -2.6%
11.4 Landing area sensitivity of the GCS LCoE results
Table 26 shows the distance to the landing site per wind farm zone and the selected base case based on the shortest distance (for further explanation please see paragraph 3.3.1). Table 27 shows the relative LCoE of the grid connection compared to IJV A for the various landing sites.
The following main conclusions can be drawn with respect to the sensitivity of the GCS LCoE results by varying the export cable landing area of the HVDC sites:
• The alternative export cable landing areas Rijnmondgebied and Zeeland/West-Brabant forthe sites of Zone 1, 2 and 3 result in worse LCoE results (+10% to +15%) than the baseassumption of connecting to Noordzeekanaalgebied, due to longer cable lengths .
• For Zone 4 no alternative landing area is analysed.
• The alternative Noordzeekanaalgebied landing area for the sites of Zone 5, 5 clearway and5 (mb) results in worse LCoE results (up to +10%) than the base assumption of connectingthese sites to Eemshaven-Delfzijl.
• The largest increase up to +30% of the GCS LCoE difference with IJV can be seen for theZone 6, Zone 7 and 8 sites when selecting the Rijnmondgebied or Zeeland/West-Brabantexport cable landing area instead of Noordzeekanaalgebied or Eemshaven-Delfzijl.
-40.0% -42.5% -39.3%-50%
-40%
-30%
-20%
-10%
0%
10%
IJV HKW HKNW HKZW
Ne
t LC
oE
imp
act
(GC
S)
Gross yield Export cable losses GCS non-availability Platform additional costs Other costs O&M costs Export cable costs GCS transmission type costs Net LCoE impact (GCS)

LCOE STUDY FOR OFFSHORE WIND ENERGY SEARCH AREAS
77
Figure 74: Overview of the offshore wind energy search areas (studied in Part II)
Table 26: Distances from the offshore substation of the wind farm sites to the landing areas
Site DC/AC Base Case Distances (km)
NZK RNM Z/W E-D
IJV A DC Z/W - - 165.2 -
IJV B DC RNM 103.2 119.1 154.7 -
Zone 1 A DC NZK 135.6 156.9 191.5 -
Zone 1 B DC NZK 147.3 173.8 209.2 -
Zone 1 C DC NZK 152.2 181.8 217.7 -
Zone 2 A DC NZK 113.9 148.2 186.8 -
Zone 2 B DC NZK 100.3 138.0 177.9 -
Zone 2 C DC NZK 97.8 141.4 182.1 -
Zone 3 A DC NZK 175.3 219.1 257.8 -
Zone 4 A DC E-D - - - 102.5
Zone 4 B DC E-D - - - 96.4
Zone 4 C DC E-D - - - 90.3
Zone 4 D DC E-D - - - 85.6

LCOE STUDY FOR OFFSHORE WIND ENERGY SEARCH AREAS
78
Zone 4 E DC E-D - - - 82.3
Zone 5 A DC E-D 204.2 - - 127.9
Zone 5 B DC E-D 212.5 - - 121.0
Zone 5 clearway A DC E-D 209.5 - - 129.0
Zone 5 clearway B DC E-D 213.0 - - 120.6
Zone 5 (mb) A DC E-D 203.0 - - 152.9
Zone 6 A DC E-D 195.6 247.5 287.2 182.3
Zone 6 B DC E-D 207.9 261.4 301.3 181.6
Zone 6 C DC E-D 220.8 275.9 315.8 181.7
Zone 6 D DC E-D 235.5 291.7 331.6 185.2
Zone 6 E DC E-D 253.1 310.3 350.2 191.8
Zone 7 A DC NZK 200.9 247.2 286.0 208.4
Zone 7 B DC NZK 209.5 256.6 295.3 211.1
Zone 7 C DC NZK 220.4 268.4 307.2 215.0
Zone 7 D DC NZK 232.8 281.6 320.4 220.0
Zone 8 A DC NZK 119.3 170.8 211.6 -
Table 27: Relative GCS LCoE impact of the wind farm sites compared to IJmuiden Ver A for different landing areas
Site DC/AC Relative LCoE compared to ref IJV A
Base case NZK RNM Z/W E-D
IJV A DC 0% 0%
IJV B DC -8% -15% -8% -2%
Zone 1 A DC -11% -11% -3% 2%
Zone 1 B DC -10% -10% 0% 5%
Zone 1 C DC -9% -9% 2% 7%
Zone 2 A DC -15% -15% -5% 1%
Zone 2 B DC -18% -18% -7% -1%
Zone 2 C DC -18% -18% -6% 1%
Zone 3 A DC -5% -5% 10% 14%
Zone 4 A DC -16% -16%
Zone 4 B DC -17% -17%
Zone 4 C DC -19% -19%
Zone 4 D DC -20% -20%
Zone 4 E DC -21% -21%
Zone 5 A DC -12% -2% -12%
Zone 5 B DC -14% -1% -14%
Zone 5 clearway A DC -12% -1% -12%
Zone 5 clearway B DC -14% -1% -14%
Zone 5 (mb) A DC -8% -2% -8%
Zone 6 A DC 0% -1% 16% 20% 0%
Zone 6 B DC -1% 1% 19% 23% -1%
Zone 6 C DC -2% 2% 20% 23% -2%
Zone 6 D DC -2% 4% 22% 26% -2%
Zone 6 E DC -1% 7% 26% 29% -1%
Zone 7 A DC 0% 0% 16% 20% 4%
Zone 7 B DC 1% 1% 17% 21% 4%
Zone 7 C DC 3% 3% 20% 23% 5%
Zone 7 D DC 5% 5% 22% 25% 6%
Zone 8 A DC -14% -14% 0% 6%

LCOE STUDY FOR OFFSHORE WIND ENERGY SEARCH AREAS
79
12 DISCUSSION
12.1 Limitations of current approach
The current study is based on a schematisation of reality. The wind farm layouts used in this study are not fully optimised; micro-siting has not been performed, and results from the cost model have not been used for further layout optimizations (e.g. relatively expensive wind turbine positions have not been relocated to cheaper locations or removed). The layouts are created on a rectangular grid. The wind climate, yield and wake effects and cost functions are based on simplified relations. In reality, wind farm layouts will be further optimised, detailed site investigations will be performed and dedicated designs will be made. The present approach is deemed suitable for the purpose of this study, which is to compare relative differences between zones and sites.
Two different turbine grid orientation methodologies were used for Part I and Part II and via a sensitivity analysis on IJmuiden Ver (noord) it was concluded that the impact of a southwest or south oriented grid orientation was limited. The conclusions of the other zones can be slightly different when using a different orientation of the turbine grid.
LCOE STUDY FOR OFFSHORE WIND ENERGY SEARCH AREAS
80
13 CONCLUSION
13.1 Conclusions
In this study, the Levelized Cost of Energy of a first selection of new search areas for potential wind farm zones after Roadmap 2030 is evaluated to support decisions on whether or not to further explore these search areas for possible future development of offshore wind farms and if so, if it is recommended to adjust the layouts from a cost perspective point of view. Hereto, the results for the search areas are compared to the results of zone IJmuiden Ver.
For each new search area, as well as the already designated wind farm zones IJmuiden Ver (noord), Hollandse Kust (noordwest), Hollandse Kust (zuidwest), IJmuiden Ver and Hollandse Kust (west), indicative wind farm layouts are designed. Next, the wind climate at each of the zones was assessed and used as basis for yield calculations. Costs were modelled for the offshore wind farm and the grid connection system. Finally, the overall LCoE, OWF LCoE and GCS LCoE is determined for each wind farm site individually and the impact of the main parameters is analysed.
The following main conclusions are drawn based on the results of the LCoE study:
Part I: OWF LCoE analysis of initial layouts for offshore wind energy search areas
1. The OWF LCoE varies considerably between the wind farm zones (with -0.6% to -4.6% difference compared to the reference IJmuiden Ver) and between the wind farm sites (with +1.2% to -4.5%difference compared to the reference IJmuiden Ver A).
2. The effect of yield is dominant over variations in cost, as the OWF LCoE is in general lowest for the wind farm zones with the lowest wake losses. The differences in wake effects can be explained by the size, the shape and the orientation of the wind farm zones, as the power density was kept at 10 MW/km2 for each zone.
3. All wind farm zones in the new search areas are, compared to IJmuiden Ver, attractive from a cost perspective point of view and qualify for further assessment.
4. The average gross yields are substantially higher for the wind farm zones in the northern large new search areas (Zone 5,5 (mb), 6 and 7) than for IJmuiden Ver but this is largely offset by the higher wake effects, higher foundation costs and higher WTG installation and maintenance
cost; there is however a large variation between the sites in these zones, so selecting only the
most attractive sites or allocating the sites in a more effective way (taking the impact of the
size, shape and orientation into account) will result in a lower average LCoE for these wind farm zones.
5. From the sensitivity analysis the conclusion can be drawn that for all wind farm zones a decrease in LCoE between -4%-point and -5.5%-point is to be expected with a density of 6 MW/km2¬ instead of 10 MW / km2 (except for Zone 3, which consists of only 1 site and therefore experiences limited wake losses already).
Part II: LCoE analysis (overall, OWF, GCS) of adapted search areas layouts, IJVN, HKNW and HKZW
1. All HVDC zones have a net overall LCoE (OWF + GCS) lower than the reference IJmuiden Ver,except for Zone 7 which has an overall LCoE of 2.3% higher than IJmuiden Ver due to the relativelyhigh GCS and OWF costs. From a cost point of view Zone 7 is therefore less attractive thanIJmuiden Ver and the other HVDC zones for further assessment.
2. The HVAC zones HKNW and HKZW are very attractive for further assessment, as they have a netoverall LCoE (OWF + GCS) significantly lower than the reference HVDC zone IJmuiden Ver (-16.1%and -12.7% resp.) due to the relatively low GCS costs of a HVAC GCS compared to a HVDC GCS.

LCOE STUDY FOR OFFSHORE WIND ENERGY SEARCH AREAS
81
3. All HVDC and HVAC wind farm zones have a net OWF LCoE lower than the reference zoneIJmuiden Ver, except for HKZW (+1.6%). Differences in wake losses are the dominant factor thatinfluences the LCoE of the OWF and are predominately determined by big differences inorientation of the zones (towards the prevailing wind direction), size and shape of the zones.Differences in gross yield (caused by differences in wind climate) and cost of foundation (due todepth differences) are secondary factors that influence OWF LCoE. The impact of differences inWTG Capex and Opex, IA cable costs and IA cable losses is limited.
4. The HVDC and HVAC zones that are situated relatively close to shore (Zone 1, 2, 4, 5, 5 clearway,5 (mb), 8, HKNW, HKZW) have a substantially lower net GCS LCoE than the reference IJmuidenVer, while the zones furthest away from shore are the most expensive to connect (Zone 3, 6 and7). Differences in net GCS LCoE compared to IJmuiden Ver are mainly caused by large variationsin the export cable costs and transmission type costs (HVAC only). The LCoE impact of variationsin the other costs (Surveying (incl. UXO), project management, insurance and Devex) and O&Mcosts are also considerable, while the LCoE impact of differences in the platform costs, exportcable losses and GCS non-availabilities are small.
5. The choice of export landing area has a significant impact on the GCS LCoE results. Deviatingfrom the current base assumption that the sites will be connected to the closest landing areaincreases the GCS LCoE of the sites compared to the reference IJmuiden Ver A with +10% to+30%.
13.2 Recommendations
In this study the search areas and unused parts of the existing wind farm zones were filled from the boundary closest to shore to keep the export cable costs as low as possible and therewith also the GCS and overall LCoE results. This chosen filling strategy is not optimal for the OWF LCoE of the zones. Conclusions would be slightly different with a different filling strategy, but since all zones have a lower OWF LCoE compared to the reference IJmuiden Ver (which was one of the targets when defining the layouts of the zones and sites) the overall conclusions for the OWF LCoE results will not change. In a follow-up study of optimizing the search areas without taking the GCS into account it is recommended to apply a different filling strategy, e.g. to fill from SW to NE.
The requirement of a fixed power density for all zones means that there will remain parts of the search areas and zones unused. This gives room for improvement of the LCoE, because the LCoE would be lower in case the full areas were used, as was proven by the density sensitivity of Part I. The present approach is deemed suitable for the purpose of this study, which is to compare relative differences between sites, keeping a similar density. In a follow-up study we recommend to investigate if full usage of the search areas and IJVN, HKNW, HKZW zones is possible and what the effect of the density decrease is on the LCoE results.
The wake effects are modelled using the N.O. Jensen wake model, which is the accepted industry standard for wake loss calculations. This model is known to be an oversimplified version of reality, most likely underestimating wake losses significantly. However, for the comparative purpose of this study, this is still considered to be acceptable. With decreasing wind turbine distances, an increase in turbulence is usually observed. As a rule of thumb a minimum distance of 5 times the rotor diameter is applied to avoid the most significant turbulence effects. However, Tractebel’s HKW wind resource assessment study [5], supervised by BLIX and Pondera, has recently suggested that external wake losses from neighbouring wind farms could be higher than calculated using the N.O. Jensen wake model. More research is necessary to study accumulation of wake effects due to clustering of offshore wind farms.
This study modelled the energy yield of wind farm zones in new search areas individually to allow comparison between wind farm zones and sites. The impact of neighbouring existing or planned

LCOE STUDY FOR OFFSHORE WIND ENERGY SEARCH AREAS
82
wind farms of Roadmap 2030 were included in the scope but the interaction effects between the wind farm zones in the new search areas not, nor is any effect of (planned) wind farms in bordering countries. An increase in wake losses is obvious when neighbouring wind farm zones are assigned in the new Roadmap. The interaction effects of existing offshore wind farms (such as OWEZ) and planned offshore wind farms (such as Hollandse Kust (noord)) on the wind farm zones in new search areas were included in the calculations.

LCOE STUDY FOR OFFSHORE WIND ENERGY SEARCH AREAS
83
Reference List
1. BLIX Consultancy (2018) Study into Levelized Cost of Energy of variants for wind farm siteboundaries of Hollandse Kust (west), Ten Noorden van de Waddeneilanden and IJmuidenVerhttps://www.rvo.nl/sites/default/files/2018/12/20181114_BLIX_RVO_LCOE_HKW_TNW_IJV_F.pdf
2. BLIX Consultancy (2020) Study into Levelized Cost of Energy of variants for wind farm siteboundaries of Hollandse Kust (west) (2020)In the process of being published by RVO.
3. TenneT TSO (2020) Deliverable 1.3: Synthesis of available studies on offshore meshed HVDCgrids. PROMOTioN – Progress on Meshed HVDC Offshore Transmission Networks.
4. Navigant. (2019) Connecting Offshore Wind Farms.5. Tractebel (2020) Wind Resource Assessment Hollandse Kust (west) Wind Farm Zone
(https://offshorewind.rvo.nl/file/download/55040678/03+Presentation+held+during+WRA+Webinar+on+October+8th%2C+2020)
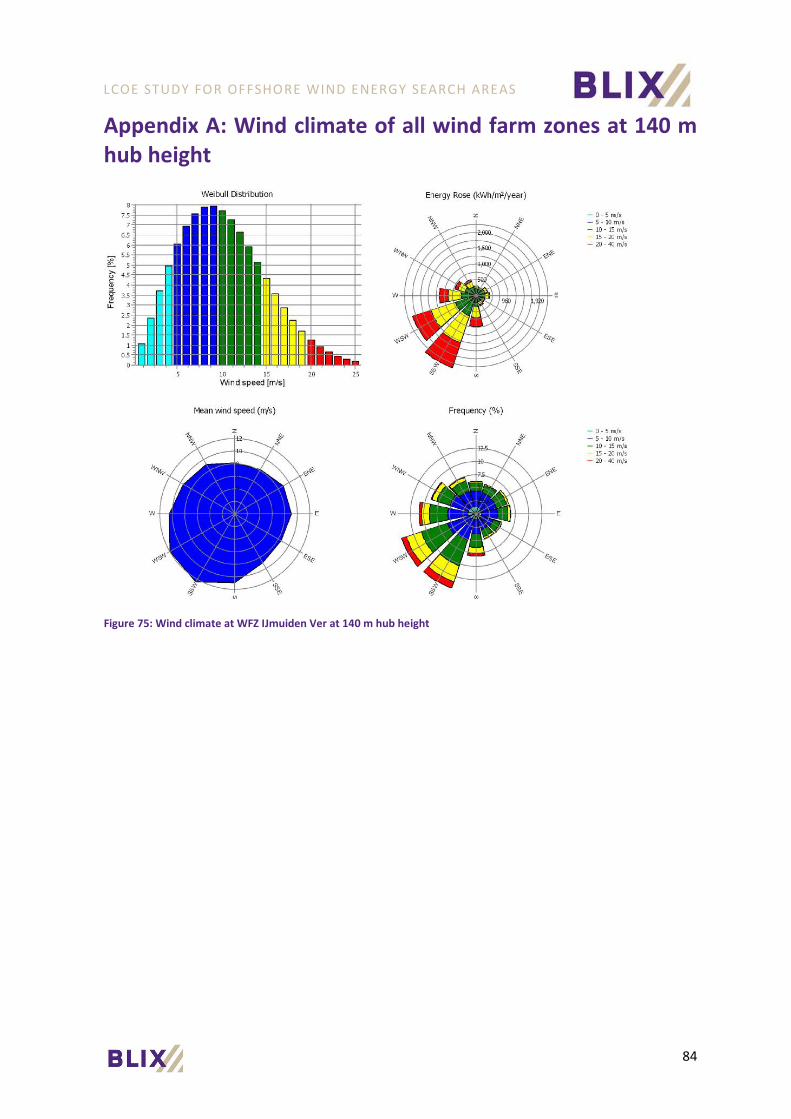
LCOE STUDY FOR OFFSHORE WIND ENERGY SEARCH AREAS
84
Appendix A: Wind climate of all wind farm zones at 140 m hub height
Figure 75: Wind climate at WFZ IJmuiden Ver at 140 m hub height

LCOE STUDY FOR OFFSHORE WIND ENERGY SEARCH AREAS
85
Figure 76: Wind climate at Zone 1 at 140 m hub height
Figure 77: Wind climate at Zone 2 at 140 m hub height
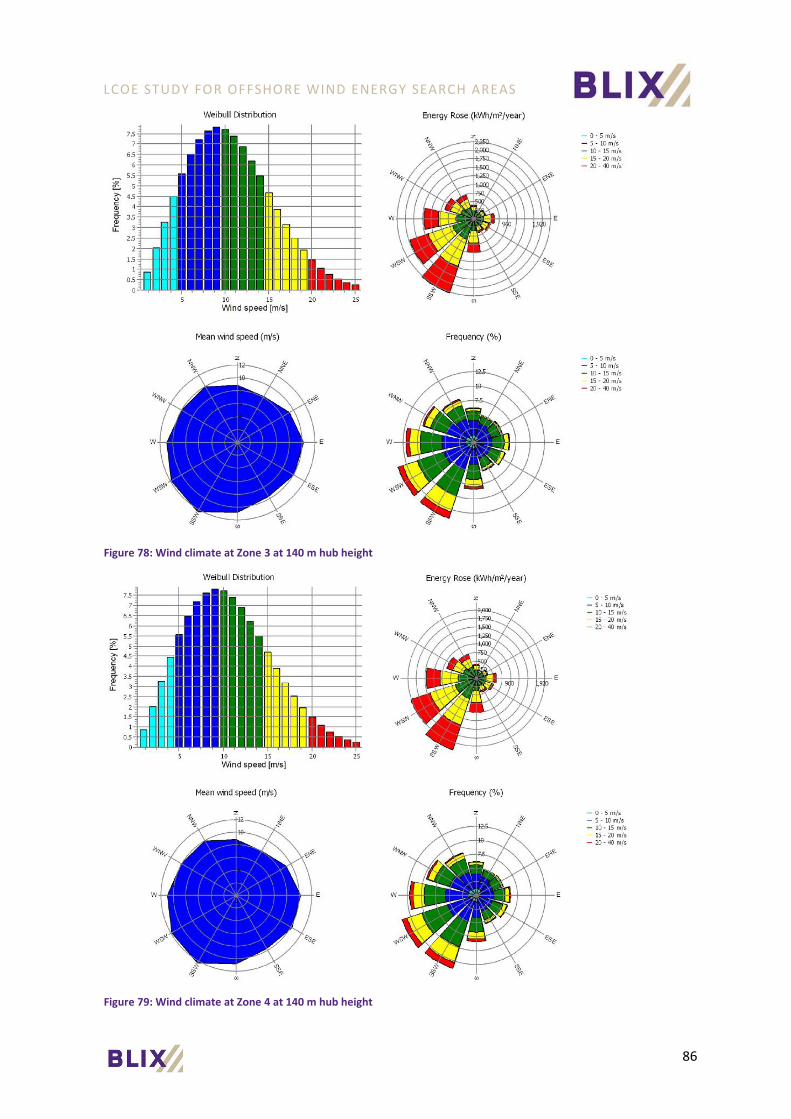
LCOE STUDY FOR OFFSHORE WIND ENERGY SEARCH AREAS
86
Figure 78: Wind climate at Zone 3 at 140 m hub height
Figure 79: Wind climate at Zone 4 at 140 m hub height

LCOE STUDY FOR OFFSHORE WIND ENERGY SEARCH AREAS
87
Figure 80: Wind climate at Zone 5 at 140 m hub height
Figure 81: Wind climate at Zone 6 at 140 m hub height

LCOE STUDY FOR OFFSHORE WIND ENERGY SEARCH AREAS
88
Figure 82: Wind climate at Zone 7 at 140 m hub height
Figure 83: Wind climate at Zone 8 at 140 m hub height

LCOE STUDY FOR OFFSHORE WIND ENERGY SEARCH AREAS
89
Figure 84: Wind climate at IJVN at 140 m hub height
Figure 85: Wind climate at HKW at 140 m hub height

LCOE STUDY FOR OFFSHORE WIND ENERGY SEARCH AREAS
90
Figure 86: Wind climate at HKNW at 140 m hub height
Figure 87: Wind climate at HKZW at 140 m hub height

LCOE STUDY FOR OFFSHORE WIND ENERGY SEARCH AREAS
91
Appendix B: LCoE comparison between sites
In this appendix the relative LCoE results of Part II are described with a comparison between sites.
Relative overall LCoE impact
HVDC sites
In Figure 88 and Table 28, the overall LCoE comparison results for the HVDC sites are shown compared to reference IJmuiden Ver A.
The following main conclusions can be drawn on wind farm site level for the HVDC sites:
• All HVDC sites have a net overall LCoE (OWF + GCS) equal to or lower than the referenceIJmuiden Ver A except for three sites of Zone 7, namely 7 B, 7 C and 7 D. These three sites haverelatively high GCS and OWF costs and low net yield compared to the other sites.
• For the zones 4, 6, and 7 there is a large difference up to 3.5% in net overall LCoE between thesites within one zone compared to IJmuiden Ver, mainly caused by differences in yield and GCScosts between the sites.
Figure 88: Comparison of the overall LCoE of the HVDC wind farm sites and IJmuiden Ver A
Table 28: Comparison of the overall LCoE of the HVDC wind farm sites and IJmuiden Ver A
Site Net LCoE impact
OWF GCS Yield
IJV A - - - -
IJV B -2.9% -0.0% -2.5% -0.4%
IJVN -4.3% -0.7% -1.1% -2.5%
Zone 1 A -8.0% -0.4% -1.7% -5.9%
Zone 1 B -5.3% -0.1% -1.5% -3.7%
Zone 1 C -4.6% 0.1% -1.3% -3.4%
Zone 2 A* -8.1% -1.0% -3.4% -3.7%
Zone 2 B* -7.7% -0.7% -4.4% -2.6%
Zone 2 C* -8.3% -0.8% -4.4% -3.2%
Zone 3 A* -5.9% 0.1% 0.8% -6.8%
Zone 4 A -7.9% -0.2% -3.0% -4.7%
Zone 4 B -5.9% 0.2% -3.9% -2.2%
-9.8%
2.1%
-12%
-10%
-8%
-6%
-4%
-2%
0%
2%
4%
6%
IJV
A
IJV
B
IJV
N
Zon
e 1
A
Zon
e 1
B
Zon
e 1
C
Zo
ne
2 A
*
Zo
ne
2 B
*
Zo
ne
2 C
*
Zo
ne
3 A
*
Zo
ne
4 A
Zo
ne
4 B
Zo
ne
4 C
Zo
ne
4 D
Zo
ne
4 E
Zo
ne
5 A
Zo
ne
5 B
Zo
ne
5 c
w A
Zo
ne
5 c
w B
Zo
ne
5(m
b)
A
Zo
ne
6 A
Zo
ne
6 B
Zo
ne
6 C
Zo
ne
6 D
Zo
ne
6 E
Zo
ne
7 A
Zo
ne
7 B
Zo
ne
7 C
Zo
ne
7 D
Zo
ne
8 A
OWF GCS Yield Total
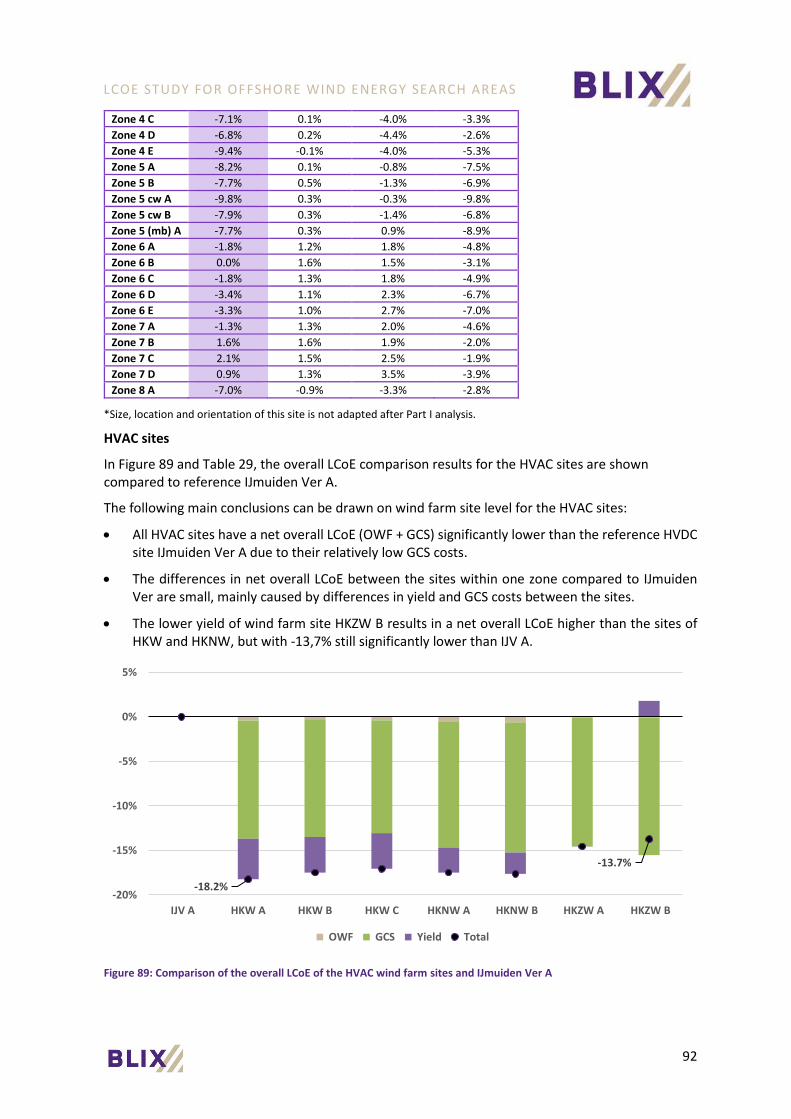
LCOE STUDY FOR OFFSHORE WIND ENERGY SEARCH AREAS
92
Zone 4 C -7.1% 0.1% -4.0% -3.3%
Zone 4 D -6.8% 0.2% -4.4% -2.6%
Zone 4 E -9.4% -0.1% -4.0% -5.3%
Zone 5 A -8.2% 0.1% -0.8% -7.5%
Zone 5 B -7.7% 0.5% -1.3% -6.9%
Zone 5 cw A -9.8% 0.3% -0.3% -9.8%
Zone 5 cw B -7.9% 0.3% -1.4% -6.8%
Zone 5 (mb) A -7.7% 0.3% 0.9% -8.9%
Zone 6 A -1.8% 1.2% 1.8% -4.8%
Zone 6 B 0.0% 1.6% 1.5% -3.1%
Zone 6 C -1.8% 1.3% 1.8% -4.9%
Zone 6 D -3.4% 1.1% 2.3% -6.7%
Zone 6 E -3.3% 1.0% 2.7% -7.0%
Zone 7 A -1.3% 1.3% 2.0% -4.6%
Zone 7 B 1.6% 1.6% 1.9% -2.0%
Zone 7 C 2.1% 1.5% 2.5% -1.9%
Zone 7 D 0.9% 1.3% 3.5% -3.9%
Zone 8 A -7.0% -0.9% -3.3% -2.8%
*Size, location and orientation of this site is not adapted after Part I analysis.
HVAC sites
In Figure 89 and Table 29, the overall LCoE comparison results for the HVAC sites are shown compared to reference IJmuiden Ver A.
The following main conclusions can be drawn on wind farm site level for the HVAC sites:
• All HVAC sites have a net overall LCoE (OWF + GCS) significantly lower than the reference HVDCsite IJmuiden Ver A due to their relatively low GCS costs.
• The differences in net overall LCoE between the sites within one zone compared to IJmuidenVer are small, mainly caused by differences in yield and GCS costs between the sites.
• The lower yield of wind farm site HKZW B results in a net overall LCoE higher than the sites ofHKW and HKNW, but with -13,7% still significantly lower than IJV A.
Figure 89: Comparison of the overall LCoE of the HVAC wind farm sites and IJmuiden Ver A
-18.2%
-13.7%
-20%
-15%
-10%
-5%
0%
5%
IJV A HKW A HKW B HKW C HKNW A HKNW B HKZW A HKZW B
OWF GCS Yield Total

LCOE STUDY FOR OFFSHORE WIND ENERGY SEARCH AREAS
93
Table 29: Comparison of the overall LCoE of the HVAC wind farm sites and IJmuiden Ver A
Site Net LCOE impact
OWF GCS Yield
IJV A - - - -
HKW A -18.2% -0.4% -13.3% -4.5%
HKW B -17.5% -0.3% -13.2% -4.0%
HKW C -17.1% -0.4% -12.7% -4.0%
HKNW A -17.5% -0.5% -14.2% -2.8%
HKNW B -17.6% -0.6% -14.6% -2.4%
HKZW A -14.5% -0.1% -14.4% -0.0%
HKZW B -13.7% -0.1% -15.4% 1.8%
Relative LCoE impact of the Offshore Wind Farm (OWF)
HVDC sites
In Figure 90 and Table 30 the OWF LCoE comparison results of the HVDC sites are shown compared to reference IJmuiden Ver A.
The following main conclusions can be drawn on wind farm site level for the HVDC sites:
• All HVDC sites in the new search areas have a net OWF LCoE equal to or lower than the referenceIJmuiden Ver A except for the three sites Zone 4 B, Zone 7 B and Zone 7 C. In all three of thesesites the wake losses are higher than at WFZ IJV.
• At zone 6 there is a large difference up to 4.0% in net OWF LCoE between the sites compared toIJmuiden Ver, mainly caused by differences in gross yield and wake losses between the sites.
Figure 90: Comparison of the OWF LCoE of the HVDC wind farm sites and IJmuiden Ver A
Table 30: Comparison of the OWF LCoE of the HVDC wind farm sites and IJmuiden Ver A
Site Net LCoE impact (OWF)
Cable costs
Foundation costs
WTG Capex
WTG Opex
Gross yield
Wake
losses
Cable
losses
IJV A - - - - - - -0.0% -
IJV B 0.3% -0.0% 0.1% - - 0.5% -0.3% -0.0%
IJVN -2.6% -0.1% -0.1% -0.0% -0.2% -0.9% -1.2% -0.1%
Zone 1 A -4.2% 0.3% 0.1% 0.1% 0.4% -1.9% -3.3% 0.1%
Zone 1 B -2.3% 0.3% 0.0% 0.1% 0.4% -2.3% -0.9% 0.1%
Zone 1 C -1.9% 0.2% 0.2% 0.2% 0.5% -2.5% -0.5% 0.0%
Zone 2 A* -3.1% -0.0% -0.3% -0.0% -0.2% -1.6% -1.0% -0.0%
-6.0%
0.4%
-10%
-8%
-6%
-4%
-2%
0%
2%
4%
6%
IJV
A
IJV
B
IJV
N
Zon
e 1
A
Zon
e 1
B
Zon
e 1
C
Zo
ne
2 A
*
Zo
ne
2 B
*
Zo
ne
2 C
*
Zo
ne
3 A
*
Zo
ne
4 A
Zo
ne
4 B
Zo
ne
4 C
Zo
ne
4 D
Zo
ne
4 E
Zo
ne
5 A
Zo
ne
5 B
Zo
ne
5 c
w A
Zo
ne
5 c
w B
Zo
ne
5(m
b)
A
Zo
ne
6 A
Zo
ne
6 B
Zo
ne
6 C
Zo
ne
6 D
Zo
ne
6 E
Zo
ne
7 A
Zo
ne
7 B
Zo
ne
7 C
Zo
ne
7 D
Zo
ne
8 A
Gross yield Wake losses Cable losses Cable costs
Foundation costs WTG Capex WTG Opex Net LCoE impact (OWF)

LCOE STUDY FOR OFFSHORE WIND ENERGY SEARCH AREAS
94
Zone 2 B* -1.7% 0.0% -0.2% -0.0% -0.2% -1.5% 0.2% -0.0%
Zone 2 C* -2.2% 0.1% -0.1% -0.1% -0.4% -1.2% -0.6% 0.0%
Zone 3 A* -4.8% 0.2% 1.2% 0.1% 0.5% -3.4% -3.4% 0.0%
Zone 4 A -2.6% 0.0% 0.4% 0.1% 0.4% -2.8% -0.7% -0.0%
Zone 4 B 0.1% 0.1% 0.3% 0.1% 0.4% -3.0% 2.2% 0.0%
Zone 4 C -0.8% 0.1% 0.4% 0.1% 0.5% -3.5% 1.6% 0.0%
Zone 4 D -0.1% 0.0% 0.4% 0.1% 0.5% -3.7% 2.6% -0.0%
Zone 4 E -2.5% 0.2% 0.5% 0.2% 0.5% -4.0% 0.2% 0.0%
Zone 5 A -4.6% -0.0% 1.5% 0.2% 0.5% -4.5% -2.2% -0.1%
Zone 5 B -3.4% 0.3% 1.5% 0.3% 0.5% -5.2% -0.9% 0.1%
Zone 5 cw A -6.0% 0.5% 1.7% 0.3% 0.5% -4.8% -4.3% 0.1%
Zone 5 cw B -3.7% -0.1% 1.5% 0.3% 0.5% -5.2% -0.7% -0.1%
Zone 5 (mb) A -5.7% 0.2% 2.0% 0.2% 0.5% -4.9% -3.7% 0.0%
Zone 6 A -1.9% -0.1% 2.5% 0.2% 0.5% -3.5% -1.4% -0.1%
Zone 6 B -0.0% -0.0% 2.6% 0.2% 0.5% -3.5% 0.4% -0.0%
Zone 6 C -1.8% -0.1% 2.5% 0.3% 0.5% -4.9% -0.1% -0.1%
Zone 6 D -3.5% 0.2% 2.4% 0.4% 0.5% -5.3% -1.6% 0.0%
Zone 6 E -4.0% 0.0% 2.4% 0.4% 0.5% -5.4% -1.9% -0.0%
Zone 7 A -1.8% 0.2% 2.4% 0.2% 0.5% -3.5% -1.5% 0.0%
Zone 7 B 0.4% -0.0% 2.2% 0.3% 0.5% -4.0% 1.8% -0.0%
Zone 7 C 0.1% -0.1% 2.1% 0.3% 0.5% -4.1% 1.8% -0.1%
Zone 7 D -1.9% -0.1% 2.2% 0.4% 0.5% -4.5% 0.2% -0.1%
Zone 8 A -2.4% -0.2% -0.2% -0.0% -0.2% -1.3% -0.4% -0.1%
*Size, location and orientation of this site is not adapted after Part I analysis.
HVAC sites
In Figure 91 and Table 31 the OWF LCoE comparison results of the HVAC sites are shown compared to reference IJmuiden Ver A.
The following main conclusions can be drawn on wind farm site level for the HVAC sites:
• The OWF LCoE of the HVAC sites of HKNW are -1.2 to -1.5% lower than the reference HVDC siteIJmuiden Ver A, while the sites of HKZW are +1.0% to +2.4% higher than IJV.
• The largest mutual differences between the sites can be seen in gross yield and wake losses.
Figure 91: Comparison of the OWF LCoE of the HVAC wind farm sites and IJmuiden Ver A
-2.7%
2.4%
-10%
-5%
0%
5%
10%
IJV A HKW A HKW B HKW C HKNW A HKNW B HKZW A HKZW B Gross yield Wake losses Cable losses Cable costs Foundation costs WTG Capex WTG Opex Wind farm size costs Net LCoE impact (OWF)

LCOE STUDY FOR OFFSHORE WIND ENERGY SEARCH AREAS
95
Table 31: Comparison of the OWF LCoE of the HVAC wind farm sites and IJmuiden Ver A
Site Net LCoE impact (OWF)
Cable costs
Foundation costs
WTG Capex
WTG Opex
Wind farm size
costs
Gross yield
Wake
losses
Cable
losses
IJV A - - - - - - - - -
HKW A -2.7% 1.0% -0.2% -0.0% -0.3% 3.5% -0.6% -6.2% 0.1%
HKW B -2.1% 0.8% -0.1% - -0.1% 3.5% -0.8% -5.4% -0.0%
HKW C -2.4% 0.6% -0.1% - -0.1% 3.5% -0.7% -5.6% -0.1%
HKNW A -1.5% 0.7% -0.2% -0.1% -0.4% 3.4% -0.5% -4.2% -0.1%
HKNW B -1.2% 0.5% -0.3% -0.1% -0.4% 3.4% -0.4% -3.9% -0.1%
HKZW A 1.0% 0.8% -0.4% -0.1% -0.4% 3.3% 1.3% -3.4% -0.1%
HKZW B 2.4% 0.4% -0.5% -0.1% -0.4% 3.3% 2.3% -2.4% -0.2%
Relative LCoE impact of the Grid Connection System (GCS)
HVDC sites
In Figure 92 and Table 32 the GCS LCoE comparison results of the HVDC sites are shown compared to reference IJmuiden Ver A.
The following main conclusion can be drawn on wind farm site level for the HVDC sites:
• All HVDC sites have a net OWF LCoE lower than the reference IJmuiden Ver A except for all foursites of Zone 7. These sites are located further offshore and therefore have significantly higherexport cable costs compared to the other sites.
Figure 92: Comparison of the GCS LCoE of the HVDC wind farm sites and IJmuiden Ver A
Table 32: Comparison of the GCS LCoE of the HVDC wind farm sites and IJmuiden Ver A
Site Net LCoE impact (GCS)
Platform costs
Other costs
O&M costs
Export cable costs
Gross yield
Export
cable
losses
GCS non-
availability
IJV A - - - - - - - -
IJV B -8.1% 0.0% -2.7% -0.8% -4.6% 0.5% -0.1% -0.5%
IJVN -6.0% -0.0% -2.2% -0.4% -2.2% -0.9% -0.1% -0.2%
Zone 1 A -11.4% 0.0% -2.8% -0.9% -5.1% -1.9% -0.2% -0.5%
Zone 1 B -9.6% -0.0% -2.5% -0.7% -3.6% -2.3% -0.1% -0.4%
Zone 1 C -8.9% 0.0% -2.4% -0.6% -3.0% -2.5% -0.1% -0.3%
Zone 2 A* -15.3% -0.1% -3.4% -1.5% -7.7% -1.6% -0.2% -0.8%
Zone 2 B* -17.7% -0.1% -3.8% -1.8% -9.3% -1.5% -0.3% -1.0%
Zone 2 C* -17.9% 0.0% -3.9% -1.8% -9.7% -1.2% -0.3% -1.0%
-20.7%
5.0%
-25%
-20%
-15%
-10%
-5%
0%
5%
10%
15%
IJV
A
IJV
B
IJV
N
Zon
e 1
A
Zon
e 1
B
Zon
e 1
C
Zo
ne
2 A
*
Zo
ne
2 B
*
Zo
ne
2 C
*
Zo
ne
3 A
*
Zo
ne
4 A
Zo
ne
4 B
Zo
ne
4 C
Zo
ne
4 D
Zo
ne
4 E
Zo
ne
5 A
Zo
ne
5 B
Zo
ne
5 c
w A
Zo
ne
5 c
w B
Zo
ne
5(m
b)
A
Zo
ne
6 A
Zo
ne
6 B
Zo
ne
6 C
Zo
ne
6 D
Zo
ne
6 E
Zo
ne
7 A
Zo
ne
7 B
Zo
ne
7 C
Zo
ne
7 D
Zo
ne
8 A
Ne
t LC
oE
imp
act
(GC
S)
Gross yield Export cable losses GCS non-availability Platform additional costs Other costs O&M costs Export cable costs Net LCoE impact (GCS)

LCOE STUDY FOR OFFSHORE WIND ENERGY SEARCH AREAS
96
Zone 3 A* -4.9% 0.4% -1.7% 0.0% -0.2% -3.4% -0.0% -0.0%
Zone 4 A -15.9% 0.1% -2.0% -1.6% -8.5% -2.8% -0.3% -0.9%
Zone 4 B -17.3% 0.1% -2.2% -1.8% -9.2% -3.0% -0.3% -1.0%
Zone 4 C -18.8% 0.1% -2.3% -1.9% -9.8% -3.5% -0.3% -1.1%
Zone 4 D -19.9% 0.1% -2.5% -2.0% -10.4% -3.7% -0.3% -1.1%
Zone 4 E -20.7% 0.1% -2.6% -2.1% -10.7% -4.0% -0.3% -1.2%
Zone 5 A -12.2% 0.5% -1.2% -0.9% -5.3% -4.5% -0.2% -0.6%
Zone 5 B -14.2% 0.4% -1.4% -1.1% -6.0% -5.2% -0.2% -0.7%
Zone 5 cw A -12.3% 0.5% -1.2% -0.9% -5.1% -4.8% -0.2% -0.6%
Zone 5 cw B -14.3% 0.4% -1.4% -1.1% -6.1% -5.2% -0.2% -0.7%
Zone 5 (mb) A -7.7% 0.6% -0.5% -0.3% -2.3% -4.9% -0.1% -0.3%
Zone 6 A -0.5% 0.8% 0.4% 0.4% 1.3% -3.5% 0.0% 0.1%
Zone 6 B -0.6% 0.9% 0.4% 0.4% 1.2% -3.5% 0.0% 0.1%
Zone 6 C -2.1% 0.8% 0.4% 0.4% 1.2% -4.9% 0.0% 0.1%
Zone 6 D -1.9% 0.7% 0.5% 0.4% 1.6% -5.3% 0.0% 0.2%
Zone 6 E -0.8% 0.7% 0.7% 0.6% 2.4% -5.4% 0.0% 0.3%
Zone 7 A 0.3% 0.8% -0.9% 0.7% 2.9% -3.5% 0.1% 0.3%
Zone 7 B 1.2% 0.7% -0.7% 0.9% 3.9% -4.0% 0.1% 0.4%
Zone 7 C 3.1% 0.6% -0.4% 1.1% 5.2% -4.1% 0.1% 0.6%
Zone 7 D 5.0% 0.6% -0.1% 1.4% 6.6% -4.5% 0.2% 0.7%
Zone 8 A -14.0% -0.1% -3.3% -1.3% -7.1% -1.3% -0.2% -0.7%
*Size, location and orientation of this site is not adapted after Part I analysis.
HVAC sites
In Figure 93 and Table 33 the GCS LCoE comparison results of the HVAC sites are shown compared to reference IJmuiden Ver A.
The following main conclusions can be drawn on wind farm site level for the HVAC sites:
• The HVAC sites of HKNW, HKZW and HKW have substantially lower net GCS LCoE thanreference IJV due to the significantly lower "transmission type costs" which represent thedifference in costs between HVAC and HVDC systems (see also paragraph 3.3).
Figure 93: Comparison of the GCS LCoE of the HVAC wind farm sites and IJmuiden Ver A
-42.6%-47.1%
-60%
-50%
-40%
-30%
-20%
-10%
0%
10%
IJV A HKW A HKW B HKW C HKNW A HKNW B HKZW A HKZW B
Ne
t LC
oE
imp
act
(GC
S)
Gross yield Export cable losses GCS non-availability Platform additional costs Other costs O&M costs Export cable costs GCS transmission type costs Net LCoE impact (GCS)
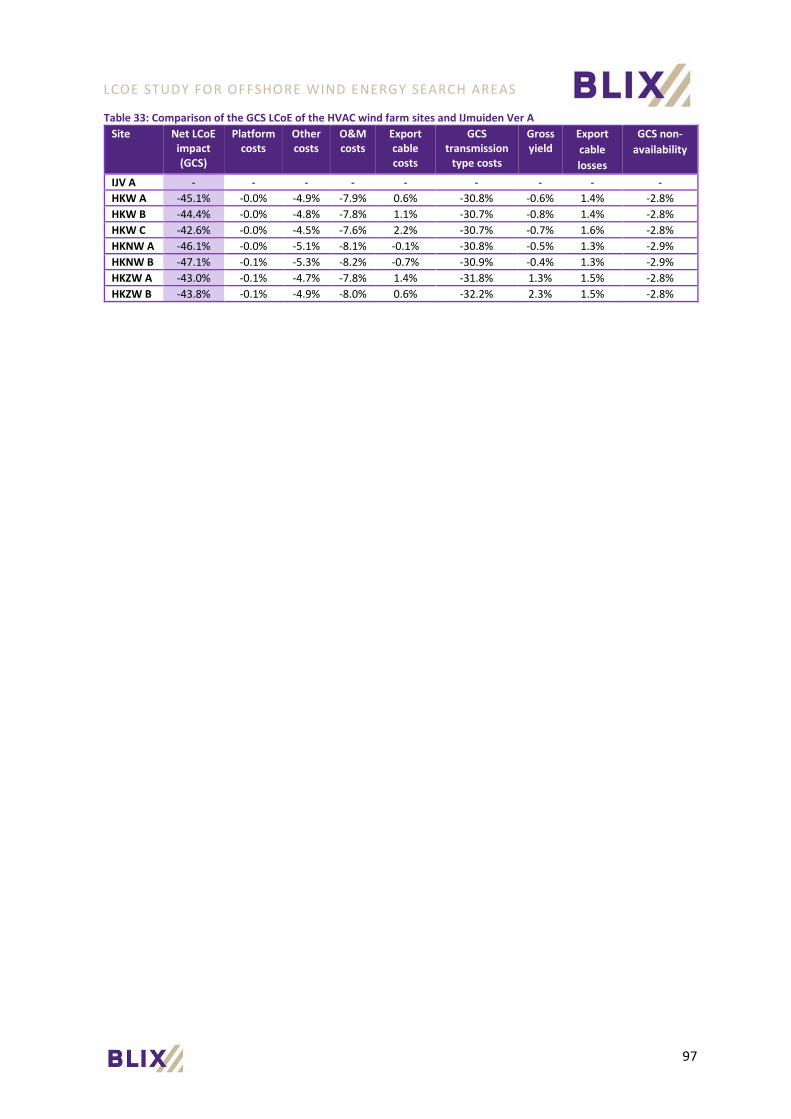
LCOE STUDY FOR OFFSHORE WIND ENERGY SEARCH AREAS
97
Table 33: Comparison of the GCS LCoE of the HVAC wind farm sites and IJmuiden Ver A
Site Net LCoE impact (GCS)
Platform costs
Other costs
O&M costs
Export cable costs
GCS transmission
type costs
Gross yield
Export
cable
losses
GCS non-
availability
IJV A - - - - - - - - -
HKW A -45.1% -0.0% -4.9% -7.9% 0.6% -30.8% -0.6% 1.4% -2.8%
HKW B -44.4% -0.0% -4.8% -7.8% 1.1% -30.7% -0.8% 1.4% -2.8%
HKW C -42.6% -0.0% -4.5% -7.6% 2.2% -30.7% -0.7% 1.6% -2.8%
HKNW A -46.1% -0.0% -5.1% -8.1% -0.1% -30.8% -0.5% 1.3% -2.9%
HKNW B -47.1% -0.1% -5.3% -8.2% -0.7% -30.9% -0.4% 1.3% -2.9%
HKZW A -43.0% -0.1% -4.7% -7.8% 1.4% -31.8% 1.3% 1.5% -2.8%
HKZW B -43.8% -0.1% -4.9% -8.0% 0.6% -32.2% 2.3% 1.5% -2.8%