determination of the probability of failure (pof) in a ... · g. dobmann, et al./determination of...
TRANSCRIPT

20 ISSN-1883-9894/10 © 2010 – JSM and the authors. All rights reserved.
E-Journal of Advanced Maintenance Vol.7-1 (2015) 20-33 Japan Society of Maintenology
Determination of the Probability of Failure (POF) in a Sensitivity Study Based on a Probabilistic FAD-Approach and POD-Curves Using PAUT
Gerd DOBMANN1,*, Jochen H. KURZ2, and Sergey PUDOVIKOV2
1 Scheidter Str. 23A, 66125 Saarbrücken, Germany 2 Fraunhofer-IZFP, Campus E 3 1, 66123 Saarbrücken, Germany
ABSTRACT The application of the software PVrisk is discussed which was compiled in 2008 to solve probabilistic fracture mechanical problems in case of pressure vessels and pipes by utilizing approaches based on the Failure Assessment Diagram (FAD). The probabilistic feature is embedded due to Monte Carlo simulation (MCS). Compared to other tools available the advantage of PVrisk is to take the combination of fracture mechanics and NDT results based on Probability of Detection (POD) data into account. This data can be the result of an experimental POD trial or the result of computed POD-curves due to numerical modeling of the inspection process. This paper uses POD curves by evaluating experimental data obtained in a project in the German nuclear safety research program. The NDT task was the inspection of welds in austenitic stainless steel plates by using ultrasonic testing (UT) and the application of phased array transducers (PAUT – Phased Array UT) as inspection technique. Taking into account a realistic statistical population of half-elliptical, axial oriented, subsurface and surface breaking cracks in a larger diameter austenitic pipe as well as the material properties such as elastic limit Rp0.2, tensile strength Rm, and fracture toughness KIC numerical statistical modeling is used to calculate the probability of failure (POF). The advantage of using NDT with optimized POD is documented.
*Corresponding author, E-mail: [email protected]
KEYWORDS Probability of failure, POF, probability of detection, POD, austenitic welds, crack-like defects, failure assessment diagram, FAD, ultrasonic testing, PAUT
ARTICLE INFORMATION Article history: Received 10 November 2014 Accepted 1 February 2015
1. Introduction The so-called «basic safety concept» [1], which is applied to design and construction of
components of German nuclear power plants, is the combination of deterministically defined material properties and optimized component geometry selection defined in the design rules taking into account fracture mechanical as well as fatigue mechanical principles. NDT in this «house of quality» is a decisive part of quality management during manufacturing (shop-testing, pre-service-inspection), commissioning (1st automated base-line-inspection) and service (inservice-inspection, ISI) and lifetime management. Concerning surface-breaking cracks, no indication larger than 1mm in length (MT or PT) is acceptable during construction and commissioning. However, this cannot hold for inner defects depending on the given detectability of UT and RT. German atomic law requires for NDT applications according to the actual, always optimized state of the art in R&D. Therefore, today, indications are detected which can be traced-back to be manufacturing defects, not detected in the time when the component – years ago - was constructed and started its life. Furthermore, there is degradation due to fatigue and corrosion, i.e. fatigue crack initiation and propagation, stress corrosion cracking and the synergy by the superposition of both. The phenomena are to be observed at the surfaces where the mechanical stresses principally are tangential and corrosion can initiate grow. Detection and sizing of surface-breaking cracks is therefore an important task in ISI. Due to their safety relevance, primary circuit components are here of special interest. However, also vessels and pipelines and pumps outside of the containment are to maintain and therefore to inspect within the lifetime management strategy. The paper presented here is organized in three parts: At first the experimental POD-trial is described performed at well-defined test pieces in order to calculate

G. Dobmann, et al./ Determination of the Probability of Failure (POF) in a Sensitivity Study Based on a Probabilistic FAD-Approach
and POD-Curves Using PAUT
21
POD-curves. Secondly the new developed Sampling Phased Array technique is introduced to characterize its advantages compared to other techniques. The forth chapter deals with deterministic and probabilistic POD considerations based on results of chapter 2 and the use of the technique of chapter 3 before conclusions are summarized.
2. The POD-Trial
Fraunhofer-IZFP together with its partner the Materials Testing Institute at the Technical
University of Stuttgart (MPA) has performed a project within the German Nuclear Reactor Safety Program of the Federal Ministry of Economy and Technology [2] with the objective to «integrate results of NDT into fracture mechanical failure analysis procedures». The role of the MPA in the project was on one hand to supply test pieces for the NDT-task and on the other hand to organize and control the blind test with 3 different inspection teams acting independently. Fraunhofer-IZFP was responsible to evaluate the data in terms of the estimation of the probability of detection (POD) by calculation. Furthermore, IZFP has also introduced a new NDT inspection technique which is called «Sampling Phased Array» (SPA, see chapter 3 in detail) [3] which was in the project compared with PAUT according to the given state of the art (standard PA (STD-PA)). In Germany, type and extent of NDT are specified in Safety Standards of the Nuclear Safety Standards Commission (KTA) [1]. Only certified inspections are allowed in nuclear industrial applications. The qualification of NDT is carried out in form of performance demonstrations of the inspection teams and the equipment (hard and software + data evaluation), witnessed by an authorized inspector. The results of these tests are mainly statements regarding the detection capabilities of certain artificial flaws. In other countries, e.g. the U.S., additional blind tests on test blocks with hidden and unknown flaws may be required, in which a certain percentage of these flaws principally has to be detected in order to be accepted as a certified team. The determination of the probability of detection (POD) [4, 6] is one possibility to quantify the probability to detect a specific flaw with a NDT method. 2.1. Material and Test Pieces Within the scope of the research project, the Material Testing Institute (MPA) at the University of Stuttgart was responsible for manufacturing and supplying suitable test specimens for the ultrasonic investigations which are the basis for the calculation of the POD curves. The MPA holds a wide variety of test specimens and has broad experience with the creation of test specimen with realistic flaws. In addition to the already existing test specimens, several new test specimens were manufactured in frame of this project. The selection of suitable test specimens is essential, because the flaws should be as realistic as possible and not limited to only artificial flaws. Therefore mainly test specimens with realistic flaws were chosen for the inspections. The test specimens are listed in table 1.
Table 1. Test specimens for the ultrasonic investigations
Number of test specimen
Total number of flaws
Realistic flaws artificial flaws
Austenitic test specimen 29 43 24 19
Ferritic test specimen 2 5 5 -
Dissimilar welds 1 15 2 13 Cladded specimen 4 > 65 > 59 6 Total 36 > 128 > 90 38
Altogether, there are more than 128 flaws in the test specimens; more than 90 are realistic flaws. The number of flaws therefore is sufficient for the POD estimation. In the contribution
G. Dobmann, et al./ Determination of the Probability of Failure (POF) in a Sensitivity Study Based on a Probabilistic FAD-Approach
and POD-Curves Using PAUT
22
discussed here we concentrate on the special discussion of those results only, which were obtained for the austenitic weldments. The reader, interested in the overall results, is asked for to study the original literature published in more detail in [2].
The austenitic test pieces (X6 CrNiNb 18 10) were bar-shaped plates with a thickness of 32 mm, and contain different types of welds (different weld geometry). Most of the flaws are realistic flaws induced by inter-granular stress corrosion cracking or fatigue cracking [7]. As reference investigations besides destructive tests, X-ray inspection based on film evaluation, and X-ray tomography were applied parallel to the performed UT approaches. Surface-breaking indications were visualized by MT and PT. The emphasis of the work was on evaluating the potential of PAUT because this type of UT-NDT is nowadays the most applied NDT technique at austenitic weldments.
2.2. POD Calculation
In principle, two related approaches to a probabilistic framework for the inspection of
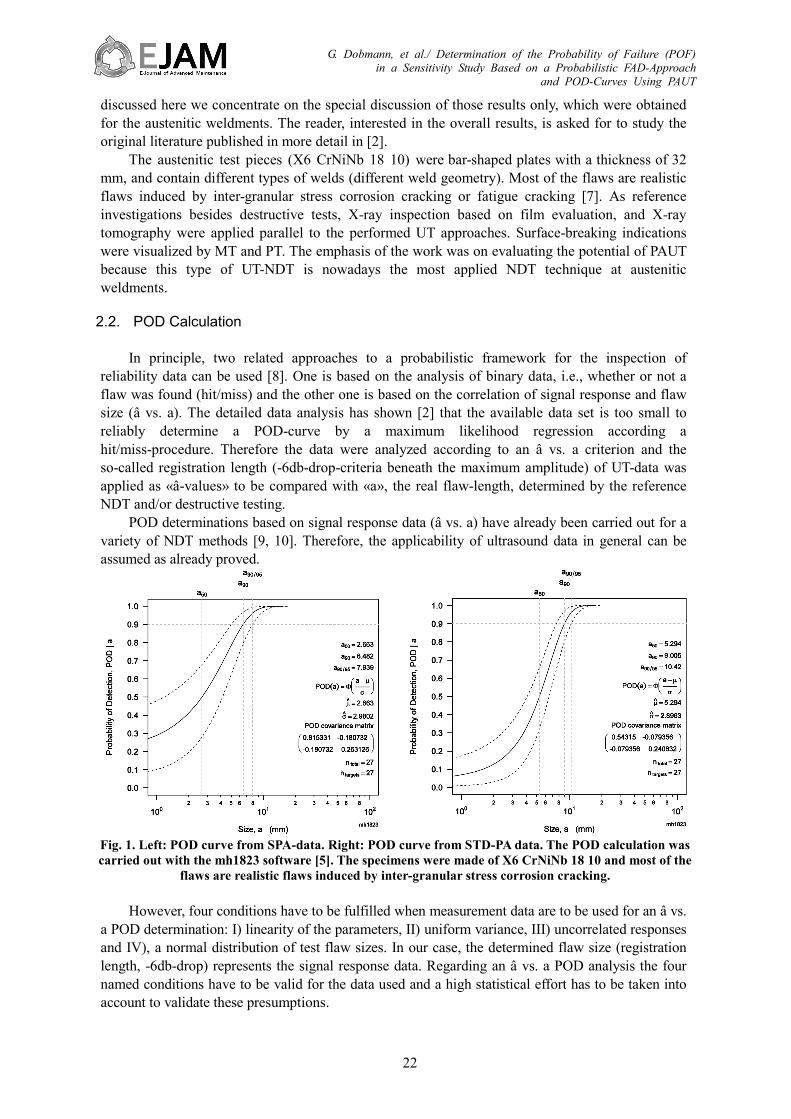
reliability data can be used [8]. One is based on the analysis of binary data, i.e., whether or not a flaw was found (hit/miss) and the other one is based on the correlation of signal response and flaw size (â vs. a). The detailed data analysis has shown [2] that the available data set is too small to reliably determine a POD-curve by a maximum likelihood regression according a hit/miss-procedure. Therefore the data were analyzed according to an â vs. a criterion and the so-called registration length (-6db-drop-criteria beneath the maximum amplitude) of UT-data was applied as «â-values» to be compared with «a», the real flaw-length, determined by the reference NDT and/or destructive testing.
POD determinations based on signal response data (â vs. a) have already been carried out for a variety of NDT methods [9, 10]. Therefore, the applicability of ultrasound data in general can be assumed as already proved.
Fig. 1. Left: POD curve from SPA-data. Right: POD curve from STD-PA data. The POD calculation was carried out with the mh1823 software [5]. The specimens were made of X6 CrNiNb 18 10 and most of the
flaws are realistic flaws induced by inter-granular stress corrosion cracking. However, four conditions have to be fulfilled when measurement data are to be used for an â vs.
a POD determination: I) linearity of the parameters, II) uniform variance, III) uncorrelated responses and IV), a normal distribution of test flaw sizes. In our case, the determined flaw size (registration length, -6db-drop) represents the signal response data. Regarding an â vs. a POD analysis the four named conditions have to be valid for the data used and a high statistical effort has to be taken into account to validate these presumptions.

G. Dobmann, et al./ Determination of the Probability of Failure (POF) in a Sensitivity Study Based on a Probabilistic FAD-Approach
and POD-Curves Using PAUT
23
A critical point in the POD analysis of signal response data is the definition of the decision-threshold [4, 11]. In an amplitude analysis, the existing noise can be considered for selecting the decision-threshold. Normally a 6db S/N-ratio is asked for in most of the inspecting specifications. This criterion cannot be applied if the registration length is discussed.
According to the approach of [11], a threshold criterion was chosen which considers noise and the false positive detections (a flaw detection is indicated, but there is no flaw, false alarm) in an indirect manner. The difference between true flaw size and determined flaw size was taken and in their individual distributions (SPA and STD-PA) the standard deviation was calculated [2]. The calculated standard deviations for the two distributions are 3.2 mm in case of the SPA data and 2.5 mm in case of the STD-PA-approach. These values were taken as decision thresholds for the POD analysis. The POD curves calculated with these two decision thresholds are shown in Fig. 1. The dotted lines represent the 95 % confidence bounds. The concept of POD determination is based on a Log-Normal distribution model. Therefore, a continuous curve is received including very small flaw sizes. The decision threshold is of importance for distinguishing between signal and noise. The resulting POD curve gives the probability that even for small cracks detection with a very small probability is possible.
The accuracy in flaw sizing of the SPA technique is better compared to the results gained with the STD-PA inspections. However, the STD-PA results lead to narrower confidence bounds. The a90/95 value of 10.4 mm is significantly higher than the 7.9 mm of the SPA POD. The a50 value, indicating the 50 % POD represents the 50 % chance to detect a flaw. The values for a50 are: 2.7 mm for SPA (Fig. 1, left) and 5.3 mm for STD-PA (Fig. 1, right). These values correspond well with the expert opinion and experience regarding the detectability of cracks in anisotropic metals.
3. The Sampling Phased Array (SPA) Principle
3.1 Basic Approach Usually in a single transmitter-receiver action of a standard phased array testing procedure (STD-PA) all elements of the PA transducer take part as transmitter and as receiver. By considering the informational content of ultrasonic signals received by single array elements [3] essential part of information included in signals gets lost due to the phased controlled addition according to the phased array principle.
Fig. 2. Principle of SPA data acquisition and the information matrix of a phased array transducer with
N elements, where T is transmitter and R is receiver
G. Dobmann, et al./ Determination of the Probability of Failure (POF) in a Sensitivity Study Based on a Probabilistic FAD-Approach
and POD-Curves Using PAUT
24
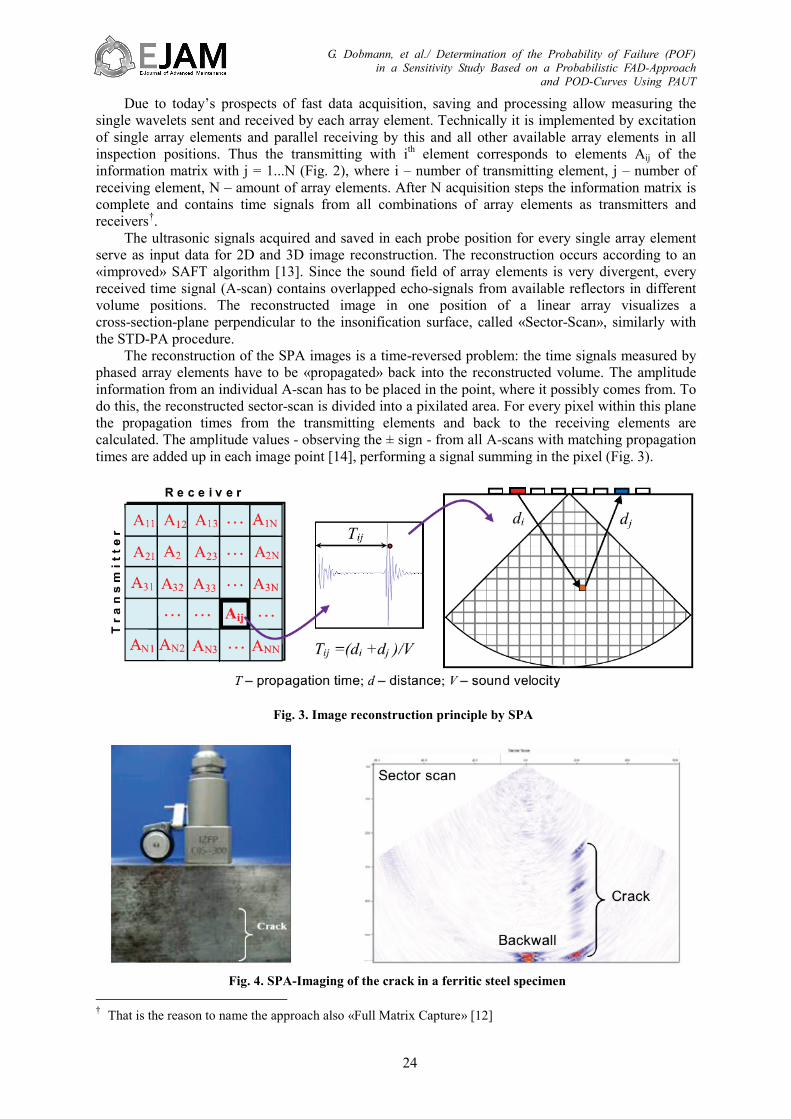
Due to today’s prospects of fast data acquisition, saving and processing allow measuring the single wavelets sent and received by each array element. Technically it is implemented by excitation of single array elements and parallel receiving by this and all other available array elements in all inspection positions. Thus the transmitting with ith element corresponds to elements Aij of the information matrix with j = 1...N (Fig. 2), where i – number of transmitting element, j – number of receiving element, N – amount of array elements. After N acquisition steps the information matrix is complete and contains time signals from all combinations of array elements as transmitters and receivers†. The ultrasonic signals acquired and saved in each probe position for every single array element serve as input data for 2D and 3D image reconstruction. The reconstruction occurs according to an «improved» SAFT algorithm [13]. Since the sound field of array elements is very divergent, every received time signal (A-scan) contains overlapped echo-signals from available reflectors in different volume positions. The reconstructed image in one position of a linear array visualizes a cross-section-plane perpendicular to the insonification surface, called «Sector-Scan», similarly with the STD-PA procedure. The reconstruction of the SPA images is a time-reversed problem: the time signals measured by phased array elements have to be «propagated» back into the reconstructed volume. The amplitude information from an individual A-scan has to be placed in the point, where it possibly comes from. To do this, the reconstructed sector-scan is divided into a pixilated area. For every pixel within this plane the propagation times from the transmitting elements and back to the receiving elements are calculated. The amplitude values - observing the ± sign - from all A-scans with matching propagation times are added up in each image point [14], performing a signal summing in the pixel (Fig. 3).
Fig. 3. Image reconstruction principle by SPA
Fig. 4. SPA-Imaging of the crack in a ferritic steel specimen
† That is the reason to name the approach also «Full Matrix Capture» [12]
G. Dobmann, et al./ Determination of the Probability of Failure (POF) in a Sensitivity Study Based on a Probabilistic FAD-Approach
and POD-Curves Using PAUT
25
Thus all angles of incidence and focal depths within the near field of the transducer can be realized even after one single transmitting/receiving action. Since the sound beam steering to each volume point, i.e. for all angles of incidence and focal depth, is performed not physically but virtually by computer control, a significant increase in inspection speed can be achieved by implementation of the SPA principle. Furthermore the synthetic focusing in the near field of the UT transducer by the SAFT principle improves sensitivity and resolution due to signal-noise-enhancement and in consequence allows the best-possible, i.e. «correct», defect sizing (Fig. 4).
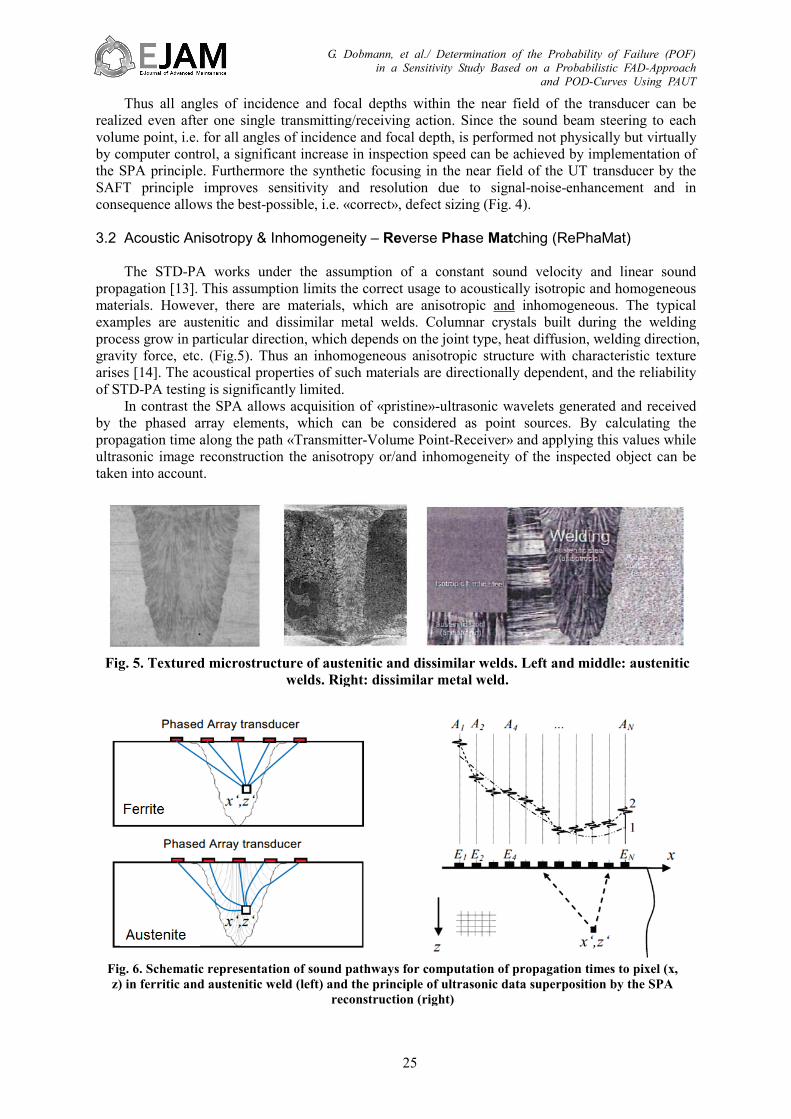
3.2 Acoustic Anisotropy & Inhomogeneity – Reverse Phase Matching (RePhaMat) The STD-PA works under the assumption of a constant sound velocity and linear sound propagation [13]. This assumption limits the correct usage to acoustically isotropic and homogeneous materials. However, there are materials, which are anisotropic and inhomogeneous. The typical examples are austenitic and dissimilar metal welds. Columnar crystals built during the welding process grow in particular direction, which depends on the joint type, heat diffusion, welding direction, gravity force, etc. (Fig.5). Thus an inhomogeneous anisotropic structure with characteristic texture arises [14]. The acoustical properties of such materials are directionally dependent, and the reliability of STD-PA testing is significantly limited. In contrast the SPA allows acquisition of «pristine»-ultrasonic wavelets generated and received by the phased array elements, which can be considered as point sources. By calculating the propagation time along the path «Transmitter-Volume Point-Receiver» and applying this values while ultrasonic image reconstruction the anisotropy or/and inhomogeneity of the inspected object can be taken into account.
Fig. 5. Textured microstructure of austenitic and dissimilar welds. Left and middle: austenitic
welds. Right: dissimilar metal weld.
Fig. 6. Schematic representation of sound pathways for computation of propagation times to pixel (x, z) in ferritic and austenitic weld (left) and the principle of ultrasonic data superposition by the SPA
reconstruction (right)

G. Dobmann, et al./ Determination of the Probability of Failure (POF) in a Sensitivity Study Based on a Probabilistic FAD-Approach
and POD-Curves Using PAUT
26
In the case of an isotropic homogeneous material, such as a ferritic weld, the acoustical waves propagate linear and with constant velocity (Fig. 6, left). The reconstruction procedure is simple (see also Fig.3): for each pixel (x’, z’) of the reconstructed volume the propagation time from each element E of the phased array transducer to the pixel is calculated as a sum of the distances from individual transmitter to the pixel and from pixel to receiver, divided by the sound velocity. The distribution of propagation time through the phased array elements has «seen» from each particular pixel a hyperbolic form (line 1 in Fig. 6, right). According the calculated propagation time, the corresponding ultrasonic data from each individual A-scan is selected and in the pixel summarized. In an austenitic weld due to its anisotropy and inhomogeneity, the task of back propagation of received ultrasonic data into the reconstructed volume is much more complicated. The direction dependency of the acoustical properties as well as the weld inhomogeneity causes the non-straight sound propagation (due to the refraction of the grains) and therefore a variety of propagation velocity. The propagation time cannot be calculated so easily as in an isotropic material. The form of its distribution through the PA elements is much more complicated (line 2 in Fig. 6) and is never known a priori. The technique called «Reverse Phase Matching» (RePhaMat) improves the flaw detectability in materials so far the anisotropy and inhomogeneity is known [15]. The RePhaMat takes into account the direction dependencies of the acoustic properties and the sound refraction on the grain boundaries as well. In the case of known elastic properties (stiffness matrix) and material structure the propagation times of ultrasound through the weld joint can be calculated by simulation. There are different modeling approaches such as the elastodynamic finite integration technique (EFIT) [16] or the Generalized Point Source Synthesis (GPSS) [17], in order to name here only two. One of the simplest and fastest simulation techniques – the ray-tracing method – considers refraction of sound waves on the interfaces and provides sufficient accuracy for sound travel time calculation. In combination with other techniques [18] it can be applied for RePhaMat.
Fig. 7. Direction dependency of the phase velocity v and group velocities V on the phase angle θ and
group angle φ in a transverse isotropic medium (here: longitudinal wave in the material X8CrNiNb 19 10)
For this purpose we have developed a ray-tracing algorithm, which allows fast computation of
the sound propagation under consideration of beam refraction at columnar crystal boundaries and variation of the phase and group velocities. Following assumptions underline the fast simulation engine: • Columnar crystals are principally considered as a transverse-isotropic medium (TI-medium).
The number of independent elastic constants for describing such medium reduces from 27 to 5 [19]. If these five constants are known the phase velocity v (velocity of the phase propagation in an anisotropic medium) and the group velocity V (velocity of the energy propagation) dependent on the corresponding phase angle θ and the group angle φ can be calculated (Fig. 7).
G. Dobmann, et al./ Determination of the Probability of Failure (POF) in a Sensitivity Study Based on a Probabilistic FAD-Approach
and POD-Curves Using PAUT
27
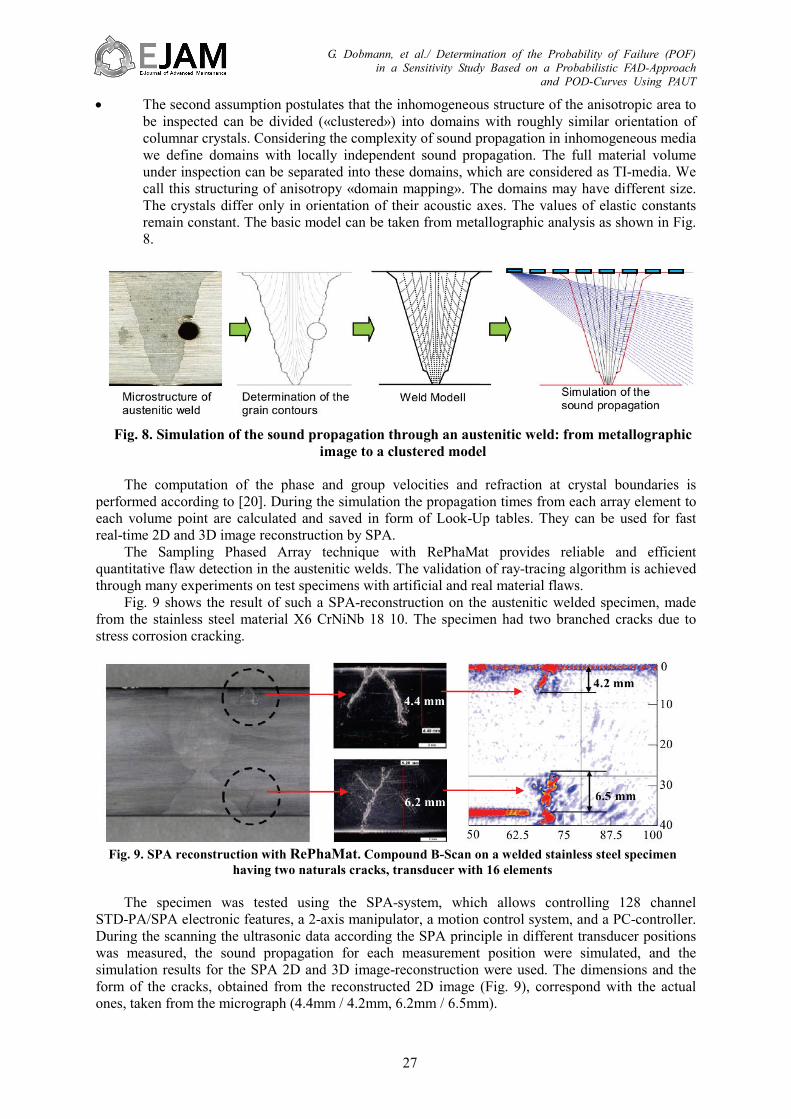
• The second assumption postulates that the inhomogeneous structure of the anisotropic area to be inspected can be divided («clustered») into domains with roughly similar orientation of columnar crystals. Considering the complexity of sound propagation in inhomogeneous media we define domains with locally independent sound propagation. The full material volume under inspection can be separated into these domains, which are considered as TI-media. We call this structuring of anisotropy «domain mapping». The domains may have different size. The crystals differ only in orientation of their acoustic axes. The values of elastic constants remain constant. The basic model can be taken from metallographic analysis as shown in Fig. 8.
Fig. 8. Simulation of the sound propagation through an austenitic weld: from metallographic
image to a clustered model
The computation of the phase and group velocities and refraction at crystal boundaries is performed according to [20]. During the simulation the propagation times from each array element to each volume point are calculated and saved in form of Look-Up tables. They can be used for fast real-time 2D and 3D image reconstruction by SPA. The Sampling Phased Array technique with RePhaMat provides reliable and efficient quantitative flaw detection in the austenitic welds. The validation of ray-tracing algorithm is achieved through many experiments on test specimens with artificial and real material flaws. Fig. 9 shows the result of such a SPA-reconstruction on the austenitic welded specimen, made from the stainless steel material X6 CrNiNb 18 10. The specimen had two branched cracks due to stress corrosion cracking.
Fig. 9. SPA reconstruction with RePhaMat. Compound B-Scan on a welded stainless steel specimen
having two naturals cracks, transducer with 16 elements
The specimen was tested using the SPA-system, which allows controlling 128 channel STD-PA/SPA electronic features, a 2-axis manipulator, a motion control system, and a PC-controller. During the scanning the ultrasonic data according the SPA principle in different transducer positions was measured, the sound propagation for each measurement position were simulated, and the simulation results for the SPA 2D and 3D image-reconstruction were used. The dimensions and the form of the cracks, obtained from the reconstructed 2D image (Fig. 9), correspond with the actual ones, taken from the micrograph (4.4mm / 4.2mm, 6.2mm / 6.5mm).

G. Dobmann, et al./ Determination of the Probability of Failure (POF) in a Sensitivity Study Based on a Probabilistic FAD-Approach
and POD-Curves Using PAUT
28
3.3 Acoustic Anisotropy – Gradient Elastic Constants Descent Method (GECDM) The «correct» reconstruction of an ultrasonic image of an anisotropic component by SPA is only possible if both – the material structure and the elastic properties - are known. While the material structure can be «deviated» from the manufacturing welding process or determined by metallography at specific, representative specimens selected for destructive mechanical test, the elastic constants are as a rule unknown.
Fig. 10. Iterative Gradient Elastic Constants Descent Method
Fraunhofer-IZFP [21] has developed the Gradient Elastic Constants Descent Method
(GECDM) which actually is under patent negotiations and which allows the determination of elastic constants in austenitic or dissimilar weld joints with assumed material structure. The approach consists in an iterative adjustment of the material properties. As one optimization criterion the correct reconstruction of a model reflector (size and position) in a reference specimen with similar acoustic properties is used.
At first the simulation of the wave propagation with an initial (wrong) set of elastic constants is performed. In the next step the numerical reconstruction of a sector-image based on calculated propagation times is performed. Since the assumed values are wrong, the reference reflector appears at wrong position and is badly resolved. Iteratively elastic constants are varied by GECDM (Fig. 10) till the flaw indication appears at correct position (from position A to B in Fig. 10) with highest amplitude and best localization.
The GECDM has been validated by means of divers weld structures with artificial defects of different types and positions, whereby the obtained values of elastic constants by GECDM where compared with the values obtained by mechanical examination.
4. The Failure Assessment Diagram - FAD The assessment of the probability of failure (POF) of a load-carrying structural component is based on the analysis of the component state, taking into account the initial strength capacity of the material and the production technology used in the manufacturing process, as well as the types of flaws which may be pre-existent or generated during operation. The local states of the material, its microstructure and the state of stress/strain in the regions with irregularities have to be taken into account. The analysis of these regions must consider the applied NDT and especially its capacity to distinguish between a crack and a no-crack signal.

G. Dobmann, et al./ Determination of the Probability of Failure (POF) in a Sensitivity Study Based on a Probabilistic FAD-Approach
and POD-Curves Using PAUT
29
4.1 Deterministic Approach For metals, in the case of a deterministic approach, an assessment of a flaw ends with a prediction either of failure or non-failure [22, 23]. The method was first developed for such deterministic analyses. The method is a recognized tool for failure analysis in many standards available today [24, 25, and 26]. Fig. 11 shows a FAD as it is used in the PVrisk software [27] which was developed for analyzing static conditions. Simulating crack growth in form of fatigue is beyond the scope of the software. The abscissae Sr and ordinates Kr are introduced in accordance with Formulae (1) and (2):
Kr = K1 / K1C (1) Sr = σref / σf, whereas σf = (σy + σUTS) / 2 (2)
Here, K1 is the stress intensity factor, K1C is the fracture toughness of the material and σref is the reference stress, which can be a superposition of the membrane stress σm
ref, a bending stress σbref, and
a residual stress Q. σy is the yield strength (Rp0.2, 0.2% yield limit) and σUTS is the tensile strength (Rm). The stress intensity factor (SIF) is made up of two parts. The first part is influenced by the load-induced stresses (primary stresses) and the second part takes residual stresses (secondary stresses) into account (Equations (3) to (5)):
K1 = K1p + K1
s (3)
K1p = (FSIF
m × κm × σmref + FSIF
b × κb × σbref) × √(πb) (4)
K1s = FSIF
m × Qm + FSIFb × Qb) × √(πb) (5)
Here, FSIF
m is the geometry-dependent correction factor, taking the membrane loads into account, and FSIF
b is the corresponding correction factor when bending loads are applied. Weld seams can be
accounted for through the correction factors κm (membrane loads) and κb (bending loads), as well as through the residual stresses (Qm, Qb).The b in the term √(πb) is the crack depth. The approach for considering residual stresses was taken from [26]. The Q are self-equilibrating stresses necessary to satisfy compatibility in the structure. This is a conservative approach but often no measurement values are available. In the FAD, the analysis is based on obtaining a value-pair (Sr, Kr). Here, Kr is a characteristic for the brittleness and Sr for the ductility. The bounding curve (failure curve) shown in Fig. 11 is derived by elastic-plastic theoretical considerations according to [28], where, in Equation (6), Sr is varied in the interval [0, 1]:
Kr = Sr / √ {(8/π2) ln [sec[(π/2) Sr]} (6) Failure assessment can be provided by evaluation of the position of the point pair (Sr, Kr) in the FAD. A position in the area formed by the bounding curve and the coordinate axes in the FAD obviously indicates no failure. If the point pair lies on the bounding curve or is outside-it, a failure of the component is predicted.
Fig. 11. FAD Fig. 12. Geometry Module

G. Dobmann, et al./ Determination of the Probability of Failure (POF) in a Sensitivity Study Based on a Probabilistic FAD-Approach
and POD-Curves Using PAUT
30
The model of a semi-elliptical crack of length 2a and depth b, is chosen for the crack geometry (Fig. 12), oriented in the axial direction and precisely positioned symmetrically in the middle position of the cylinder which is the model for a pipe with length 2L = 2200 mm, thickness 30 mm and outer-radius R0 = 300 mm. The model has the advantage that analytic formulae exist to calculate the stress intensity factor (SIF). The crack geometry is assumed fix (deterministic approach) or according a statistical distribution in length and depth (see next sub-chapter 4.2).
Material properties are defined in a special material module in PVrisk. These are the values as shown in Table 2 of the standard Nb-stabilized austenitic stainless steel (X6 CrNiNb 18 10) in German nuclear power plants [29] for the yield strength, the tensile strength and the fracture toughness as fixed values in the case of a deterministic evaluation.
Table 2. Material parameters [29]
Material characteristics
Yield Strength Tensile strength Fracture Toughness
205 MPa 510 MPa 101 MPa ×√m One question of interest is to the existing safety margins concerning this component design.
PVrisk can give an answer to that question by using the deterministic approach. An internal pressure in the pipe is assumed to be according to 150 bar = 15 MPa in the primary circuit. The crack size is set in the half-length to a =10 mm, the crack depth to b = 10 mm (half-penny-shaped). In a parameter variation b is enlarged continuously between 10 mm and 29 mm and parallel the a-value is enlarged. The internal pressure is assumed to be constant (15 MPa). The software determines the critical parameters which are responsible for a pipe failure:
acrit = 27 mm and bcrit = 28 mm. So the crack length has to be larger than 54 mm to become critical. Compared with the registration length a90/95 (SAP 8mm, STD-PA ~10mm) obtained in the POD trial we have a safety margin with a safety factor larger than 5 in crack-length- and larger than 2 in crack-depth-determination. If we assume a = b = 10 mm, than only an inner pressure of pcrit = 31.1 MPa produces a pipe failure or if the inner pressure is still 15 MPa, only a reduction of fracture toughness to a value of KICcrit = 22.3 MPa×√m becomes critical. These are unrealistic high (pressure) or low (fracture toughness) values, never obtained in practice under service conditions. 4.2 Probabilistic Approach
Concerning a probabilistic approach, PVrisk asks for statistical distributions. A
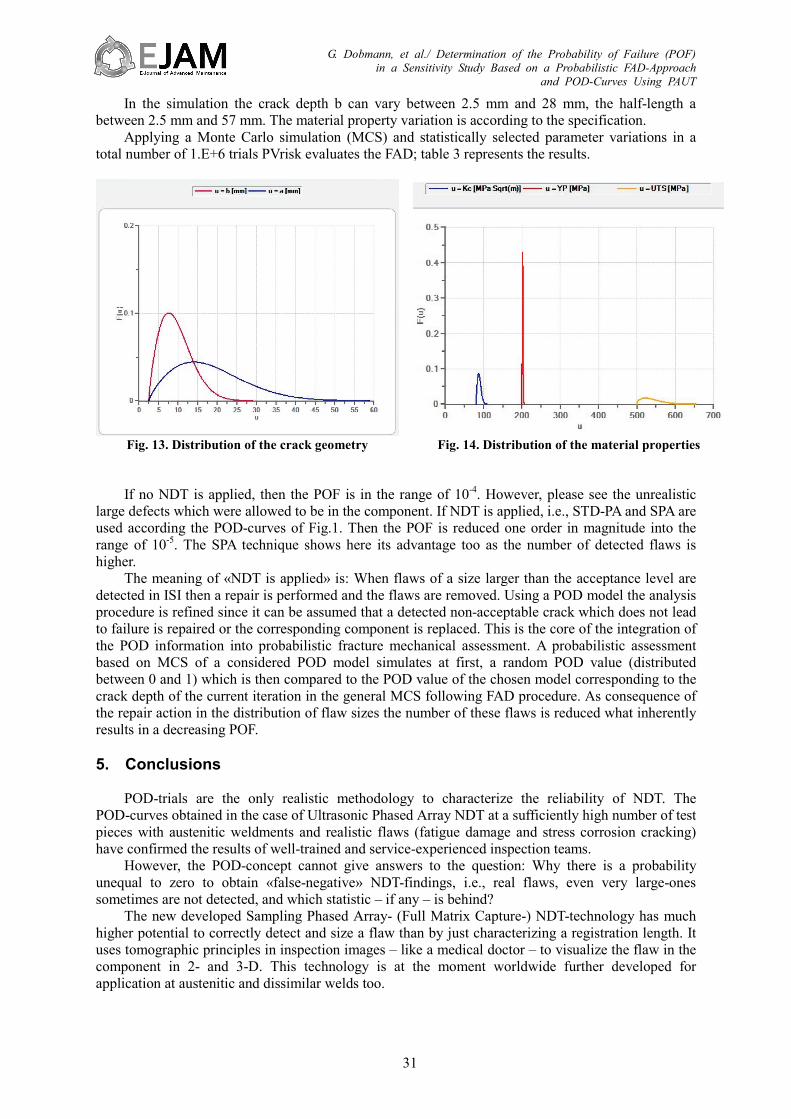
Weibull-distribution was assumed for the crack geometry as well as for the material properties (Fig. 13 and Fig. 14). However, it should be mentioned here that these distributions in real life have to be the result of an experimental statistical trial similar that-one described in the second chapter. On the basis of a representative large number of material specimens, taken from a real component, these distributions have to be determined destructively. Fig. 13 shows the assumed distribution of crack sizes. The type of crack size distribution which was introduced in the test pieces and discussed in [2] was a non-symmetric-one. Nevertheless the adaption to the specific Weibull distribution shown here is an assumption for simulation which has to be proofed for real conditions.
Table 3. Probabilistic results
Technique Number of failures in 1.E+6 trials
Probability of failure (POF)
Probability of detection (POD)
No NDT applied 295 2.95E-4 0 POD of STD-PA according to Fig.1 15 1.5E-5 0.836
POD of SPA according to Fig, 1 12 1.2E-5 0.901
G. Dobmann, et al./ Determination of the Probability of Failure (POF) in a Sensitivity Study Based on a Probabilistic FAD-Approach
and POD-Curves Using PAUT
31
In the simulation the crack depth b can vary between 2.5 mm and 28 mm, the half-length a between 2.5 mm and 57 mm. The material property variation is according to the specification.
Applying a Monte Carlo simulation (MCS) and statistically selected parameter variations in a total number of 1.E+6 trials PVrisk evaluates the FAD; table 3 represents the results.
Fig. 13. Distribution of the crack geometry Fig. 14. Distribution of the material properties
If no NDT is applied, then the POF is in the range of 10-4. However, please see the unrealistic large defects which were allowed to be in the component. If NDT is applied, i.e., STD-PA and SPA are used according the POD-curves of Fig.1. Then the POF is reduced one order in magnitude into the range of 10-5. The SPA technique shows here its advantage too as the number of detected flaws is higher. The meaning of «NDT is applied» is: When flaws of a size larger than the acceptance level are detected in ISI then a repair is performed and the flaws are removed. Using a POD model the analysis procedure is refined since it can be assumed that a detected non-acceptable crack which does not lead to failure is repaired or the corresponding component is replaced. This is the core of the integration of the POD information into probabilistic fracture mechanical assessment. A probabilistic assessment based on MCS of a considered POD model simulates at first, a random POD value (distributed between 0 and 1) which is then compared to the POD value of the chosen model corresponding to the crack depth of the current iteration in the general MCS following FAD procedure. As consequence of the repair action in the distribution of flaw sizes the number of these flaws is reduced what inherently results in a decreasing POF.
5. Conclusions POD-trials are the only realistic methodology to characterize the reliability of NDT. The POD-curves obtained in the case of Ultrasonic Phased Array NDT at a sufficiently high number of test pieces with austenitic weldments and realistic flaws (fatigue damage and stress corrosion cracking) have confirmed the results of well-trained and service-experienced inspection teams. However, the POD-concept cannot give answers to the question: Why there is a probability unequal to zero to obtain «false-negative» NDT-findings, i.e., real flaws, even very large-ones sometimes are not detected, and which statistic – if any – is behind? The new developed Sampling Phased Array- (Full Matrix Capture-) NDT-technology has much higher potential to correctly detect and size a flaw than by just characterizing a registration length. It uses tomographic principles in inspection images – like a medical doctor – to visualize the flaw in the component in 2- and 3-D. This technology is at the moment worldwide further developed for application at austenitic and dissimilar welds too.

G. Dobmann, et al./ Determination of the Probability of Failure (POF) in a Sensitivity Study Based on a Probabilistic FAD-Approach
and POD-Curves Using PAUT
32
PVrisk is a software tool which allows calculating the probability of failure by using the methodology of the Failure Assessment Diagram of fracture mechanics. By implementing the POD-concept the tremendous advantage of POD-integration in the NDT-data-evaluation can be documented and therefore the gain in safety. 5. Acknowledgement The authors thank very much Anne JÜNGERT and Sandra DUGAN of the Materials Testing Institute (MPA) at the Technical University Stuttgart for the fruitful cooperation. The financial support of the Federal Ministry of Economy and Technology is very much acknowledged.
References [1] KTA Rules of Standard: http://www.kta-gs.de/common/regel_prog1.htm. [2] J. H. Kurz., A. Jüngert, S. Dugan, G. Dobmann, C. Boller, Reliability considerations of NDT by probability
of detection (POD) determination using ultrasound phased array. In: Engineering Failure Analysis. 35 (2013), 609-617.
[3] A. Bulavinov‚ Sampling Phased Array (in German), Ph. D Thesis at the University of the Saar, Saarbrücken, 2005.
[4] C. Annis, MIL-HDBK-1823A, Nondestructive Evaluation System Reliability Assessment. Department of Defense Handbook, Wright-Patterson AFB, USA, 2009.
[5] C. Annis, 2010. Statistical best-practices for building Probability of Detection (POD) models. R package mh1823, Version 2.5.4.4 http://StatisticalEngineering.com/mh1823/.
[6] G. A. Georgiou, Probability of Detection (POD) curves, Derivation, application and limitations, Jacobi Consulting Limited, Research Report 454, 2006.
[7] U. Mletzko, S. Zickler, 2007, Enhanced evaluation of NDT performance at Ni –based alloys and austenitic components (in German), BMU Project SR 2501, technical report 1.2, Stuttgart, 2007.
[8] A. P. Berens, NDE Reliability Data Analysis, in: ASM Handbook, Nondestructive Evaluation and Quality Control, 3rd Edition, ASM International USA 1994; 17: 689-701.
[9] M. Spies, H. Rieder, Synthetic aperture focusing of ultrasonic inspection data to enhance the probability of detection of defects in strongly attenuating materials, NDT&E International 2010, 43: 425-431.
[10] M. Carboni, S. A. Cantini, Model Assisted Probability of Detection approach for ultrasonic inspection of railway axles, in: South-African Insitute for Non-destructive Testing: World Conference on Nondestructive Testing (18), WCNDT 2012; paper 200.
[11] S. Feistkorn, Quality evaluation of NDT in civil engineering in case of pulsed radar (in German), PhD Thesis, Technical University, Berlin 2011.
[12] C. Holmes, B. W. Drinkswater, and P. D. Wilcox, Post-processing of the full matrix of ultrasonic transmit-receive array data for non-destructive evaluation, NDT&E International, 2005, 38, 701-711.
[13] V. Schmitz, W. Müller, G. Schäfer, Synthetic Aperture Focusing Technique: state of the art, Acoustical Imaging, Vol.19, pp. 545-551, New York, 1992.
[14] S. Pudovikov, A. Bulavinov, M. Kröning, Ultrasonic inspectability of austenitic stainless steel and dissimilar metal weld joints, 34. MPA-Seminar Werkstoff- & Bauteilverhalten in der Energie- & Anlagentechnik, Stuttgart, 2008.
[15] A. Bulavinov, M. Kröning, S. Pudovikov, R. Oster, R. Hanke, U. Hegemann, K. M. Reddy, R. S. Venkat, Application of Sampling Phased Array Technique for ultrasonic inspection of CFRP components, International Symposium on NDT in Aerospace, Fürth, 2008.
[16] P. Fellinger, R. Marklein‚ EFIT – Elastodynamic Finite Integration Technique for Modeling Transmission, Propagation , and Diffraction (in German), DGZfP e.V., (1990) Berlin.
[17] M. Spies, Transducer Field Modelling in Anisotropic Media by Superposition of Gaussian Base Functions, J. Acoust. Soc. Am., 105, pp. 633-638. (1999).
[18] M. Sadri, M.A. Riahi, Ray tracing and amplitude calculation in anisotropic layered media, Geophys. J. Int.180, pp.1170-1180 (2010).
[19] K. Helbig, Foundations of anisotropy for exploration seismics, Vol. 22 (1994). [20] M. A. Slawinski, On Elastic-wave Propagation in Anisotropic Media: Reflection/Refraction Laws,
Raytracing, and Traveltime Inversion, Ph.D. Thesis University Calgary, Alberta, (1996). [21] S. Pudovikov, Optimization and documentation of the enhanced inspectability by UT at acoustically
anisotropic materials as austenitic and dissimilar welds (in German), Ph.D. Thesis at the Saar University, 2013.

G. Dobmann, et al./ Determination of the Probability of Failure (POF) in a Sensitivity Study Based on a Probabilistic FAD-Approach
and POD-Curves Using PAUT
33
[22] A. R, Dowling and C. H. A. Townley, The effect of defect on structural failure: a two-criterion approach, International Journal of Pressure Vessels and Piping, Vol 3, pp 77-137, 1975.
[23] R. P. Harrison, K. Loosemore and I. Milne, Assessment of the integrity of structures containing defects, CEGB report R/H/ R6, Central Electricity Generating Board, UK, 1976.
[24] R. W. Nichols, The revision of the structural integrity assessment method CEGB/R6, International Journal of Pressure Vessels and Piping, Vol 35, pp 3-20, 1987.
[25] U. Zerbst, Ch. Wiesner, M. Kocak and L. Hodulak, SINTAP: Draft document of a unified European defect evaluation procedure – an introduction (in German), GKSS report 99/E/65, p 125, 1999.
[26] British Standards Institution, BS 7910: 2005 Guide to methods for assessing the acceptability of flaws in metallic structures, p 297, 2005.
[27] J. H. Kurz and D. D. Cioclov, PVrisk user manual, version 1.1, 2008, © Fraunhofer-IZFP [28] D. Dougdale,Yielding of steel sheets containing slits, Journal of the Mechanics and Physics of Solids, Vol
8, No 2, pp 100-104, 1960. [29] Materials specification: 1.4550, Thyssen Krupp International, version 02/2011.