determining allowable pavement load limit using...
TRANSCRIPT
October 2006 1
The procedure presented is an optional method to determine the maximum allowable wheel load, axle load, and gross vehicle weight for roadway pavements. This procedure is a simplified version of a method used by the Texas Department of Transportation to determine maximum allowable pavement wheel load on the State Highway and Farm-to-Market roadway system. This method should not be used to determine the maximum allowable wheel load, axle load or gross vehicle weight for bridges.
In this method, two parameters dictate the upper limit of wheel loads allowed on a roadway; the thickness of the pavement structure, and the subgrade soil strength. A thicker pavement will distribute the wheel load stresses over a larger area before transmitting it to the soil layers, which reduces the likelihood of subgrade failures. In addition, the stronger the underlying soil layer, the more load one can exert on the pavement before permanently damaging it. An evaluation of the thickness of the overlying pavement layers and the strength of the underlying soil is needed before one can determine the allowable wheel load on the pavement.
Summary of Procedure This procedure can be used to determine the maximum wheel load when the depth of cover and subgrade strength are known, or to determine the required depth of cover when the maximum wheel load and subgrade strength are known. The depth of cover in inches is the pavement thickness above the subgrade soil. This procedure requires the following information and references: 1. A description of the pavement structure including pavement layer thicknesses and material types for
each different pavement structure that exists along the route. 2. A visual distress evaluation of the route.
3. A copy of the Natural Resource Conservation Service (NRCS) (previously United States Department of Agriculture (USDA) Soil Conservation Service) soil survey booklet for the county in which the load zoned roadway is located. If a County soil survey booklet is not available, soil information can be obtained from the NRCS website. Steps for obtaining soil information using the NRCS website is described later in this document.
4. The Triaxial classification of the subgrade soil(s) along the route. The Triaxial classification may be determined based on experience and/or by using a spreadsheet developed by CST-Flexible Pavement and Soils & Aggregates Branches based on the TxDOT ‘Triaxial Classification of the Surface Soils of Texas as Grouped by Soil Conservation Service Series’ booklet. A copy of this spread sheet can be obtained from the Construction Division, Pavement and Material Systems Branch.
5. A copy of the Texas Triaxial Flexible Pavement Wheel Load Chart. This chart is available in the TxDOT booklet TxDOT ‘Triaxial Classification of the Surface Soils of Texas as Grouped by Soil Conservation Service Series.’
A summary of this procedure is given below:
1. Determine the beginning and ending of the section of roadway to be load zoned (physical limits). For pavements on the State Highway System, also determine the Texas Reference Marker (TRM) limits.
Determining Allowable Pavement Load Limit Using the Texas Triaxial Classification Procedure

October 2006 2
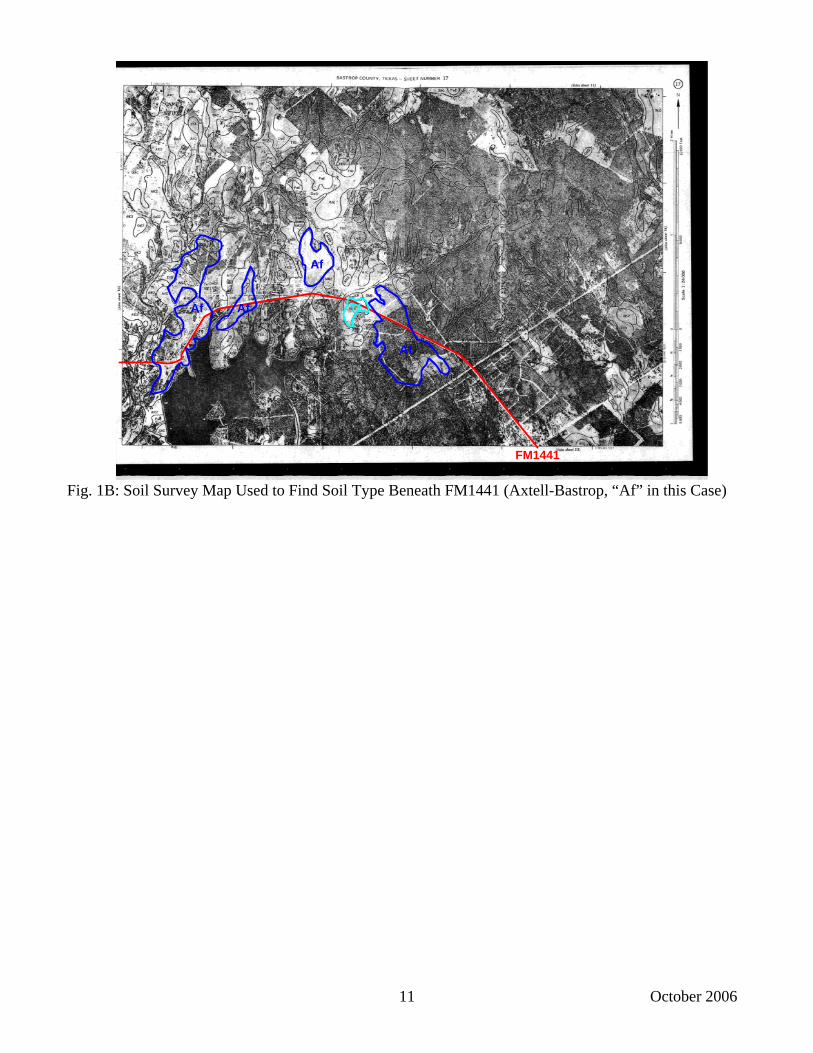
2. Determine the location of the roadway on the NRCS (United States Department of Agriculture (USDA) county soil survey maps (Figure1). Note the soil types underlying the roadway. If the roadway crosses two or more soil types, engineering judgement should be used to select the soil type for the analysis. Typically, the soil type with the highest triaxial value (lowest strength) should be used to estimate maximum wheel loads.
3. Look up the soil series name from the map (e.g. Axtell-Bastrop Series, Af); or use the Natural Resources Conservation Service website to obtain the Soil Series names for the roadway of interest.
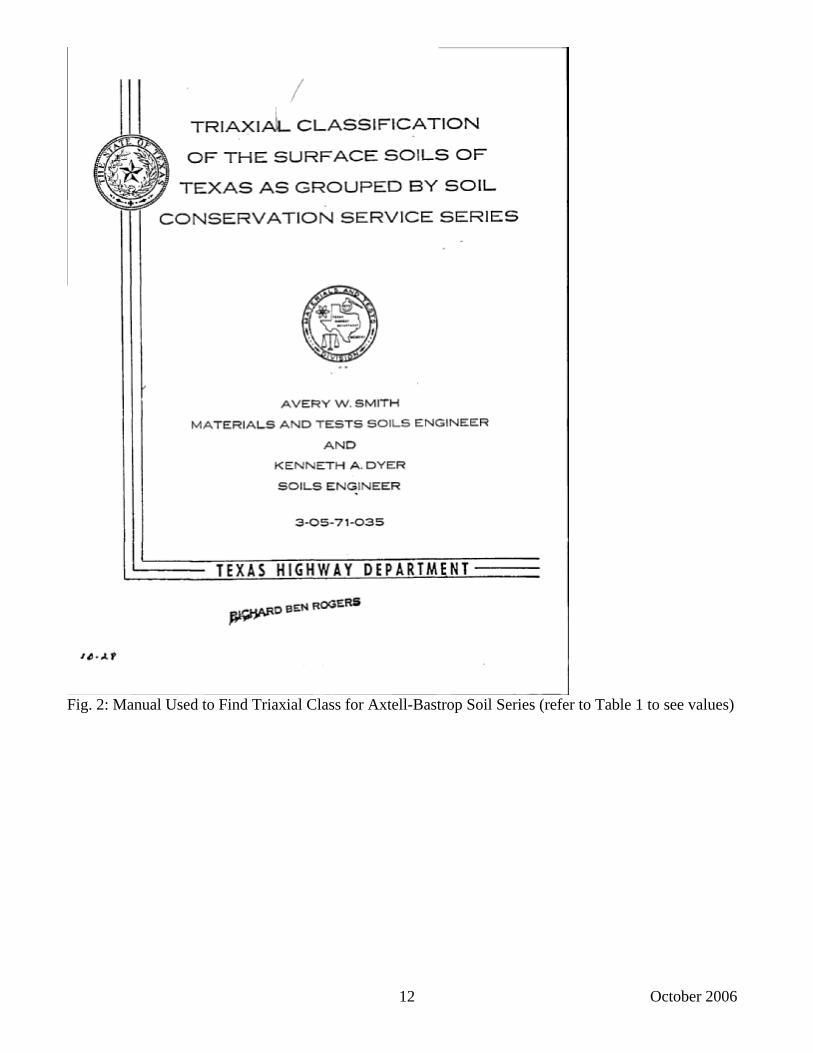
4. Obtain the Triaxial class of the soil from the spreadsheet based on the TxDOT booklet ‘Triaxial Classification of the Surface Soils of Texas as Grouped by Soil Conservation Service Series’ (Figure 2 and Table 1). A copy of the soil series / Texas Triaxial Class spreadsheet is available from CST-Pavement & Materials Systems Branch.
5. Determine the effective pavement depth of cover based on a field investigation and/or the design plans. The effective depth of cover is determined based on the a) the actual constructed thicknesses; b) Thickness adjustment for stabilized layers; c) consideration of visual distress condition and d) consideration of planned future overlays and maintenance treatments.
a. Actual constructed pavement layer thicknesses – The actual pavement layer thicknesses are determined based on a field-investigation and/or the construction plans. The field investigation may include Dynamic Cone Penetrometer (DCP) test, coring, or excavating small sections of the pavement so that the layer thicknesses and material types can be determined. The existence of stabilized layers including asphalt surface and/or base layers; cement or lime stabilized base layers should be noted.
b. Thickness adjustment for stabilized layers - Stabilized surface or base layers (e.g. asphalt stabilized surface or base courses, or cement or lime stabilized base layers) in good condition are generally stiffer than a crushed aggregate base layer and therefore distribute the tire load more effectively. For this reason, an adjustment is permitted for stabilized layers to account for this additional benefit. The following guidelines are recommended:
For stabilized layers < 2 in. thick, no adjustment.
For stabilized layers 2 in. - 4 in. thick - add 1 in. to the actual stabilized layer thickness.
For stabilized layers > 4 in. thick - multiply the actual stabilized layer thickness by 1.25. Surface treatments or seal coats are not considered a stabilized layer and should not be included
in considering a thickness adjustment. Asphalt concrete surface or base layers are considered stabilized layers.

October 2006 3
Example 1): Existing pavement structure: 2 seal coats (approx 1 in. thick total) 3 in. hot mix asphalt concrete 6 in. crushed limestone base untreated clay subgrade. Effective thickness: 2 seal coats = 1 in. 3 in. hot mix ac = 3 in. + 1 in. = 4 in. 6 in. crushed limestone base = 6 in. effective thickness 11 in. Example 2): Existing pavement structure: 2 seal coats (approx 1 in. thick total) 9 in. of cement stabilized limestone base untreated sandy subgrade
Effective thickness: 2 seal coats = 1 in. 9 in. of cement stabilized base = 9 x 1.25 11.25 in. effective thickness 12.25 in. c. Consideration of visual distress conditions - The engineer should consider the visual
distress condition of the existing pavement when determining the effective thickness of the depth of pavement.
Fatigue cracking If fatigue cracking is present, the engineer should consider foregoing a thickness adjustment to
account for stabilized layers. If fatigue cracking exists in only one or two localized areas, consideration may be given to retaining the thickness adjustment for stabilized layers. No adjustment should be considered if fatigue cracking is pervasive.
Rutting If rutting over ½ in. deep exists along the route, the engineer should consider foregoing a
thickness adjustment for stabilized layers. If rutting exists in only one or two localized areas, consideration may be given to retaining the thickness adjustment for stabilized layers. No adjustment should be considered if rutting is pervasive.
Example 3): Route exhibits 1 in. rutting in both wheel paths over 30% of the project length Existing pavement structure: 2 seal coats (approx 1 in. thick total) 3 in. hot mix asphalt concrete 6 in. crushed limestone base untreated clay subgrade. Effective thickness: 2 seal coats = 1 in. 3 in. hot mix ac = 3 in. + 0 in. = 3 in. 6 in. crushed limestone base = 6 in. effective thickness 10 in.

October 2006 4
Note: No thickness adjustment was used for the 3 in. hot mix layer due to extensive rutting. Example 4): Route exhibits fatigue cracking in the outside wheel path along 40% of the project
length. Existing pavement structure: 2 seal coats (approx 1 in. thick total) 9 in. of cement stabilized limestone base untreated sandy subgrade Effective thickness: 2 seal coats = 1 in. 9 in. of cement stabilized base = 9 in. x 1.00 9 in. effective thickness 10 in. Note: No thickness adjustment was used for the cement stabilized base due to extensive fatigue
cracking.
d. Consideration of planned future overlays and maintenance treatments. The engineer may elect to add 1.5 in. to the effective thickness value to account for future overlays that will be placed on the pavement during the design period. The typical design period for load zone roadway analysis is 10 years. Do not add any additional thickness if no overlay is planned.
6. Use the Flexible Pavement Analysis Chart (Figure 3) to determine the maximum allowable wheel load for the pavement.
7. Determine the maximum allowable axle loads using the following formulas:
Single Axle Load = Maximum Allowable Wheel Load x 2 or 20,000 lbs., whichever is less.
Tandem Axle Load = Maximum Allowable Wheel Load x 3.4 or 34,000 lbs., whichever is less.
In addition, the weight on any two consecutive axle groups may not exceed the weight computed by the following formula and rounding the result to the nearest 500 lbs.
( ) ( ){ }500 / 1 12 36W L N N N= × − + × +⎡ ⎤⎣ ⎦
Where:
‘W’ = the maximum overall gross weight on the groups ‘L’ = the distance in feet between the farthest axles of the two consecutive groups
measured ‘N’ = the number of axles in the groups measured
Further, the maximum wheel load must not exceed the weight specified and marked on the side wall of the tire. Refer to the latest addition of the ‘Texas Traffic Laws’ paragraph 621.101 ‘Weight limitations’ for additional information.
8. The maximum allowable gross vehicle weight (GVW) may be calculated by determining the
axle configuration for a given vehicle and summing the allowable axle loads accordingly.
If the recommended axle loads found by using this procedure result in the continued deterioration of the roadway surface, the load restrictions should be revised to some lower value.
October 2006 5
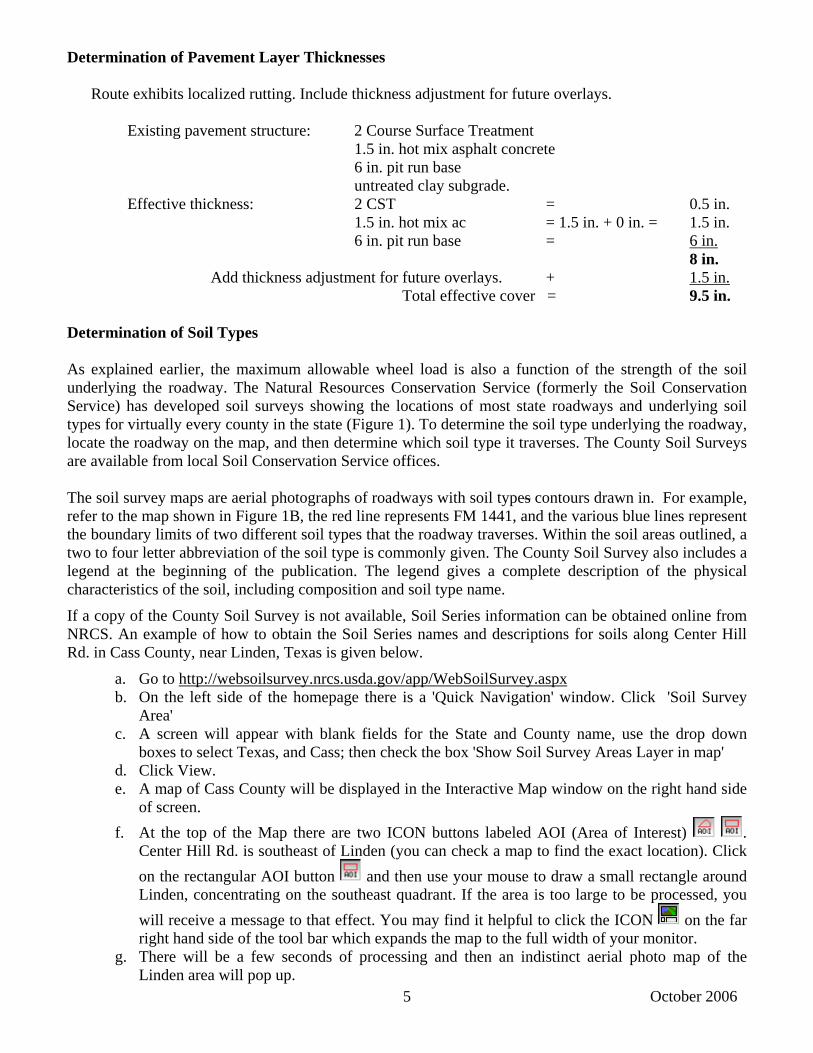
Determination of Pavement Layer Thicknesses
Route exhibits localized rutting. Include thickness adjustment for future overlays. Existing pavement structure: 2 Course Surface Treatment 1.5 in. hot mix asphalt concrete 6 in. pit run base untreated clay subgrade. Effective thickness: 2 CST = 0.5 in. 1.5 in. hot mix ac = 1.5 in. + 0 in. = 1.5 in. 6 in. pit run base = 6 in. 8 in.
Add thickness adjustment for future overlays. + 1.5 in. Total effective cover = 9.5 in. Determination of Soil Types As explained earlier, the maximum allowable wheel load is also a function of the strength of the soil underlying the roadway. The Natural Resources Conservation Service (formerly the Soil Conservation Service) has developed soil surveys showing the locations of most state roadways and underlying soil types for virtually every county in the state (Figure 1). To determine the soil type underlying the roadway, locate the roadway on the map, and then determine which soil type it traverses. The County Soil Surveys are available from local Soil Conservation Service offices. The soil survey maps are aerial photographs of roadways with soil types contours drawn in. For example, refer to the map shown in Figure 1B, the red line represents FM 1441, and the various blue lines represent the boundary limits of two different soil types that the roadway traverses. Within the soil areas outlined, a two to four letter abbreviation of the soil type is commonly given. The County Soil Survey also includes a legend at the beginning of the publication. The legend gives a complete description of the physical characteristics of the soil, including composition and soil type name.
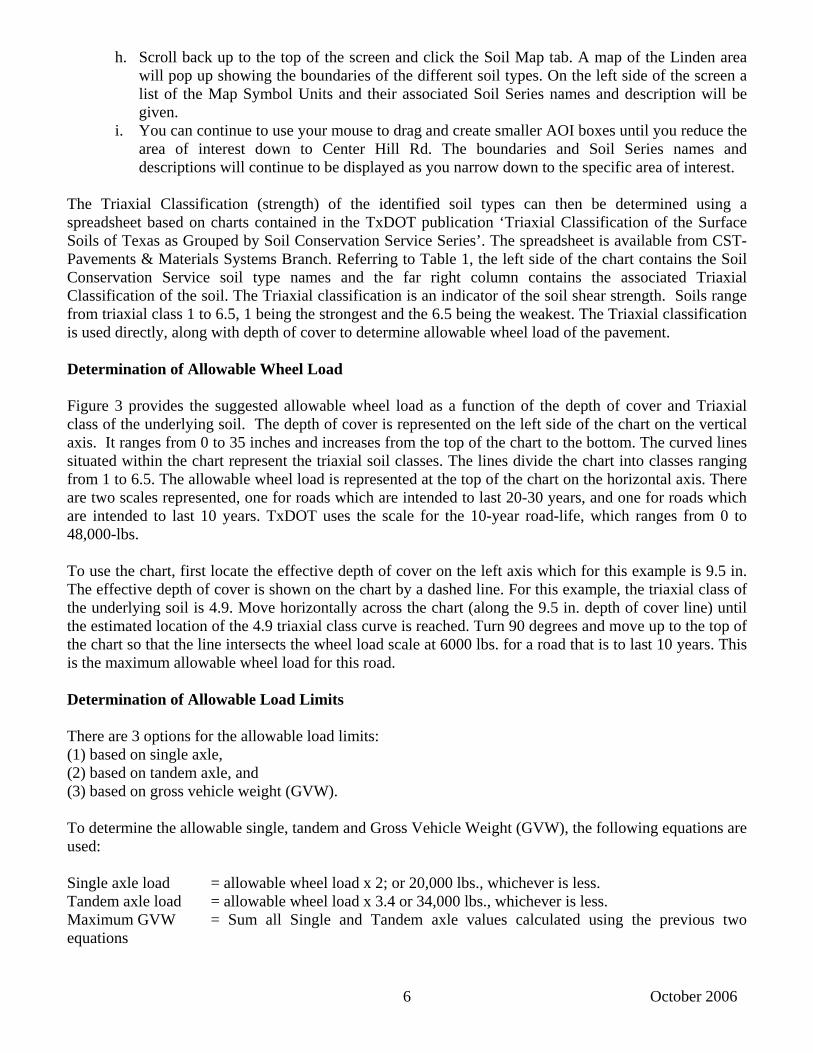
If a copy of the County Soil Survey is not available, Soil Series information can be obtained online from NRCS. An example of how to obtain the Soil Series names and descriptions for soils along Center Hill Rd. in Cass County, near Linden, Texas is given below.
a. Go to http://websoilsurvey.nrcs.usda.gov/app/WebSoilSurvey.aspx b. On the left side of the homepage there is a 'Quick Navigation' window. Click 'Soil Survey
Area' c. A screen will appear with blank fields for the State and County name, use the drop down
boxes to select Texas, and Cass; then check the box 'Show Soil Survey Areas Layer in map' d. Click View. e. A map of Cass County will be displayed in the Interactive Map window on the right hand side
of screen. f. At the top of the Map there are two ICON buttons labeled AOI (Area of Interest) .
Center Hill Rd. is southeast of Linden (you can check a map to find the exact location). Click on the rectangular AOI button and then use your mouse to draw a small rectangle around Linden, concentrating on the southeast quadrant. If the area is too large to be processed, you will receive a message to that effect. You may find it helpful to click the ICON on the far right hand side of the tool bar which expands the map to the full width of your monitor.
g. There will be a few seconds of processing and then an indistinct aerial photo map of the Linden area will pop up.
October 2006 6
h. Scroll back up to the top of the screen and click the Soil Map tab. A map of the Linden area will pop up showing the boundaries of the different soil types. On the left side of the screen a list of the Map Symbol Units and their associated Soil Series names and description will be given.
i. You can continue to use your mouse to drag and create smaller AOI boxes until you reduce the area of interest down to Center Hill Rd. The boundaries and Soil Series names and descriptions will continue to be displayed as you narrow down to the specific area of interest.
The Triaxial Classification (strength) of the identified soil types can then be determined using a spreadsheet based on charts contained in the TxDOT publication ‘Triaxial Classification of the Surface Soils of Texas as Grouped by Soil Conservation Service Series’. The spreadsheet is available from CST-Pavements & Materials Systems Branch. Referring to Table 1, the left side of the chart contains the Soil Conservation Service soil type names and the far right column contains the associated Triaxial Classification of the soil. The Triaxial classification is an indicator of the soil shear strength. Soils range from triaxial class 1 to 6.5, 1 being the strongest and the 6.5 being the weakest. The Triaxial classification is used directly, along with depth of cover to determine allowable wheel load of the pavement. Determination of Allowable Wheel Load Figure 3 provides the suggested allowable wheel load as a function of the depth of cover and Triaxial class of the underlying soil. The depth of cover is represented on the left side of the chart on the vertical axis. It ranges from 0 to 35 inches and increases from the top of the chart to the bottom. The curved lines situated within the chart represent the triaxial soil classes. The lines divide the chart into classes ranging from 1 to 6.5. The allowable wheel load is represented at the top of the chart on the horizontal axis. There are two scales represented, one for roads which are intended to last 20-30 years, and one for roads which are intended to last 10 years. TxDOT uses the scale for the 10-year road-life, which ranges from 0 to 48,000-lbs. To use the chart, first locate the effective depth of cover on the left axis which for this example is 9.5 in. The effective depth of cover is shown on the chart by a dashed line. For this example, the triaxial class of the underlying soil is 4.9. Move horizontally across the chart (along the 9.5 in. depth of cover line) until the estimated location of the 4.9 triaxial class curve is reached. Turn 90 degrees and move up to the top of the chart so that the line intersects the wheel load scale at 6000 lbs. for a road that is to last 10 years. This is the maximum allowable wheel load for this road. Determination of Allowable Load Limits There are 3 options for the allowable load limits: (1) based on single axle, (2) based on tandem axle, and (3) based on gross vehicle weight (GVW). To determine the allowable single, tandem and Gross Vehicle Weight (GVW), the following equations are used: Single axle load = allowable wheel load x 2; or 20,000 lbs., whichever is less. Tandem axle load = allowable wheel load x 3.4 or 34,000 lbs., whichever is less. Maximum GVW = Sum all Single and Tandem axle values calculated using the previous two equations
October 2006 7
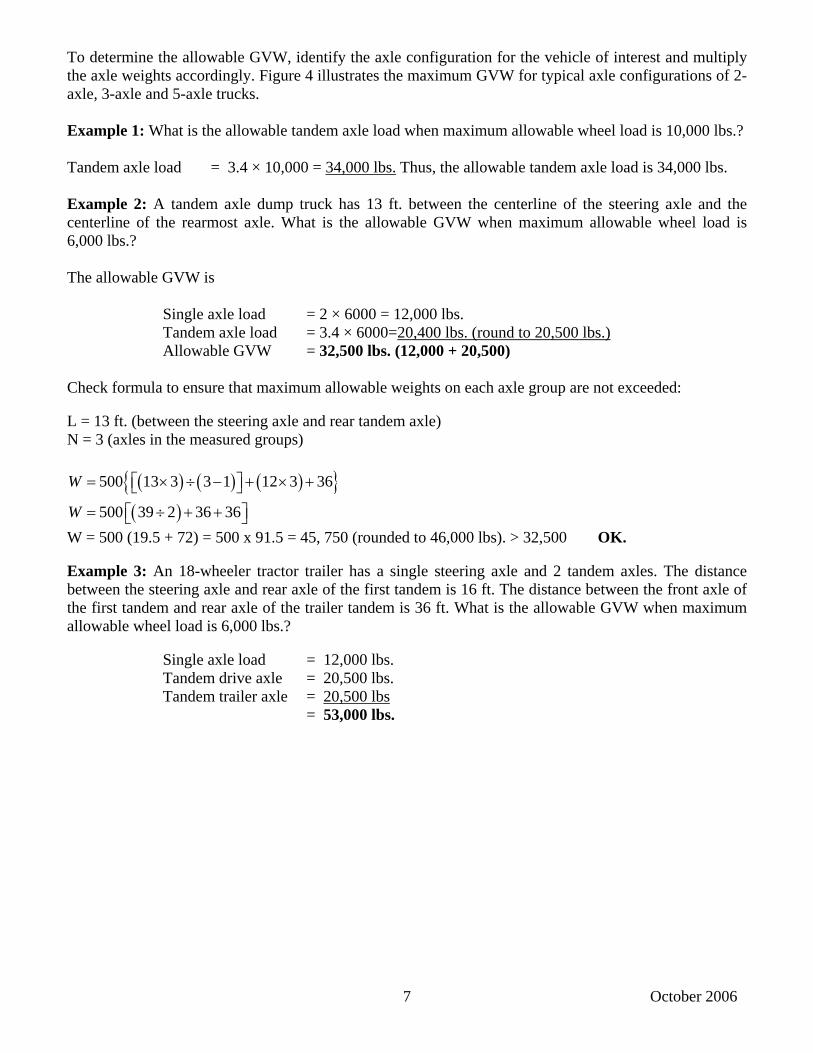
To determine the allowable GVW, identify the axle configuration for the vehicle of interest and multiply the axle weights accordingly. Figure 4 illustrates the maximum GVW for typical axle configurations of 2-axle, 3-axle and 5-axle trucks. Example 1: What is the allowable tandem axle load when maximum allowable wheel load is 10,000 lbs.? Tandem axle load = 3.4 × 10,000 = 34,000 lbs. Thus, the allowable tandem axle load is 34,000 lbs. Example 2: A tandem axle dump truck has 13 ft. between the centerline of the steering axle and the centerline of the rearmost axle. What is the allowable GVW when maximum allowable wheel load is 6,000 lbs.? The allowable GVW is Single axle load = 2 × 6000 = 12,000 lbs. Tandem axle load = 3.4 × 6000=20,400 lbs. (round to 20,500 lbs.) Allowable GVW = 32,500 lbs. (12,000 + 20,500) Check formula to ensure that maximum allowable weights on each axle group are not exceeded: L = 13 ft. (between the steering axle and rear tandem axle) N = 3 (axles in the measured groups)
( ) ( ) ( ){ }500 13 3 3 1 12 3 36W = × ÷ − + × +⎡ ⎤⎣ ⎦
( )500 39 2 36 36W = ÷ + +⎡ ⎤⎣ ⎦ W = 500 (19.5 + 72) = 500 x 91.5 = 45, 750 (rounded to 46,000 lbs). > 32,500 OK. Example 3: An 18-wheeler tractor trailer has a single steering axle and 2 tandem axles. The distance between the steering axle and rear axle of the first tandem is 16 ft. The distance between the front axle of the first tandem and rear axle of the trailer tandem is 36 ft. What is the allowable GVW when maximum allowable wheel load is 6,000 lbs.? Single axle load = 12,000 lbs. Tandem drive axle = 20,500 lbs. Tandem trailer axle = 20,500 lbs = 53,000 lbs.

October 2006 8
Check formula: L = 16 ft. from the steering axle to the rear axle of the tandem drive group. N = 3
( ) ( ) ( ){ }500 16 3 3 1 12 3 36W = × ÷ − + × +⎡ ⎤⎣ ⎦
( )500 48 2 36 36W = ÷ + +⎡ ⎤⎣ ⎦ W = 500 (24 + 72) = 500 x 96 = 48,000 > 12,000 + 20,500 = 32,500 lbs. OK Check formula for other groups: L = 36 ft. (from the front axle of the tandem drive group to the rear axle of the trailer tandem group) N = 4 (for two tandems)
( ) ( ) ( ){ }36 4 4 1 12 4 36W = × ÷ − + × +⎡ ⎤⎣ ⎦
( )144 3 48 36W = ÷ + +⎡ ⎤⎣ ⎦ W = 500 (48 + 84) = 500 x 132 = 66,000 > 20,500 + 20,500 = 41,000 lbs. OK Example Load Zone Roadway Analysis for FM 1441 The following information was obtained from a field investigation and construction records: Highway No.: FM 1441 County: Bastrop District: Austin
Control And Section: 2991-01;2991-02 Length, Miles: 6.571
Geographic Limits: from SH 95 to SH 21
TRM: Begin 0562-00.047 End 0568+00.524
Surface Type and Thickness: 2 Course Surface Treatment and 1.5 inches of HMACP
Base Type and Thickness: 6 inch Pit Run Base
Triaxial Classification of Subgrade Soil: Axtell-Bastrop Soil {4.9}
Visual distress condition: Localized rutting less than 1” deep noted in 2 locations. No fatigue cracking.
Present A.D.T. : 3300 (2000) Future A.D.T. : 6550 (2020)
20 Year Accumulated 18 Kip ESALs: 1,153,000 (Flexible)
Avg. 10 Heaviest Wheel Load Daily: 10,800lbs Percent Tandem Axles: 60 %
The Wheel Load Used for the Analysis is (10,800 * 1.3 = 14,040). See Note # 1 Below for Example.

October 2006 9
Note:
1) If the percent trucks meets or exceeds 50% of the total traffic, then multiply the average 10 heaviest wheel loads by 1.3 (1.3 x 10,800 = 14,040). Use 14,000 lbs. on Figure # 3 to determine the required depth of cover needed to last 10 years. FM 1441 requires 14.5 in. of total structure to handle the traffic volume given above and only has 9.5 in. Therefore, it is recommended that this road be load zoned as shown in the example under Figure # 3 or upgraded to a 14.5 in. structure.
Table 1 Example of Triaxial Classifications for Selected Soil Types in Texas
Soil Series Triaxial Cl. Avg. Axtell-Bastrop 4.9 Axtell-Irving 5.2 Axtell-Sawyer 5.5 Axtell-Travis 4.2 Balmorhea-Toyah 3.9 Bastrop-Travis 3.9 Beaumont-Edna 5.0
October 2006 10
Fig. 1A: Cover of Soil Survey Journal Containing Maps of Soil Types (Bastrop County in this Case)
October 2006 11
Fig. 1B: Soil Survey Map Used to Find Soil Type Beneath FM1441 (Axtell-Bastrop, “Af” in this Case)
Af
Af
Af
Tf
FM1441
Af
October 2006 12
Fig. 2: Manual Used to Find Triaxial Class for Axtell-Bastrop Soil Series (refer to Table 1 to see values)

October 2006 13
Fig. 3: Flexible Pavement Chart Used to Find the Maximum Wheel Load for the Pavement (For 10
years of traffic with a Triaxial Class of 4.9 and 9.5 in. depth of coverage, the maximum allowable wheel load is 6000-lbs/tire).
Note: 1) Wheel loads exceeding 6000-lbs./tire may cause premature damage to the road.
Class 4.9 SG
10 Years

October 2006 14
Fig. 4: Maximum Gross Vehicle Weight (GVW) for Different Axle Configurations