determining fish movements from an "archival" tag: precision of
TRANSCRIPT
NOAA Technical Memorandum NMFS
MAY 1986
DETERMINING FISH MOVEMENTS FROM AN “ARCHIVAL” TAG: PRECISION OF GEOGRAPHICAL
POSITIONS MADE FROM A TIME SERIES OF SWIMMING TEMPERATURE AND DEPTH
Paul Smith
Daniel Goodman
MOAA-TM-NMFS-S WFC-60
U.S. DEPARTMENT OF COMMERCE National Oceanic and Atmospheric Administration
Southwest Fisheries Center National Marine Fisheries Service
NOAA Technical Memorandum NMFS
The National Oceanic and Atmospheric Administration (NOAA), organized in 1970, has evolved into an agency which establishes national policies and manages and conserves our oceanic, coastal, and atmospheric resources. An organizational element within NOAA, the Office of Fisheries is responsible for fisheries policy and the direction of the National Marine Fisheries Service (NMFS).
In addition to its formal publications, the NMFS uses the NOAA Technical Memorandum series to issue informal scientific and technical publications when complete formal review and editorial processing are not appropriate or feasible. Documents within this series, however, reflect sound professional work and may be referenced in the formal scientific and technical literature.
NOAA Technical Memorandum NMFS
This TM series IS used for documentallon and 11mely communuaon ot preltminary results. lmterwn reports. OT
Special purpose intorma110n. and have not recelved complete formal revlew. edtlorlal control. or demled edtting
MAY 1986
DETERMINING FISH MOVEMENTS FROM AN “ARCHIVAL” TAG: PRECISION OF GEOGRAPHICAL
POSITIONS MADE FROM A TIME SERIES OF SWIMMING TEMPERATURE AND DEPTH
Paul Smith Southwest Fisheries Center
National Marine Fisheries Service, NOAA La Jolla, California
Daniel Goodman Montana State University
Department of Biology Bozeman, Montana
NOAA-TM-NMFS-SWFC-60
U.S. DEPARTMENT OF COMMERCE Malcolm Baldrige. Secre tary
National Oceanic and Atmospheric Administration Anthony J. Calio, Administrator
National Marine Fisheries Service William G. Gordon, Assistant Administrator for Fisheries
DETERMINING FISH MDVEMENTS FROM AN ltARCHIVAL'l TAG: PREClSlCFI OF GEOGRAPHICAL POSITIONS MADE FROM A TIME SERIES
OF SW IMMING TEMPERATURE AND DEPTH
Paul Smith1 and Daniel Goodman2
G iven advances i n i n t e g r a t e d c i r c u i t techno logy , it i s p o s s i b l e t o design, b u i I d and depl oy on a f i s h a d e v i c e t h a t woul d col l e c t and s t o r e data on elapsed time, I i g h t in tens i ty , pressure (depth) and temperature. From t h i s i n fo rma t ion it i s t h e o r e t i c a l l y poss ib le t o recons t ruc t a s e r i e s o f geograph ica l p o s i t i o n s v i s i t e d by a f i s h equipped w i t h a device. The t a g (proposed by N o r t h w e s t M a r l ne Technology; d iscussed by Hun te r e t a l . 1986) wou ld r e c o r d t i m e o f sunse t and s u n r i s e f r o m wh ich an e s t i m a t e o f longi tude could be d i r e c t l y made. The t a g would a l so reco rd temperature and depth from which e s t i m a t e s o f l a t i t u d e c o u l d be deduced. How accurate ly these est imates can be made i s dependent both on t h e amount and qual i t y of t h e data col l ec ted and how we1 I sea-surface isotherms p r e d i c t I a t i t ude .
The long i tude es t imate could be made d i r e c t l y from t h e t i m e of sunr ise and sunset, and should r e a d i l y achieve an accuracy of one degree (Table 1). T h i s r e q u i r e s t h a t t h e t a g be capab le o f d i s t i n g u i s h i n g d i f f e r e n c e s i n sunr ise t imes of a t l e a s t f o u r minutes. The engineers suggest t h a t t h i s i s reasonably easy t o a t ta in .
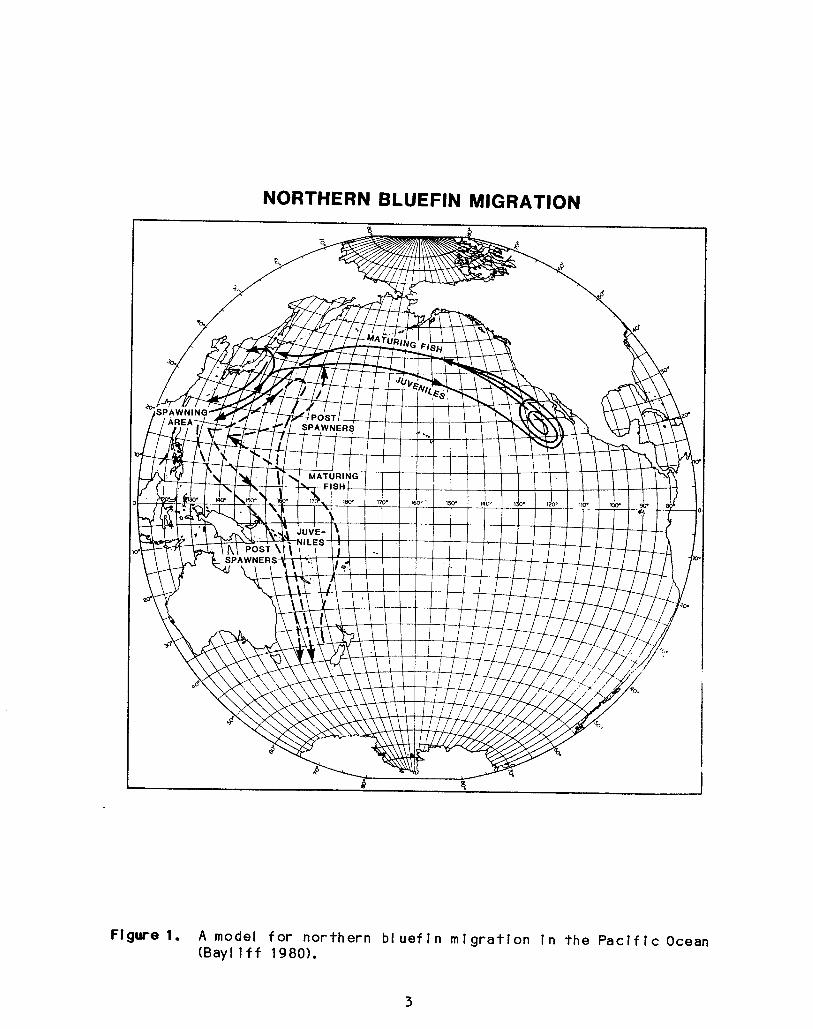
E s t i m a t e s of l a t i t u d e w o u l d be made from t e m p e r a t u r e g r a d i e n t i nformation--both hor izon ta l and v e r t i c a l . I deal ly, t h e temperature f i e l d of t h e Ocean would have s u f f i c i e n t gradient, nor th t o south, t h a t l a t i t u d e could be establ ished--especial l y i f long i tude were known. The o b j e c t i v e of t h i s paper i s t o d e t e r m i n e t h e p r e c i s i o n w i t h wh ich l a t i t u d e c o u l d be es t lmated from simulated temperature and depth recwds, such as those which coul d be s tored i n an a rch i va l tag. As an exampl e we use t h e movements of t h e P a c i f i c n o r t h e r n b l u e f i n tuna. The range o f movements i n c l u d e s an eas t -wes t m i g r a t i o n c o r r i d o r w I t h spawning grounds near t h e w e s t e r n extreme. B l u e f i n a r e caught on bo th s i d e s o f t h e P a c i f i c and I n b o t h hem i spheres, and t h e l r presumed natura l h i s to ry of movements (Bay I i f f 1980; Yamanaka 1984) a r e i n d i c a t e d i n F i g u r e 1 . Al though P a c i f i c n o r t h e r n
Southwest F i sher ies Center NMFS, NOAA, U.S. Department of Commerce La Jol la, Cal i f o r n i a 92038, USA
2Department of B io1 ogy Montana S t a t e Un i v e r s i t y Bozeman, Montana 59717, USA
3The authors wro te t h i s paper t o evaluate an idea t h a t developed dur ing a workshop on e x i s t i n g and new technologies t h a t could be employed t o measure tuna movements. The workshop was one of a se r ies o f t h ree on tuna movements he1 d i n 1985. The t h r e e workshops were j o i n t l y sponsored by t h e I n t e r - American Trop ica l Tuna Commission and t h e Southwest F i she r ies Center of t h e U.S. N a t i o n a l F i s h e r i e s Serv ice . For f u r t h e r d e t a i l s r e g a r d i n g t h e workshops see Hunter e t al. 1986.
1
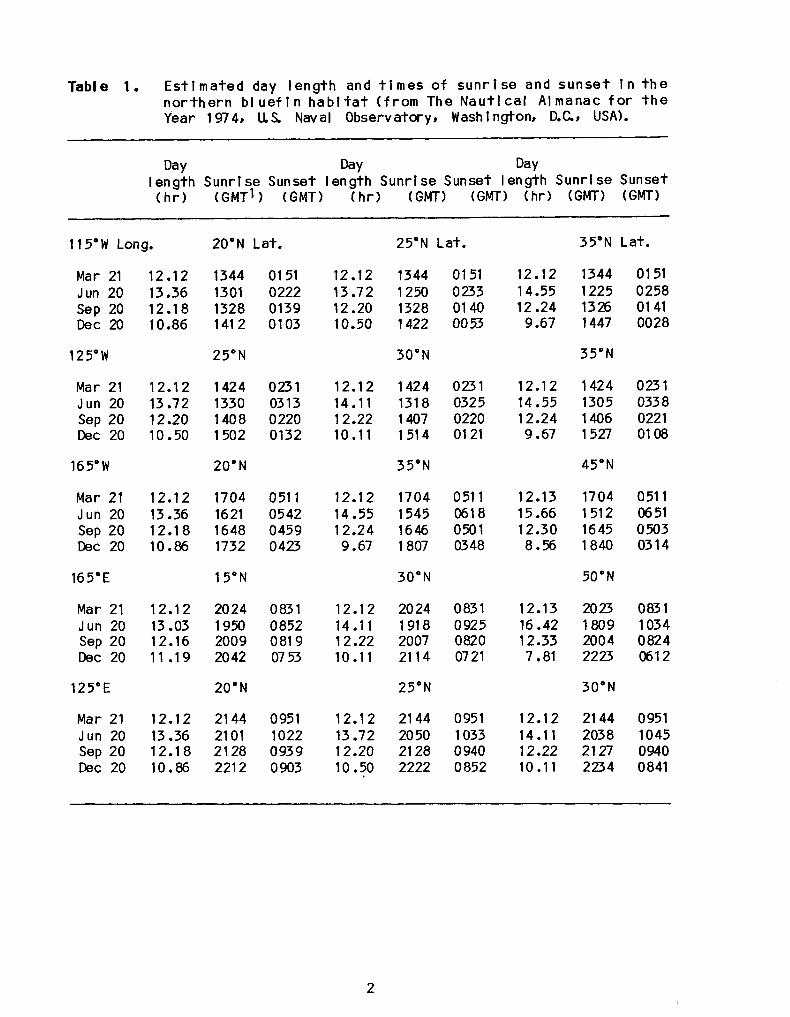
Table 1. E s t i m a t e d day length and t i m e s o f sunr i se and sunset I n t h e n o r t h e r n b l u e f i n h a b i t a t ( f r o m The N a u t i c a l Almanac f o r t h e Year 1974, US Naval Observatory, Washington, D.C, USA).
\
Day Day Day I ength Sunri se Sunset I ength Sunri se Sunset I ength Sunrise Sunset ( h r ) (GMT1) (GMT) ( h r ) (GMT) (GMT) (h r ) (GMT) (GMT)
~
11 5"W Long. 20" La*.
Mar 21 Jun 20 Sep 20 Dec 20
125'W
Mar 21 Jun 20 Sep 20 Dec 20
165"W
Mar 21 Jun 20 Sep 20 Dec 20
16 5" E
Mar 21 Jun 20 Sep 20 Dec 20
125'E
Mar 21 Jun 20 Sep 20 Dec 20
12.12 13.36 12.18 10.86
12.1 2 13.72 1 2.20 10.50
12.1 2 13.36 12.18 10.86
12.12 13.03 12.16 11.19
12.1 2 13.36 12.18 10.86
1344 1301 1328 141 2
25"
1424 1330 1408 1502
20'N
1704 1621 1648 1732
15"
20 24 1950 2009 20 42
20"
21 44 21 01 21 28 221 2
01 51 0222 0139 01 03
0231 0313 0220 0132
051 1 0542 0459 0 423
083 1 0 852 081 9 07 53
0951 1022 0939 0 903
12.12 13.72 12.20 10.50
12.12 14.11 12.22 10.1 1
12.12 14.55 12.24 9.67
12.12 14.11 12.22 10.1 1
12.12 13.72 12.20 10.50
25" La+. 35" Lat.
1344 1250 1328 1422
30"
1424 131 8 1407 1514
35"N
1704 1545 1646 1807
30"
20 24 1 91 8 2007 2114
25"
21 44 20 50 21 28 2222
01 51 0233 01 40 00 53
0231 032 5 0220 01 21
051 1 061 8 0501 0348
083 1 0925 0820 0721
0951 1033 0 940 0 852
12.12 14.55 12.24 9.67
12.12 14.55 12.24 9.67
12.13 15.66 12.30 8.56
12.13 16.42 12.33 7.81
12.1 2 14.11 12.22 10.1 1
1344 1225 1326 1447
35"N
1424 1305 1406 1527
45"N
1704 1512 1645 1840
50"N
20 23 1809 2004 2223
30"
21 44 203 8 21 27 2234
01 51 0258 01 41 0028
0231 033 8 0221 01 08
051 1 06 51 0503 0314
083 1 1034 0824 061 2
0951 1045 0 940 0841
2
NORTHERN BLUEFIN MIGRATION m
Figure 1. A model f o r n o r t h e r n b l u e f i n m i g r a t i o n I n t h e P a c i f i c Ocean (Bay1 i f f 1980).
3
b l u e f I n have n o t been t r a c k e d u s i n g s o n i c tags, a l I a c o u s t i c t r a c k i n g s tud ies on tunas, i n c l u d i n g A t l a n t i c b l u e f i n (Carey and Lawson 1973; Carey and Olson 19821, i nd i ca te t h a t they make ex tens ive v e r t i c a l movements from t h e s u r f a c e t o t h e t h e r m o c l i n e d u r i n g t h e cou rse o f a day (Hunter e t a l . 1986) and a r e I l k e l y t o sampl e most of t h e depth range on reasonably sho r t i n t e r v a l s (hours) .
I n i t i a l ly, we subdivided t h e east-west m i g r a t i o n c o r r i d o r i n t h e nor th P a c i f i c i n t o c e l l s 2 degrees on a side; t h e l ong i tud ina l assignment (I.&, ass ignment t o a p a r t i c u l a r col umn o f c e l I s ) was based on t h e t i m e of sunr ise a- sunset. Given t h e i d e n t i t y of the column, the problem i s then one of dec id ing among t h e approximately 10 ce l I s i n t h a t column.
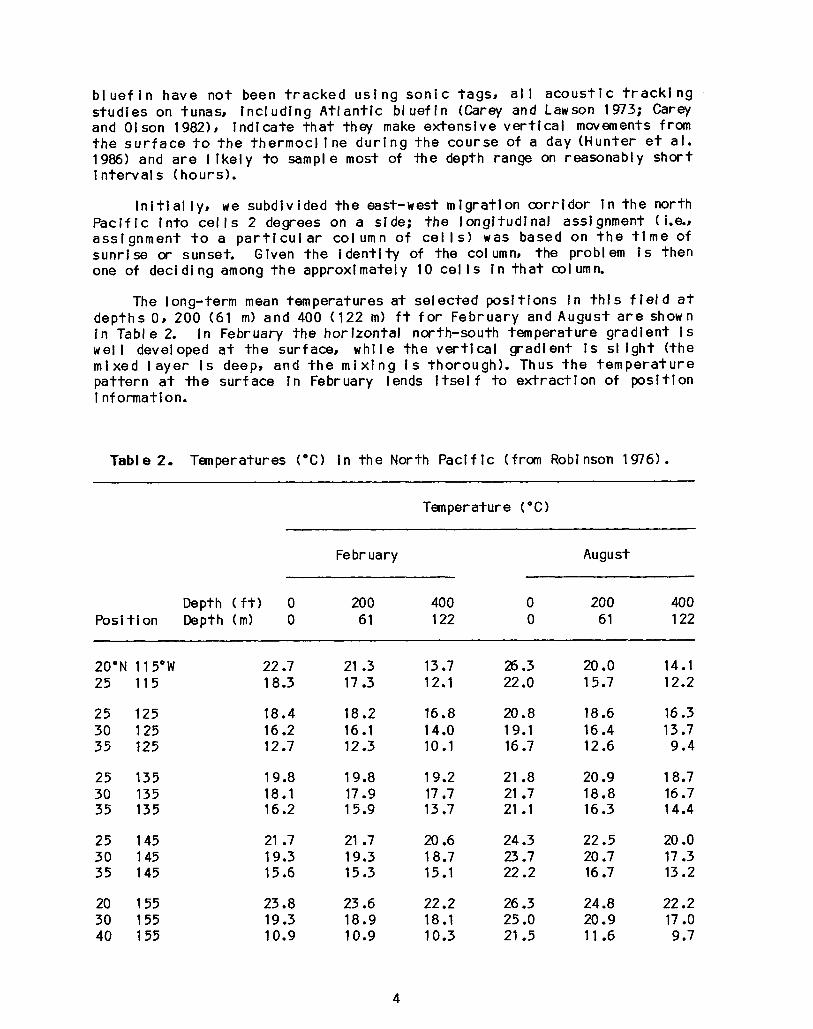
The long-term mean temperatures a t se lec ted pos i t i ons i n t h i s f i e l d a t depths 0, 200 (61 m) and 400 (122 m) f t f o r February and August a r e shown in Table 2. I n February t h e ho r i zon ta l north-south temperature grad ien t i s we1 I developed a t t h e surface, w h i l e t h e v e r t i c a l g rad ien t I s SI i g h t ( t he m ixed l a y e r i s deep, and t h e m i x i n g I s thorough) . Thus t h e t e m p e r a t u r e pa t te rn a t t h e sur face i n February lends i t s e l f t o e x t r a c t i o n of p o s i t i o n i nformation.
Table 2. Temperatures ('C) i n t h e North Pac i f i c (from Robinson 1976).
Temperature ("C)
Fe br uary August
Depth ( f t ) 0 200 40 0 0 200 400 Pos i t i on Depth ( m ) 0 61 1 22 0 61 122
20" 115'W 22.7 21 .3 13.7 26.3 20 .o 14.1 25
25 30 35
25 30 35
25 30 35
20 30 40
115
125 125 125
135 135 135
145 145 145
155 155 155
18.3
18.4 16.2 12.7
19.8 18.1 16.2
21 .7 19.3 15.6
23.8 19.3 10.9
17.3
18.2 16.1 12.3
19.8 17.9 15.9
21 .7 19.3 15.3
23.6 18.9 10.9
12.1
16.8 14.0 10.1
19.2 17.7 13.7
20.6 18.7 15.1
22.2 18.1 10.3
22 .o
20.8 19.1 16.7
21.8 21 .7 21.1
24.3 23.7 22.2
26.3 25 .O 21.5
15.7
18.6 16.4 12.6
20.9 18.8 16.3
22.5 20.7 16.7
24.8 20.9 11 .6
12.2
16.3 13.7 9.4
18.7 16.7 14.4
20 .o 17.3 13.2
22.2 17 .O 9.7
4

Table 2. (continued)
20 165 24.8 35 165 14.6 45 165 7.4
20 175 25.1 30 175 '1 9.0 40 175 11.3
25" 175'E 23.1 30 40
20 35 40
20 30 45
15 30 50
20 30
20 25 30
17 5 17 5
165 165 165
155 155 155
145 145 145
135 135
125 125 125
18.7 10.3
25.9 16.2 8.4
25.8 19.9 1.6
27.6 19.0 -1.7
25.2 19.1
25.7 22.7 13.0
24.6 14.4 7.3
24.6 18.2 11.2
22.3 18.4 10.3
25.5 16.2 9.3
25.7 19.4 1.4
27.4 18.7 -1 .7
24.8 19.1
24.7 22.4 13 .O
23.5 13.9 7.2
23.5 17.3 11.1
20.3 17.8 10.2
23.4 15.7 8 .O
23.4 18.6 1.5
25.6 18.3 -1.7
23.5 19.4
23 .O 21.7 -
27.2 24.4 14.8
27.4 26.4 21 .6
28.4 27.2 21.3
28.4 25.4 20.7
29.1 26.9 . 13.5
29.6 27.5 12.3
29.2 28.8
29.7 29.2 28.2
26 .O 15.6 7.5
26.6 19.8 12.3
24.1 20.2 13.5
27.1 18.6 12.7
27 .O 19.9 2.3
27.9 22.4 -0.5
26.8 23.8
28.2 27.1 19.0
22.8 13.3 6.7
23.1 17.2 11.3
20.3 17.3 11.7
23.7 15.5 1 1 .o
23.8 17.5 1.8
26.5 19.2 -1 .o
24.7 20.6
24.1 23.4 -
In August, how ever, t h e hor l zon ta l north-south temperature grad ien t a t the sur face i s less d i s t i n c t . The depth o f t h e thermocl i n e ranges through t h e m i d d l e depths, 50-200 ft (15-61 m), a t t h i s t i m e i n a somewhat c o n v o l u t e d p a t t e r n . There i s reason t o s u s p e c t t h a t t h e i n t e r a n n u a l v a r i a t i o n I n depth o f t h e thermocl Ine may be appreciable. Thus, t h e 400 f t depth i s probably more s u i t a b l e for e x t r a c t i n g l a t i t u d i n a l i n fo rma t ion i n August.
I n genera l , it w o u l d be w i s e t o a v o i d d r a w i n g I n f e r e n c e s about l a t i t u d e from temperature-depth s t r u c t u r e a t depths near t h e thermocl i ne, s ince t h e p o s i t i o n o f t h e thermucl ine may vary from year t o year, and t h e measurement e r r o r i n e s t i m a t i n g depth c rea tes I arger uncer ta l n l y where t h e temperature changes r a p i d l y w i th depth. The usual depth of the mixed 1 ayer a t se lec ted pos i t i ons i n the no r th P a c l f l c i s shown i n Table 3 a t i n t e r v a l s of two months.
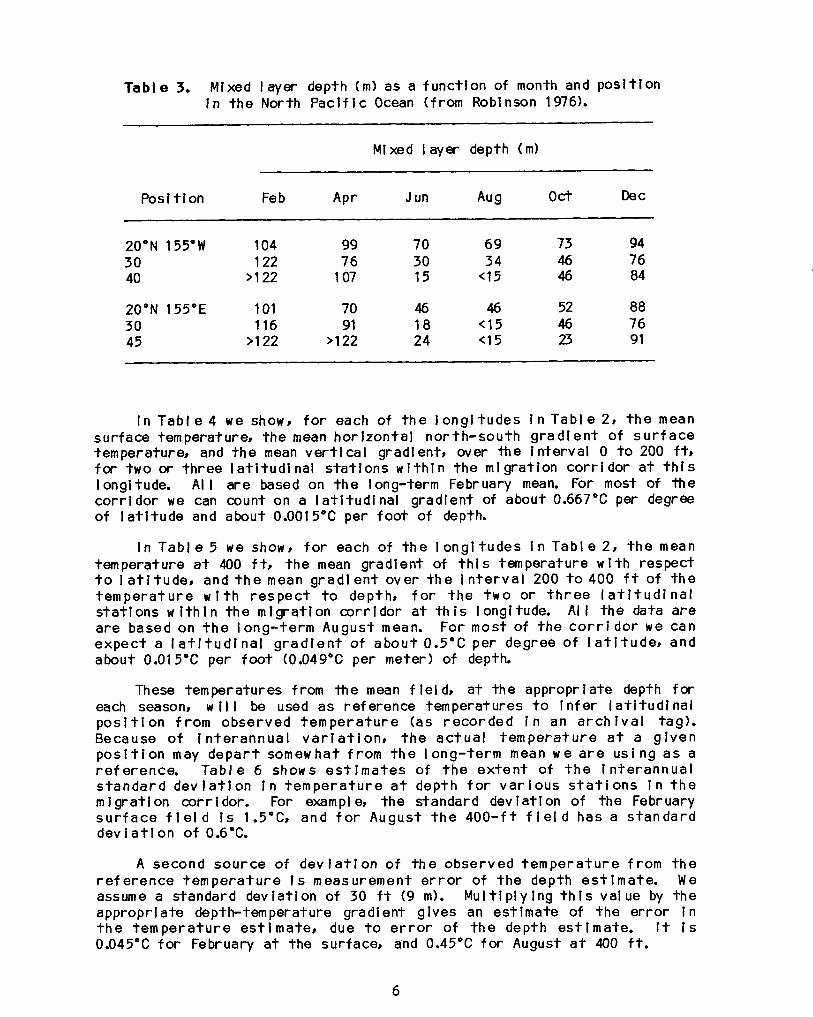
Table 3. Mixed layer depth ( m ) as a f u n c t i o n o f month and p o s i t i o n i n t h e Nor th P a c i f i c Ocean (from Robinson 1976).
M i xed I ayer depth (m)
P o s i t i o n Feb A P r J un Au 9 OCt DeC
20"N 155'W 104 99 70 69 73 94 30 122 76 30 34 46 76 40 >122 107 15 <15 46 84
20'N 155'E 101 70 46 46 52 08 30 116 91 18 (15 46 76 45 >122 >122 24 (1 5 23 91
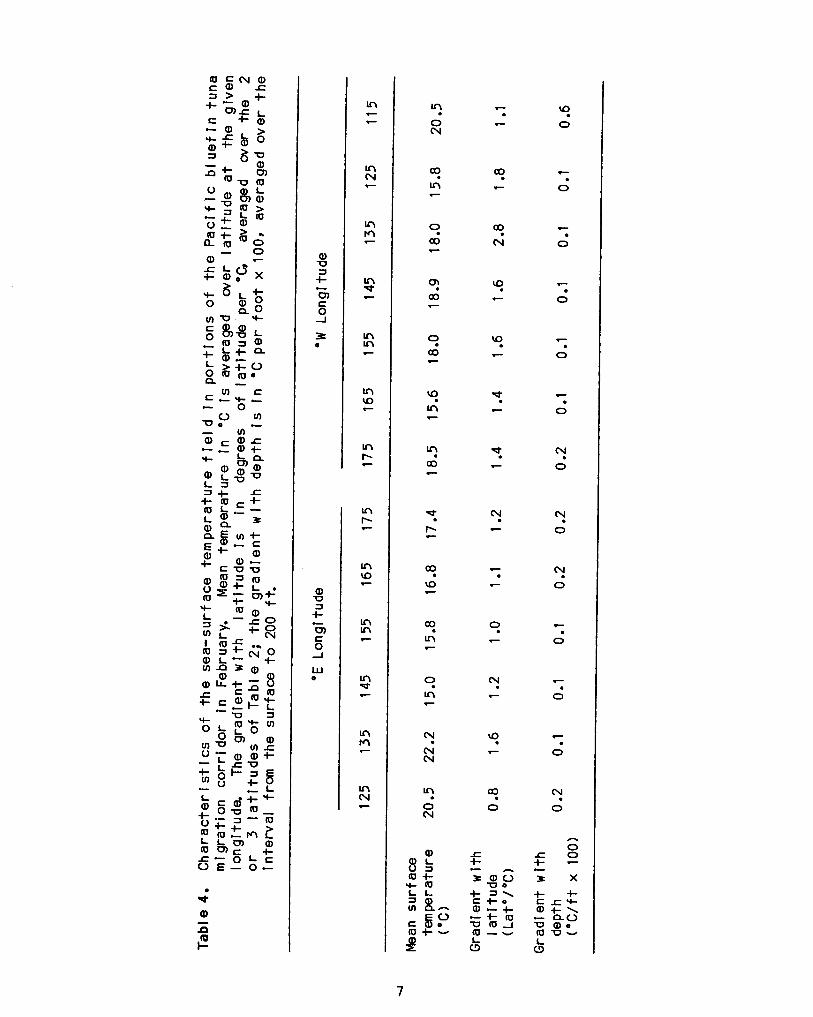
I n Tab1 e 4 we show, for each of t h e l o n g i t u d e s i n T a b l e 2, t h e mean sur face temperature, t h e mean h o r i z o n t a l n o r t h - s o u t h g r a d i e n t of s u r f a c e temperature, and t h e mean v e r t i c a l gradient, over t h e In te rva l 0 t o 200 ft, for two or t h r e e l a t i t u d i n a l s t a t i o n s w i t h i n t h e m ig ra t i on c o r r i d o r a t t h i s longitude. A I I a re based on t h e long-term February mean. For most of t h e c o r r i d o r we can count on a l a t i t u d i n a l g rad ien t of about 0.667'C per degree o f l a t i t u d e and about 0.0015'C per f o o t of depth.
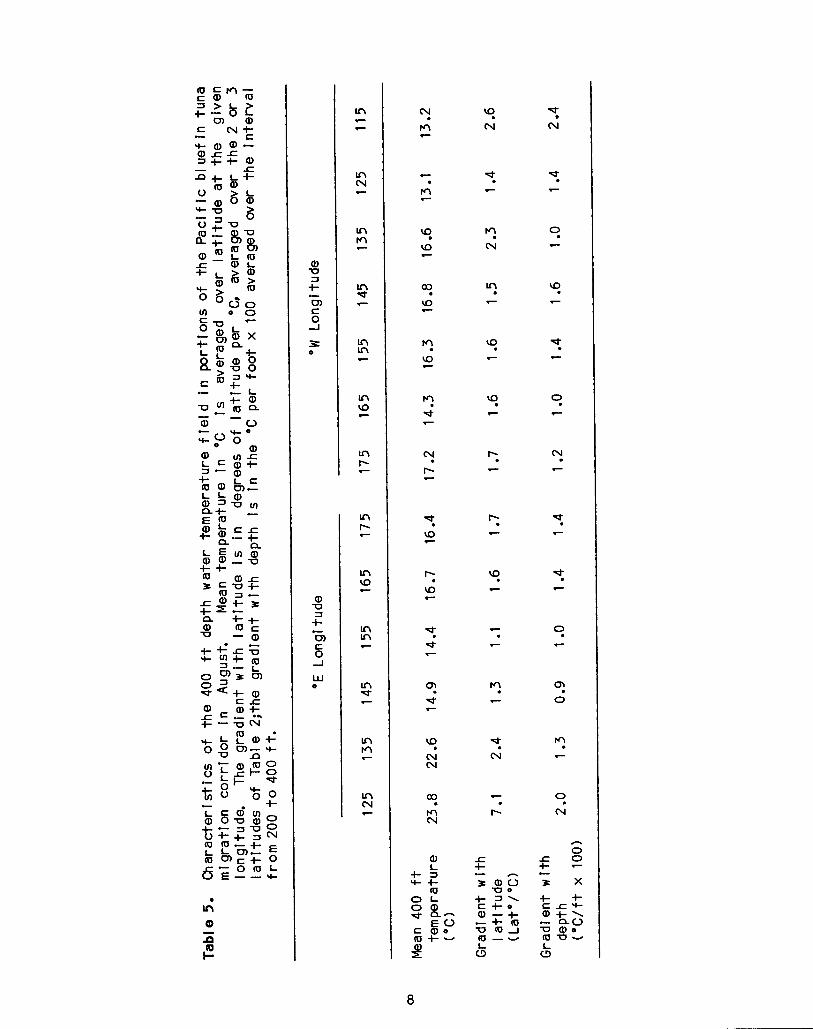
I n Tab1 e 5 we show, for each of t h e long1 tudes I n Tab1 e 2, t h e mean temperature a t 400 ft, t h e mean grad ien t of t h i s temperature w i t h respect t o I a t 1 tude, and t h e mean g r a d i e n t ove r t h e 1 n t e r v a l 200 t o 400 f t o f t h e t e m p e r a t u r e w i t h r e s p e c t t o depth, fo r t h e two or t h r e e l a t i t u d i n a l s t a t i o n s w i t h i n t h e m i g r a t i o n m r r i d o r a t t h i s longitude. A l l t h e data a r e a r e based on t h e l ong - te rm August mean. For most of t h e c o r r i dor we can e x p e c t a I a t i t u d i na l g r a d i e n t of a b o u t 0.5'C pe r degree o f I a t i t U d e t and about 0.015'C per foot (0.049'C per meter) of depth.
These temperatures from t h e mean f le1 d, a t t h e appropr ia te depth for each season, w I I I be used as reference temperatures t o i n f e r I a t i t u d i nal p o s i t i o n f rom observed t e m p e r a t u r e (as r e c o r d e d i n an a r c h i v a l tag). Because of i n t e r a n n u a l v a r i a t i o n , t h e a c t u a l t e m p e r a t u r e a t a g i v e n p o s i t i o n may d e p a r t somewhat from t h e l ong - te rm mean we a r e u s i n g a s a re fe rence . T a b l e 6 shows e s t i m a t e s of t h e e x t e n t o f t h e i n t e r a n n u a l s t a n d a r d d e v i a t l o n i n t e m p e r a t u r e a t depth f o r v a r i o u s s t a t i o n s i n t h e m i g r a t i o n cor r idor . For example, t h e standard dev ia t i on of the February s u r f a c e f i e l d i s 1.5'CI and fo r August t h e 4 0 0 - f t f i e l d has a s t a n d a r d d e v i a t i o n o f 0.6'C.
A second s o u r c e o f d e v i a t i o n of t h e observed t e m p e r a t u r e f r o m t h e r e f e r e n c e t e m p e r a t u r e i s measurement e r r o r of t h e depth e s t i m a t e . We assume a standard dev ia t ion of 30 f t (9 m). M u l t i p l y i n g t h i s va lue by t h e appropr ia te depth-temperature gradient g ives an es t imate o f t h e e r r o r i n t h e t e m p e r a t u r e es t ima te , due t o e r r o r o f t h e depth es t ima te . I t i s 0.045'C for February a t t h e surface, and 0.45'C for August a t 400 f t .
6
a, U 1 t cn
-I
z
- 5
0
a, U 3 t 0)
-I
w
- 5
0
In e c
In N e
In M e
In * c
In In e
In ID e
In I- e
m I- C
In ID e
In In e
In * c
In M e
In N e
7
? e
? N
'4 .-
'4 e
9 c
cv. c
9 e
'4 0
c . 0
.- e 0
7 . 0
e . 0
e
0
cv. 0
cv. 0
cv. 0
c
0
e . 0
e
0
cv. 0
h
0 s E
L Z - nu -0 @ow
- z x
a t \ (DV L a
Q) -0 J t m
-J
W
- 5
0
In N e
In M e
In d~ .-
In Ln
In u3 e
Ln I- c
In I- .-
m u3 e
In Ln - In d c
In M e
In N -
cv. M e
e
M,
'9 Io .-
c9 2
M. 2
M. d
cv. I- - b. 2
Y \D c
-? d e
s d .-
'9 N N
5 M N
a L
t 3 + t
(I] O L 0 d 8%-
E O := 8
'9 N
-? .-
M. N
L? .-
'9 c
'9 c
'I e
'I e
'9 e
.-
.-
M. 7
r t
-? N
- I-
bcDp + J \ i= t o - a - t -t (I] 23 (I]J (I]-- L (3
-? N
-? .-
9 7
'9 .-
-? c
9
N. .-
-? c
-? e
9 e
0'. 0
M. .-
9 CY
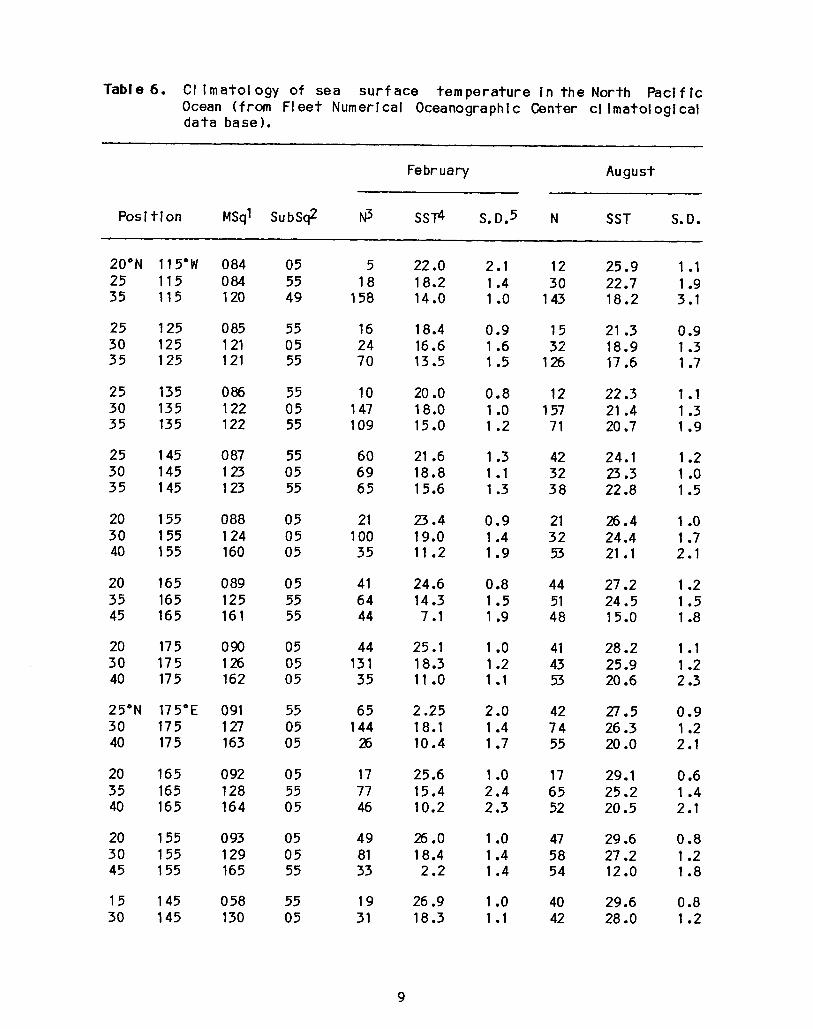
Table 6. CI imatol ogy of sea sur f ace temperature i n t h e North Paci f i c Ocean (from F l e e t Numerical Oceanographic Center cl lmatological data base 1.
February August
Posit ion MSql SubSq;! N3 S S f l S.D.5 N SST S. D.
20"N 115"W 084 05 25 115 084 55 35 115 120 49
5 18
158
22 .o 18.2 14 .O
2.1 12 1.4 30 1 .o 143
25.9 22.7 18.2
1.1 1.9 3.1
25 125 0 85 55 30 125 121 05 35 125 121 55
16 24 70
18.4 16.6 13.5
0.9 15 1 .6 32 1.5 126
21.3 18.9 17.6
0.9 1.3 1.7
25 135 086 55 30 135 122 05 35 135 122 55
10 147 109
20 .o 18.0 15.0
0.8 12 1.0 157 1.2 71
22.3 21.4 20.7
1.1 1.3 1.9
25 145 0 87 55 30 145 123 05 35 145 123 55
60 69 65
21 .6 18.8 15.6
1.3 42 1.1 32 1.3 3 8
24.1 23.3 22.8
1.2 1 .o 1.5
20 155 088 05 30 155 124 05 40 155 160 05
21 100 35
23.4 19.0 11.2
0.9 21 1.4 32 1.9 53
26.4 24.4 21.1
1 .o 1 .7 2.1
20 165 0 89 05 35 165 125 55 45 165 161 55
41 64 44
24.6 14.3 7.1
0.8 44 1.5 51 1 .9 48
27.2 24.5 15.0
1.2 1.5 1.8
20 17 5 090 05 30 175 126 05 40 175 162 05
44 131 35
25.1 18.3 11 .o
1 .o 41 1.2 43 1.1 53
28.2 25.9 20.6
1.1 1.2 2.3
25"N 175"E 091 55 30 175 1 27 05 40 17 5 163 05
65 144
25
2.25 18.1 10.4
2 .o 42 1.4 7 4 1 .7 55
27.5 26.3 20 .o
0.9 1.2 2.1
20 165 0 92 05 35 165 128 55 40 165 164 05
17 77 46
25.6 15.4 10.2
1 .o 17 2.4 65 2.3 52
29.1 25.2 20.5
0.6 1.4 2.1
20 155 0 93 05 30 155 129 05 45 155 165 55
49 81 33
26 .O 18.4 2.2
1 .o 47 1.4 58 1.4 54
29.6 27.2 12 .o
0.8 1.2 1.8
15 145 0 58 55 30 145 130 05
19 31
26.9 18.3
1 .o 40 1.1 42
29.6 28 .O
0.8 1.2
9
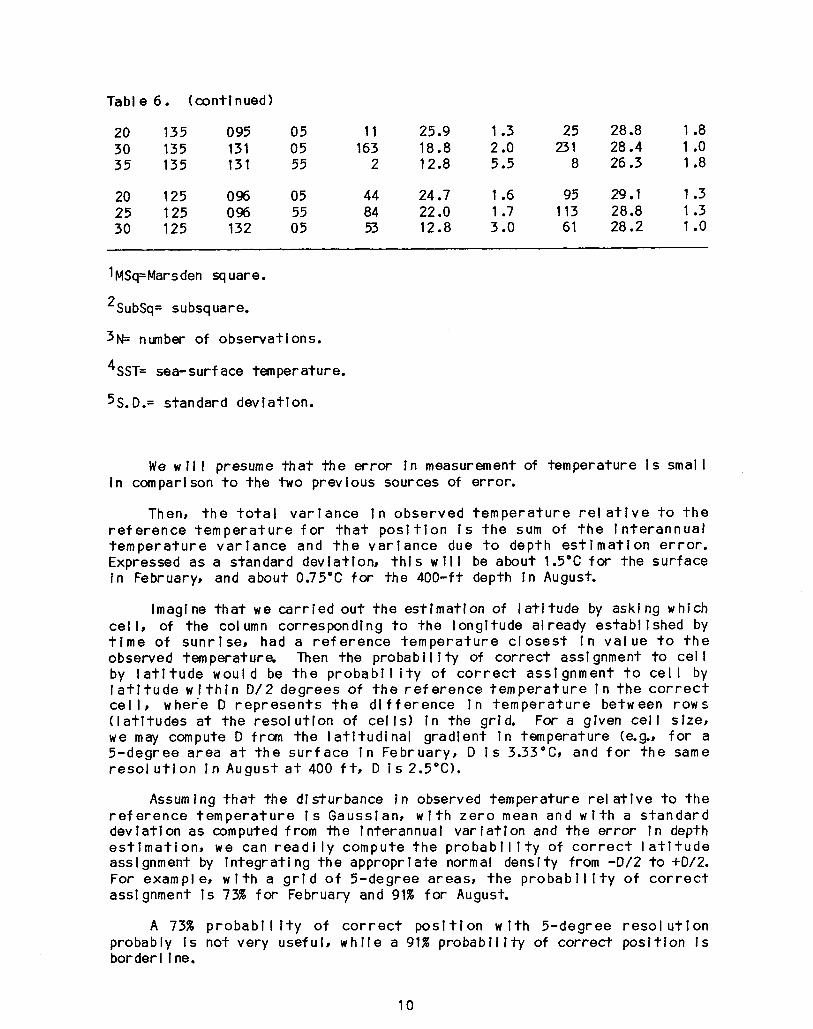
Tab1 e 6. (continued)
20 135 0 95 05 11 25.9 1.3 25 28.8 1.8 30 135 131 05 163 18.8 2 .O 231 28.4 1 .o 35 135 131 55 2 12.8 5.5 8 26.3 1.8
20 125 0% 05 44 24.7 1 .6 95 29.1 1.3 25 125 0% 55 84 22 .o 1.7 113 28.8 1.3 30 125 132 05 53 12.8 3 .O 61 28.2 1 .o
1MSq=Marsden square.
'SubSq= subsq uare.
3N= number of observations.
4SST= sea-surf ace temperature.
5s. D.= standard dev iat ion.
We w 11 I presume t h a t t h e e r r o r i n measurement of temperature i s smal I i n comparison t o t h e two previous sources of er ror .
Then, t h e t o t a l v a r i a n c e i n observed t e m p e r a t u r e r e l a t i v e t o t h e r e f e r e n c e t e m p e r a t u r e f o r t h a t p o s i t i o n i s t h e sum of t h e i n t e r a n n u a l t e m p e r a t u r e v a r i a n c e and t h e v a r i a n c e due t o depth e s t i m a t i o n e r r o r . Expressed as a standard deviat ion, t h i s w II I be about 1.5"C for t h e sur face i n February, and about 0.75"C for t h e 400-ft depth i n August.
Imagine t h a t we c a r r i e d o u t t h e es t ima t ion of l a t i t u d e by ask ing which ce l I, of t h e col umn corresponding t o t h e long i tude already establ ished by t i m e of sunr ise , had a r e f e r e n c e t e m p e r a t u r e c l o s e s t i n v a l u e t o t h e observed temperature. Then t h e probabi l i t y of c o r r e c t assignment t o ce l I by l a t i t u d e woul d be t h e probab i I i t y o f c o r r e c t ass ignment t o c e l I by l a t i t u d e w i t h i n D/2 degrees of t h e r e f e r e n c e t e m p e r a t u r e i n t h e c o r r e c t c e l I , where D r e p r e s e n t s t h e d i f f e r e n c e I n t e m p e r a t u r e between rows ( l a t i t u d e s a t t h e r e s o l u t i o n of c e l l s ) I n the grid. For a given c e l l size, we may compute D f rom t h e l a t i t u d i n a l g rad ien t i n temperature (e.g., f o r a 5-degree a rea a t t h e s u r f a c e i n February, D i s 3.33OCJ and f o r t h e same r e s o l u t l o n i n August a t 400 f tJ D i s 2.5'C).
Assuming t h a t t h e disturbance I n observed temperature re1 a t i v e t o t h e r e f e r e n c e t e m p e r a t u r e i s Gaussian, w i t h z e r o mean and w i t h a s t a n d a r d dev ia t i on as computed from t h e interannual v a r i a t i o n and t h e e r r o r I n depth e s t i m a t i o n , we can r e a d i l y compute t h e p robab i I i t y of c o r r e c t I a t i t u d e assignment by i n t e g r a t i n g t h e appropr ia te normal density from -D/2 t o +D/2. For example, w i t h a g r i d o f 5-degree areas, t h e p r o b a b i l i t y o f c o r r e c t assignment i s 73% for February and 91% f o r August.
A 73% p robab i I i t y of c o r r e c t p o s i t i o n w i t h 5-degree r e s o l u t i o n probably i s n o t very useful, w h i l e a 91% p r o b a b i l i t y o f c o r r e c t p o s i t i o n i s border1 ine.
10
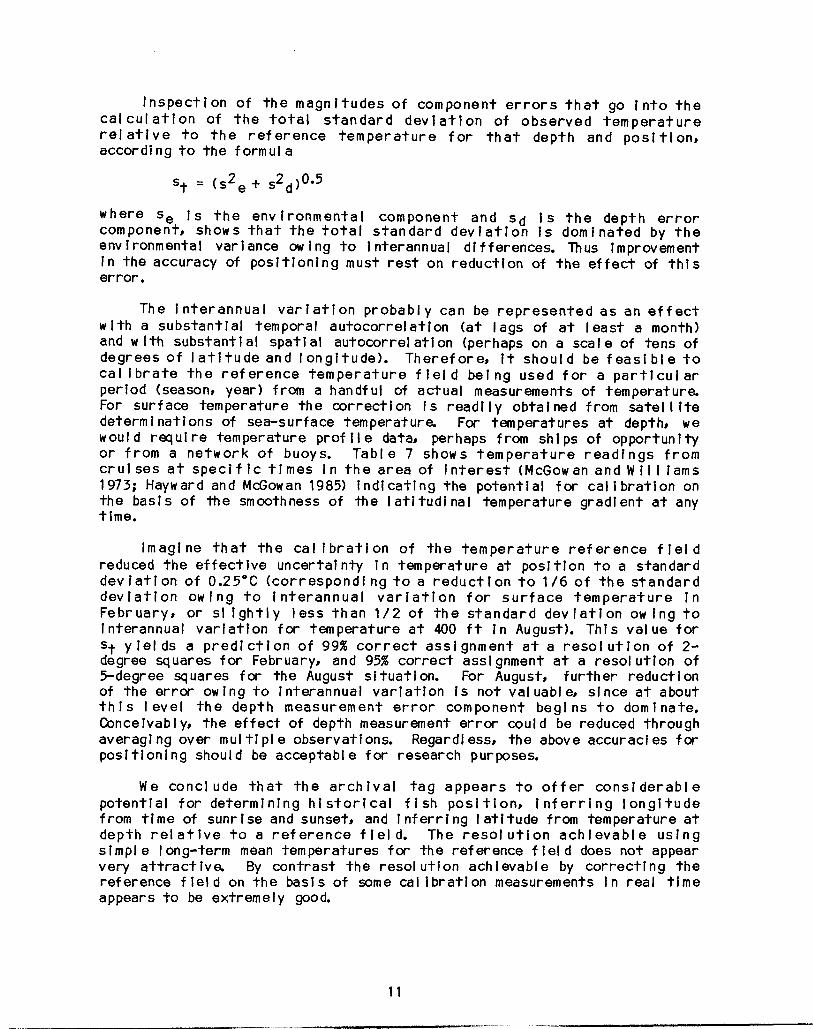
I n s p e c t i o n of t h e magn i tudes of component e r r o r s t h a t go i n t o t h e c a l c u l a t i o n o f t h e t o t a l s t a n d a r d d e v i a t i o n of obse rved t e m p e r a t u r e r e 1 a t i v e t o t h e r e f e r e n c e t e m p e r a t u r e f o r t h a t depth and p o s l t i o n , accord ing t o t h e fo rmu la
where Se I s t h e env i ronmen ta l component and s d I s t h e depth e r r o r component, shows t h a t t h e t o t a l s t a n d a r d d e v i a t i o n i s dominated by t h e env I ronmental var I ance ow i ng t o i nterannual dif ferences. Thus improvement i n t h e accuracy o f p o s i t i o n i n g must r e s t on reduc t ion of t h e e f f e c t of t h i s e r ro r .
The i n t e r a n n u a l v a r i a t i o n p r o b a b l y can be r e p r e s e n t e d a s an e f f e c t w i t h a subs tan t ia l temporal au toco r re la t i on ( a t lags o f a t l e a s t a month) and w i t h subs tan t ia l spa t i a l autocorre l a t i o n (perhaps on a scat e of tens of degrees o f l a t i t u d e and l o n g i t u d e ) . There fore , it shou ld be f e a s i b l e t o c a l i b r a t e t h e r e f e r e n c e t e m p e r a t u r e f i e l d b e i n g used f o r a p a r t i c u l a r per iod (season, year) from a handful of actua l measurements o f temperature. For sur face temperature t h e co r rec t i on i s r e a d i l y obta ined from sate l I i t e determl na t ions of sea-surface temperature. Far temperatures a t depth, we would r e q u i r e temperature prof i l e data, perhaps from ships of oppor tun i ty o r from a n e t w o r k of buoys. T a b l e 7 shows t e m p e r a t u r e r e a d f n g s f rom c r u l s e s a t s p e c i f i c t i m e s i n t h e a rea of i n t e r e s t (McGowan and W i l I lams 1973; Hayward and Mdowan 1985) i n d i c a t i n g t h e po ten t i a l for ca l I b r a t i o n on t h e bas is of t h e smoothness of t h e l a t i t u d i n a l temperature grad ien t a t any t ime.
lmagi ne t h a t t h e c a l i b r a t i o n of t h e t e m p e r a t u r e r e f e r e n c e f i e l d reduced t h e e f f e c t i v e uncer ta in ty i n temperature a t p o s i t i o n t o a standard d e v i a t i o n of 0 2 5 ° C ( c o r r e s p o n d i n g t o a r e d u c t i o n t o 1/6 of t h e s tandard d e v i a t i o n o w i n g t o i n t e r a n n u a l v a r i a t i o n f o r s u r f a c e t e m p e r a t u r e i n February, o r S I i g h t l y l e s s t h a n 1 / 2 o f t h e s t a n d a r d d e v i a t i o n o w i n g t o interannual v a r i a t i o n for temperature a t 400 f t i n August). Th i s va lue for S t y i e l d s a p r e d i c t i o n o f 99% c o r r e c t ass ignment a t a r e s o l u t i o n of 2- degree squares for February, and 95% c o r r e c t assignment a t a resol u t i o n of 5-degree squares f or t h e August s i tua t ion . For August, f u r t h e r reduc t ion of t h e e r r o r owing t o interannual v a r i a t i o n i s n o t valuable, s ince a t about t h i s I eve1 t h e depth measurement e r r o r component beg1 ns t o dominate. Conceivably, t h e e f f e c t of depth measurement e r r o r could be reduced through averagi ng over mu1 ti pl e observations. Regardl ess, t h e above accuraci es f OT p o s i t i o n i n g should be acceptable for research purposes.
We conc l ude t h a t t h e a r c h i v a l t a g appears t o o f f e r c o n s i d e r a b l e po ten t i a l for determin ing h i s t o r i c a l f i s h p o s i t i o n , i n f e r r i n g l o n g i t u d e from t i m e of sunr ise and sunset, and i n f e r r i n g l a t i t u d e from temperature a t depth r e l a t i v e t o a r e f e r e n c e f i e l d . The r e s o l u t i o n a c h i e v a b l e u s i n g simp1 e long-term mean temperatures for t h e reference f i e l d does no t appear very a t t r a c t i v e . By con t ras t t h e resol u t i o n achievable by c o r r e c t i n g t h e reference f i e l d on t h e bas is of some cal i b r a t i o n measurements i n rea l t i m e appears t o be ext remely good.
11
-- . - _I_
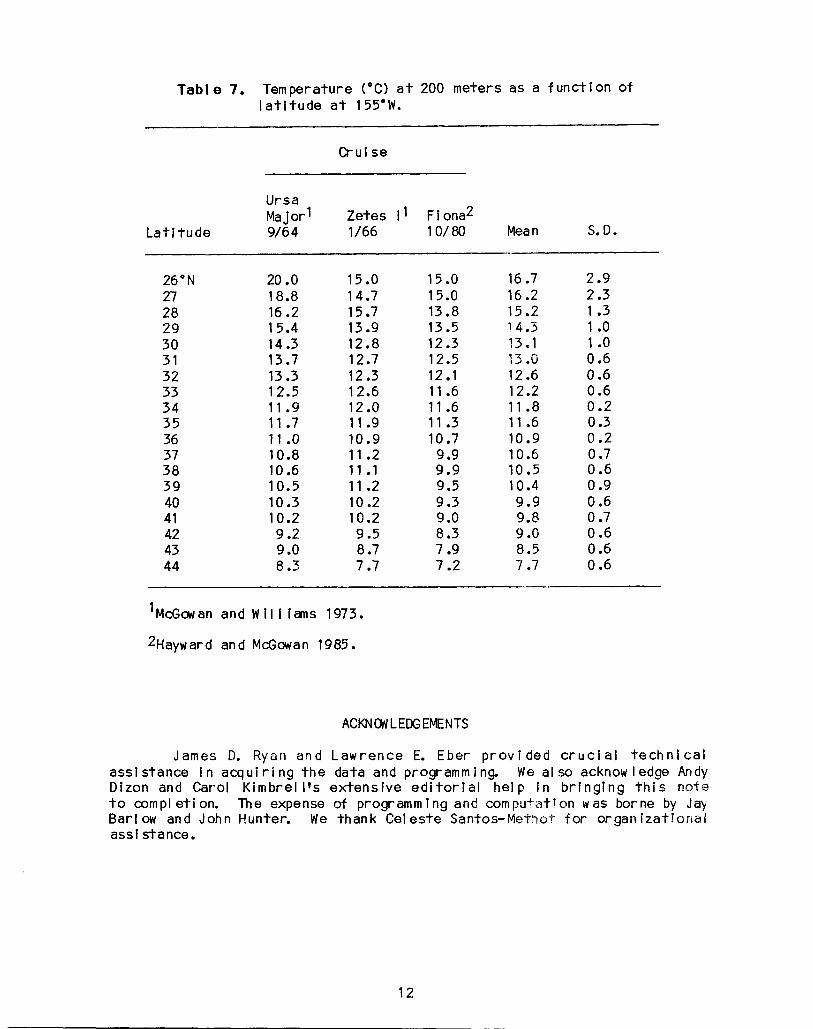
Table 7 . Temperature ('C) a t 200 meters as a f u n c t i o n of l a t i t u d e a t 155"W.
Crul se
Ursa Maiorl Zetes I 1 Fiona2
Lati t ude 9/; 4 1/66 10/80 Mea n S. D.
26"N 27 28 29 30 31 32 33 34 35 36 37 38 39 40 41 42 43 44
20 .o 18.8 16.2 15.4 14.3 13.7 13.3 12.5 11.9 11.7 1 1 .o 10.8 10.6 10.5 10.3 10.2 9.2 9 .o 8.3
15.0 14.7 15.7 13.9 12.8 12.7 12.3 12.6 12.0 11.9 10.9 11.2 11 .1 11.2 10.2 10.2 9.5 8.7 7.7
15.0 15.0 13.8 13.5 12.3 12.5 12.1 11.6 1 1 .6 11.3 10.7 9.9 9.9 9.5 9.3 9 .o 8.3 7.9 7.2
16.7 16.2 15.2 1 f te3 13.1 13 .o 12.6 12.2 11.8 11 .6 10.9 10.6 10.5 10.4 9.9 9.8 9 .o 8.5 7.7
2.9 2.3 1.3 1 .o 1 .o 0.6 0.6 0.6 0.2 0.3 0.2 0.7 0.6 0.9 0.6 0.7 0.6 0.6 0.6
'MCGwan and W I1 I ims 1973.
2Hayward and McGcwan 1985.
ACKN Cw L EDG EMENTS
James D. Ryan and Lawrence E. Eber p r o v i d e d c r u c i a l t e c h n i c a l ass1 stance I n acqui r l ng t h e data and programming. We al so acknow ledge Andy Dizon and Carol Kimbrel 1's extens ive e d i t o r i a l he lp i n b r i ng ing t h i s note t o completion. The expense of programming and computation was borne by Jay Bar1 ow and John Hunter. We thank Celeste Santos-Methot f o r organ iza t lo r ia l assistance.
12

L I TERATURE C I TED
BAYL I FF, W. H. 1980. Synopsis of b io log i ca l data on t h e northern b l u e f i n tuna,
Thunnus t h y n n e (Linnaeus, 17581, i n the P a c i f i c Ocean. In te r - Amer. Trop. Tuna Comm., Spec. Rep. 2:261-293.
CAREY, F.G., and K.D. LAWSON. 1973. Temperature r e g u l a t i o n i n free-swimming b lue f i n tuna. Cbmp.
Biochem. Physiol. 44A: 375-392.
CAREY, F.G., and R.J. OLSON. 1982. Sonic d-racki ng exper imen ts w i t h tunas. I n t . Comm. Conserv.
A t l . Tunas C o l l e c t . Vol. Scl. Pap., 17:458-466.
YAYWARD, T.L. and J .A. McGCWAN. 1985. S p a t i a l p a t t e r n s o f c h l o r o p h y l I, p r i m a r y p r o d u c t i o n ,
macrozoopl an k ton biomass, and p h y s i c a l s t r u c t u r e I n t h e c e n t r a l Nor th P a c l f i c Ocean. J. PI ank. Res. 7:147-167.
HUNTER, J.R., A.W. AFGUE, W.H. BAYLI FF, A.E. DlZON, A. FONTENEAU, D. GOODMAN, and G.R. SECKEL.
f u t u r e research. FA0 Fish. Tech Pap. ( I n press). 1986. The dynamics of tuna movements: an e v a l u a t i o n o f pas t and
LaV IOLETTE, P. E. and S. E. SEIM. 1969. Month ly c h a r t s o f mean, minimum, and maximum sea s u r f a c e
Nav. Oceanog. Of f . , Spec. t e m p e r a t u r e o f t h e N o r t h P a c l f i c Ocean. Pub. NO. 123, 6 2 p.
McGOWAN, J.A. , and P.M. WILLIAMS. 1973. Oceanic h a b i t a t d i f fe rences i n t h e North Paci f ic . J. Exp. Mar.
B i 0 1 . E c o ~ . 12:187-217.
RCB INSON, M. K. 1976. A t 1 as o f t he North P a c i f i c Ocean monthly mean temperatures and
Nav. Ocean. O f f . Ref. Pub. mean s a l i n i t i e s o f t h e s u r f a c e I ayer. 2, 1 9 173 f i g .
U. S. NAVAL OBSERVATORY. 1972. The N a u t i c a l A I manac f o r t h e Year 1974. U.S. Gov. P r i n t . Off. ,
Washington, D.C.
YAMANAKAI H. 1984. The r e l a t i o n s h i p between E l NiRo episodes and f i s h m ig ra t i on
and y i e l d s i n the western P a c i f i c Trop. Ocean-Atmos. News1 e t t e r 25: 2-4.
13
- _ _
RECENT TECHNICAL MEMORANDUMS
Copies of this and other NOAA Technical Memorandums are available from the National Technical Information Service, 5285 Port Royal Road, Springfield, VA 22167. Paper copies vary in price. Microfiche copies cost $4.50. Recent issues of NOAA Technical Memorandums from the NMFS Southwest Fisheries Center are listed below: NOAA TM-NMFS SWFC 50
51
52
53
54
55
56
57
58
59
Hawaiian Monk Seal observations on French Frigate Shoals, 1980. P.A. JOHNSON and B.W. JOHNSON (October 1984) Estimating dolphin juvenile survival rates from the proportion of calves nursing. T. POLACHECK (October 1984) Operational plan for NMFS albacore program. R.H. PARRISH, et al. (May 1 985) Albacore fishing and windspeed. P.N. SUND (June 1985) Proceedings of the workshop on the fate and impact of marine debris, 27-29, November 1985, Honolulu, Hawaii. R.S. SHOMURA and H.O. YOSHIDA (Editors) (August 1985) The Hawaiian Monk Seal and Green Turtle on Necker Island, 1983. R.J. MORROW and E.K. BUELNA (November 1985) Proportions of species of dolphin in the eastern tropical Pacific. J. BARLOW and R.S. HOLT (January 1986) A budget simulation model for west coast albacore trollers. S.F. HERRICK and K.L. CARLSON (February 1 986) The Hawaiian Monk Seal on Lisianski Island: 1983. T.C. JOHANOS and A.K.H. KAM (February 1986) Hawaiian Monk Seal observations and captive maintenance project at Kure Atoll, 1981. W.G. GILMARTIN, R.J. MORROW, and A.M. HOUTMAN (March 1986)