determining of the effect of cosmetic … process using logistic regression analysis ... the...
TRANSCRIPT

International Journal of Business and Management Review
Vol.2, No.4, pp. 80-103, September 2014
Published by European Centre for Research Training and Development UK (www.eajournals.org)
80
ISSN: 2052-6393(Print), ISSN: 2052-6407(Online)
DETERMINING OF THE EFFECT OF COSMETIC PRODUCT LABELS ON
PURCHASING PROCESS USING LOGISTIC REGRESSION ANALYSIS
Prof. Sema Behdioğlu
Department of Econometrics, Faculty of Economics and Administrative Sciences, Dumlupinar
University, Turkey.
Assistant Prof. Habibe Yelda Şener
Department of Marketing and Advertising, Kütahya Vocational School of Social Sciences,
Dumlupinar University, Turkey.
ABSTRACT: The aim of this study is to reveal whether label has an effect on cosmetic
products purchasing process of 442 students chosen by simple random sampling at different
departments in Dumlupınar University and the effect of the information on the labels of these
products on the purchasing process using logistic regression analysis. In line with this
purpose of the study, first, as a result of logistic regression analysis, using forward selection
technique to determine whether label has an effect on cosmetic products purchasing process
and what characteristics customers who check a label for information have, it is determined
that gender (1-Female), preference of the same brand (1-Yes) and frequency of checking
label information (1-Always, 2-Sometimes) are effective factors. Moreover, as a result of
logistic regression analysis to reveal whether the information of the label of cosmetic
products is effective on purchasing of these products, the important variables are determined
to be product name, product brand, name of the manufacturer, ingredients, net weight,
production date, expire date, shelf life, information about whether it is a natural/organic
product/symbols, information about whether it involves substances hazardous to health/
symbols, information about the use / preparation of the product, quality assurance/
information about whether it has any standards, information about its probable side effect
and product price.
KEYWORDS: Label, cosmetic products labels, purchasing process, logistic regression
analysis
INTRODUCTION
Label is an information note about the product (Gauhier et al. 2010:163-166). Evolving into
complex graphs from a simple form, label is a part of packaging. Label introduces the
product or the brand, shows when, where, how and by whom the product was manufactured,
informs the buyer about the ingredients and promotes the product with graphic designs
(Kotler and Armstrong, 2008:227). A strong corporate brand needs a label as well as a good
image, logo, defining colours and advertisements (Kotler, 2003:27). Label is an important
element in revealing the characteristics of a product that distinguish it from its rivals
(Perreault and McCarthy, 2002: 176). Label is a communication tool used for such products

International Journal of Business and Management Review
Vol.2, No.4, pp. 80-103, September 2014
Published by European Centre for Research Training and Development UK (www.eajournals.org)
81
ISSN: 2052-6393(Print), ISSN: 2052-6407(Online)
as food, textile, medicine and cosmetics. According to the guideline determined by the
European Cosmetic Association, it is compulsory to include information on cosmetic product
labels about the manufacturer’s name and origin, the product’s volume, amount, package
weight, expire date, batch number, functions, ingredients and special warnings like whether it
is inflammable with a view to informing customers (Colipa, 2011:1-32).
The aim of this study is to determine whether label is effective on cosmetic product
purchasing process of customers and the effect of the information of these product labels on
the purchasing process of these products using logistic regression analysis. There are certain
methods to accredit observations to the probable groups in data structure. These methods are
cluster analysis, discriminant analysis and logistic regression analysis. In logistic regression
analysis, the number of the groups in data structure is known and, thanks to these data, a
discrimination model is obtained. Using this model, accrediting the new observations to the
data set is done (Başarır, 1990: 1). The aim of using logistic regression analysis is the same as
that of the other model structuring techniques used in statistics: forming a model that can
define the relationship between dependent and independent variables using the fewest
variables to achieve the best coherence. (Press and Wilson, 1978: 2).
In case of statistical assumptions breakdowns and in case of a binary dependent variable
being 0 and 1 or in case of polychotomous discrete variable involving more than two levels,
logistic regression analysis is recommended that does not restrict the independent variables as
being categorical or continuous and can be used to accredit observations. Logistic regression
analysis is an efficient and analyser method in marketing research is commonly used in
determining the customers’ profile of a certain product, their purchasing behaviours and
forming marketing strategies accordingly (Yeung and Yee, 2011:71, Duquenne and Vlontzos,
2012:61-79, Bigne et al. 2005:193-204, Chandra and Menezes, 2001:77-96).
The study is comprised of five sections. In the first section, the problem examining the effect
of label on customers’ purchasing cosmetic products and the customer profile using label in
purchasing process. In the second section, “label” concept and its importance in cosmetic
products are explained. In the third section, research methodology; in the four section,
application and findings of logistic regression analysis conducted to determine whether label
is effective in cosmetic product purchasing process and the customer profile using label. In
the last section, discussion and implications.
LİTERATURE REVİEW
Label
Label is one of the elements of package communication. It varies depending on the package
material and type and is printed either on the package or on a separate material. During
purchasing process, customers access to important information about the product through
label (Odabaşı and Oyman, 2002:244-251). Label should be easily recognizable on the
package, should be legible and comprehensible and should show the product brand, logo and
colors. Also, expire date, suggestions for safe use, product barcode and content should be
involved in it (Erdoğan, 2014:316).

International Journal of Business and Management Review
Vol.2, No.4, pp. 80-103, September 2014
Published by European Centre for Research Training and Development UK (www.eajournals.org)
82
ISSN: 2052-6393(Print), ISSN: 2052-6407(Online)
Label is used as a communication tool that enables customers to recognize such goods used
continuously lifelong as food, health goods, textile and cosmetics and to distinguish them
from their rivals. It is obvious that food product labels have an important role in informing
customers (Prathiraja and Ariyawardana, 2003:35). When they are designed as easily-
comprehensible, customers can access to the necessary information and can make a healthier
choice of products. Moreover, the fact that label is a guide for customers in product selection
is motivating for food industry to develop healthier products as well as presenting better
price, savor and suitable package (Philipson, 2005:262-264).
In the labels of food products, the product name should first of all exist together with
amounts of the ingredients and other compulsory information like net weight of the product,
expire date, special storage and/or using conditions, name of the manufacturing company,
wholesale or vendor, its origin and in drinks the amount of alcohol, if any, and special signs
should be easily-recognizable, legible and in unfading colors (Thomson, 2011:11-13).
Labels of food products should include the reasons for customers to buy those products.
Using labels of food products consciously enables customers to get extensive information
about the products, which stems from the healthy-life-oriented understanding (European
Food Information Council, 2013:1-10). Nayga et al.(1998:106-119) state that socio-
demographic characteristics of customers and health-related factors have effects on the use of
food product labels and that the importance of food product labels has increased with the rise
of education levels of customers. Drichoutis et al. (2006:1-22) emphasize that especially the
customers demanding diet products are more sensitive to food product labels and generally
prefer labels expressed with graphics or colors rather than amount-oriented ones.
Furthermore, they also state that labels are effective on purchasing behaviors and these
customers prefer healthier products. Kim et al. (2000: 215-231) reveal that food product
labels are used to show the calorie content as well as cholesterol and sodium contents. They
also advocate that using food product labels are beneficial to public health and long life as
well as decreasing expenditure on health services.
Ollberding et al. (2010:1233-1237) claim that the usage rate of food product labels especially
among adult customers should be raised and awareness of better nutrition should be
emphasized to improve the positive effects of food product labels on public health. Kiesel et
al. (2011:21-30) allege that such information as certain product characteristics, reliability and
production place and even the color of the ink are effective in food product choice of
customers. They reveal that customers generally perceive the label information about
nutrition as useful, prefer short but essential information and believe that the claims of the
producers about the product are audited by the state regularly. They also conclude that most
customers read product labels while purchasing food products. They add that in the USA,
food product labels have prompted a great enhancement in terms of health. They also state
that using labels and food consumption behaviors have changed in time and that these
behaviors are affected by such factors as health concerns, taste, income and culture.
Nayga (1999:29-43) emphasizes that perceptions and beliefs of customers about the use of
food product labels are affected by certain factors and show discrepancies and adds that

International Journal of Business and Management Review
Vol.2, No.4, pp. 80-103, September 2014
Published by European Centre for Research Training and Development UK (www.eajournals.org)
83
ISSN: 2052-6393(Print), ISSN: 2052-6407(Online)
elderly customers with low-income believe that food product labels are beneficial for them.
He also shows that compared with the black, the white know how to use food product labels
while choosing healthy diet products. He claims that male customers with low income less
adopt the opinion that reading labels simplifies food choice. On the other hand, he explains
that low-income and black customers prefer using product labels less while choosing food
products and trust their own knowledge about the products. Annunziata and Vecchio
(2012:103-114) emphasize that the need for taking political measures for nutrition has been
understood as obesity danger has exacerbated in the USA.
This understanding has led to new regulations for nutrition with the new laws for food
product labels enforced in 2011. On the other hand, in Italy, the factors affecting
comprehension and use of food product labels are determined, which has enhanced
applications for such labels. In this process, educational campaigns have been a precious
asset. Also, efforts of marketing experts and the state to lead customers to health programs
through effective communication strategies have improved.
In parallel with food sector, label should also fulfill its duty of information in textile products.
If textile products have been prepared for end customers, brand name, user manual and textile
texture content should be shown on the label clearly and legibly. Texture content of textile
products that include various components should be shown on the label. Also in shoe
products, information about internal and external lining and insole of the product should be
on the label with visual images (Thomson, 2011:p.177-179).
On the other hand, label is also important for healthcare products. If it is considered
necessary to reflect certain characteristics of a product on the label, this arises from the need
for informing the customer about the purchasing and using process. If this requirement isn’t
taken into account while labeling medicine, consequences threatening human health might
occur. Giving such information as how to use and in which conditions not to use a medical
product on the medicine labels affects choosing that medicine and its usage process directly
(The Controlled Substances, Drugs, Device and Cosmetic Act, 1972).
Cosmetic Product Labels
There are certain factors affecting the choice of cosmetic products by customers. Cultural and
educational value judgments of the society in which the customer lives and his/her awareness
of the advertisements about the product are effective on his/her consumption behavior.
Moreover, such factors as product package, its window display, its fitness for the purpose, its
smell, its image and price are also effective on the purchasing choice of customers.
Information of customers about a product is mostly shaped upon what is written on the label.
Product information on the label of cosmetic products are regarded to be true by customers
and it is thought that product features are defined on the label (Kapucu,2013 :1-29). If there
are special precautions to be taken by the customer while using a cosmetic product,
presenting them on the product label enables customers to use this product safely (Turkish
Drug and Medical Device Institution, p.3).

International Journal of Business and Management Review
Vol.2, No.4, pp. 80-103, September 2014
Published by European Centre for Research Training and Development UK (www.eajournals.org)
84
ISSN: 2052-6393(Print), ISSN: 2052-6407(Online)
Cosmetic products are useful in that they have a crucial role in personal hygiene, skin care
and skin protection. It is rarely thought that cosmetic products could be hazardous; however,
in fact, using cosmetics is not always safe. The benefit customers get from these products
should be enhanced by controlling the content of such products as much as possible and
producing reliable products seeing that they are used in a large portion of human life
(European Commission, 1999: 32-37).
Cosmetic products, despite their useful functions, might also cause unpleasant or even
dangerous cases due to the possibility of involving hazardous ingredients and microbiological
contamination. If there are health-threatening ingredients in cosmetic products, customers
should be informed about it and such products should be exposed to special classification.
This obligation is conducted through labeling system according to Classification, Labeling
and Packaging Regulation of EU. Risk reporting for customers should be promoted in terms
of moral concerns (Klaschka, 2012:24-37).
CLP regulation enforced in 2008 encompasses classification of product ingredients and
labeling and packaging the product according to this classification. CLP became compulsory
in June 2009. In this process, United Nations came up with new criteria for classification and
labeling of chemical substance involving products and the previous system was revised.
Classification and labeling according to CLP continued until December 2010. The time
between 2010 and 2015 is the transition period to the new system and during this time both
systems are valid; however, after June 2015, the products are required to be classified and
labeled according to the new CLP measures. The products in supply chain are expected to
have completed their transition process by June 2017 (Prinz, 2013: 1-20). CLP entails
businesses to check whether there are certain signs and risk words and whether they contain
any hazardous cases on product labels. It also obligates involving safety content information
on labels.
A cosmetic product label has to include signs showing the hazardous ingredients to do away
with perception problem in different languages, appropriate sign words, danger expressions
and appropriate precaution expressions (Fanghella and Catone, 2011:126-130). Cosmetic
products are attached importance to and cared about less than medicine in terms of content
and quality control. However, cosmetic products should also pass through a good production
process. Today, labeling is required not only to show the ingredients of these products but
also to inform customers about whether animal tests have been carried out during
manufacturing processes, during which a policy of conserving animals should be followed.
When tests are carried out on animals and/or animal-based ingredients are used during
manufacturing processes of these products, it is hardly surprising to meet reactions from
vegetarians, religious groups and advocates of animal rights. In order to avoid such
objections, these matter should be paid attention to and it should be stated clearly on product
labels that no tests have been conducted on animals and the product does not involve any
animal-based ingredients (Nanda, 2006: 3, Crowe, 2007:1-17).
The claims of cosmetic product brands that they are natural and organic should be on their
label on the condition that they really are so (Turkish Drug and Medical Device Institution,
International Journal of Business and Management Review
Vol.2, No.4, pp. 80-103, September 2014
Published by European Centre for Research Training and Development UK (www.eajournals.org)
85
ISSN: 2052-6393(Print), ISSN: 2052-6407(Online)
p.4). Since organic products are preferred more, label is very important for such cosmetic
products in informing customers about it. Labeling of organic cosmetic products is effective
on diverting customer preferences to these products. However, when the labels on organic
cosmetic products do not include such necessary information about the product features or
there is a lack of information on the label, awareness in customers for these products cannot
be achieved (Neweli-Guz, 2012:36-42).
RESEARCH METHODOLOGY
The aim of the study is to determine whether label is effective on cosmetic product
purchasing process of 442 students at various departments of Dumlupınar University chosen
by simple random sampling method and the effect of the information on the product labels on
product purchasing process using logistic regression analysis. Logistic regression analysis has
recently been used commonly especially in social sciences.In numerous socio-economic
studies conducted to reveal the cause and effect relations, some of the variables consist of
two-level data like positive-negative, yes-no, satisfied-not satisfied. Logistic regression
analysis has an important place while analysing the cause and effect relation between
dependent and independent variables when the dependent variable is composed of two-or-
multiple-level data (Agresti, 1996: 103).
In logistic regression analysis, as well as classification, the relation between dependent and
independent variables is also sought and there is no obligation for all or some independent
variables to be continuous or categorical. Logistic regression analysis, when some statistical
assumptions aren’t ensured as in the case of regression analysis not possessing normality,
equal variances and covariances, is an alternative method for discriminant analysis and
crosstabs.
Attention to this method increases thanks to its mathematical flexibility and easy
interpretation as well as its applicability in the case of a dependent variable being discrete
variable involving two or more levels like 0 and 1. Logistic regression analysis is a regression
model enabling classification and accrediting. It has no prerequisites like normal distribution
or continuity assumptions. The effects of independent variables on dependent ones are
obtained as probability, which allows determining the risk factors (Hosmer and Lemehow,
2000:2-4).
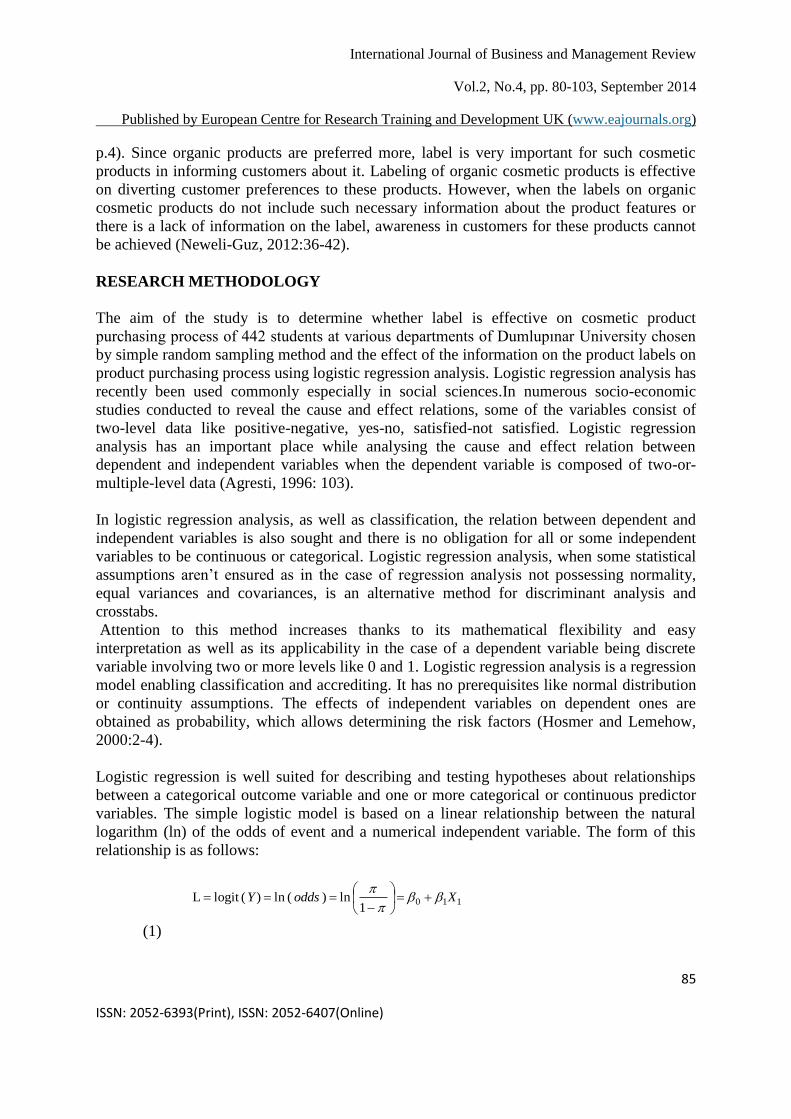
Logistic regression is well suited for describing and testing hypotheses about relationships
between a categorical outcome variable and one or more categorical or continuous predictor
variables. The simple logistic model is based on a linear relationship between the natural
logarithm (ln) of the odds of event and a numerical independent variable. The form of this
relationship is as follows:
1101
ln) ( ln) (logit L XoddsY
(1)

International Journal of Business and Management Review
Vol.2, No.4, pp. 80-103, September 2014
Published by European Centre for Research Training and Development UK (www.eajournals.org)
86
ISSN: 2052-6393(Print), ISSN: 2052-6407(Online)
where Y is binary and represent the event of interest (response), coded as 0/1. The logistic
formulas are stated in terms of the probability that Y=1, which is referred to as . The
probability that Y is 0 is 1 . X is the independent variable, 0 and 1 are the Y-intercept
and the slope, respectively. The logistic regression model may be written in terms of , the
risk of event Y, assuming that L is a linear function of X as follows:
110
110
1X
X
e
e
(2)
where is the probability of outcome of interest or “event”, and e=2.71828 is the base of the
system of natural logarithms. X can be categorical or continuous, but Y is always categorical.
Extending the logic of the simple logistic regression to multiple predictors, one can construct
a complex logistic regression for Y as follows:
kk XXoddsY
...............
1 ln) ( ln) (logit L 110
(3)
Therefore,
kk
kk
XX
XX
e
e
...............
.............
110
110
1 , kk XXY ..........110
(4)
where is once again the probability of the event, 0 is the Y-intercept, k are regression
coefficients, and kX are a set of predictors. When 5.0 , Y=1 and when 5.0 , Y=0
categorizing is done. 0 and k are typically estimated by the maximum likelihood (ML)
method, which is preferred over the weighted least square approach.
The ML method is designed to maximize the likelihood of reproducing the data given the
parameter estimates (Haberman: 1978; Schlesselman: 1982). Interpreting the predicted

International Journal of Business and Management Review
Vol.2, No.4, pp. 80-103, September 2014
Published by European Centre for Research Training and Development UK (www.eajournals.org)
87
ISSN: 2052-6393(Print), ISSN: 2052-6407(Online)
regression coefficients in logistic regression analysis isn’t as easy as in linear regression
model. It is difficult to compute the effect of 1 unit increase in X axis in logistic regression
model prepared for a starting point on X axis. For example, while interpreting 1 coefficient,
logistic regression function obtained by multiplying exp( 1 ) with
1 odds prediction for
1 unit increase on X1.
Logistic regression is a guide in deciding about products. Demirtaş et al. (2009:866-975)
explain the perceptions of consumers about product style using logistic regression method,
determine the most appropriate design parameters for product image and with that study,
contribute to that product’s manufacturers. Utami et al. (2007:79) determine the marketing
strategies to be followed by manufacturers of a national food product so as to maintain its
sustainability using logistic regression method. And in that study, the importance of low-price
applications, determination of customer characteristics and appropriate promotion efforts are
emphasized.
Logistic regression method is also used commonly while determining product users. Uva and
Cheng (2005:177-184), using logistic regression method, define the customers characteristics
who are willing to pay high price for better quality fruits and it is revealed with that study that
opportunities can be created by applying different distribution channels and marketing
strategies to different customer base. Cruz et al. (2011:549-554) find in their study, conducted
to determine customers’ approval of probiotic yoghurts and intend to purchase them using
logistic regression method, that the most important factor in decision-making is savor due to
the change in product ingredients.
On the other hand, Gordon et al. (2009:66), using logistic regression method, reveal a
relation between starting to have alcohol, drinking behaviors and intends of 12-14 aged
youngsters and varieties of alcohol marketing communication. Calafat et al. (2005-2006:679-
684), also using logistic regression method, analyze the urine samples of 2.548 people aged 6
and above years in the USA to determine exposure to four paraben types in products in terms
of gender, race, age and household income and conclude that compared with the white, the
black are exposed to these substances more at 60 or above ages.
They also reveal that young and adult females are more exposed to these substances tan
males of the same age group. Press and Simms (2010:183-196) separate the customers in
England who have used teeth-whitening service into certain segments and, using logistic
regression method, determine the differences of these segments from one another and how
marketing strategies of these market segments should be. Abduh et al. (2012:933-938), again
using logistic regression method, put forth the factors in defining the bank customers in
Indonesia as Islamic and conventional bank customers. Toppinen et al. (2013:775), using
logistic regression method, reveal the consumer perceptions about environmental and social
sustainability of wooden products and determine the customer profile using these products.
As a result of this analysis, they determine that customers are willing to pay the required
price for these products, possess environmental and social conscious and are elder people and

International Journal of Business and Management Review
Vol.2, No.4, pp. 80-103, September 2014
Published by European Centre for Research Training and Development UK (www.eajournals.org)
88
ISSN: 2052-6393(Print), ISSN: 2052-6407(Online)
female. Kulcsar (2010:75), using logistic regression method, try to determine the
characteristics of tourists in terms of development of the visited area upon the factors of
visiting aims and frequencies. Shao and Li (2011:258-263) also uses logistics regression
method in measuring the effect of individual advertisement channels as well as customer
classification that determines positive and negative attitudes towards digital advertisements in
purchasing decisions.
Baxter (2009:1-13) use logistics regression method while trying to determine whether
previous direct experiences are effective on the brand awareness of children of 7-12 age
group about child brands and find that previous direct experiences are significantly effective
on the brand awareness of children. Agaku et al. (2013:1) compare in their study the
incidence of exposure to tobacco products in children of 13-15 age group in countries with
medium-level income, using logistic regression method, evaluate the effect of exposure to
tobacco advertisements on this age group smoker youngsters and reveal that precautions are
required to decrease exposure to such advertisements.
Ling et al. (2014:751), in their study emphasizing the importance of social advertisements in
decreasing tobacco use among teenagers, in order to determine the changes in daily tobacco
use and excessive alcohol consumption, make use of logistic regression taking demographic
characteristics, alcohol use, openness to advertisements, sensitivity to trends and attitude
factors towards tobacco and conclude that social branding decreases tobacco use among
teenagers.
Migueis et al. (2013:6225) use logistic regression method to determine the customers likely
to leave a business within the context of customer relations management which is important
for profitability of a business and thus contribute to decreasing the risk levels of customers
and businesses’ taking necessary precautions to prevent customer. Guido et al. (2011:993), in
order to determine the factors effective in purchasing decisions of customers and reply rates
of customers to direct marketing applications of businesses, taking the criteria of customer
profile, probability of being attracted to promotions and expected purchasing behavior into
account, use logistic regression method to reveal the relation between the variables.
Winterich and Barone (2011:1547) classify choices of customers for monetary and non-
monetary promotions with logistic regression method according to social identity and self-
interpretation of customers.
Fogel and Raghupathi (2013:28-35) use logistic regression method to evaluate opening and
reading cosmetic product spam mails and purchasing the cosmetic product whose
advertisement are shown in spam mails in terms of demographic characteristics, internet and
attitude towards internet. They find that compared with males, females open and read the
advertisements in cosmetic product spam mails and they emphasize that trust in internet is
crucial in purchasing the product advertised in spam mails. Unnithan (2003:146), in his study
to determine the effects of personal factors on consumption of personal-care products using
logistic regression method, classifies the participants according to their using cosmetic
products rarely and frequently taking the variables of self-esteem, self-consciousness,
plausibility and gender into account.

International Journal of Business and Management Review
Vol.2, No.4, pp. 80-103, September 2014
Published by European Centre for Research Training and Development UK (www.eajournals.org)
89
ISSN: 2052-6393(Print), ISSN: 2052-6407(Online)
ANALYSIS AND RESULTS
In this study conducted to determine whether label is effective on cosmetic product
purchasing process of 442 students of Dumlupınar University and the effect of the
information on the product labels on product purchasing process using logistic regression
analysis, the research data are obtained from a questionnaire conducted on students
personally. The first part of the form contains questions about the demographic
characteristics of the participants and the second part is comprised of 7 questions about the
participants’’ cosmetic product purchasing frequency, brand preference, health factor
affecting purchasing, individual social responsibilities, label reading frequency, customer
experience of label using and the effect of label information on purchasing process. In this
study, since the dependent variable is a two-level categorical variable, the most important
independent variables in “label information is effective on cosmetic product purchasing
process” during logistic regression analysis are given below.
X1=Gender (1-Female, 2-Male)
X2=Monthly Allowance (1-500 and below, 2-501-1000, 3-1001-1500, 4-1501-2000, 5-2001
and above)
X3=Purchasing Frequency (1-often, 2-sometimes, 3-never)
X4= Preference of the same brand (1-yes, 2-no)
X5= Existence of a health problem that affects purchasing (1-yes, 2-no)
X6= Individual social responsibilities (membership to environmental protection clubs) (1-yes,
2-no)
X7= Individual social responsibilities (membership to animal protection clubs) (1-yes, 2-no)
X8=Frequency of reading label information (1-often, 2-sometimes, 3-never)
X9= Adequacy of label information (1-yes, 2-no)
The dependent variable Y is coded as;
1- Label information is effective on cosmetic product purchasing process.
2- Label information is not effective on cosmetic product purchasing process.
Table 1 shows frequency and percentage of demographic characteristics of 442 participant
students.

International Journal of Business and Management Review
Vol.2, No.4, pp. 80-103, September 2014
Published by European Centre for Research Training and Development UK (www.eajournals.org)
90
ISSN: 2052-6393(Print), ISSN: 2052-6407(Online)
Table 1. Demographic Characteristics of Students
Variable
Frekan
s
Percen
t
Valid
Percen
t
Cumulativ
e Percent
Gender Female 247 55.9 55.9 55.9
Male 195 44.1 44.1 100.0
Total 442 100.0 100.0
Monthly Allowance 500 &
below
288 65.2 65.2 65.2
501-1000 130 29.4 29.4 94.6
1001-1500 6 1.4 1.4 95.9
1501-2000 2 0.5 0.5 96.4
2001 &
above
16 3.6 3.6 100.0
Total 442 100.0 100.0
Purchasing Frequency Often 244 55.2 55.2 55.2
Sometime
s
193 43.7 43.7 98.9
Never 5 1.1 1.1 100.0
Total 442 100.0 100.0
Preference of the
Same
Yes 293 66.3 66.3 66.3
Brand No 149 33.7 33.7 100.0
Total 442 100.0 100.0
Existence of a Health Yes 31 7.0 7.0 7.0
Problem No 411 93.0 93.0 100.0
Total 442 100.0 100.0
Membership to Yes 44 10.0 10.0 10.0
Environmental No 398 90.0 90.0 100.0
Protection Clubs Total 442 100.0 100.0
Membership to
Animal
Yes 10 2.3 2.3 2.3
Protection Societies No 432 97.7 97.7 100.0
Total 442 100.0 100.0

International Journal of Business and Management Review
Vol.2, No.4, pp. 80-103, September 2014
Published by European Centre for Research Training and Development UK (www.eajournals.org)
91
ISSN: 2052-6393(Print), ISSN: 2052-6407(Online)
Table 1 shows that the participants are composed of 55.9% female and 44.1% male students.
In terms of their monthly allowance, it is seen that 65.2% have 500 tl and below allowance,
while it is between 501 and 1000 tl for 29.4%, between 1001 and 1500 tl for 1.4%, between
1501 and 2000 tl for 0.5% and 2001 tl and above for %3.6. Accordingly, it can be said that
for the majority of the students, their allowance 500 tl and below. In terms of cosmetic
product purchasing frequency, it is determined that 55.2% of the students do it frequently,
while 43.7% do it sometimes and 1.1% never buy cosmetic products.While 66.3% of the
students prefer the same brand during cosmetic product purchasing process, 33.7% do not
have a preference for a specific brand. In terms of health problems that could have an effect
on cosmetic product purchasing process, 7.0% of the students state that they are careful in
choosing cosmetic products due to their health problems, while 93% state that they choose
cosmetic products without being under such a pressure. It is also seen that 10% of the
students have membership to environmental protection clubs whereas 90% are not members
to such clubs. On the other hand, only 2.3% of the students have membership to animal
protection societies whereas 97.7% are not members to such societies. Table 2 shows
frequency and percentages reflecting the overall opinions of 442 students about the labels of
cosmetic products.
Table 2. Overall Opinions of the Students about the Labels of Cosmetic Products
Overall opinions about the labels of cosmetic
products
Frekans
Percent
Q1. Information is easily legible. Yes 303 68.6
No 139 31.4
Total 442 100.0
Q2. Information is easily comprehensible. Yes 252 57.0
No 190 43.0
Total 442 100.0
Q3. The meaning of the symbols is familiar. Yes 166 37.6
No 276 62.4
Total 442 100.0
Q4. There are informative applications for Yes 184 41.6
the meaning of the symbols used on labels. No 258 58.4
Total 442 100.0
Q5. The brand logo is easily distinguishable. Yes 405 91.6
No 37 8.4
Total 442 100.0
Q6. Information, symbols and colours used in the Yes 382 86.4
logo are distinct. No 60 13.6
Total 442 100.0

International Journal of Business and Management Review
Vol.2, No.4, pp. 80-103, September 2014
Published by European Centre for Research Training and Development UK (www.eajournals.org)
92
ISSN: 2052-6393(Print), ISSN: 2052-6407(Online)
Table 2 shows that 68.6% of the students state that they can read the information on labels
easily whereas 31.4% state that they can’t. 57% of the participant students say that label
information is easily comprehensible, but 43% say that it isn’t. Similarly, 37.6% of the
students reveal that they know the meaning of the symbols used on labels while 62.4% say
that they don’t know those symbols. While 41.6% of the students say that there are
informative applications for the meaning of the symbols used on labels, 58.4% state that there
aren’t such applications. Moreover, 91.6% of the students say that the brand logo is easily
distinguishable on the label, whereas only 8.4% do not agree with it. On the other hand,
86.4% of the students say that information, symbols and colours used in the logo are distinct,
but 13.6% assess this expression negatively. Table 3 shows the highest probability coefficient
predictions and other outcomes obtained as a result of logistic regression analysis using
forward variable selection method to determine whether label is effective on cosmetic
product purchasing process of customers and which characteristics university students who
look at labels to be informed about products have.
Table 3. Analysis Results of Forward Variable Selection Method
Variable k S.E. Wald df Sig. Exp( k )
Conctant -1.441 0.232 38.579 1 0.000 0.237
X1 (1-Female) -0.570 0.149 14.538 1 0.000 0.566
X4 (1-Yes) 0.438 0.173 6.395 1 0.011 1.549
X8 (1-Always) -0.946 0.303 9.784 1 0.002 0.388
X8 (2-Sometimes) -0.557 0.249 4.995 1 0.025 0.573
According to Table 3, it is seen that the factors effective in the university students’ use of
label in cosmetic product purchasing process are gender (1-Female), preference of the same
brand (1-Yes) and frequency of reading labels (1-Always, 2-Sometimes). Therefore, the
equation to be used in classification is given below as:
4321 557.0946.0438.0570.0441.1 XXXXY
(5)
In multiple linear regression, interpretation of regression coefficients is clear. Regression
coefficients express the amount of the change a unit change in an independent variable cause
in the dependent variable on the condition that the values of the other independent variables
are constant. On the other hand, interpretation of coefficient predictions in logistic regression
isn’t like the one in multiple linear regression. Interpretation is done using odds, which is the
ratio of the probability of label being effective on cosmetic product purchasing process to the
probability of it not being effective. These values are those in column Exp( k ). According to
the Exp( k ) value in Table 3, the most important variable in label not being effective on

International Journal of Business and Management Review
Vol.2, No.4, pp. 80-103, September 2014
Published by European Centre for Research Training and Development UK (www.eajournals.org)
93
ISSN: 2052-6393(Print), ISSN: 2052-6407(Online)
cosmetic product purchasing process is Preference of the same brand (1-Yes). The other
variables being constant, a unit increase in Preference of the same brand (1-Yes) variable
will increase the probability of label being effective on cosmetic product purchasing process
1.549 times. Interpretations about the other variables are done similarly. In multiple linear
regression, as a general significance test for coefficients, a similar test to F test is developed
for logistic regression analysis. L0 being the probability value of the model composed only of
a constant term and L1 being the probability value of the obtained model, the scale defined as
C= -2 log (L0 / L1 )= -2(log L0 - log L1) shows chi-square distribution with (k-1) degree of
freedom. For significance of the equation, C= 335.013. The equation is found significant
since chi-square table value with 05.0 and 3 degree of freedom is higher than 7.814. Table
4 shows the classification for this equation.
Table 4. Classification Results According to Forward Variable Selection (Forward LR)
Technique
Predicted
Observed 1 (Label information is
effective on purchasing
process of cosmetic products.)
2 (Label information is not
effective on purchasing
process of cosmetic products.)
Percentage
Correct
1
2
370 6 98.4
59 7 10.6
Overall 85.3
The classification rate of the equation (5) obtained according to the results of Table 3 is
%85.3, which is rather high. Therefore, this rate is indicative of the fact that the equation is
significant. Table 5 shows the frequency distribution of how often the university students
read information on labels on cosmetic product purchasing process.
Table 5. Frequency Distribution of How Often the Students Read Information on
Labels
Q1 Q2 Q3 Q4 Q5 Q6 Q7 Q8
Always Frequency 373 367 151 87 148 94 161 303
% 84.4 83.0 34.2 19.7 33.5 21.3 36.4 68.6
Somtimes Frequency 58 65 210 195 210 184 171 106
% 13.1 14.7 47.5 44.1 47.5 41.6 38.7 24.0
Never Frequency 11 10 81 160 84 164 110 33

International Journal of Business and Management Review
Vol.2, No.4, pp. 80-103, September 2014
Published by European Centre for Research Training and Development UK (www.eajournals.org)
94
ISSN: 2052-6393(Print), ISSN: 2052-6407(Online)
% 2.5 2.3 18.3 36.2 19.0 37.1 24.9 7.5
Q9 Q10 Q11 Q12 Q13 Q14 Q15 Q16
Always Frequency 342 231 49 200 165 228 99 249
% 77.4 52.3 11.1 45.2 37.3 51.6 22.4 56.3
Somtimes Frequency 72 123 95 148 199 158 122 132
% 16.3 27.8 21.5 33.5 45.0 35.7 27.6 29.9
Never Frequency 28 88 298 94 78 56 221 61
% 6.3 19.9 67.4 21.3 17.6 12.7 50.0 13.8
Q17 Q18 Q19 Q20 Q21 Q22
Always Frequency 178 188 279 358 237 91
% 40.3 42.5 63.1 81.0 53.6 20.6
Somtimes Frequency 166 191 126 70 163 221
% 37.6 43.2 28.5 15.8 36.9 50.0
Never Frequency 98 63 37 14 42 130
% 22.2 14.3 8.4 3.2 9.5 29.4
As seen in Table 5 for how often the students read the information on labels during cosmetic
product purchasing process, the students “always” read the product name (%84.4), brand (%
83.0), price (% 81.0) , expire date (% 77.4), production date (% 68.6) and probable side
effects due to using the product (% 63.1). Furthermore, the students “sometimes” read the
information about recycling of package disposal (% 50.0). On the other hand, the students
“never” read information about the batch no of the product (% 67.4) and “never” pay
attention to information/symbols about whether animal tests have been conducted for the
product (% 50.0). The data obtained from the questionnaire are first subject to chi-square
significance test, during which the variables with interval validity are analysed in logistic
regression model. Table 6 shows the chi-square test results conducted to determine the
relation between the dependent and independent variables in this study, in which the
dependent variable is the effect of label on cosmetic product purchasing process.

International Journal of Business and Management Review
Vol.2, No.4, pp. 80-103, September 2014
Published by European Centre for Research Training and Development UK (www.eajournals.org)
95
ISSN: 2052-6393(Print), ISSN: 2052-6407(Online)
Table 6. Pearson Chi-Square Table for Frequency of Reading Information on Label
Frequency of Reading the Information on Label Pearson
Chi-square
p
Q1.Product name 11.874 0.003*
Q2. Brand 18.610 0.000*
Q3. Manufacturer 14.950 0.001*
Q4. Origin 0.001 0.999
Q5. Ingredients 9.453 0.009*
Q6. Amount of the ingredients 2.492 0.288
Q7. Net weight 15.424 0.000*
Q8. Production date 12.816 0.002*
Q9. Expire date 19.197 0.000*
Q10. Shelf life 10.119 0.006*
Q11. Batch no 0.560 0.756
Q12. Functions 2.621 0.270
Q13. Warning/symbols for inflammable products 1.765 0.414
Q14. Information/symbols about whether it is a natural/organic
product
10.257 0.006*
Q15. Information/symbols about whether animal tests have been
conducted
2.124 0.346
Q16. Information/symbols about whether it includes hazardous
substances to health
12.635 0.002*
Q17. Information about product use/preparation 9.330 0.009*
Q18. Information about quality assurance/whether it has standards 13.855 0.001*
Q19. Information about probable side effects 12.997 0.002*
Q20. Price 30.026 0.000*
Q21. Information about storage 4.258 0.119
Q22. Information about recycling of package disposal 2.369 0.306

International Journal of Business and Management Review
Vol.2, No.4, pp. 80-103, September 2014
Published by European Centre for Research Training and Development UK (www.eajournals.org)
96
ISSN: 2052-6393(Print), ISSN: 2052-6407(Online)
According to chi-square significance test results in Table 6, the difference in “product name”
(p=0.003*), “brand” (p=0.000*), “manufacturer” (p=0.001*), “ingredients” (0.009*), “net
weight” (p=0.000*), “production date” (p=0.002*), “expire date” (p=0.000*), “shelf life”
(p=0.006*), “information/symbols about whether it is a natural/organic product” (p=0.006*),
“information/ symbols about whether it includes hazardous substances to health” (p=0.002*),
“information about product use/preparation”(p=0.009*), “information about quality
assurance/whether it has standards” (p=0.001*), “information about probable side effects”
(p=0.002*) and “price” (p=0.000*) are significant. In other words, the differences between
the independent variables and the information read on the label during cosmetic product
purchasing process and the effect of label are found to be statistically significant. On the
other hand, it is remarkable that the differences between the university students’ opinions
about information/symbols for whether animal tests are conducted for the products, storage
conditions, recycling of package disposal and origin of the product and the effect of label are
not found to be statistically significant. This shows sensitivity of the students to the variables
listed.
Using the variables found to be significant according to chi-square significance test in Table
6 to determine whether label is effective on cosmetic product purchasing process, logistic
regression analysis is conducted.In logistic regression analysis, “enter method” is used while
measuring the independent variable “the effect of label during cosmetic product purchasing
process.
Table 7 shows k parameters and Wald statistics for these parameters, degrees of freedom,
significance levels and Exp( k ) (oods).
Table 7. Logistic Regression Analysis Results According to Enter Method
Variable k S.E. Wald df Sig. Exp( k )
Conctant -0.880 0.226 15.204 1 0.000 0.415
Q1 0.807 0.231 11.874 1 0.003 0.325
Q2 1.069 0.262 18.610 1 0.000 0.894
Q3 1.123 0.209 14.950 1 0.001 0.387
Q5 1.124 0.210 9.453 1 0.009 0.674
Q7 -0.966 0.197 15.424 1 0.000 0.808
Q8 1.023 0.236 12.816 1 0.002 0.359
Q9 -0.649 0.268 19.197 1 0.000 0.940
Q10 -0.840 0.217 10.119 1 0.006 0.362
Q14 -0.075 0.215 10.257 1 0.006 0.730
Q16 0.311 0.203 12.635 1 0.002 0.747
Q17 0.440 0.241 9.330 1 0.009 0.643
Q18 0.397 0.266 13.855 1 0.001 1.488
Q19 1.016 0.269 12.997 1 0.002 0.410
Q20 1.127 0.294 30.026 1 0.000 0.959

International Journal of Business and Management Review
Vol.2, No.4, pp. 80-103, September 2014
Published by European Centre for Research Training and Development UK (www.eajournals.org)
97
ISSN: 2052-6393(Print), ISSN: 2052-6407(Online)
Table 7 shows that all the independent variables are significant in the effect of label on
students’ purchasing process of cosmetic products (p<0.05).
The values of Exp( k ) in Tablo 7 shows odds rates. Since probability rate is the ratio of the
probability of an event’s occurring to not occurring, Exp( k ) denotes how many times more
or which percentage more Y variable has the probability of being observed with the effect of
Xk variable (Menard, 1995). In other words, odds rate shows the probability of observing two
cases are how many times more or how many times less probable than one another.
The results show that since ( k ) coefficients for Q7, Q9, Q10, Q14 independent variables are
negative, odds rate is interpreted as decreasing due to the negative relation. The probability
of label to be effective on cosmetic product purchasing process for a new student in terms of
Q7 variable is 0.808 times less probable than not to be effective, whereas Q20 variable
increases the probability of a label to be effective on cosmetic product purchasing process for
a new individual 0.959 times. Therefore, the equation for classification is as below:
9875321 Q649.0Q023.1Q966.0Q124.1Q123.1Q069.1Q807.0880.0 Y
20191817161410 Q127.1Q016.1Q397.0Q440.0Q311.0Q075.0Q840.0
(6)
Validity of the model has been tested using Hosmer Lemeshow test.
H0: The prediction equation is significant.
H1: The prediction equation is not significant.
As a result of Hosmer Lemeshow test, chi-square value is computed X2 (p=0.265)= 9.995 and
since (p>0.05) is obtained, H0 hypothesis is accepted.
Analysing Table 8, which shows the classification success of the logistic model to find the
effect of label on the students’ cosmetic product purchasing process, it is seen that the rate of
accurate classification/accrediting of the observations in Logistic Regression model is 86.2%.
ın other words, the model predicts 86.2% of 442 students accurately.As a result of this
analysis, 57 students, who consider label in the purchasing process of cosmetic products, are
not classified accurately and so are accredited to the other group, while a wrong classification
is done by accrediting 4 students who don’t consider label in the purchasing process of
cosmetic products to the group of the students who are affected by label. In other words,
98.9% of the students who decide upon the effect of label during the purchasing process of
cosmetic products and 13.6% of those who don’t consider label in the purchasing process of
cosmetic products are predicted accurately.

International Journal of Business and Management Review
Vol.2, No.4, pp. 80-103, September 2014
Published by European Centre for Research Training and Development UK (www.eajournals.org)
98
ISSN: 2052-6393(Print), ISSN: 2052-6407(Online)
Table 8. Classification Results According to Enter Method
Predicted
Observed 1 (Label information is
effective on purchasing
process of cosmetic
products.)
2 (Label information is
not effective on
purchasing
process of cosmetic
products.)
Percentage
Correct
1
2
372 4 98.9
57 9 13.6
OVERALL 86.2
CONCLUSIONS AND RECOMMENDATIONS
Brands efforts to distinguish themselves from their rivals to gain competitive advantage are
reflected intensely to both manufacturing and selling processes. Especially customers being
more conscious and aware and their efforts to purchase the product/brand that will give them
the most benefit make brands focus more on product development efforts and force them to
inform customers in various ways about such efforts. Label is used by brands to inform
customers about a product. Due to this task of label, it should be easily distinguishable and
comprehensible and it should be able to give the customer the product information
thoroughly. By using label accurately and efficiently in numerous products like food, health,
textile and cosmetics, as well as increasing the benefit customers can get from that product, a
reliable communication process will also be ensured for the business. Cosmetic products are
currently used extensively by a lot of people for personal hygiene and care. Such an intensive
demand for cosmetic products and the probability of involving hazardous ingredient
substances for health require more careful choice in such products.
In this study, regression analysis is used to determine whether label is effective on cosmetic
product purchasing process of 442 students at Dumlupınar University and the effect of the
information on the labels of such products on the product purchasing process. Logistic
regression analysis- which is used as a discrimination model in accrediting observations to
groups in cases in which the dependent variable has two levels and there are categorical
variable(s) among independent variables and which has recently found a wide application
area as alternative to discriminant analysis- is also reviewed briefly in this study.
In the study, at first, whether label is effective on cosmetic product purchasing process is
predicted using logistic regression analysis. For this purpose, it is first determined through the
biggest probability coefficient predictions and forward variable selection technique that the
variables effective in the fact that label is effective on cosmetic product purchasing process

International Journal of Business and Management Review
Vol.2, No.4, pp. 80-103, September 2014
Published by European Centre for Research Training and Development UK (www.eajournals.org)
99
ISSN: 2052-6393(Print), ISSN: 2052-6407(Online)
are gender (1-Female), preference of the same brand (1-Yes) and frequency of reading the
information on label (1-Always, 2-Sometimes). The accurate classification rate according to
logistic regression analysis is determined 85.3%. Accordingly, it is understood that customers
give importance to the information on labels during purchasing process of cosmetic products
and so label is effective on purchasing behaviour.
According to the chi-square test result, it is also seen that the equation is significant.
Therefore, it is accepted that equation (5) for logistic regression is the most appropriate
discrimination equation.
Also, evaluating the frequency of students’ reading the information on labels during cosmetic
product purchasing process, it is determined that students “always” read the information
about “the product name” (%84.4). On the other hand, students “never” read the information
on the label about batch no (% 67.4).
As a result of regression analysis conducted to determine whether the information on
cosmetic labels is effective on cosmetic product purchasing process, equation (6) is predicted.
According to this equation, it is determined using “enter method” that the variables in the fact
that label is effective on cosmetic product purchasing process are product name, brand,
manufacturer, ingredients, net weight, production date, expire date, shelf life,
information/symbols about whether it is natural/organic, information/symbols about whether
it involves hazardous ingredient substances to health, information about product
use/preparation, information about whether it has quality assurance/standards, information
about probable side effects it might cause and price. The result of this equation shows upon
which information on the label students decide to buy cosmetic products. Therefore,
designing the information on labels of cosmetic products more legibly and comprehensibly
will contribute to gaining more benefit from those products for customers through getting
more and clear information and thus increasing the effect of label on customers’ purchasing
process.
Logistic regression analysis gives 86.2% for accurate classification rate. The result of Hosmer
Lemeshow test shows that the equation is significant. Therefore, equation (6) for logistic
regression is found to be the most appropriate classification equation.
As in various areas, sheer competition among cosmetic brands required them to form and
develop a solid relation with their customers; otherwise, customers’ shifting to a rival brand
is inevitable. Label is one of the ways to form communication with customers and to inform
them about the product/brand. In this study, determining the effect of label on students’
purchasing process of cosmetic products and the effect of every piece of information on the
label on purchasing process separately will presents guiding hints for cosmetic product
brands to design labels.
International Journal of Business and Management Review
Vol.2, No.4, pp. 80-103, September 2014
Published by European Centre for Research Training and Development UK (www.eajournals.org)
100
ISSN: 2052-6393(Print), ISSN: 2052-6407(Online)
FUTURE RESEARCH
A wider evaluation with a bigger sample and different universities in future studies might
reveal more detailed results. It will also compared whether label is effective on cosmetic
product purchasing process between students of state and special universities.
REFERENCES
Abduh, M., Dahari, Z. & Omar, Mohd A. (2012). Bank Customer Classification in Indonesia:
Logistic Regression Vis-a-vis Artificial Neural Networks, World Applied Sciences
Journal, 18(7), 933-938.
Agaku, I. T., Adisa, A. O., Akinyamoju, A. O. & Agboola, S. O. (2013). A Cross-Country
Comparison of the Prevalence of Exposure to Tobacco Advertisements among
Adolescent Aged 13-15 Years in 20 Low and Middle Income Countries, Taboocco
Induced Diseases, 11(11), 1.
Agresti, A. (1996). An Introduction to Categorical Data Analysis, John Wiley and Sons. Inc.,
p.103.
Annunziata , A. & Vecchio, R. (2012). Factors Affecting Use and Understanding of Nutrition
Information on Food Labels: Evidences from Consumers, Agricultural Economics
Review, 13(2), 103-114.
Başarır, G. (1990), Çok Değişkenli Verilerde Ayrımsama Sorunu ve Lojistik Regresyon
Analizi, Hacettepe Üniversitesi Sosyal Bilimler Enstitüsü Doktora Tezi, 1-36, Ankara.
Baxter, S. (2009). Learning Through Experience: The Impact of Direct Experience on
Children’s Brand Awareness, Marketing Bulletin, 20, 1-13.
Calafat, A. M., Ye, X., Wong, L., Bishop, A. M. & Needham, L. L. (2010). Urinary
Concentrations of Four Parabens in the U.S. Population, Division of Laboratory
Sciences, National Center for Environmental Health, Environmental Health
Perspective, Centers for Disease Control and Prevention, , Atlanta, 118(5), 679-684.
Colipa, (2011). The European Cosmetics Association, Colipa Guidelines on Cosmetic
Product Labelling, 1-32.
Crowe, S. (2007). The Coalition for Consumer Information on Cosmetics & The Leaping
Bunny Logo, University of California, San Diego, 1-17.
Cruz, A. G., Cadena, R. S., Faria, J.A.F., Oliveira, C.A.F., Valcanti, R.N., Bona, E., Bolini,
H.M. & Silva, M. A. A P DA, (2011). Consumer Acceptability and Purchase Intent of
Probiotic Yoghurt with Added Glucose Oxidase Using Sensometrics, Artificial Nuural
Networks and Logistic Regression, International Journal of Dairy Technology, 64(4),
549.
Demirtaş, E.A., Anagun, A.S. & Köksal, G. (2009). Determination of Optimal Product Styles
by Ordinal Logistic Regression Versus Conjoint Analysis for Kitchen Faucets,
International Journal of Industrial Ergonomics, 39, 866-875.
Drichoutis, A. C., Lazaridis, P. & Nayga, R. (2006). Consumers’ Use of Nutritional Labels:
A Review of Research Studies and Issues, Academy of Marketing Science Review,
No.9, 1-22.
Erdoğan, B.Z. (2014). Pazarlama İlkeler ve Yönetim, Ekin Basım Yayım Dağıtım, Bursa.
European Food Information Council,(2013). Global Update on Nutrition Labelling, Belgium.

International Journal of Business and Management Review
Vol.2, No.4, pp. 80-103, September 2014
Published by European Centre for Research Training and Development UK (www.eajournals.org)
101
ISSN: 2052-6393(Print), ISSN: 2052-6407(Online)
European Commission, (1999). Guidelines Cosmetic Products: The Rules Governing
Cosmetic Products in the European Union.
Fanghell, P.D.P. & Catone, T. (2011). The CLP Regulation: Origin, Scope and Evolution,
Ann Ist Super Sanita, 47(2), 126-130.
Fogel, J. & Raghupathi, V. (2013). Spam E-mail Advertisements for Cosmetic/Beauty
Products and Consumer Behavior, Journal of Business Theory and Practice, 1(1), 28-
35.
Gauthier, C., Classen, A., Boucher, Q., Heymans, P., D.Storey, M-A. & Mendonça, M.
(2010). VaMoS, Volume 37 of ICB-Research Report, pp.163-166. Universität
Duisburg-Essen.
Gordon, R., Harris, F., Mackintosh, A.M. & Moodie, C. (2011). Assessing the Cumulative
Impact of Alcohol Marketing on Young People’s Drinking: Cross-Sectional Data
Findings, Addiction Research and Theory, 19(1),66.
Guido, G., Prete, M. I., Miraglia, S. & Mare, I.D. (2011). Targeting Direct Marketing
Campaigns by Neural Networks, Journal of Marketing Management, 27(Nos.9-10),
993.
Haberman, S. (1978). Analysis of Qualitative Data (Vol.1.).New York: Academic Press.
Hosmer, D. W., Lemeshow, S. (2000). Appled Logistic Regression (2nd ed.). New York:
Wiley.
Kapucu, E., Kahveci, H., Susam, Ö. & Çanta, Y. (2013). İlaçların ve Kozmetik Ürünlerin
Geliştirme Süreçleri ve Doğa Üzerine Etkileri, Dokuz Eylül Üniversitesi, Buca Eğitim
Fakültesi, Fen Bilgisi Öğretmenliği, http://kisi.deu.edu.tr/bulent.cavas/ders/bok5.doc.
09.08.2014.
Kiesel, K., McCluskey, J. & Villas-Boas, S.B. (2011). Nutritional Labeling and Consumer
Choices, Annual Review of Resource Economics, 3, 21-30.
Kim, S-Y, Nayga, R.M. & Capps, O. (2000). The Effect of Food Label Use on Nutrient
Intakes: An Endogenous Switching Regression Analysis, Journal of Agricultural and
Resource Economics, 25(1), 215-231.
Klaschka, U. (2012). Dangerous Cosmetics- Criteria for Classification, Labelling and
Packaging (EC 1272/2008) Applied to Personal Care Products, Environmental Sciences
Europe, 24-37.
Kotler, P. & Armstrong, R., (2008). Principles of Marketing, 12 th Ed. Upper Saddle,
NJ:Pearson Prentice Hall.
Kotler P., (2003). Marketing Insights From A to Z- 80 Concepts Every Manager Needs to
Know, John Wiley & Sons, Inc., New Jersey, 27.
Kulcsar, E. (2010). Marketing Research on Tourist Consumer Opinions and Behavior in the
Center Development Region, Theoretical and Applied Economics, Vol.17, No.6(547),
75.
Ling, P.M., Lee, Y.O., Hong, J., Neilands, T.B., Jordan, J.W. & Glantz, S.A. (2014). Social
Branding to Decrease Smoking Among Young Adults in Bars, American Journal of
Public Health, 104(4), 751.
Menard, S. (1995). Applied Logistic Regression Analysis (Sage University Paper Series on
Quantitative Applications in the Social Sciences, 07-106). Thousand Oaks, CA:Sage.

International Journal of Business and Management Review
Vol.2, No.4, pp. 80-103, September 2014
Published by European Centre for Research Training and Development UK (www.eajournals.org)
102
ISSN: 2052-6393(Print), ISSN: 2052-6407(Online)
Migueis, V.L., Camanho, A. & Cunha, J.F. (2013). Customer Attrition in Retailing: An
Application of Multivariate Adaptive Regression Splines, Expert Systems with
Applications, 40, 6225.
Nanda, S. (2006). Cosmetic and Consumer, Department of Pharmaceutical Sciences,
Maharshi Dayanand University, Rohtak, 1-3.
Nayga, R.M. (1999). Toward an Understanding of Consumers’ Perceptions of Food Labels,
International Food and Agribusiness Management Review, 2(1), 29-43.
Nayga, R.M., Lipinski, D. & Savur, N. (1998). Consumers’ Use of Nutritional Labels While
Food Shopping and At Home, The Journal of Consumer Affairs, 32(1), 106-119.
Newerli-Guz, J. (2012). Labelling of Organic and Natural Cosmetic Products in Harmonized
Standards, Zeszyty Naukowe Akademii Morskiej w Gdyni, ISSN 1644-1818, 36-42.
Odabaşı, Y. & Oyman, M. (2002). Pazarlama İletişimi Yönetimi, 11. Baskı, MediaCat
Kitapları, ISBN:975-8378-73-2 Eskişehir, 244-251.
Ollberding, N.J., Wolf, R. & Contento, I. (2010). Food Label Use and Its Relation to Dietary
Intake among US Adults, Journal of American Dietetic Association, 110, 1233-1237.
Perreault, W.D. & McCarthy, E. J. (2002). Basic Marketing, McGraw-Hill Irwin, 127.
Prathiraja P.H.K. & Ariyawardana A. (2003). Impact of Nutritional Labeling on Consumer
Buying Behavior, Sri Lankan Journal of Agricultural Economics, 5(1), 35.
Philipson, T. (2005). Goverment Perspective:Food Labeling. Am J Clin Nutr, 82(1), Suppl.
262-264.
Press, J.& Simms, C. (2010), Segmenting Cosmetic Procedures Markets Using Benefit
Segmentation: A Study of the Market for Tooth Whitening Services in the United
Kingdom, Journal of Medical Marketing, 10, 183-196.
Press, S.J. & Wilson, S. (1978). Choosing Between Logistic Regression And Discriminant
Analysis, Journal of American Statistical Association, 73(364), 699-705.
Prinz, M-J, (2013). CLP Regulation & 2015 Deadline for Mixtures, CEFIC REACH
Information and Experience Exchange Forum, Zaventem, 1-20.
Schlesselman, J.J. (1982). Case Control Studies: Design, Control, Analysis. New York:
Oxford University Press.
Shao, X. & Li, L. (2011). Data-Driven Multi-touch Attribution Models, KDD’11 August 21-
24, San Diego, California, USA, 258-263.
The Controlled Substances, Drugs, Device and Cosmetic Act, 1972, P.L. 233, No.64,
Commonwealth of Pennsyvania.
Thomson, R. (2011). European Product Labelling Guide, Enterprise Europe Network,
Scotland.
Toppinen, A., Toivonen, R., Valkeapaa, A. & Ramo, A-K. (2013). Consumer Perceptions of
Environmental and Social Sustainability of Wood Product in the Finnish Market,
Scandinavian Journal of Forest Research, 28(8),775.
Türkiye İlaç ve Tıbbi Cihaz Kurumu Kozmetik Ürünler Tüketici Bilgilendirme Kılavuzu.
(Turkish Drug and Medical Device Institution)
http://212.174.130.226/Folders/News/Folders/Kozmetikler%20%C5%9Eube%20M%C
3%BCd%C3%BCrl%C3%BC%C4%9F%C3%BC/Kozmetik_%C3%9Cr%C3%BCnler
_T%C3%BCketici_Bilgilendirme_K%C4%B1lavuzu_677f5ca.pdf, 10.08.2014.

International Journal of Business and Management Review
Vol.2, No.4, pp. 80-103, September 2014
Published by European Centre for Research Training and Development UK (www.eajournals.org)
103
ISSN: 2052-6393(Print), ISSN: 2052-6407(Online)
Unnithan, A.B. (2003). Influence of Personality Factors on the Consumption of Personal Care
Products, Doctor Thesis, School of Management Studies Cochin University of Science
and Technology, Kerala, 146.
Uva, W-F L. & Cheng, M-L. (2005). Consumer Willingness to Pay and Marketing
Opportunities for “Quality Guaranteed Tree-Ripened” in New York State, Journal of
Food Distribution Research 36(1), 177-184.
Utami, H. D., Rauniyar, G., Bailey, W.C., Morris, S. & Purnomo, H. (2007). Marketing
Strategy as Food Processor Response Towards Malang Meatballs, Food Products
Marketing, 13(4), 79.
Winterich, K.P. & Barone, M.J. (2011). Warm Glow or Cold, Hard Cash? Social Identify
Effects on Consumer Choice for Donation Versus Discount Promotions, Journal of
Marketing Research, 48, 855.
Yeung, R.M.W. & Yee, W.M.S. (2011). Logistic Regression: An Advancement of Predicting
Consumer Purchase Propensity, The Marketing Review, 11(1),71-81.