determining the appropriate benchmark: a review of … in the past, indexes from various providers...
TRANSCRIPT

Connect with Vanguard > vanguard.com
Executive summary. Investors charged with overseeing a portfolio, either for themselves or others, often evaluate benchmarks to gain perspective on their investments’ performance. Absolute results reveal little about why a gain or loss occurred—for example, was it a result of buying decisions, of sector weightings, of market trends, or a combination of these? But relative results—obtained through comparison with market indexes—can shed considerable light on such questions.
All the major market indexes have been developed by long-established, well-respected providers. Investors generally assume that these indexes are equally fair, relevant, and accurate representations of market performance. Applied correctly, the indexes are indeed valuable tools for judging investment returns.
Vanguard research October 2012
Determining the appropriate benchmark: A review of major market indexes
Authors
Christopher B. Philips, CFA
Francis M. Kinniry Jr., CFA

2
In the past, indexes from various providers have been constructed differently. Over the past several years, however, the methodologies of prominent index providers have converged, alleviating somewhat the challenges previously faced by investors when evaluating similar indexes across providers. The similarities across providers can be seen in correlations, which—since the indexes’ inceptions—have almost consistently exceeded 0.95 in both large-capitalization and small-cap benchmarks. In less volatile market environments, as index practices have become more alike, it is reasonable to expect fewer differences in the returns of same-style benchmarks. During periods of extreme market conditions, however, the differences in returns produced by various index methods may be magnified.
Given the potential impact of a benchmark’s performance on investment decisions for both portfolio managers and those charged with evaluating managers, it is important to understand the measurement tool that is used. This paper examines how the major index providers construct and maintain their measures. We also offer insight into the limitations and challenges of certain indexing methods. Investors need to evaluate benchmarks critically to ensure that the ones they use are appropriate for the investment vehicle involved. Only then can performance differences be analyzed with confidence.
Traditionally, indexes from various providers have been constructed differently, often leading to highly contrasting results—even when measuring similar market segments. This was especially apparent over the past two decades, when return volatility was significant and the dispersion of returns across market segments was historically wide.
For example, over the ten years ended December 31, 1998, large-cap stocks (as reflected by the Russell 1000 Index) cumulatively outperformed small-cap stocks (as reflected by the Russell 2000 Index) by more than 230 percentage points. However, over the ten years ended December 31, 2009, the
leadership reversed: Small-cap stocks cumulatively outperformed large-cap stocks by about 45 percentage points. Similarly, the Russell 3000 Growth Index significantly outperformed the Russell 3000 Value Index in the late 1990s, but value stocks overtook growth stocks in the 2000s.
After the fact, one can rationalize why one benchmark outperformed its counterparts, based on prevailing market conditions and differences in construction methods. However, as we know, cyclicality is not predictable, so there is no theoretical reason to believe any market segment, or any index provider, will outperform in the future (Philips and Kinniry, 2009).

1 As of July 1, 2012, the McGraw-Hill Companies, owners of the Standard & Poor’s series of indexes, and CME group, owners of the Dow Jones series of indexes, merged. As of September 2012, it is unclear whether or how the various benchmarks identified in this report might change as a result of the merger.
3
Where to start?
Index coverageIn evaluating different index providers, an investor must first understand the relative market exposure that can be obtained from using different index providers. Figure 1, on page 4, shows the relative coverage of key U.S. broad-market benchmarks and their subcomponent indexes (large-, mid-, or small cap).1 The first decision for an investor in choosing among index providers should be the degree of total coverage desired. The investor should recognize, for example, that extending coverage further into small-cap stocks by increasing the number of securities only adds marginally to the market capitalization coverage of an index and, hence, to the effect on performance. As we discuss next, index providers also differ in the ways they select, and weight, securities in the benchmarks’ return calculation.
Index construction Building an index requires decisions on three key issues: Security selection and weighting, calculation of returns, and ongoing maintenance of the index.
Security selection and weighting. Securities are selected for index inclusion on either a subjective basis or a rules-based approach. Subjectively based methods rely on criteria developed by the index provider. For example, the Standard & Poor’s 500 Index is intended to reflect the movements of the aggregate U.S. economy, and is constructed based on Standard & Poor’s proprietary criteria. Other
indexes use objective, rules-based methods to select stocks based on factors such as relative market capitalization. For example, the Russell 1000 Index represents the large-cap segment of the U.S. market, and, appropriately, it is constructed of the 1,000 securities with the largest market capitalizations as of a predetermined date. For a detailed breakdown of individual index methodologies for the most prominent benchmark providers, refer to the appendix.
Notes on risk: Past performance is no guarantee of future results, including the possible loss of the money you invest. All investments, including a portfolio’s current and future holdings, are subject to risk. The performance of an index is not an exact representation of any particular investment, as you cannot invest directly in an index. Prices of mid- and small-cap stocks often fluctuate more than those of large-company stocks.
ETF Shares can be bought and sold only through a broker (who will charge a commission) and cannot be redeemed with the issuing fund. The market price of ETF Shares may be more or less than net asset value.
This document is for educational and general information purposes only and is not a recommendation to buy or sell investments.
The changing landscape of U.S. indexes
Over time, the landscape of index providers, as well as the indexes designed to represent U.S. stocks or segments of U.S. stocks, has evolved. One of the first U.S. market indexes, the Dow Jones Industrial Average, was a price-weighted basket of stocks selected by Charles Dow and Edward Jones in 1896 to be representative of the U.S. economy (in 1896 the index comprised just 12 stocks; today there are 30). Over the 20th century, new index providers entered the index marketplace, most notably Standard & Poor’s in the 1920s, and in the second half of the century, other well-known providers such as Wilshire, Russell, and MSCI. More recently, FTSE and CRSP have entered the market, with competitive offerings (see Figure 1 and the appendix for detailed descriptions of major U.S. index providers and their methodologies).

4
Figure 1. Market coverage of major U.S. index providers
Notes: Although each provider listed has an index intended to mirror the entire stock market, including the micro-cap segment, investors typically use the index that encompasses only large-, mid-, and small-cap securities to represent the broad U.S. market. Those indexes are shown in the light blue bars for each index provider.
Sources: Vanguard, Dow Jones, Russell, Standard & Poor’s, MSCI, CRSP, and FTSE.
Dow JonesU.S. Total
Stock Market(TSM) Index
(all listedsecurities)
Dow JonesBroad StockMarket Index
(1–2,500)
Dow JonesU.S. Large-Cap
TSM Index(1–750)
Dow JonesU.S. Small-Cap
TSM Index(751–2,500)
Dow JonesU.S. Mid-Cap
TSM Index(501–1,000)
Russell3000E Index(99% of U.S.market cap)
Russell3000 Index(1–3,000)
Russell1000 Index(1–1,000)
Russell2000 Index
(1,001–3,000)
RussellMidcap Index
(201–1,000)
RussellTop 200 Index
(1–200)
S&P TotalMarket Index
(all listedsecurities)
S&PComposite1500 Index(1–1,500)
S&P500 Index
(1–500)
S&P MidCap400 Index(501–900)
S&P SmallCap600 Index
(901–1,500)
Russell S&PDow Jones
FTSEMSCI CRSP
MSCI USBroad Market
Index(99.5% of
U.S. marketcap)
MSCI USInvestable
Market2500 Index(1–2,500)
MSCI USPrimeMarket
750 Index(1–750)
MSCI USSmall Cap1750 Index(751–2,500)
MSCI USMid Cap
450 Index(301–750)
MSCI USLarge Cap300 Index
(1–300)
CRSP USTotal Market
Index(99.5% ofinvestable
U.S.market cap)
CRSP USLarge Cap
Index(85% of
market cap)
CRSP USMega Cap
Index(70% of
market cap)
CRSP USMid Cap
Index (15%of market cap)
CRSP USSmall Cap
Index (13.5%of market cap)
FTSEUS TotalMarketIndex
(99.5% ofU.S.
market cap)
FTSE USTM LargeCap Index
(70% ofmarket cap)
FTSE USTM Mid Cap
Index (20% ofmarket cap)
FTSE US TMSmall Cap
Index (9.5% ofmarket cap)

5
In the equity markets, weighting securities according to market capitalization is the most commonly used method: Market Cap = Price per Share X Number of Shares Outstanding.2 This is because a benchmark should reflect the market or market segment that it is intended to measure. Market-cap-weighted indexes reflect the consensus estimate of each company’s value at any given moment. In any open market, new information—economic, financial, or company specific—affects the price of one or more securities and is reflected instantaneously in the index via the change in its market capitalization.
Thus, a continuously updated market index indicates how a market is performing, as well as the market’s structural and risk characteristics at any given point. Since current prices (and, hence, company values) are set based on current and expected events, cap-weighted indexes represent the expected, theoretically mean-variance efficient portfolio of securities in a given asset class. In addition, market- cap-weighted indexes are continuously reweighted, and turnover is limited to changes in the index’s constituents or in their shares outstanding due to corporate events such as share buybacks or issuances. Recognizing that market-cap-weighted indexes represent the market proxy for a given market, our analysis focuses on market-cap- weighted indexes.3
Since most indexes are market-cap weighted, an investment portfolio that is not also market-cap weighted won’t reflect the average return of the money invested in that market. Such portfolios are therefore not indexed to a specific market and, instead, are designed to deliver a return that differs from the market’s return. Both active managers and those who oversee rules-based passive strategies believe that they possess information not represented in the market capitalization of a specific stock and should be evaluated based on the quality and success of those views.
Return calculations. Return calculations generally are similar for all the index-construction methodologies. The values of individual securities are totaled, and that total is linked to an initial value, which is adjusted for index reconstitutions and capital events affecting outstanding shares, such as issuances or repurchases, stock dividends, and rights or warrant offerings. Fixed income indexes generally assume that each security is purchased at the beginning of the period at the quoted offer price (or the lowest price available from a willing seller) and sold at the end of the period at the quoted bid price (or the highest price a buyer is willing to pay). In evaluating equity index providers, it is important to understand that the way a provider weights an index’s securities has a big influence on the index’s returns. For market-cap-weighted indexes, the largest companies in the index will have the largest impact on returns. For price-weighted indexes, the securities with the highest prices will have the largest impact; and, finally, in an equally weighted index, the index return will be the average return of all included securities.
2 Fixed income indexes use the market weightings of outstanding issues to weight each company.3 For a review of indexes that are weighted according to alternative metrics, see Philips et al. (2011) and Thomas and Bennyhoff (2012).

6
Maintenance. All equity-index providers periodically adjust membership to reflect market changes as well as those made necessary by corporate actions such as mergers or spin-offs. Each provider has its unique aspects, however. For example: Additions to Dow Jones indexes generally occur at the end of each month; S&P indexes are reconstituted as needed—the provider’s index committee usually meets monthly to evaluate the benchmarks, but may meet more often; MSCI conducts a quarterly review to assess economic and market conditions; and Russell reconstitutes its indexes annually in June.
As for the fixed income index providers, both Barclays and Citigroup reconstitute their investment grade indexes at month-end. Returns for each month are based on the securities listed in the index at the beginning of that month (meaning that, for the purposes of return calculations, securities are not dropped until month-end, even if they default or otherwise become ineligible).
4 Source: Dow Jones U.S. Total Stock Market Index methodology.
Total market value versus free float
When company insiders, governments, or other businesses own shares they don’t intend to sell, those shares are unavailable for trading on the open market. For a benchmark to truly represent the tradable shares, a free-float adjustment must be made: That is, the value of the non-tradable shares must be subtracted from the stock’s weighting in the index. If this is not done, companies with unavailable shares are given a larger influence in the index than they have in the open market. Their returns thus have a disproportionate impact on index calculations so that the index result does not accurately reflect the market.
The benefits of adjusting for free float apply not only to indexed investments but also to actively managed portfolios: The adjustment for free float is calculated using the market value of the shares available for trading. If 80% of a company is
available to be traded on the open market, then the security is given 80% of the weighting it would have received by using full market value.
Lockheed Martin illustrates the free-float problem. Less than 80% of Lockheed’s shares are available to be traded on the open market.4 As a result, when an index that does not adjust for free float includes the company, Lockheed’s stock gets significantly greater representation than it has in the open market.
Index providers that do not adjust for free float believe it is important to represent the true economic value of each company. Shares that are not traded still represent part of the company’s fundamental worth. However, an index that includes nontradable shares is representing part of the market that is not actually available to portfolio managers and other investors. To that degree, such indexes are less-useful yardsticks for performance.

7
Guidelines for investment practitioners
No single index is perfect for every performance evaluation situation. The differences in market coverage and index-construction methods that we have discussed can lead investment practitioners— including those who oversee portfolio managers—to varying and sometimes contrary conclusions. Once an investor understands this, what is he or she to do with the knowledge? We offer some broad considerations:
• Beforemakinganinvestmentdecisionbasedsolely on a performance comparison with an index, consider whether that benchmark truly represents the fund or investment being considered. Is it the most appropriate benchmark? If your investment goal is to maintain exposure to a particular segment of the market—for example, large-cap value—then both the fund you select and the benchmark against which you evaluate it should be an accurate representation of the large-cap value segment of the total market. For this purpose, it would be a mistake to either choose or rule out a fund on the basis of a comparison with the overall S&P 500 Index—which includes both value and growth stocks.
• Whenanalyzinganinvestment’sperformance, pay attention to the characteristics of both the investment and the benchmark. How do they compare in terms of such fundamentals as overall price/earnings ratio, price/book ratio, or yield, for example? If the investment’s relative performance compared with that of its benchmark has changed noticeably, is it because the invest-ment manager is doing something differently, or have the characteristics of the benchmark itself changed? Did fund results differ from those of the benchmark because the manager drifted from the targeted style or size of the fund intentionally or unintentionally?
• Whenreviewingeconomicanalysesinthepress,or financial reports from a company, examine performance comparisons critically. Is a portfolio manager being praised—or criticized—for results that differ from those of a major market index? If so, consider whether the comparison is valid for your investment. The underlying causes of performance variation should be evaluated in the proper context, not on what is commonly reported.
• Forinvestorsinindexfundsorexchange-tradedfunds (ETFs), a primary consideration is the ease of access and cost of implementation for investment vehicles based on various indexes. For example, an investor who is indifferent to variations in coverage or construction methodology may lean toward selecting an indexed product based on both tracking error to the targeted benchmark and the total expense ratio charged by the product provider. However, other considerations—such as existing infrastructure (in-house computer systems, for example) based on a particular benchmark provider—may cause the investor to favor a specific set of indexes.
In addition to the foregoing considerations, investors should keep in mind several key issues that may also affect the overall assessment of manager (or benchmark) performance, including: The effect of frictionless trading, variance in style definitions, style drift, and security classification.
• Frictionlesstrading.Becauseanindexdoesnotactually purchase and sell securities, its additions and deletions are “frictionless,” meaning that no transaction costs are incurred. Managers, however, do incur transaction costs when they buy and sell securities. This creates an unavoidable drag on managers’ net performance, which is exacerbated for mutual funds that seek to track benchmarks that exhibit high turnover.

8
Capitalization-weighted indexes with strict parameters can be particularly liable to such turnover at times of market volatility. Selecting a benchmark that reduces or eliminates forced turnover would therefore seem to be in a manager’s best interest.
The frictionless quality of indexes hampers performance comparisons in another respect as well: Indexes don’t have to find buyers or sellers, whereas managers do. This is especially significant with fixed income indexes. When a bond no longer qualifies for inclusion in an index— because of a credit-rating change, for example—it is removed from the index at the bid-side price at month-end. Depending on the direction of the rating change, liquidity for the affected issues can be significantly reduced. If a manager must sell a particular security because it no longer meets the portfolio’s credit-quality guideline, there may be a wait before buyers emerge. In the interim, the security’s continued presence in the portfolio may materially hurt performance relative to that of the benchmark index.
• Styledefinitions.Eachequityindexprovider relies on different criteria to classify securities as either growth or value, which can generate mixed signals when evaluating portfolio results. Some providers use multiple criteria to evaluate securities: For example, MSCI, S&P, and Dow Jones use six or seven criteria. Other providers, such as Russell, rely on only two criteria to classify securities. (See the appendix, for a detailed breakdown of individual growth and value criteria by provider.) In the real world, portfolio managers typically look at several variables when determining the style bias of a stock. S&P, Dow Jones, MSCI, and, to a lesser extent, Russell have attempted to reflect this thinking by incorporating more than one criterion into their classification methods, and have thereby created more effective style benchmarks.
• Styledrift.Styledriftreferstoafundmanager’s or a benchmark’s deviation from the designated investment style. Not surprisingly, the number of variables used to construct a benchmark has a significant impact on how the index changes over time. Those indexes with fewer variables will likely see greater turnover in constituents, potentially causing style drift during periods of outperformance by one style. This potential for drift is one reason index providers have been moving to include more criteria to categorize growth and value stocks. In addition, indexes based on more subjective criteria may add or remove securities whose valuations would meet the inclusion criteria for other rules-based indexes, creating another source of potential drift from a stated investment objective.
• Securityclassification.Eachproviderusesadifferent process to build its subcomponent indexes—for example, to create both a large-cap growth and a large-cap value index from a large- cap blend index. These differences in classifying securities, as growth or value, for instance, can lead to significant differences in performance across index providers.
More specifically, MSCI and Russell assign a composite score to each security based on their own classification criteria; this score is then used to position a security in a growth or value benchmark. Note that a stock can be classified proportionately in both a growth and a value index, depending on its composite score. Similarly, Dow Jones assigns each security a composite score based on the company’s growth and value characteristics; using this composite score, the security is then assigned to either the growth or value style so that 50% of the aggregate float-adjusted market cap is in the growth index and 50% is in the value index. S&P ranks securities on the basis of growth and value scores and subsequently places the top one-third of the securities in a pure-growth basket and the

9
bottom one-third of securities in a pure-value basket. The middle one-third contains stocks that have both growth and value characteristics; each of these stocks is then appropriately placed in either the growth or value basket, based on its distance from the midpoint of either the growth or value basket. The classification methods currently used by the various index providers are intended to mitigate the overlap between their respective style indexes as much as possible.
Choosing a suitable benchmark
As we have discussed, different providers use different methods to construct their benchmarks. As a result, benchmarks from different providers covering the same market segment have realized different returns, particularly over short and intermediate time horizons. However, in recent years, benchmark providers across the industry have begun to adopt generally recognized “best practices” in benchmark construction, including: using multiple criteria for determining style allocations, establishing market-cap bands between large-cap and small-cap indexes, and developing “style-pure” indexes, in which stocks exhibiting both growth and value characteristics are separated in a unique “blend” category.
For instance, until May 2005, S&P used a single criterion (the ratio of price to book value) to classify securities for its growth and value indexes. This led to significant style drift in periods when a particular market segment was dominant, as in the technology bubble of the late 1990s when large-cap growth stocks outpaced the rest of the market. Since then, S&P has revised its approach and now categorizes securities using six criteria, thus reducing both turnover and style drift. In 2007, Russell instituted a 2.5% market-cap band so that when the indexes reconstitute every June, turnover (i.e., securities moving from the Russell 2000 Index to the Russell 1000, or vice versa) would decrease. These are just two examples of how benchmark providers have sought to improve their construction processes based on the most relevant factors facing investors and practitioners in the industry.
To what degree have such different processes contributed to relative returns? Figure 2, on page 10, which plots the rolling 12-month excess returns (for example, the return of the S&P 500 Index versus the return of the Russell 1000 Index) among large-cap and small-cap benchmarks since 1979, shows that despite the sometimes significant differences in coverage across providers, there have been no periods of sustained outperformance by one benchmark over another. Market leadership has changed at irregular intervals, and by varying degrees, reinforcing that there is no reason to believe any particular benchmark will have a sustainable performance advantage in any particular market environment.
The potential impact of different index practices can be examined further by analyzing the rolling correlations across providers. Figure 3, on page 11, plots the 12-month rolling correlations between large-cap and small-cap benchmark providers since 1979. Again, the figure indicates that differences in index coverage and construction have not led to significant variation in performance across providers: Correlations across large-cap providers have been anchored between 0.96 and 1.0; and, similarly, in the small-cap space, correlations across providers have remained between about 0.93 and 1.0. This suggests that the benchmarks’ returns were most heavily influenced by systematic risk factors and not methodology differences. Given the changes in benchmark methodologies in the past few years, we would expect to see benchmarks perform even more similarly in the future, and to have even higher correlations. During periods of extreme market conditions, however, the differences in returns produced by various index methodologies may be magnified.
Some key terms
Price/book ratio: Current stock price divided by current book value.
Price/earnings ratio: Current stock price divided by current earnings per share.

10
Figure 2.
a. Rolling 12-month excess returns across large-cap blend benchmarks
b. Rolling 12-month excess returns across small-cap blend benchmarks
Relative performance across index providers: 1979–June 2012
Sources: Vanguard calculations, using data from Thomson Reuters Datastream. Large-cap blend benchmarks include: S&P 500 Index, Russell 1000 Index, MSCI US Prime Market 750 Index, and Dow Jones U.S. Large-Cap Index. Small-cap blend benchmarks include S&P SmallCap 600 Index, Russell 2000 Index, MSCI US Small Cap 1750 Index, and Dow Jones U.S. Small-Cap Index. Comparable data for FTSE and CRSP indexes were unavailable as of this publication.
–6
–4
–2
0
2
4
6%
Russell versus MSCIRussell versus Dow Jones MSCI versus Dow Jones
S&P versus RussellS&P versus MSCIS&P versus Dow Jones
Dec.1979
Dec.1981
Dec.1983
Dec.1985
Dec.1987
Dec.1989
Dec.1991
Dec.1993
Dec.1995
Dec.1997
Dec.1999
Dec.2001
Dec.2003
Dec.2005
Dec.2007
Dec.2009
Dec.2011
–20
–15
–10
–5
0
5
10
15
20%
Dec.1979
Dec.1981
Dec.1983
Dec.1985
Dec.1987
Dec.1989
Dec.1991
Dec.1993
Dec.1995
Dec.1997
Dec.1999
Dec.2001
Dec.2003
Dec.2005
Dec.2007
Dec.2009
Dec.2011

11
Figure 3.
a. 12-month rolling correlations across large-cap blend benchmarks
b. 12-month rolling correlations across small-cap blend benchmarks
Rolling correlations across index providers: 1979–June 2012
Sources: Vanguard calculations, using data from Thomson Reuters Datastream. See Figure 2 for benchmarks used.
Russell versus MSCIRussell versus Dow Jones MSCI versus Dow Jones
S&P versus RussellS&P versus MSCIS&P versus Dow Jones
Dec.1979
Dec.1981
Dec.1983
Dec.1985
Dec.1987
Dec.1989
Dec.1991
Dec.1993
Dec.1995
Dec.1997
Dec.1999
Dec.2001
Dec.2003
Dec.2005
Dec.2007
Dec.2009
Dec.2011
Dec.1979
Dec.1981
Dec.1983
Dec.1985
Dec.1987
Dec.1989
Dec.1991
Dec.1993
Dec.1995
Dec.1997
Dec.1999
Dec.2001
Dec.2003
Dec.2005
Dec.2007
Dec.2009
Dec.2011
0.95
0.96
0.97
0.98
0.99
1.00
0.90
0.91
0.92
0.93
0.94
0.95
0.96
0.97
0.98
0.99
1.00

12
Conclusion
Because the major market indexes have been developed by long-established, well-respected providers, most investors generally assume that all indexes are equally fair, relevant, and accurate representations of the performance of the selected overall market or market segment. As we have discussed, however, benchmarks from different providers covering the same market segment have historically realized different returns, particularly over short and intermediate time horizons.
Over the past several years, the methods of the most prominent index providers have converged, alleviating somewhat the challenges previously faced by investment practitioners when evaluating similar indexes across providers. The similarities across providers can be seen in both excess returns and correlations, which—especially in recent years— have been more similar than different.
Ultimately, there are no universal criteria for choosing an appropriate benchmark. This is a highly individual decision that comes down to personal preference, the accessibility of the index, and, for investors looking for index funds or ETFs, literally, the price one will ultimately pay to get exposure to a particular provider. Some investment practitioners have strong preferences for a particular methodology; others have idiosyncratic circumstances (such as in-house computer systems that may be based on a particular index provider) that favor a particular methodology. In the end, for those investors seeking indexed exposure to a market or market segment and who are indifferent to methodologies, an examination of cost and accessibility is a good place to start in selecting an index provider.
References
Philips, Christopher B., and Francis M. Kinniry Jr., 2009. The Active-Passive Debate: Market Cyclicality and Leadership Volatility. Valley Forge, Pa.: The Vanguard Group.
Philips, Christopher B., Francis M. Kinniry Jr., David J. Walker, and Charles J. Thomas, 2011. A Review of Alternative Approaches to Equity Indexing. Valley Forge, Pa.: The Vanguard Group.
Thomas, Charles J., and Donald G. Bennyhoff, 2012. A Review of Alternative Approaches to Fixed Income Indexing. Valley Forge, Pa.: The Vanguard Group.
13
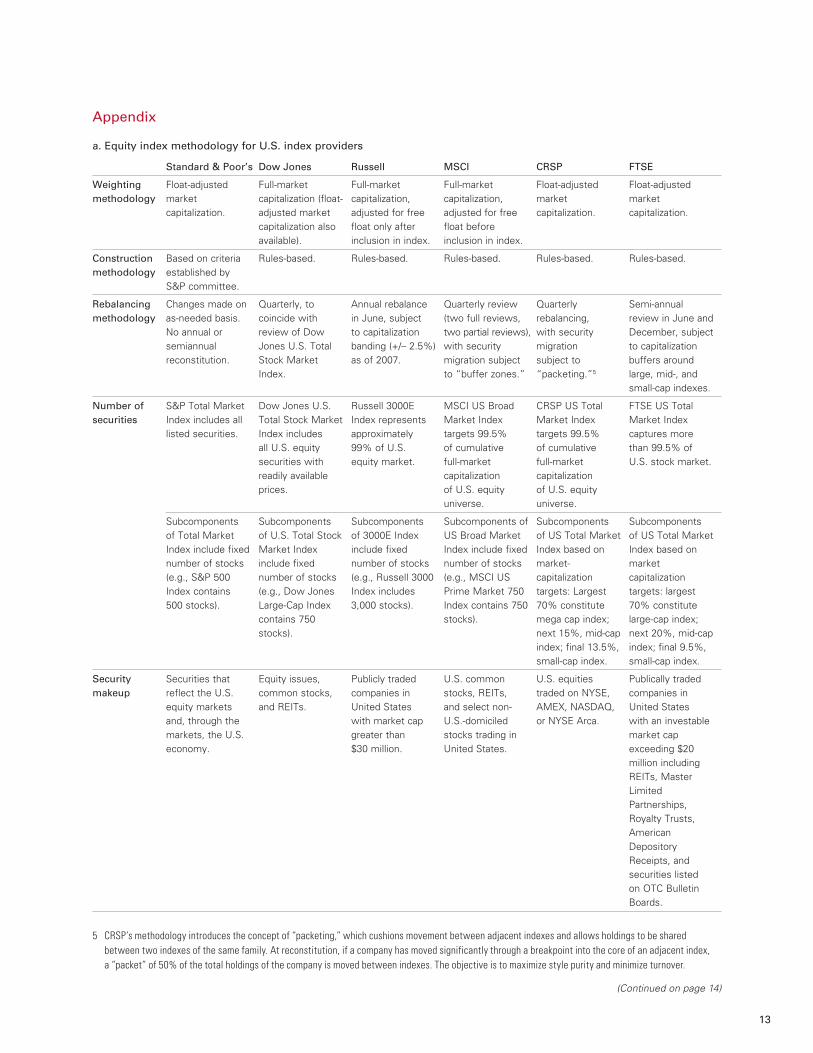
5 CRSP’s methodology introduces the concept of “packeting,” which cushions movement between adjacent indexes and allows holdings to be shared between two indexes of the same family. At reconstitution, if a company has moved significantly through a breakpoint into the core of an adjacent index, a “packet” of 50% of the total holdings of the company is moved between indexes. The objective is to maximize style purity and minimize turnover.
Standard & Poor’s Dow Jones Russell MSCI CRSP FTSE
Weighting methodology
Float-adjusted market capitalization.
Full-market capitalization (float-adjusted market capitalization also available).
Full-market capitalization, adjusted for free float only after inclusion in index.
Full-market capitalization, adjusted for free float before inclusion in index.
Float-adjusted market capitalization.
Float-adjusted market capitalization.
Construction methodology
Based on criteria established by S&P committee.
Rules-based. Rules-based. Rules-based. Rules-based. Rules-based.
Rebalancing methodology
Changes made on as-needed basis. No annual or semiannual reconstitution.
Quarterly, to coincide with review of Dow Jones U.S. Total Stock Market Index.
Annual rebalance in June, subject to capitalization banding (+/– 2.5%) as of 2007.
Quarterly review (two full reviews, two partial reviews), with security migration subject to “buffer zones.”
Quarterly rebalancing, with security migration subject to “packeting.”5
Semi-annual review in June and December, subject to capitalization buffers around large, mid-, and small-cap indexes.
Number of securities
S&P Total Market Index includes all listed securities.
Dow Jones U.S. Total Stock Market Index includes all U.S. equity securities with readily available prices.
Russell 3000E Index represents approximately 99% of U.S. equity market.
MSCI US Broad Market Index targets 99.5% of cumulative full-market capitalization of U.S. equity universe.
CRSP US Total Market Index targets 99.5% of cumulative full-market capitalization of U.S. equity universe.
FTSE US Total Market Index captures more than 99.5% of U.S. stock market.
Subcomponents of Total Market Index include fixed number of stocks (e.g., S&P 500 Index contains 500 stocks).
Subcomponents of U.S. Total Stock Market Index include fixed number of stocks (e.g., Dow Jones Large-Cap Index contains 750 stocks).
Subcomponents of 3000E Index include fixed number of stocks (e.g., Russell 3000 Index includes 3,000 stocks).
Subcomponents of US Broad Market Index include fixed number of stocks (e.g., MSCI US Prime Market 750 Index contains 750 stocks).
Subcomponents of US Total Market Index based on market- capitalization targets: Largest 70% constitute mega cap index; next 15%, mid-cap index; final 13.5%, small-cap index.
Subcomponents of US Total Market Index based on market capitalization targets: largest 70% constitute large-cap index; next 20%, mid-cap index; final 9.5%, small-cap index.
Security makeup
Securities that reflect the U.S. equity markets and, through the markets, the U.S. economy.
Equity issues, common stocks, and REITs.
Publicly traded companies in United States with market cap greater than $30 million.
U.S. common stocks, REITs, and select non-U.S.-domiciled stocks trading in United States.
U.S. equities traded on NYSE, AMEX, NASDAQ, or NYSE Arca.
Publically traded companies in United States with an investable market cap exceeding $20 million including REITs, Master Limited Partnerships, Royalty Trusts, American Depository Receipts, and securities listed on OTC Bulletin Boards.
Appendix
a. Equity index methodology for U.S. index providers
(Continued on page 14)

14
Standard & Poor’s Dow Jones Russell MSCI CRSP FTSE
Liquidity requirements
Ratio of annual dollar value traded to float-adjusted market cap should be 1.00 or greater. Company should trade a minimum of 250,000 shares in each of the six months leading up to the evaluation date.
Stock must meet minimum threshold for trading volume.
Securities must trade above $1 per share on May 31.
Measured along two dimensions: the level of stock price and a relative criterion known as annualized traded value ratio (ATVR).
Total market capitalization must be greater than $10 million, float shares must be greater than 10% of total shares, there are trading volume requirements, and a security must not have ten sequential days without trading volume.
Securities must maintain at least $10 million in market capitalization as of review dates.
Growth criteria
Trailing three-year earnings per share (EPS) growth.
•Three-year sales growth.
•Momentum— 12-month percentage price change.
•Forwardprice/earnings ratio.
•Projectedearnings growth.
•Price/bookratio.
•Dividendyield.
•Trailingrevenuegrowth.
•Trailingearningsgrowth.
•I/B/E/Sforecastmedium-term growth (two-year).
•Sales/sharehistorical growth (five-year).
•Long-andshort-term projected EPS growth rates.
•Currentinternalgrowth rate.
•Long-termhistorical EPS growth trend.
•Long-termhistorical sales/ share growth trend.
•Consensuslong-term growth forecast from I/B/E/S.
•Consensusone-year forecast from I/B/E/S.
•Three-yeargrowth in earnings per share.
•Three-yeargrowth in sales per share.
•Currentinvestment-to-assets ratio.
•Returnonassets.
•Trailingthree-yearsales growth.
•Trailingthree-yearEPS growth.
•Two-yearforwardsales growth.
•Two-yearforwardEPS growth.
•Returnonequitytimes retention ratio.
Value criteria •Price/bookratio.
•Price/earningsratio.
•Price/salesratio.
•Forwardpriceearnings ratio.
•Projectedearnings growth.
•Price/bookratio.
•Dividendyield.
•Trailingrevenuegrowth.
•Trailingearningsgrowth
•Price/bookratio. •Price/bookratio.
•12-monthforward EPS.
•Dividendyield.
•Book/priceratio.
•Earningspershare consensus forecast one year ahead divided by stock price.
•MostrecentEPSdivided by stock price.
•Dividend/priceratio.
•Sales/priceratio.
•Price/bookratio.
•Sales/priceratio.
•Dividendyield.
•Cashflow/priceratio.
Growth and value crossover
Style indexes—limited overlap between growth and value indexes. Pure style indexes—stocks placed in either growth or value index.
50% of stocks by float-adjusted market cap are in growth index, and 50% are in value index.
Securities may be classified proportionately in both growth and value indexes.
Securities may be classified proportionately in both growth and value indexes.
Securities may be classified proportionately in both growth and value indexes.
Securities may be classified proportionately in both growth and value indexes.
a. Equity index methodology for U.S. index providers (continued)
15
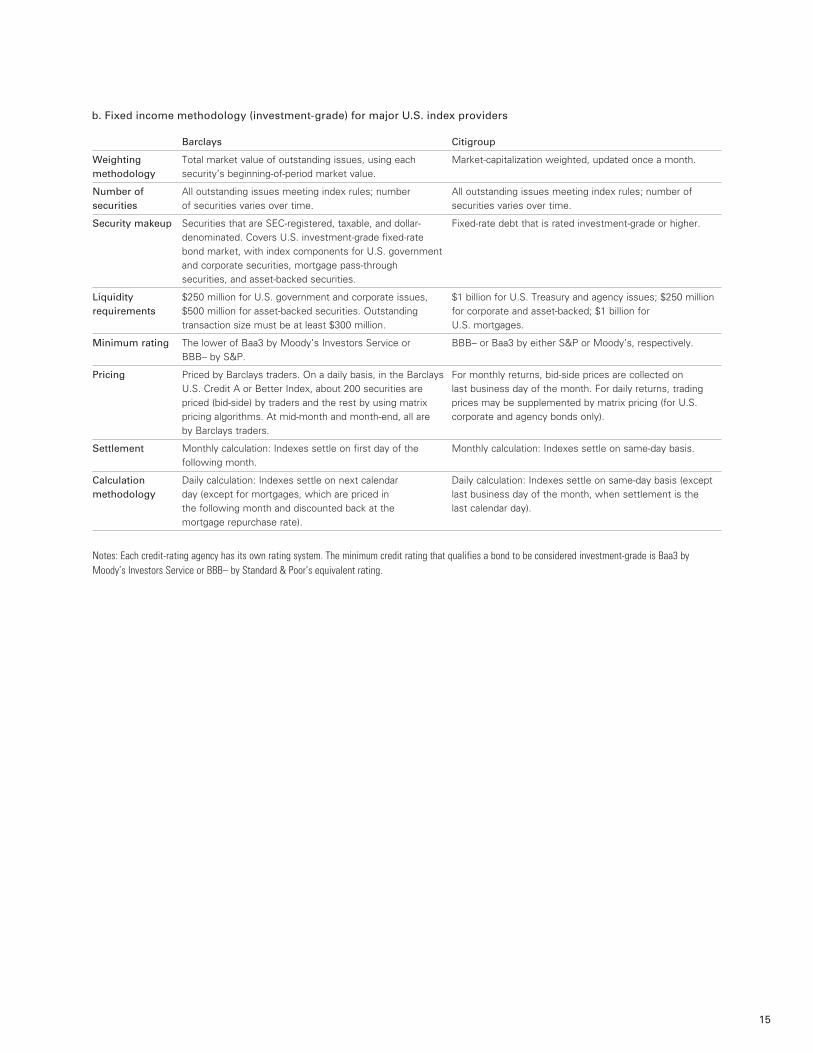
Notes: Each credit-rating agency has its own rating system. The minimum credit rating that qualifies a bond to be considered investment-grade is Baa3 by Moody’s Investors Service or BBB– by Standard & Poor’s equivalent rating.
Barclays Citigroup
Weighting methodology
Total market value of outstanding issues, using each security’s beginning-of-period market value.
Market-capitalization weighted, updated once a month.
Number of securities
All outstanding issues meeting index rules; number of securities varies over time.
All outstanding issues meeting index rules; number of securities varies over time.
Security makeup Securities that are SEC-registered, taxable, and dollar-denominated. Covers U.S. investment-grade fixed-rate bond market, with index components for U.S. government and corporate securities, mortgage pass-through securities, and asset-backed securities.
Fixed-rate debt that is rated investment-grade or higher.
Liquidity requirements
$250 million for U.S. government and corporate issues, $500 million for asset-backed securities. Outstanding transaction size must be at least $300 million.
$1 billion for U.S. Treasury and agency issues; $250 million for corporate and asset-backed; $1 billion for U.S. mortgages.
Minimum rating The lower of Baa3 by Moody’s Investors Service or BBB– by S&P.
BBB– or Baa3 by either S&P or Moody’s, respectively.
Pricing Priced by Barclays traders. On a daily basis, in the Barclays U.S. Credit A or Better Index, about 200 securities are priced (bid-side) by traders and the rest by using matrix pricing algorithms. At mid-month and month-end, all are by Barclays traders.
For monthly returns, bid-side prices are collected on last business day of the month. For daily returns, trading prices may be supplemented by matrix pricing (for U.S. corporate and agency bonds only).
Settlement Monthly calculation: Indexes settle on first day of the following month.
Monthly calculation: Indexes settle on same-day basis.
Calculation methodology
Daily calculation: Indexes settle on next calendar day (except for mortgages, which are priced in the following month and discounted back at the mortgage repurchase rate).
Daily calculation: Indexes settle on same-day basis (except last business day of the month, when settlement is the last calendar day).
b. Fixed income methodology (investment-grade) for major U.S. index providers

Vanguard research > Vanguard Center for Retirement Research Vanguard Investment Counseling & Research Vanguard Investment Strategy Group
E-mail > [email protected]
For more information about Vanguard funds, visit vanguard.com or call 800-662-2739 to obtain a prospectus. Investment objectives, risks, charges, expenses, and other important information about a fund are contained in the prospectus; read and consider it carefully before investing.
CFA® is a trademark owned by CFA Institute.
P.O. Box 2600 Valley Forge, PA 19482-2600
© 2012 The Vanguard Group, Inc. All rights reserved. Vanguard Marketing Corporation, Distributor.
ICRPBD 102012
Connect with Vanguard® > vanguard.com