determining the mechanical losses in a high-speed motor...
TRANSCRIPT
ARCHIVES OF ELECTRICAL ENGINEERING VOL. 61(3), pp. 299-313 (2012)
DOI 10.2478/v10171-012-0024-0
Determining the mechanical losses in a high-speed motor on the example of a flywheel energy storage system
MARCIN BASZYŃSKI, STANISŁAW PIRÓG
Department of Electrical Drive and Industrial Equipment University of Science and Technology (AGH)
e-mail: {mbaszyn /pirog}@agh.edu.pl
(Received: 19.12.2011, revised: 06.03.2012)
Abstract: The article describes the method of determining mechanical losses and elec-tromagnetic motor torque on the example of a flywheel energy storage system utilizing BLDC motor. The description of the test stand contains: the topology of power factor correction boost rectifier, an inverter supplying the BLDC motor, and the measuring system. The detailed experimental results are included in the paper. Key words: BLDCPM, high speed drive, flywheel energy storage system, FPGA
1. Introduction High-speed commutatorless motors (BLDC [1-4], reluctance motors [5], induction motors [4-6]) are frequently used in recent years and they supersede traditional commutator motors due to the numerous advantages of these solutions: $ easy to manufacture; the rotor structure is resistant to mechanical damages, low production
cost, $ no mechanical commutator, the rotor is a uniform cylinder with no protruding elements, $ higher efficiency compared to that of commutator motors, $ significantly smaller mass and overall dimensions, $ the ease of the rotational speed control, $ no adverse impact on the power supply line and electromagnetic environment, the motor is
usually equipped with a power factor corrected front end converter [8-18]. Despite of high-speed motors popularity there are no cheap torque sensors, designed to operate at speeds of ca. 50 000 rpm, available on market. Moreover, such sensor measures only the torque at the motor shaft, thus electromagnetic torque and mechanical losses cannot be determined. The paper presents a method for indirect determination of both: the electro-magnetic torque and mechanical losses. Results of experimental tests of a high-speed flywheel energy storage system are provided [1, 2, 16].
M. Baszyński, S. Piróg Arch. Elect. Eng. 300
Flywheel energy storage systems are high-tech mechatronics system and are widely used in [1, 2]: $ power quality improvement systems to mitigate impact of rapid active power changes or
peak load reduction on the supply network, $ standby power supply systems, to backup equipment operation or start from other electric
power sources, $ energy storage and controlled release of energy produced by alternative energy sources,
such as photovoltaic or wind power plants, $ wind power fluctuations mitigation, $ storage of energy recovered during recovery braking in frequently stopped and started
drive systems, $ applications to elevators in high buildings with high volume of pedestrian traffic (intel-
ligent building systems), $ large industrial plants (large power FES) to mitigate voltage fluctuations, $ power supply of loads that demand large amounts of energy transferred in a very short
time. In the described experiment the energy store was outside the scope of research, it was used solely for investigating the drive's properties (the converter used in the laboratory setup does not enable feeding the energy back into the supply; the drive braking energy is utilized to backup the converter electronic system power supply). The obtained results will be used in further investigation of an inertial element.
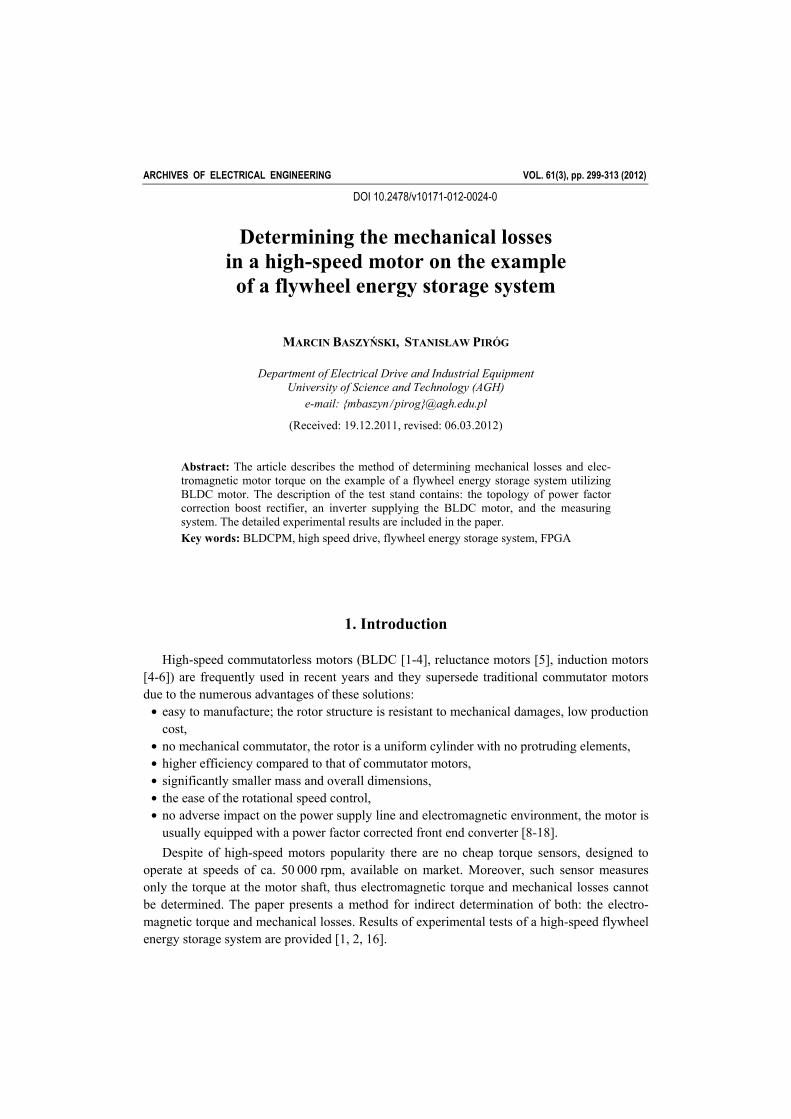
2. Laboratory setup The laboratory setup diagram is shown in Figure 1.
Fig. 1. Block diagram of the laboratory setup The conversion of electrical to mechanical energy (and vice versa) is achieved by using of a commutatorless DC permanent magnet motor (BLDCPM). The motor electric power is about 2 kW, maximum rotational speed is 42 000 rpm. The motor is supplied from a con-ventional three-phase full-bridge six transistor inverter. The inverter's DC link circuit is sup-
Vol. 61(2012) Determining the mechanical losses in a high-speed motor 301
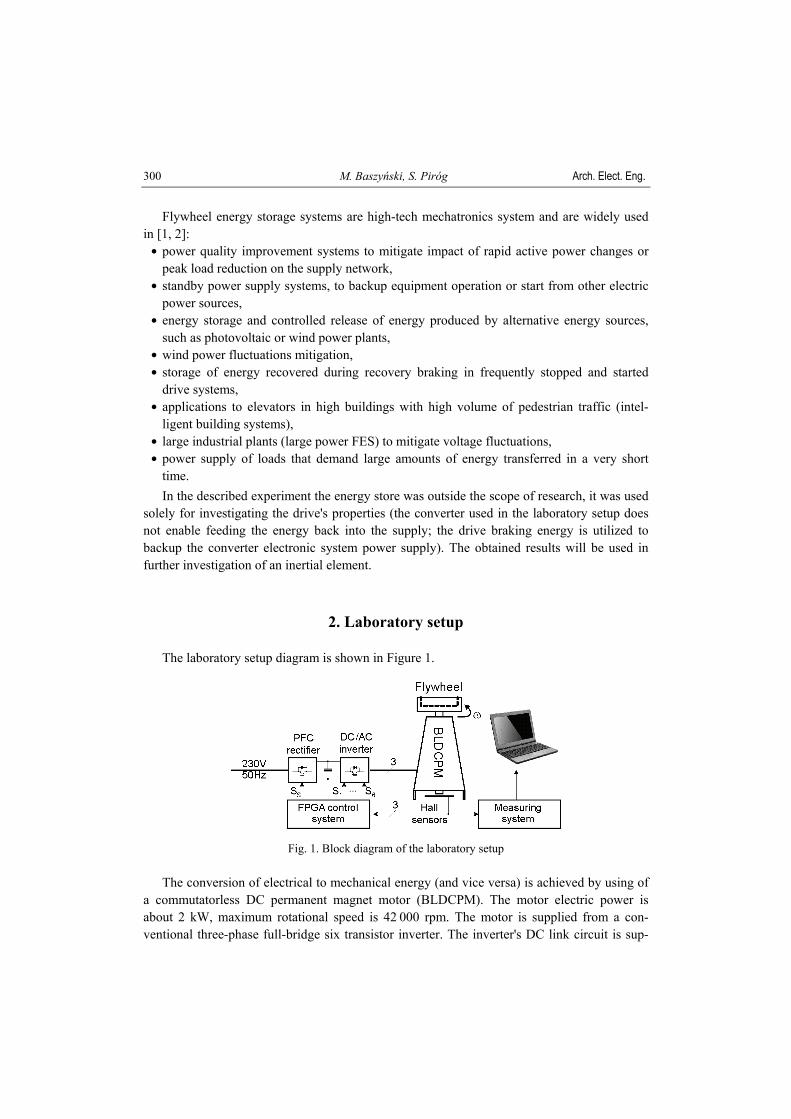
plied from a single-phase diode bridge and DC/DC switch mode boost converter (Ls, Ds, Ss) [7, 8]. The power circuit scheme is shown in Figure 2. Measurement signals for the rectifier and inverter [17, 18] control systems are obtained from shunts and resistive voltage dividers, depicted in Figure 2. This measurement configuration does not require isolation between the power circuit and control system thus the equipment overall dimensions and cost can be reduced.
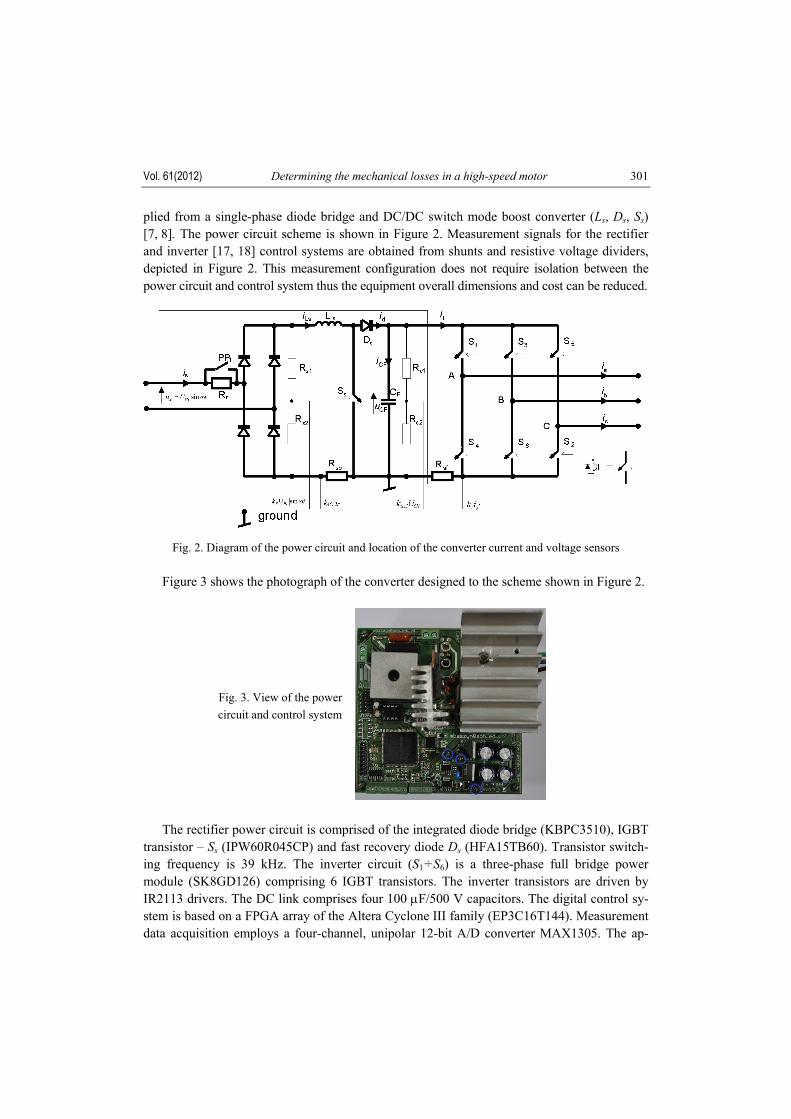
Fig. 2. Diagram of the power circuit and location of the converter current and voltage sensors Figure 3 shows the photograph of the converter designed to the scheme shown in Figure 2.
Fig. 3. View of the power circuit and control system
The rectifier power circuit is comprised of the integrated diode bridge (KBPC3510), IGBT transistor – Ss (IPW60R045CP) and fast recovery diode Ds (HFA15TB60). Transistor switch-ing frequency is 39 kHz. The inverter circuit (S1÷S6) is a three-phase full bridge power module (SK8GD126) comprising 6 IGBT transistors. The inverter transistors are driven by IR2113 drivers. The DC link comprises four 100 μF/500 V capacitors. The digital control sy-stem is based on a FPGA array of the Altera Cyclone III family (EP3C16T144). Measurement data acquisition employs a four-channel, unipolar 12-bit A/D converter MAX1305. The ap-
M. Baszyński, S. Piróg Arch. Elect. Eng. 302
plied converter allows fast conversion of analogue data (four channels conversion time To= 1.26 µs) and data transfer to FPGA with the bus throughput 680 ksps. The converter is also provided with binary inputs that enable numerical (digital) setting of rotational speed and readout of signals of the rotor position sensors with respect to the stator windings (the sensor is iC-MH 12 bit angular Hall sensors). Information from the control system is displayed on an LCD alphanumeric display. The whole control system is supplied from a DC/DC converter connected to the DC link capacitor. Dimensions of the converter shown in Figure 3 are 10.2 H 10.2 H 4.0 cm.
3. Front end converter, PFC rectifier
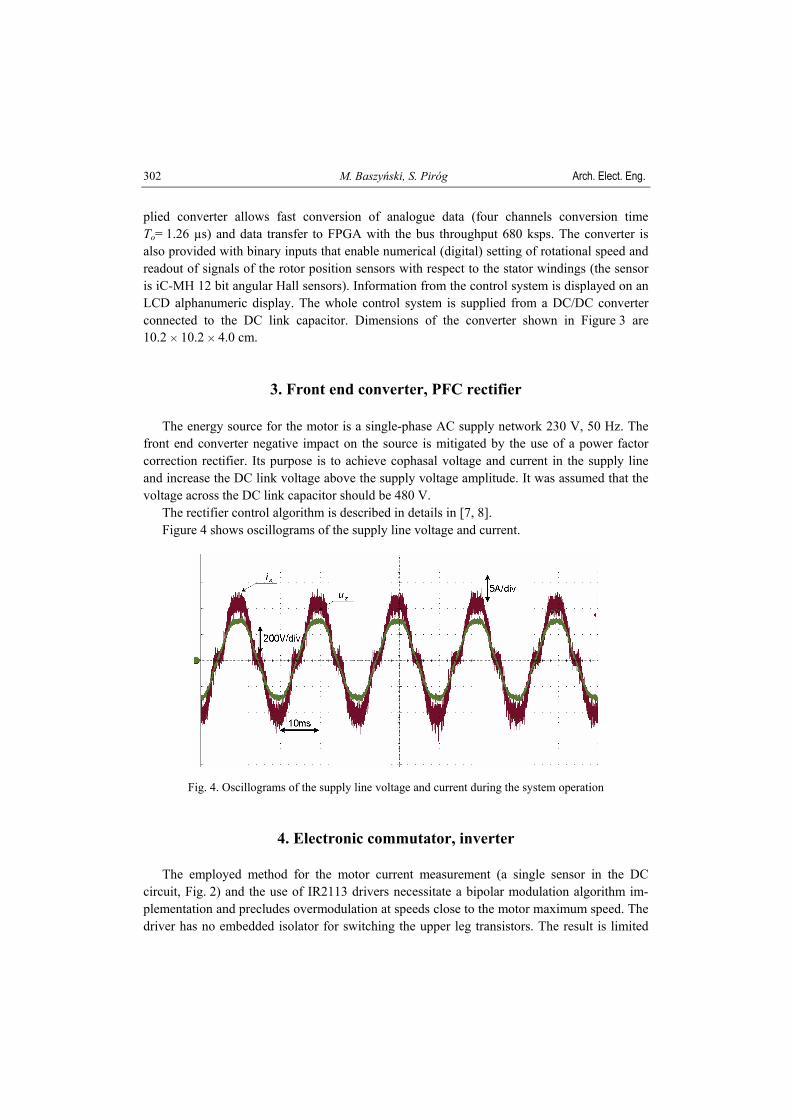
The energy source for the motor is a single-phase AC supply network 230 V, 50 Hz. The front end converter negative impact on the source is mitigated by the use of a power factor correction rectifier. Its purpose is to achieve cophasal voltage and current in the supply line and increase the DC link voltage above the supply voltage amplitude. It was assumed that the voltage across the DC link capacitor should be 480 V. The rectifier control algorithm is described in details in [7, 8]. Figure 4 shows oscillograms of the supply line voltage and current.
Fig. 4. Oscillograms of the supply line voltage and current during the system operation
4. Electronic commutator, inverter The employed method for the motor current measurement (a single sensor in the DC circuit, Fig. 2) and the use of IR2113 drivers necessitate a bipolar modulation algorithm im-plementation and precludes overmodulation at speeds close to the motor maximum speed. The driver has no embedded isolator for switching the upper leg transistors. The result is limited
Vol. 61(2012) Determining the mechanical losses in a high-speed motor 303
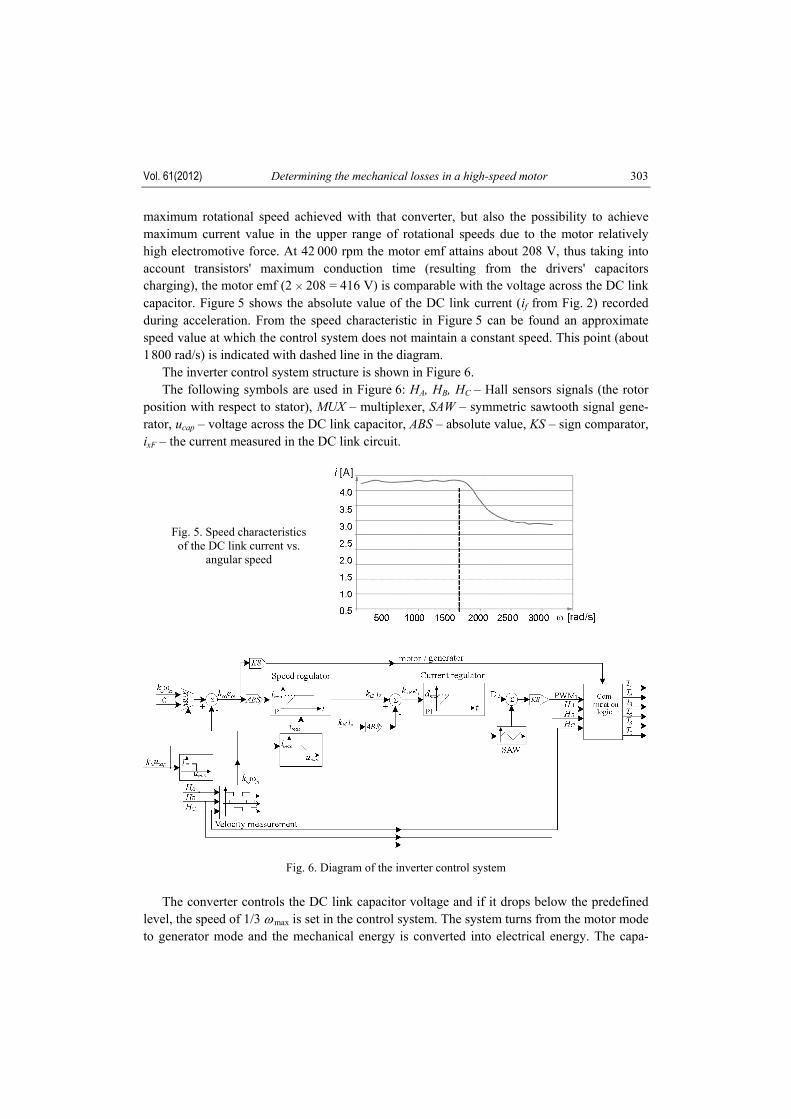
maximum rotational speed achieved with that converter, but also the possibility to achieve maximum current value in the upper range of rotational speeds due to the motor relatively high electromotive force. At 42 000 rpm the motor emf attains about 208 V, thus taking into account transistors' maximum conduction time (resulting from the drivers' capacitors charging), the motor emf (2 H 208 = 416 V) is comparable with the voltage across the DC link capacitor. Figure 5 shows the absolute value of the DC link current (if from Fig. 2) recorded during acceleration. From the speed characteristic in Figure 5 can be found an approximate speed value at which the control system does not maintain a constant speed. This point (about 1800 rad/s) is indicated with dashed line in the diagram. The inverter control system structure is shown in Figure 6. The following symbols are used in Figure 6: HA, HB, HC – Hall sensors signals (the rotor position with respect to stator), MUX – multiplexer, SAW – symmetric sawtooth signal gene-rator, ucap – voltage across the DC link capacitor, ABS – absolute value, KS – sign comparator, ixF – the current measured in the DC link circuit.
Fig. 5. Speed characteristics of the DC link current vs.
angular speed
Fig. 6. Diagram of the inverter control system The converter controls the DC link capacitor voltage and if it drops below the predefined level, the speed of 1/3 ωmax is set in the control system. The system turns from the motor mode to generator mode and the mechanical energy is converted into electrical energy. The capa-

M. Baszyński, S. Piróg Arch. Elect. Eng. 304
citor voltage is also controlled during the converter proper start-up. The inverters remain blocked until the front end converter start-up completion. The motor actual rotational speed is determined from the frequency of the Hall sensor signals. Oscillograms of the motor phase cur-rents (Fig. 7) were recorded during the system operation at rotational speed of 38 820 rpm.
Fig. 7. The motor phase currents at rotational speed 38 820 rpm The active power drawn from the supply line and active power transferred from the inver-ter to the motor during acceleration were measured using digital power meter Yokogawa WT1600. The converter efficiency determined from the measurement is ca. 95% (Fig. 8).
Fig. 8. The power electronic converter efficiency
5. Energy store
The flywheel energy store with a BLDC motor is depicted in Figure 9. Flywheel energy stores can be classified into two groups: 1) low-speed, with a large moment of inertia, 2) high-speed, with a small moment of inertia.
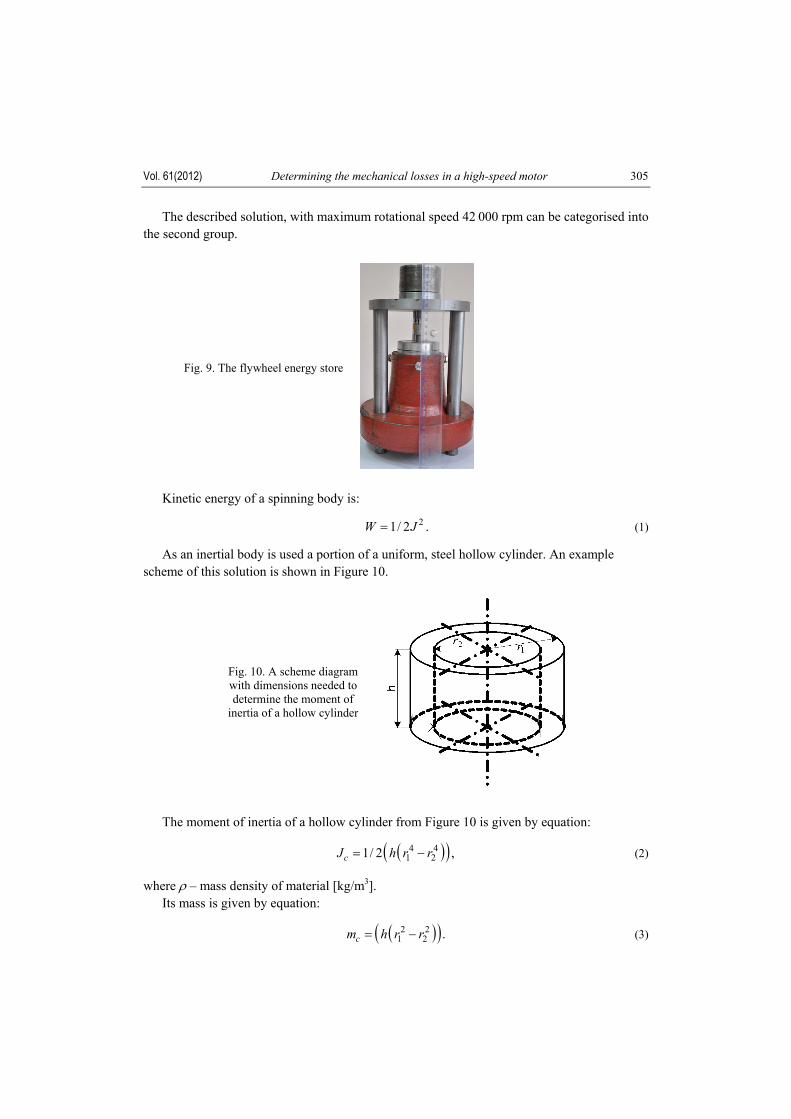
Vol. 61(2012) Determining the mechanical losses in a high-speed motor 305
The described solution, with maximum rotational speed 42 000 rpm can be categorised into the second group.
Fig. 9. The flywheel energy store
Kinetic energy of a spinning body is:
21/ 2W J= . (1)
As an inertial body is used a portion of a uniform, steel hollow cylinder. An example scheme of this solution is shown in Figure 10.
Fig. 10. A scheme diagram with dimensions needed to determine the moment of
inertia of a hollow cylinder
The moment of inertia of a hollow cylinder from Figure 10 is given by equation:
( )( )4 41 21/ 2 ,cJ h r r= − (2)
where ρ – mass density of material [kg/m3]. Its mass is given by equation:
( )( )2 21 2 .cm h r r= − (3)

M. Baszyński, S. Piróg Arch. Elect. Eng. 306
The density of stored energy can be determined from:
.wWm
ρ = (4)
Comparing the energy density of a hollow cylinder with that of solid cylinder (assuming r2 = 0 for a solid cylinder) we obtain:
2
22
21
0.51 ,
0.5
c
c c
w w
w
Jw m rw rJ
m
ωρρ ω
⎛ ⎞= = + ⎜ ⎟⎝ ⎠
(5)
where: Jw, mw – values determined for r2 = 0 (solid cylinder), ρWc – energy density of a hollow cylinder, ρWw – energy density of a solid cylinder. Characteristics (Fig. 11) of the energy density versus the r2/r1 ratio is plotted using the relation (5).
Fig. 11. Characteristics of dependence of energy density versus the cylinder outer
radius (r1) to the inner radius (r2) ratio change
Removing a part of material from the cylinder interior does not significantly reduce its inertia while reduces the body mass and, consequently, increases the stored energy density. It follows from Equation (5) and Figure 11 that in terms of bearing loads, the use of a hollow cylinder as a spinning mass is more advantageous than a solid cylinder.
The scheme diagram and the view of the energy store inertial element are shown in Figure 12.
Fig. 12. The scheme diagram and view of the spinning mass
Vol. 61(2012) Determining the mechanical losses in a high-speed motor 307
The inertial element in the laboratory setup is made of steel. Density of steel has been taken ρ ≅ 7.86 g/cm3. From the inertial element dimensions its moment of inertia is estimated at 39 @ (10) –3 kg @ m2. The rotor and clutch moment of inertia – at 6 @ (10) –3 kg @ m2. Hence the total moment of inertia of spinning mass is 45 @ (10) –3 kg @ m2. Thus, using (1), the kinetic energy of the spinning mass at the maximum speed is 435549 kJ = 1.21 kWh. This amount of energy is equivalent to that consumed by a 100 W bulb lit during 73 minutes (neglecting losses).
6. The measuring system
The aim of the measuring system (indicated in Fig. 1 as the „measuring system”) is: – isolation of the power circuit from the computer; – determination of the actual rotational speed from the signals of the rotor position sensors; – transferring the determined speed to the computer. Isolation between the measuring system and the power circuit is achieved by using of the digital isolator based ADuM1100, with delay time 7 ns, connected into transmission path of the rotor position sensors signals. The motor speed is determined from the Hall sensor signals. The motor has one pole pair thus a single period of the position sensor signal determines one full revolution of the rotor. It is assumed that each rising edge of the signal indicates 1/3 of the revolution. The measuring system counts the reference clock pulses and at each rising edge of the po-sition sensor signal the counter value is copied to a general-purpose register. The counter value is cleared upon detection of the motor stop. The number held in the general-purpose register is proportional to the time elapsed from the motor start, whereas the difference between two samples is proportional to the motor rotation frequency. The reference clock frequency is set at 200 kHz, which at maximum speed gives the measurement accuracy of 0.32%. The general-purpose register value is transferred to a PC computer (which determines the speed), to not load the measuring system additional calculations. Data transmission to the PC computer utilizes serial RS232 link due to the ease of im-plementation. Since this transmission standard is not resistant to disturbances (this is particu-larly evident during the converter operation) therefore measurement data are stored in the RAM memory and transferred to the computer upon switching-off gate transistors drive pulses (the motor stop). These functions are performed using the Starter Development Board BD_Start_3C10 with FPGA chip EP3C10T144 and fast 16 MB SDRAM. The algorithm for serial transmission and data saving in an external memory SDRAM is implemented using the imbedded SoftCore processor within the FPGA structure. Only the clock pulses counter circuit is developed using the hardware description language HDL. Figure 13 shows the motor acceleration and coast-down.
M. Baszyński, S. Piróg Arch. Elect. Eng. 308
Fig. 13. Results of speed measurement during starting and coasting
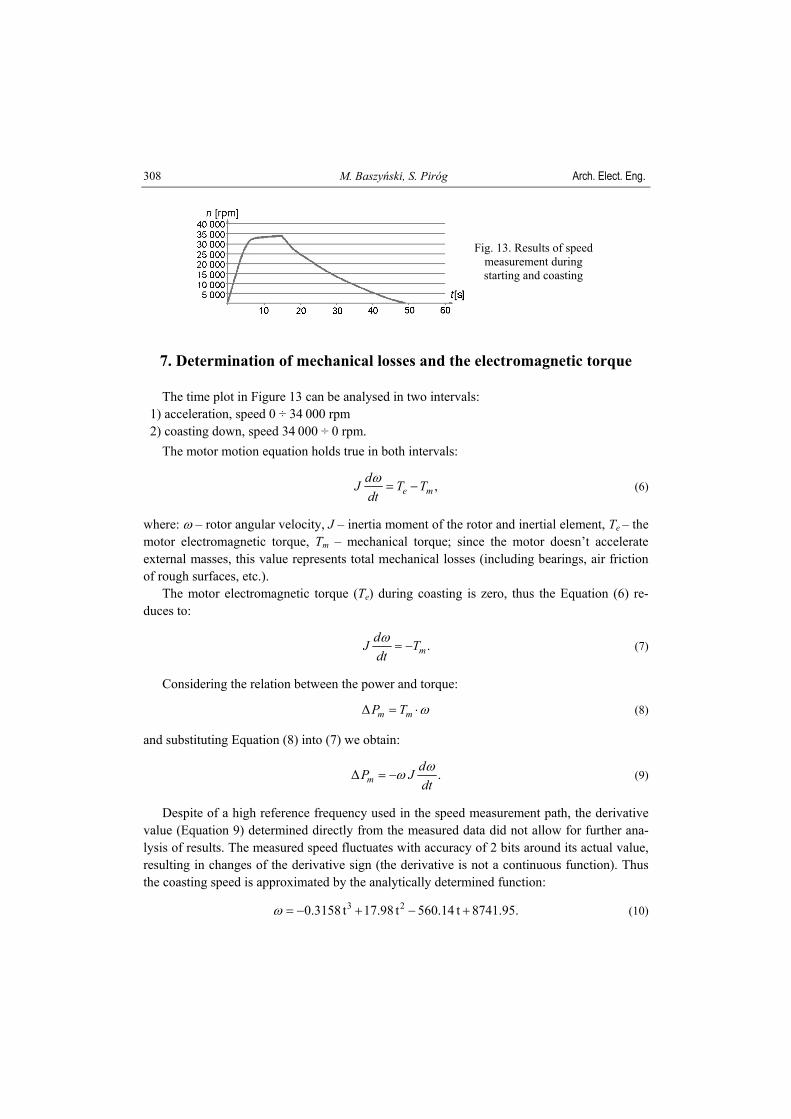
7. Determination of mechanical losses and the electromagnetic torque The time plot in Figure 13 can be analysed in two intervals: 1) acceleration, speed 0 ÷ 34 000 rpm 2) coasting down, speed 34 000 ÷ 0 rpm. The motor motion equation holds true in both intervals:
,e mdJ T Tdtω= − (6)
where: ω – rotor angular velocity, J – inertia moment of the rotor and inertial element, Te – the motor electromagnetic torque, Tm – mechanical torque; since the motor doesn’t accelerate external masses, this value represents total mechanical losses (including bearings, air friction of rough surfaces, etc.). The motor electromagnetic torque (Te) during coasting is zero, thus the Equation (6) re-duces to:
.mdJ Tdtω= − (7)
Considering the relation between the power and torque:
Δ m mP T ω= ⋅ (8)
and substituting Equation (8) into (7) we obtain:
Δ .mdP Jdtωω= − (9)
Despite of a high reference frequency used in the speed measurement path, the derivative value (Equation 9) determined directly from the measured data did not allow for further ana-lysis of results. The measured speed fluctuates with accuracy of 2 bits around its actual value, resulting in changes of the derivative sign (the derivative is not a continuous function). Thus the coasting speed is approximated by the analytically determined function:
3 20.3158 t 17.98 t 560.14 t 8741.95.ω = − + − + (10)

Vol. 61(2012) Determining the mechanical losses in a high-speed motor 309
Figure 14 shows the absolute percentage error the approximated speed with respect to the measured speed.
Fig. 14. Absolute percentage error of the approximated speed with respect
to the measured speed
As follows from the plot in Figure 14, the approximation error does not exceed 1.4%. An additional advantage of the approximation is filtering of speed fluctuations associated with the system mechanical resonance. A change in speed is noticeable on the time characteristic in Figure 13 at approximately 17th second of coasting down, it is accompanied by the inertial element oscillations. Using the known inertia moment and approximation of the speed recorded during coast-down (Fig. 15) the losses power is determined from the Equation (9). Since the mechanical losses power increases exponentially with the speed the load is cor-responding the fan curve. The mechanical loss torque (7) is a function of the rotation speed, hence motor electromag-netic torque can be determined by inserting discrete values of the mechanical loss torque computed from (7) into Equation (6).
Fig. 15. Characteristics of power lossesvs. speed during a coastdown
As follows from the determined electromagnetic torque characteristics the motor cannot maintain a constant torque (inverter current) over the whole speed range (too low a voltage margin over the motor back-emf). The point at which it occurs is marked with is indicated with dashed line. The obtained result is coincident with that determined during the current value reduction (about 1800 rad/s) (Fig. 5).

M. Baszyński, S. Piróg Arch. Elect. Eng. 310
The mechanical power (at the motor shaft) at the absence of mechanical losses (theoretical characteristic) is a linear function. The actual mechanical power value can be found from the equation:
( ).m e mdP J T Tdtωω ω= − = − (11)
The calculation results (Equation (11)) are shown in Figure 16. The mechanical power at the motor shaft attains its extremum at 2486 rad/s. An abrupt drop in the motor shaft power after exceeding this speed is caused by an increase in the mechanical loss and decrease in the electromagnetic torque (Fig. 16).
Fig. 16. The electromagnetic torque and mechanical losses
torque vs. angular speed
Fig. 17. The determined values of mechanical power: at the
motor shaft, losses and theoretical
The system power balance is given by the equation:
,Δ sme PPP =+ (12)
where: ΔPe – total electrical power losses (converter and motor), Pm – mechanical power (me-chanical losses power and the motor shaft power), Ps – consumed electric power.
Vol. 61(2012) Determining the mechanical losses in a high-speed motor 311
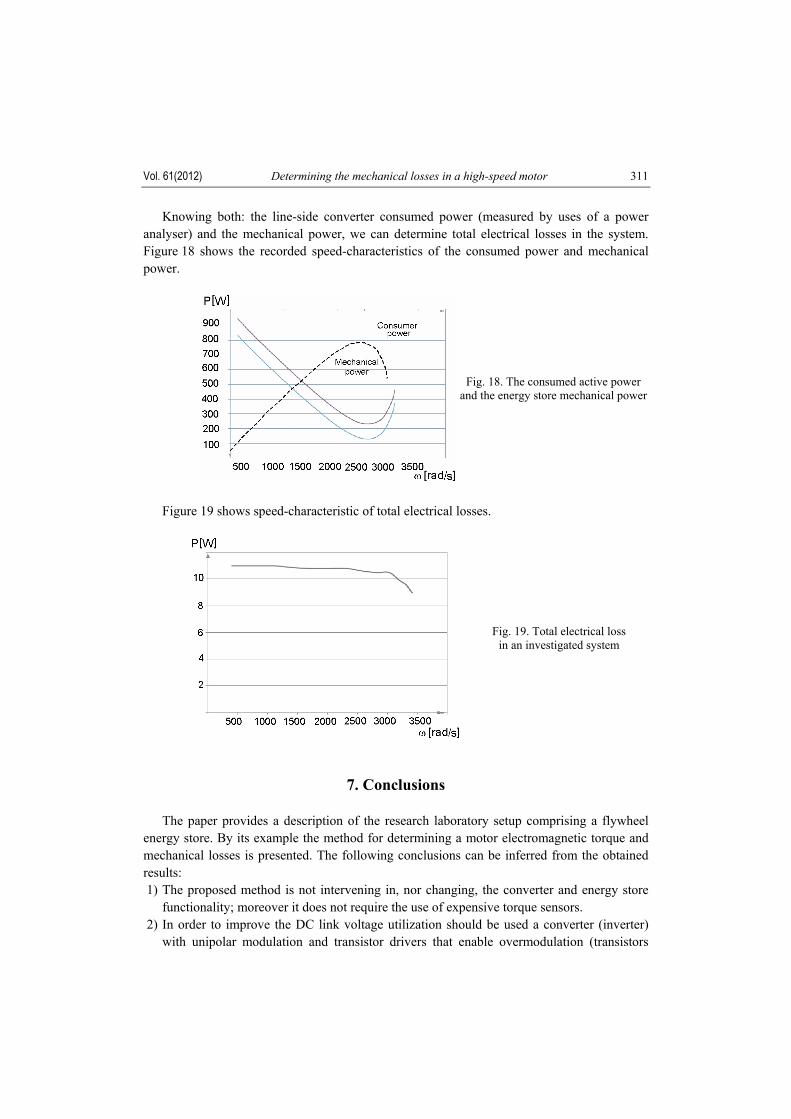
Knowing both: the line-side converter consumed power (measured by uses of a power analyser) and the mechanical power, we can determine total electrical losses in the system. Figure 18 shows the recorded speed-characteristics of the consumed power and mechanical power.
Fig. 18. The consumed active power and the energy store mechanical power
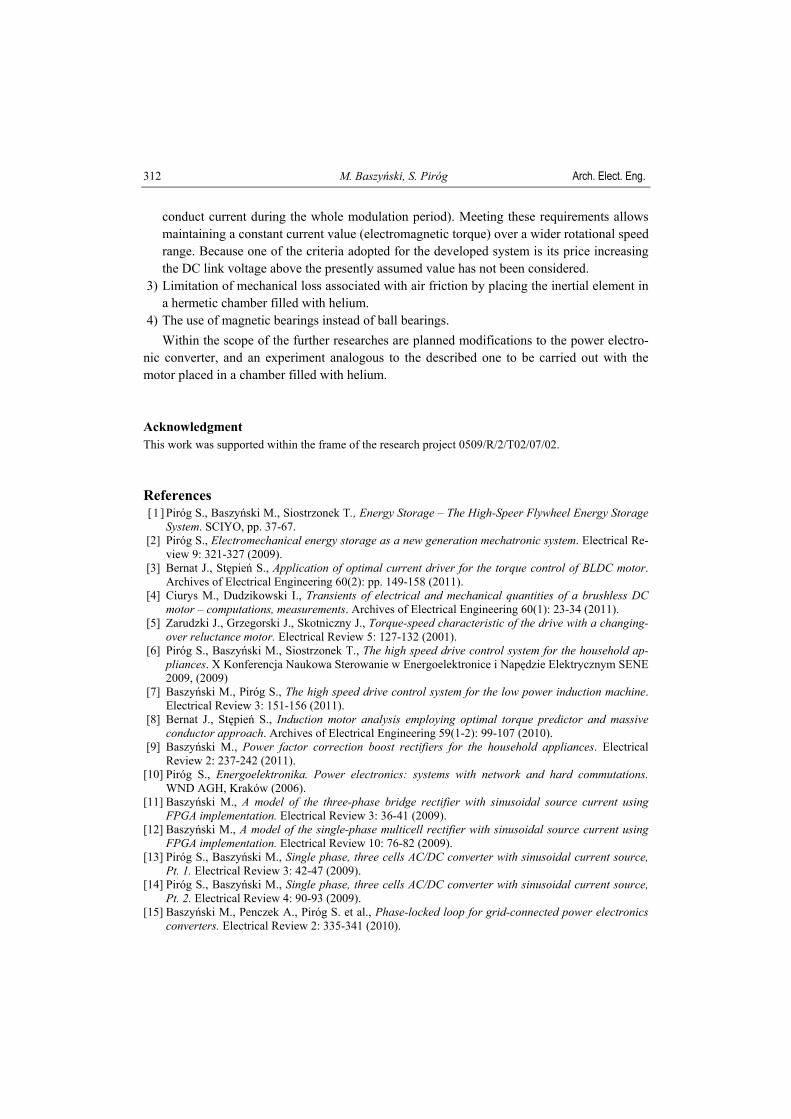
Figure 19 shows speed-characteristic of total electrical losses.
Fig. 19. Total electrical loss in an investigated system
7. Conclusions
The paper provides a description of the research laboratory setup comprising a flywheel energy store. By its example the method for determining a motor electromagnetic torque and mechanical losses is presented. The following conclusions can be inferred from the obtained results: 1) The proposed method is not intervening in, nor changing, the converter and energy store
functionality; moreover it does not require the use of expensive torque sensors. 2) In order to improve the DC link voltage utilization should be used a converter (inverter)
with unipolar modulation and transistor drivers that enable overmodulation (transistors
M. Baszyński, S. Piróg Arch. Elect. Eng. 312
conduct current during the whole modulation period). Meeting these requirements allows maintaining a constant current value (electromagnetic torque) over a wider rotational speed range. Because one of the criteria adopted for the developed system is its price increasing the DC link voltage above the presently assumed value has not been considered.
3) Limitation of mechanical loss associated with air friction by placing the inertial element in a hermetic chamber filled with helium.
4) The use of magnetic bearings instead of ball bearings. Within the scope of the further researches are planned modifications to the power electro-nic converter, and an experiment analogous to the described one to be carried out with the motor placed in a chamber filled with helium. Acknowledgment This work was supported within the frame of the research project 0509/R/2/T02/07/02. References [1 ] Piróg S., Baszyński M., Siostrzonek T., Energy Storage – The High-Speer Flywheel Energy Storage
System. SCIYO, pp. 37-67. [2] Piróg S., Electromechanical energy storage as a new generation mechatronic system. Electrical Re-
view 9: 321-327 (2009). [3] Bernat J., Stępień S., Application of optimal current driver for the torque control of BLDC motor.
Archives of Electrical Engineering 60(2): pp. 149-158 (2011). [4] Ciurys M., Dudzikowski I., Transients of electrical and mechanical quantities of a brushless DC
motor – computations, measurements. Archives of Electrical Engineering 60(1): 23-34 (2011). [5] Zarudzki J., Grzegorski J., Skotniczny J., Torque-speed characteristic of the drive with a changing-
over reluctance motor. Electrical Review 5: 127-132 (2001). [6] Piróg S., Baszyński M., Siostrzonek T., The high speed drive control system for the household ap-
pliances. X Konferencja Naukowa Sterowanie w Energoelektronice i Napędzie Elektrycznym SENE 2009, (2009)
[7] Baszyński M., Piróg S., The high speed drive control system for the low power induction machine. Electrical Review 3: 151-156 (2011).
[8] Bernat J., Stępień S., Induction motor analysis employing optimal torque predictor and massive conductor approach. Archives of Electrical Engineering 59(1-2): 99-107 (2010).
[9] Baszyński M., Power factor correction boost rectifiers for the household appliances. Electrical Review 2: 237-242 (2011).
[10] Piróg S., Energoelektronika. Power electronics: systems with network and hard commutations. WND AGH, Kraków (2006).
[11] Baszyński M., A model of the three-phase bridge rectifier with sinusoidal source current using FPGA implementation. Electrical Review 3: 36-41 (2009).
[12] Baszyński M., A model of the single-phase multicell rectifier with sinusoidal source current using FPGA implementation. Electrical Review 10: 76-82 (2009).
[13] Piróg S., Baszyński M., Single phase, three cells AC/DC converter with sinusoidal current source, Pt. 1. Electrical Review 3: 42-47 (2009).
[14] Piróg S., Baszyński M., Single phase, three cells AC/DC converter with sinusoidal current source, Pt. 2. Electrical Review 4: 90-93 (2009).
[15] Baszyński M., Penczek A., Piróg S. et al., Phase-locked loop for grid-connected power electronics converters. Electrical Review 2: 335-341 (2010).

Vol. 61(2012) Determining the mechanical losses in a high-speed motor 313
[16] Baszyński M., Stala R., FPGA implementation in power electronic converters control systems for the flywheel energy storage. The 4th International Conference Mechatronic Systems and Materials, MSM 2008, 14-17 July 2008, Bialystok, Poland (2008).
[17] Piróg S., Baszyński M., Modelling of the Single Phase Multicell DC/AC Inverter Using FPGA. Electrical Review 2: 90-93 (2008).
[18] Piróg S., Baszyński M., Czekoński J. et al., Multicell DC/AC converter: practical result.Electrical Review 4: 40-46 (2008).