determining the solubility and crystal form … · suspended condition (1). we wished to determine...
TRANSCRIPT

DRUG DEVELOPMENT AND INDUSTRIAL PHARMACY, 1 8 ( 3 ) , 319-331 (1992)
DETERMINING T H E SOLUBILITY AND CRYSTAL F O R M OF
CLENBUTEROL IN THIN FILMS OF EUDRAGIT NE30D
Achim Gopferich and Geoffrey Lee 1
Institute for Pharmaceutical Technology and Biopharmaceutics,
Heidelberg University, Germany.
A B S T R A C T
The solubility of the drug clenbuterol in thin films of surfactant-free
Eudragit NE30D has been measured. Light microscopy and differential
scanning calorimetry were supplemented by a technique based on
measurement of the rate of drug release *rom the films. The clenbuterol
crystals had the form of a fractal, as could be shown by a computer
simulation of diffusion-controlled aggregation.
I N T R O D U C T I O N
When preparing polymeric, sustained-release carriers for a drug, it is
useful to know the solubility of the drug in the polymer. The release kinetics
depend inter alia on whether the drug exists in the dissolved or the
Correspondence: Prof. Geoffrey Lee, Institut fur Pharmazeutische Technologie und Biopharmazie, Im Neuenheimer Feld 366, 6900 Heidelberg, Germany.
Copyright © 1992 by Marcel Dekker, Inc.

suspended condition (1). We wished to determine the solubility of the drug
clenbuterol in thin films of the polacrylate Eudragit NE30D. Both polarising
light microscopy and differential scanning calorimetry (DSC) offer
themselves as methods. With the former, the solubility is estimated by
identifying the drug concentration at which crystals are first observed to
form within the polymer. With DSC, the first appearance of a drug melting
peak identifies the presence of solid drug (2), and hence the limit of
solubility. We supplement these methods with two others, based on
measurement of the rate of drug release from the thin films. If such a film
contains only dissolved drug, then the release process can be described by a
simple, diffusional model (3a). If, however, the film also contains suspended
drug, the rate of drug release will be altered (1). We exploit this difference
in release rate to estimate drug solublity within the film. With the first
technique, a non-steady state model for the presence of dissolved drug is
fitted to experimental drug release data obtained for films having a wide
range of drug loading. The shape of the functional relationship between
fitted diffusivity and drug loading can then be used to estimate at which drug
loading suspended drug first appears within the films. With the second
technique, this model is extended to account for the presence of suspended
drug. This is readily achieved by using a numerical method, which has the
added advantage that realistic, non-sink boundary conditions can be
recognized. By fitting this model to experimental drug release results, a
direct calculation of the drug solubility within the film should be possible. In
the present paper we contrast the results obtained with these methods with
those obtained using microscopy and DSC. Additionally, we relate some
observations of the crystal form of clenbuterol within the polymer film.

M A T E R I A L S A N D M E T H O D S
Preparation of Drug-Loaded Thin Films: Frieze dried Eudragit NE30D
(Rohm, Weiterstadt, Germany) was first refluxed for 90 h in water to
remove its indiginous surfactant. This procedure is necessary to ensure an
isotropic system (4). Drug-loaded films of ca. 50 /Ltm thickness were then
prepared from this purified polymer by solvent evaporation, as described
before (5). The basic drug clenbuterol (Boehringer Ingelheim, Ingelheim,
Germany) was used (pKa=8.85):
Thin films having drug loadings in the range 0-25% w/w were prepared, and
the thickness of each determined using an Elcometer (Elcometer
Instruments, Manchester, England).
Estimation of Solubility from Drug Release Rate: The rate of release of
clenbuterol from each thin film into a pH8 phosphate buffer solution was
determined using a horizontal diffusion cell, as described before (6). Each
result was expressed as a release profile of m a ( t ) /m 0 versus t, where m a(t) is
the mass of drug released after time t, and m Q is the original mass of drug in
the film at t=0. Two diffusional models were then used to estimate the
solubility of the drug in the films. The first model is for drug release from a
film containing only dissolved drug. The linear form of the diffusion
equation is solved using a numerical, finite-difference technique, as
CI

FIGURE 1
Model for drug release from a t h i n f i l m containing dissolved and suspended drug.
described before (6). Fitting this model to the experimental release profiles
using an improved simplex method (7) yielded the best value for drug
diffusivity, D . This was then plotted against drug loading to estimate the
drug solubility. The second model is an extension of the first, and is
illustrated in Fig . l . We define the total concentration of drug within the film,
c t o t (x,t) , to consist of the concentrations of both dissolved, c<jjss(x,t), and
suspended, c S U Sp(x,t), drug (Fig. la). The numerical solution to the diffusion
equation must be modified to account for the presence of suspended drug.
Thus, at t=0, the value of ccjj s s(x,t) is equal to the solubility of the drug in
the film, c s , and decreases with time as a result of diffusion out of the film
(Fig. lb). After each time step of the numerical calculation, At, the value of
cdiss( x^) i s increased spontaneously to c s at those points where suspended
drug is still present (Fig. lc). The concentration of suspended drug
remaining at these points is accordingly reduced, eventually falling to zero

o l 1 1 1 l l I
4 6 8 10 12 14 16 18
drug loading [%w/w]
FIGURE 2 Clenbuterol d i f f u s i v i t y (D) versus drug loading of t h i n films of Eudragit NE30D. Arrow: estimated s o l u b i l i t y of drug.
and leaving only dissolved drug present. The solution to the model yields
both theoretical concentration-distance profiles of drug within the film, and
theoretical drug release profiles of m a ( t ) /m 0 versus t. The latter were then
fitted to each experimental release profile as before. In this case, however,
the best value for drug solubility within the film is obtained directly.
Microscopical Examination of Thin Films: The thin films were examined
under a polarising light microscope with hot stage (Zeiss Standard), and
photographs taken with a Nikon C35 camera (Nikon, Japan).

0.0 0.1 0.2 0.3 0.4 0.5 0.6 0.7 0.8 0.9 1 °
X / l
FIGURE 3a
Simulated drug concentration p r o f i l e s within thin f i l m for d i f f e r e n t values of Dt/1 2 (40% w/w suspended drug).
Thermal Analysis of Thin Films: The thermal behaviour of the thin films was
examined using differential scanning calorimetry (DSC) with a Mettler
Model TC10A (Greifensee, Switzerland). A heating/cooling rate of 10 K/min
was used over the temperature range 280-405 K.
R E S U L T S A N D DISCUSSION
It is known that drug diffusivity within an isotropic film can be
calculated by fitting the model for dissolved drug to experimental release

0.00 0.06 0.12 0.16 0.24 0.30 0.36
D * t / 1 2
FIGURE 3b
Simulated drug release p r o f i l e s for increasing amount of suspended drug i n t h i n f i l m .
profiles (6). The fitted diffusivities obtained for the present system are
dependent on the drug loading (Fig. 2), as is found for many systems (3b).
Using the relation: D(c) = D Q e k c , the results at low drug loadings (up to
the arrow on Fig. 2) yield the values D Q = 7.58x10*^ Cm^/s and k = 0.16
cirr//xg. At high drug loadings (above the arrow on Fig. 2), the experimental
coordinates deviate from this exponential relation. This effect can be
ascribed to the formation of drug crystals within the film at high drug
loadings. In the presence of drug crystals, the concentration of dissolved
300 | 1 1 1 1 1 1 1 \ i r
t [h]
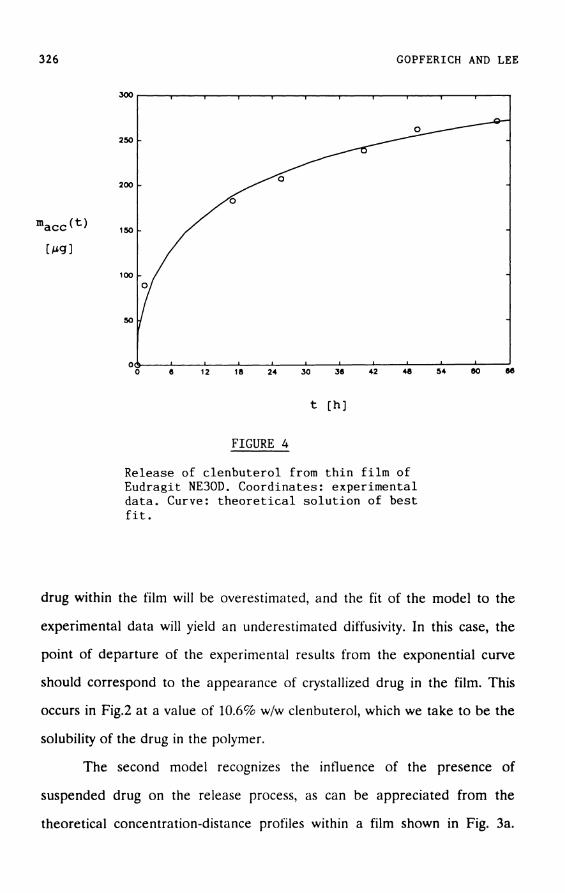
FIGURE 4
Release of clenbuterol from t h i n f i l m of Eudragit NE30D. Coordinates: experimental data. Curve: t h e o r e t i c a l s o l u t i o n of best f i t .
drug within the film will be overestimated, and the fit of the model to the
experimental data will yield an underestimated diffusivity. In this case, the
point of departure of the experimental results from the exponential curve
should correspond to the appearance of crystallized drug in the film. This
occurs in Fig.2 at a value of 10.6% w/w clenbuterol, which we take to be the
solubility of the drug in the polymer.
The second model recognizes the influence of the presence of
suspended drug on the release process, as can be appreciated from the
theoretical concentration-distance profiles within a film shown in Fig. 3a.

The discontinuity in each profile represents the moving boundary existing
between the inner region of the film containing both dissolved and
suspended drug and the outer region, where only dissolved drug remains.
The profiles are curved, as a result of the non-steady state nature of the
model, in contrast to steady state models (8). The theoretical release profiles
in Fig. 3b illustrate how an increasing concentration of suspended drug
within the film produces increased rates of drug release at constant
diffusivity. This effect can be exploited to determine drug solubility within
the film. Thus, Fig. 4 shows a typical experimental release profile
(coordinates) together with the best fit of the model to these coordinates
(curve). From this fit it was possible to determine not only the diffusivity but
also the solubility. The results are compiled in the Table for two drug
loadings. The values for D are somewhat higher than those obtained with
the first model for only dissolved drug (cf. Fig. 2). The presence of
suspended drug is recognized with the second model, thereby avoiding the
aforementioned overestimation of the concentration of dissolved drug within
the film. Of interest here is the value obtained for the solubility of
clenbuterol, ca. 13.5% w/w.
TABLE
Results of fit of theoretical model to experimental release profiles.
Drug loading n [%w/w]
r l l w/w]
16 20
4 4
4.18 ± 0.899 2.68 ± 0.114
13.5 ± 0.2 13.8 ± 0.3

1.20
T [ ° C ]
FIGURE 5
DSC-thermograms for clenbuterol-loaded t h i n films of Eudragit NE30D.
This value is higher than that obtained from the first model. It is also
higher than that suggested from the microscopy, where it was possible to
observe the presence of crystals at clenbuterol loadings as low as ca. 10%
w/w. These melted at ca. 85° C, a temperature substantially lower than the
melting point of the pure drug and indicating some interaction of the drug
with the polymer. The corresponding DSC-thermograms (Fig. 5) first show a
recognizable drug melting peak at a drug loading of ca. 12% w/w. The
microscopical method is, therefore, evidently more sensitive than the DSC
method for estimating drug solubility in such systems. The higher value

CLENBUTEROL IN THIN FILMS 329
FIGURE 6b
D e t a i l of ce n t r a l aggregate of drug c r y s t a l i n thin f i l m . Scale as above.
40 min
120 min
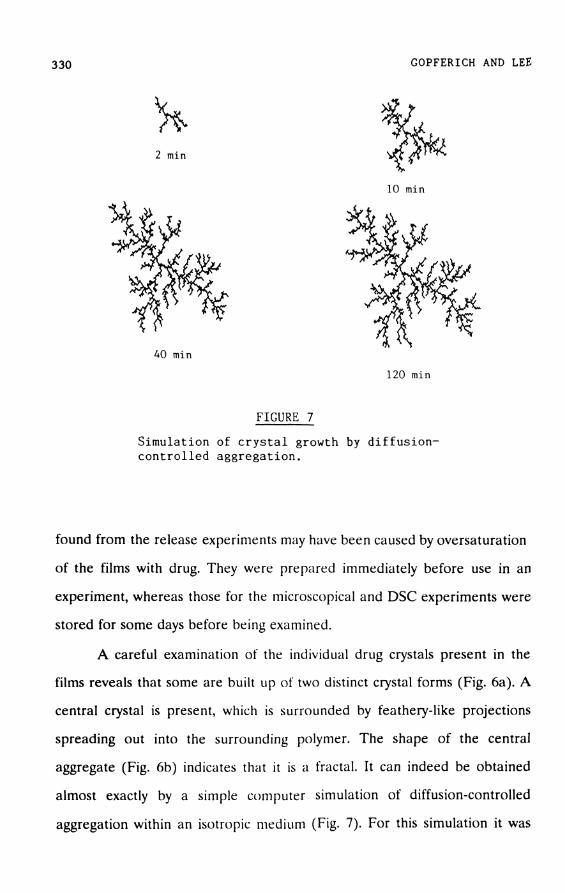
FIGURE 7
Simulation of c r y s t a l growth by d i f f u s i o n -c o n t r o l l e d aggregation.
found from the release experiments may have been caused by oversaturation
of the films with drug. They were prepared immediately before use in an
experiment, whereas those for the microscopical and DSC experiments were
stored for some days before being examined.
A careful examination of the individual drug crystals present in the
films reveals that some are built up of two distinct crystal forms (Fig. 6a). A
central crystal is present, which is surrounded by feathery-like projections
spreading out into the surrounding polymer. The shape of the central
aggregate (Fig. 6b) indicates that it is a fractal. It can indeed be obtained
almost exactly by a simple computer simulation of diffusion-controlled
aggregation within an isotropic medium (Fig. 7). For this simulation it was

assumed that the molecules are initially dissolved within the film, through
which they can freely diffuse. At single points within the oversaturated film,
some of the drug crystallizes to form a seed. As a result of their thermal
rnotion, the remaining dissolved drug molecules undergo a randon walk,
which stops by crystallization on contact with the seed (9). The similarity of
these crystal forms with the crystal shapes observed within the polymer film
is striking.
A C K N O W L E D G E M E N T S
We are thankful to Boehringer Ingelheim for its support of this
project.
R E F E R E N C E S
(1) L . Fan and S. Singh, "Controlled Release, A Quantitative Treatment",
Springer Verlag, Heidelberg 1989, p. 25.
(2) R. Bodmeier and O. Paeratakal, Pharm. Res., 6, 725 (1989).
(3) J. Crank, "The Mathematics of Diffusion", Oxford University Press,
London, 1975. a) p. 56; b) p. 105.
(4) A . Gopferich and G. Lee, J. Cont. Rel., submitted.
(5) B. Zierenberg, Acta Pharm. Technol, 30, 17 (1985).
(6) G . Gopferich and G. Lee, Int. J. Pharm., 71, 245 (1991).
(7) J. Nelder and R. Mead, Computer J , 7, 308 (1967).
(8) T. Higuchi, J. Pharm. Sci., 50, 874 (1961).
(9) T. Whitten and L . Sander, Phys. Rev. Let , 47, 1400 (1981).