deuterium arc lamp2
TRANSCRIPT
Deuterium arc lampFrom Wikipedia, the free encyclopedia
A deuterium arc lamp (or simply deuterium lamp) is a low-pressure gas-discharge light source often used
in spectroscopy when a continuous spectrum in the ultraviolet region is needed.
Contents
[hide]
1 Principle of operation
2 Deuterium lamp spectra
3 Safety
4 References
[edit]Principle of operation
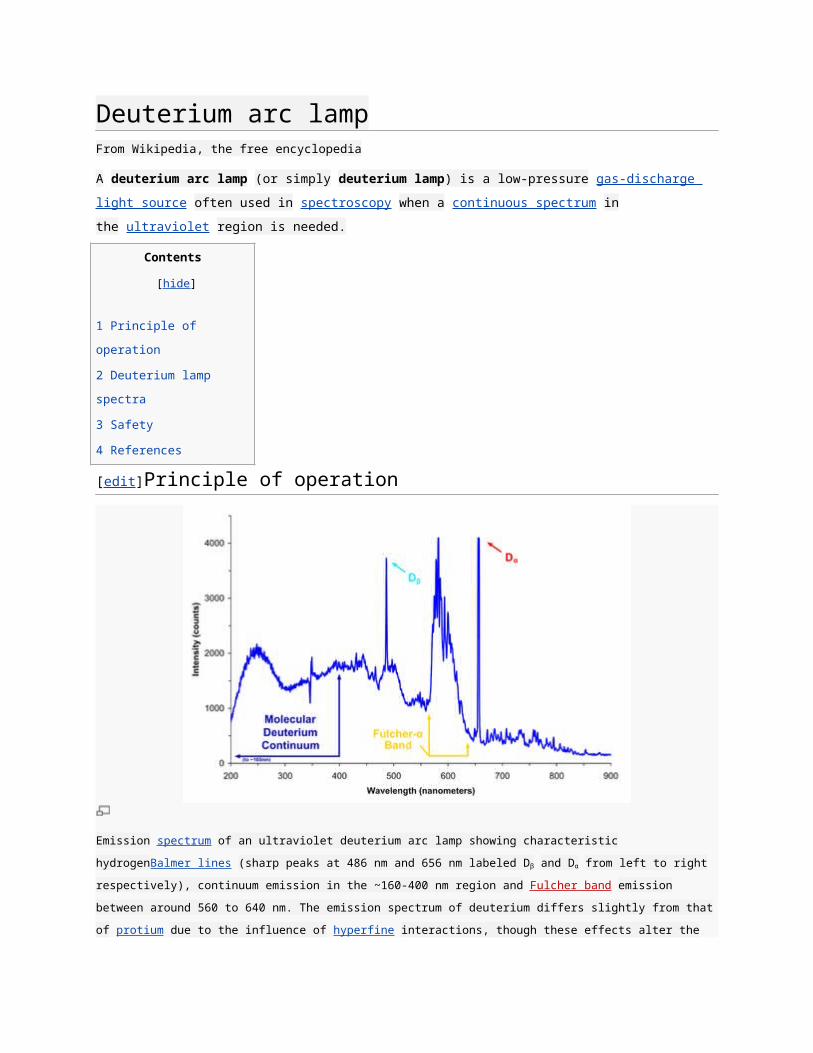
Emission spectrum of an ultraviolet deuterium arc lamp showing characteristic hydrogenBalmer lines (sharp peaks at 486
nm and 656 nm labeled Dβ and Dα from left to right respectively), continuum emission in the ~160-400 nm region
and Fulcher band emission between around 560 to 640 nm. The emission spectrum of deuterium differs slightly from that
of protium due to the influence of hyperfine interactions, though these effects alter the wavelength of the lines by mere
fractions of a nanometer and are too fine to be discerned by the spectrometer used here.
A deuterium lamp uses a tungsten filament and anode placed on opposite sides of a nickel box structure
designed to produce the best output spectrum. Unlike an incandescent bulb, the filament is not the source of
light in deuterium lamps. Instead an arc is created from the filament to the anode, a similar process to arc
lamps. Because the filament must be very hot before it can operate, it is heated for approximately twenty
seconds before use. Because the discharge process produces its own heat, the heater is turned down after
discharge begins. Although firing voltages are 300 to 500 volts, once the arc is created voltages drop to around
100 to 200 volts.[1]
The arc created excites the molecular deuterium contained within the bulb to a higher energy state. The
deuterium then emits light as it transitions back to its initial state. This continuous cycle is the origin of the
continuous ultraviolet radiation. This process is not the same as the process of decay of atomic excited
states (atomic emission), where electrons are excited and then emit radiation. Instead from the molecular
emission process, where radiative decay of excited states, in this case of molecular deuterium (D2), causes the
effect.
Because the lamp operates at high temperatures, normal glass housings cannot be used for a casing (which
would also block UV radiation). Instead, a fused quartz, UV glass, or magnesium fluoride envelope is used
depending on the specific function of the lamp.[2]
The typical lifetime of a deuterium lamp is approximately 2000 hours (Most manufacturers guarantee 2000
hours, but newer lamps are consistently performing well out to 5000 hours and more).
[edit]Deuterium lamp spectra
The deuterium lamp emits radiation extending from 112 nm to 900 nm, although its continuous spectrum is only
from 180 nm to 370 nm. The spectrum intensity does not actually decrease from 250nm to 300nm as shown in
the spectrum plot above. The decrease in the plot is due to decreased efficiency at low wavelengths of the
photo detector used to measure the lamp intensity. Deuterium Lamp's continuous spectrum is useful as both a
reference in UV radiometric work and to generate a signal in various photometric devices.
[edit]Safety
Due to the high intensity of UV radiation emitted by the bulb, eye protection is suggested when using a
deuterium bulb. Care must also be taken to avoid touching the bulb directly to avoid burns due to
high operating temperatures. Touching the bulb directly even when cool can smudge the casing and therefore
reduce output intensity.
[edit]References
Photron Deuterium Lamps
Deuterium Lamp Instrument Suitability
1. ̂ "Deuterium Lamps". Photron PTY. LTD.. Archived from the original on
2007-08-28. Retrieved 2007-10-07.

2. ̂ "Deuterium Lamps". Real Labware. Archived from the original on 2007-10-
05. Retrieved 2007-10-07.
[hide]v · d · e Lamps and lighting
Incandescent Regular · Halogen · Parabolic aluminized reflector (PAR) · Nernst
Fluorescent Fluorescent (Compact) · Fluorescent induction
High-intensitydischarge (HID) Mercury-vapor · Hydrargyrum medium-arc iodide (HMI) · Hydrargyrum quartz iodide (HQI) · Metal halide (Ceramic) · Sodium vapor
Gas discharge Deuterium arc · Neon · Sulfur · Xenon arc / Xenon flash · Black light · Tanning lamp · Germicidal · Growth light
Electric arc Carbon arc · Yablochkov candle
Combustion Acetylene/Carbide · Argand · Candle · Diya · Gas · Kerosene · Lantern · Limelight · Oil · Safety · Rushlight · Tilley · Torch
Other Lamp (electrical component) · Light fixture · Light-emitting diode (LED) · LED lamp · Solid-state (SSL) · Plasma · Electroluminescent wire
View page ratings
Rate this pageWhat's this?
Trustworthy
Objective
Complete
Well-written
I am highly knowledgeable about this topic (optional)
Submit ratings
Categories: Gas discharge lamps
Log in / create account
Article Discussion Read Edit View history
Main page Contents Featured content Current events

Random article Donate to Wikipedia
Interaction Help About Wikipedia Community portal Recent changes Contact Wikipedia
Toolbox
Print/export
Languages Español
This page was last modified on 5 August 2011 at 10:07.
Text is available under the Creative Commons Attribution-ShareAlike License; additional
terms may apply. See Terms of use for details.
Infrared spectroscopyFrom Wikipedia, the free encyclopedia
For a table of IR spectroscopy data, see infrared spectroscopy correlation table.
Infrared spectroscopy (IR spectroscopy) is the spectroscopy that deals with the infrared region of
the electromagnetic spectrum, that is light with a longer wavelength and lower frequency than visible light. It
covers a range of techniques, mostly based on absorption spectroscopy. As with all spectroscopic techniques,
it can be used to identify and study chemicals. A common laboratory instrument that uses this technique is
a Fourier transform infrared (FTIR) spectrometer.
The infrared portion of the electromagnetic spectrum is usually divided into three regions; the near-, mid- and
far- infrared, named for their relation to the visible spectrum. The higher energy near-IR, approximately 14000–
4000 cm−1 (0.8–2.5 μm wavelength) can excite overtone or harmonic vibrations. The mid-infrared,
approximately 4000–400 cm−1 (2.5–25 μm) may be used to study the fundamental vibrations and
associated rotational-vibrational structure. The far-infrared, approximately 400–10 cm −1 (25–1000 μm), lying
adjacent to the microwave region, has low energy and may be used for rotational spectroscopy. The names
and classifications of these subregions are conventions, and are only loosely based on the relative molecular or
electromagnetic properties.
Contents
[hide]
1 Theory
o 1.1 Number of vibrational modes
o 1.2 Special effects
2 Practical IR spectroscopy
o 2.1 Sample preparation
o 2.2 Comparing to a reference
o 2.3 FTIR
3 Absorption bands
4 Uses and applications
5 Isotope effects
6 Two-dimensional IR
7 See also
8 References
9 External links
[edit]Theory
Infrared spectroscopy exploits the fact that molecules absorb specific frequencies that are characteristic of their
structure. These absorptions are resonant frequencies, i.e. the frequency of the absorbed radiation matches
the frequency of the bond or group that vibrates. The energies are determined by the shape of the
molecular potential energy surfaces, the masses of the atoms, and the associated vibronic coupling.
In particular, in the Born–Oppenheimer and harmonic approximations, i.e. when the molecular
Hamiltonian corresponding to the electronic ground state can be approximated by a harmonic oscillator in the
neighborhood of the equilibrium molecular geometry, the resonant frequencies are determined by the normal
modes corresponding to the molecular electronic ground state potential energy surface. Nevertheless, the
resonant frequencies can be in a first approach related to the strength of the bond, and the mass of the
atoms at either end of it. Thus, the frequency of the vibrations can be associated with a particular bond type.
[edit]Number of vibrational modes
In order for a vibrational mode in a molecule to be "IR active," it must be associated with changes in the
permanent dipole.
A molecule can vibrate in many ways, and each way is called a vibrational mode. For molecules with N atoms
in them, linear molecules have 3N – 5 degrees of vibrational modes, whereas nonlinear molecules have 3N – 6
degrees of vibrational modes (also called vibrational degrees of freedom). As an example H2O, a non-linear
molecule, will have 3 × 3 – 6 = 3 degrees of vibrational freedom, or modes.
Simple diatomic molecules have only one bond and only one vibrational band. If the molecule is symmetrical,
e.g. N2, the band is not observed in the IR spectrum, but only in the Raman spectrum. Unsymmetrical diatomic
molecules, e.g. CO, absorb in the IR spectrum. More complex molecules have many bonds, and their
vibrational spectra are correspondingly more complex, i.e. big molecules have many peaks in their IR spectra.
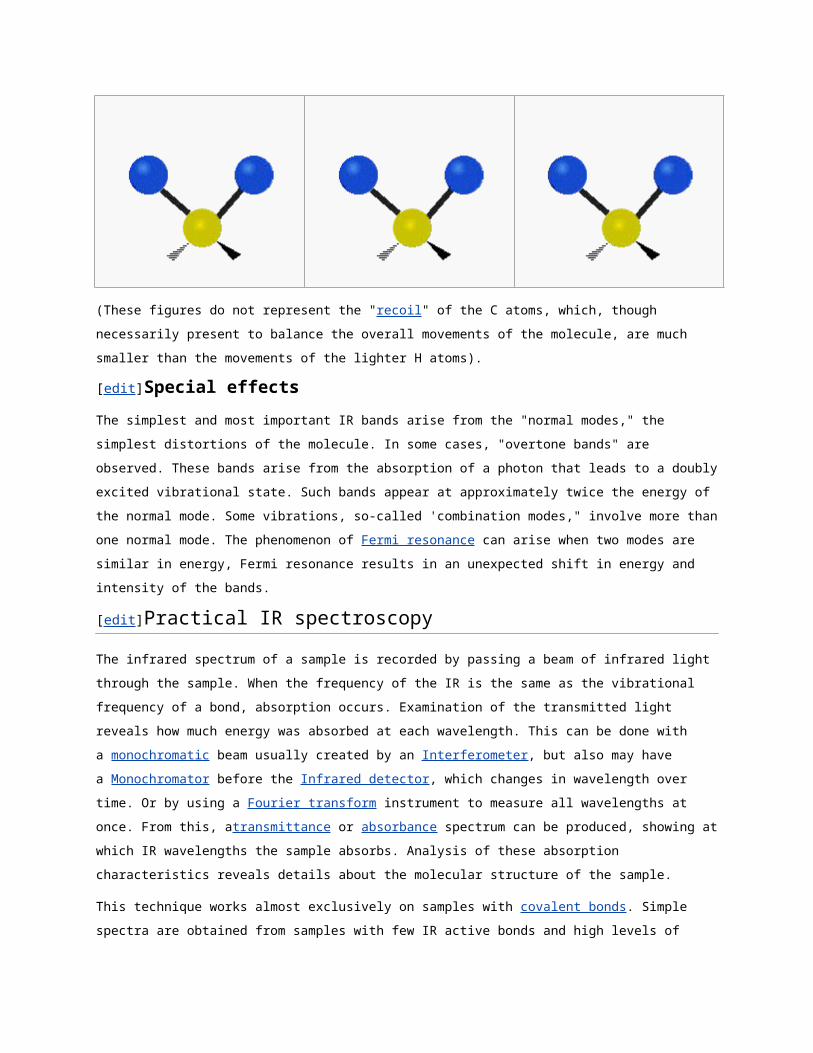
The atoms in a CH2 group, commonly found in organic compounds, can vibrate in six different
ways: symmetric and antisymmetric stretching, scissoring, rocking, wagging and twisting:
Symmetricalstretching
Antisymmetricalstretching
Scissoring
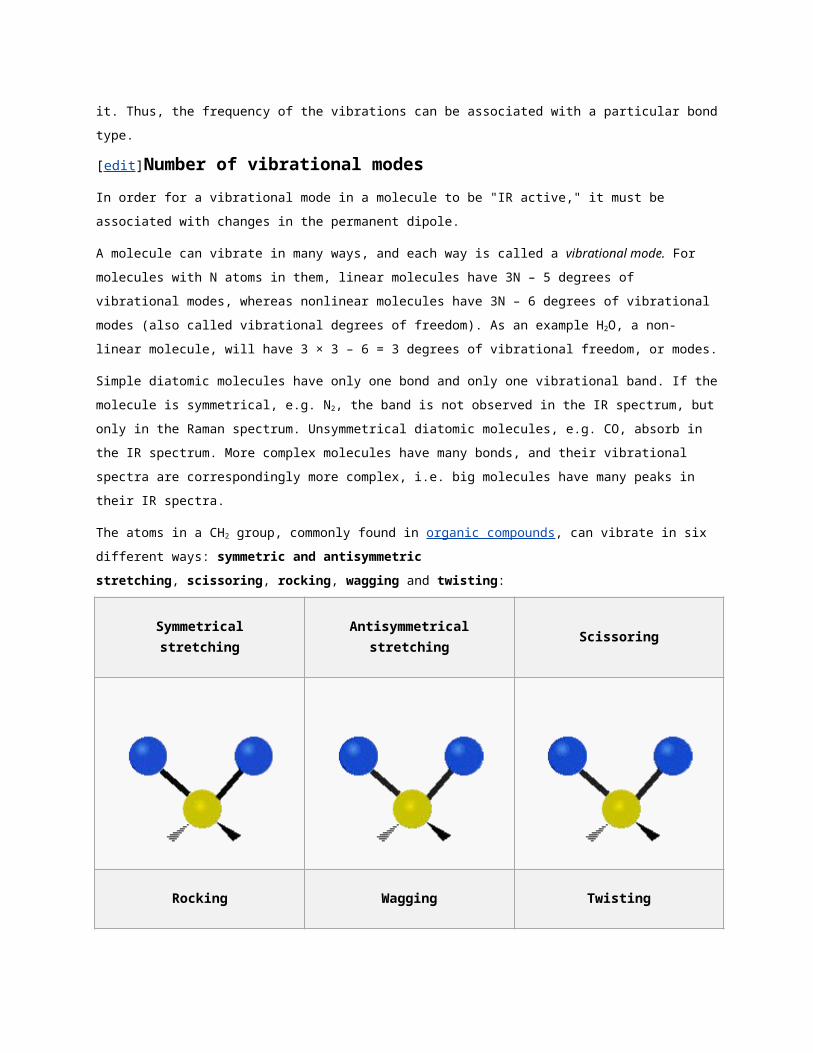
Rocking Wagging Twisting
(These figures do not represent the "recoil" of the C atoms, which, though necessarily present to balance the
overall movements of the molecule, are much smaller than the movements of the lighter H atoms).
[edit]Special effects
The simplest and most important IR bands arise from the "normal modes," the simplest distortions of the
molecule. In some cases, "overtone bands" are observed. These bands arise from the absorption of a photon
that leads to a doubly excited vibrational state. Such bands appear at approximately twice the energy of the
normal mode. Some vibrations, so-called 'combination modes," involve more than one normal mode. The
phenomenon of Fermi resonance can arise when two modes are similar in energy, Fermi resonance results in
an unexpected shift in energy and intensity of the bands.
[edit]Practical IR spectroscopy
The infrared spectrum of a sample is recorded by passing a beam of infrared light through the sample. When
the frequency of the IR is the same as the vibrational frequency of a bond, absorption occurs. Examination of
the transmitted light reveals how much energy was absorbed at each wavelength. This can be done with
a monochromatic beam usually created by an Interferometer, but also may have a Monochromator before
the Infrared detector, which changes in wavelength over time. Or by using a Fourier transform instrument to
measure all wavelengths at once. From this, atransmittance or absorbance spectrum can be produced,
showing at which IR wavelengths the sample absorbs. Analysis of these absorption characteristics reveals
details about the molecular structure of the sample.
This technique works almost exclusively on samples with covalent bonds. Simple spectra are obtained from
samples with few IR active bonds and high levels of purity. More complex molecular structures lead to more
absorption bands and more complex spectra. The technique has been used for the characterization of very
complex mixtures. Spectra issues with Infrared Flourescense are rare.
[edit]Sample preparation
Gaseous samples require a sample cell with a long pathlength to compensate for the diluteness. The
pathlength of the sample cell depends on the concentration of the compound of the interest. A simple glass
tube with length of 5 to 10 cm equipped with infrared windows at the both ends of the tube can be used for
concentrations down to several hundred ppm. Sample gas concentrations well below ppm can be measured
with a White's cell in which the infrared light is guided with mirrors to travel through the gas. White's cells are
available with optical pathlength starting from 0.5 m up to hundred meters.
Liquid samples can be sandwiched between two plates of a salt (commonly sodium chloride, or common salt,
although a number of other salts such as potassium bromide or calcium fluoride are also used).[1] The plates
are transparent to the infrared light and do not introduce any lines onto the spectra.
Solid samples can be prepared in a variety of ways. One common method is to crush the sample with an oily
mulling agent (usually Nujol) in a marble or agate mortar, with a pestle. A thin film of the mull is smeared onto
salt plates and measured. The second method is to grind a quantity of the sample with a specially purified salt
(usually potassium bromide) finely (to remove scattering effects from large crystals). This powder mixture is
then pressed in a mechanical press to form a translucent pellet through which the beam of the spectrometer
can pass.[1] A third technique is the "cast film" technique, which is used mainly for polymeric materials. The
sample is first dissolved in a suitable, non hygroscopic solvent. A drop of this solution is deposited on surface
of KBr or NaCl cell. The solution is then evaporated to dryness and the film formed on the cell is analysed
directly. Care is important to ensure that the film is not too thick otherwise light cannot pass through. This
technique is suitable for qualitative analysis. The final method is to use microtomy to cut a thin (20–100 µm)
film from a solid sample. This is one of the most important ways of analysing failed plastic products for example
because the integrity of the solid is preserved.
In photoacoustic spectroscopy the need for sample treatment is minimal. The sample, liquid or solid, is placed
into the sample cup which is inserted into the photoacoustic cell which is then sealed for the measurement. The
sample may be one solid piece, powder or basically in any form for the measurement. In example a piece of
rock can be inserted into the sample cup and the spectrum measured from it.
It is important to note that spectra obtained from different sample preparation methods will look slightly different
from each other due to differences in the samples' physical states.
[edit]Comparing to a reference
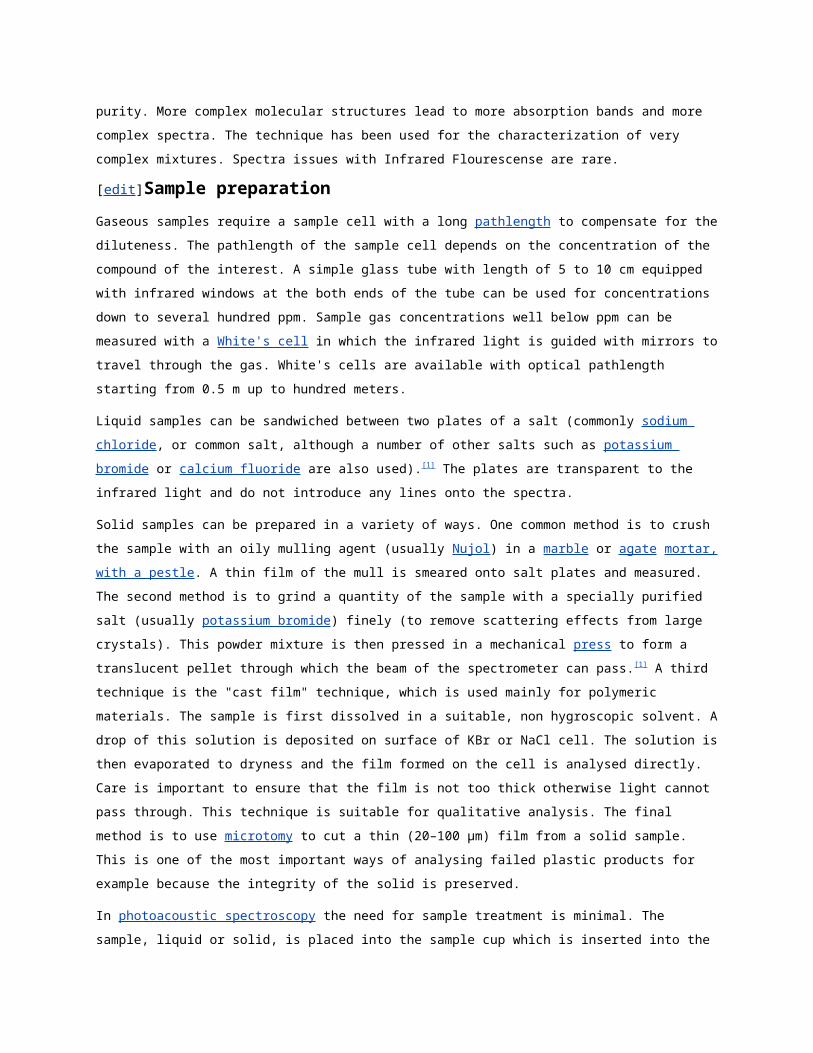
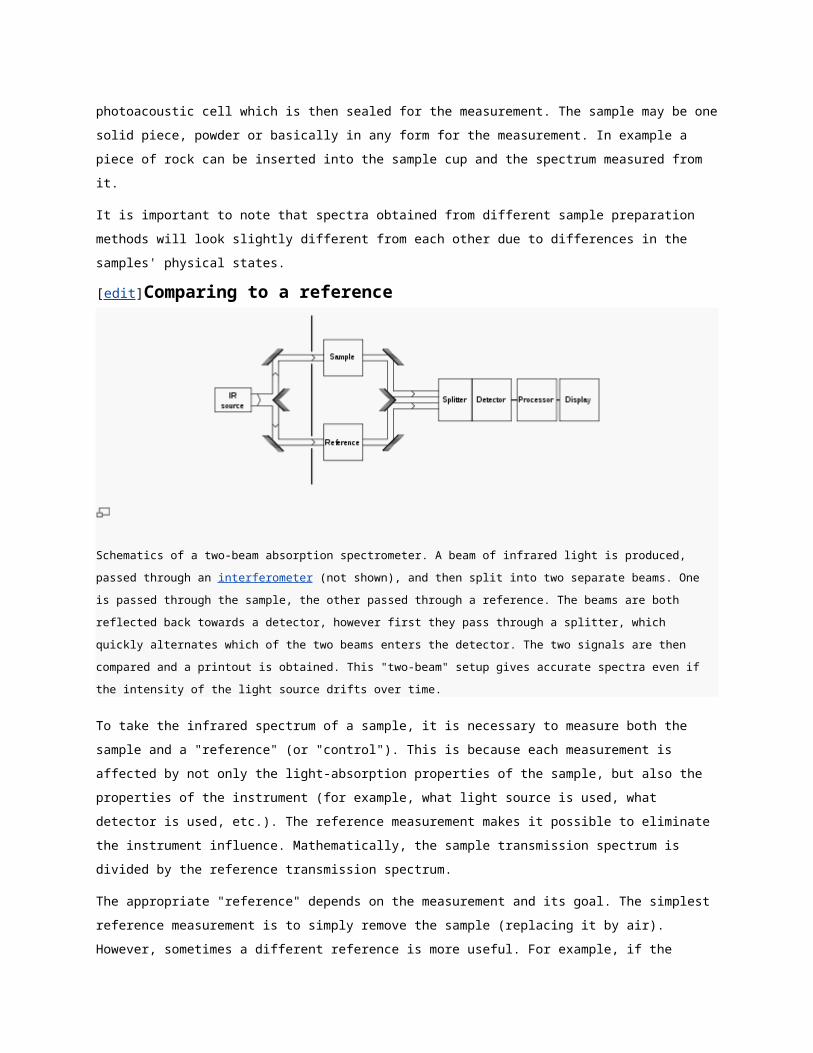
Schematics of a two-beam absorption spectrometer. A beam of infrared light is produced, passed through
an interferometer (not shown), and then split into two separate beams. One is passed through the sample, the other passed
through a reference. The beams are both reflected back towards a detector, however first they pass through a splitter, which
quickly alternates which of the two beams enters the detector. The two signals are then compared and a printout is obtained.
This "two-beam" setup gives accurate spectra even if the intensity of the light source drifts over time.
To take the infrared spectrum of a sample, it is necessary to measure both the sample and a "reference" (or
"control"). This is because each measurement is affected by not only the light-absorption properties of the
sample, but also the properties of the instrument (for example, what light source is used, what detector is used,
etc.). The reference measurement makes it possible to eliminate the instrument influence. Mathematically, the
sample transmission spectrum is divided by the reference transmission spectrum.
The appropriate "reference" depends on the measurement and its goal. The simplest reference measurement
is to simply remove the sample (replacing it by air). However, sometimes a different reference is more useful.
For example, if the sample is a dilute solute dissolved in water in a beaker, then a good reference
measurement might be to measure pure water in the same beaker. Then the reference measurement would
cancel out not only all the instrumental properties (like what light source is used), but also the light-absorbing
and light-reflecting properties of the water and beaker, and the final result would just show the properties of the
solute (at least approximately).
A common way to compare to a reference is sequentially: First measure the reference, then replace the
reference by the sample, then measure the sample. This technique is not perfectly reliable: If the infrared lamp
is a bit brighter during the reference measurement, then a bit dimmer during the sample measurement, the
measurement will be distorted. More elaborate methods, such as a "two-beam" setup (see figure), can correct
for these types of effects to give very accurate results. The Standard addition method can be used to
statistically cancel these errors.
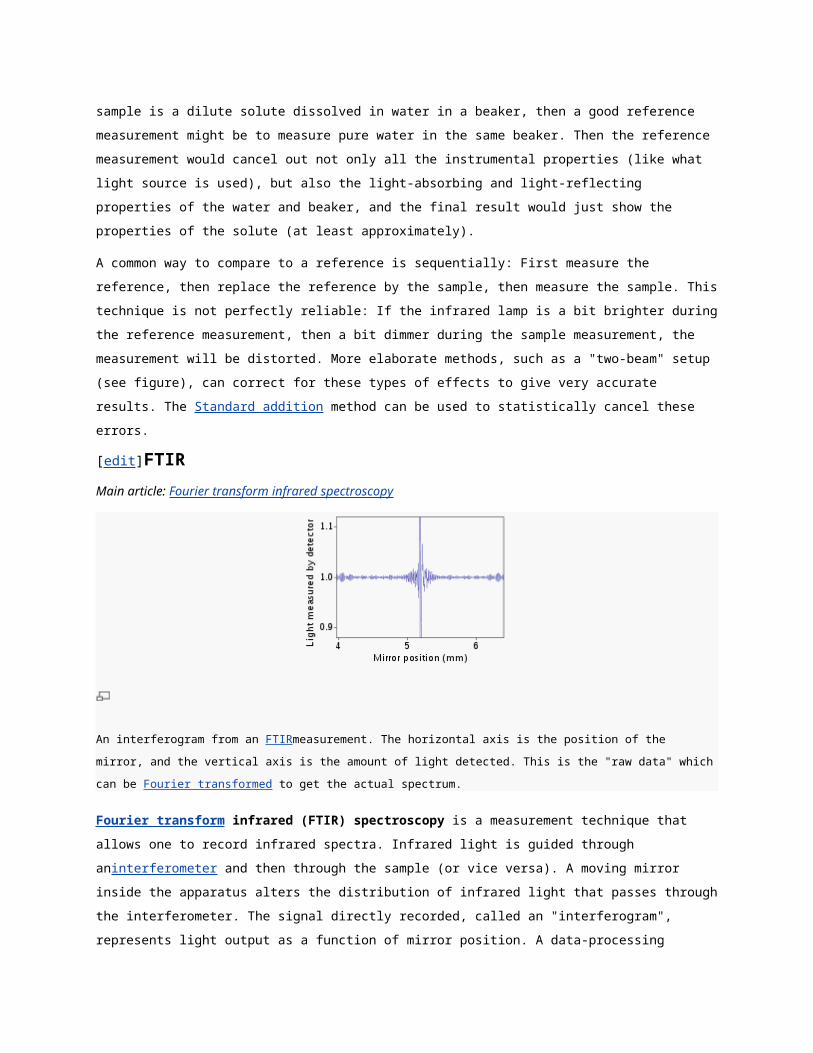
[edit]FTIRMain article: Fourier transform infrared spectroscopy
An interferogram from an FTIRmeasurement. The horizontal axis is the position of the mirror, and the vertical axis is the
amount of light detected. This is the "raw data" which can be Fourier transformed to get the actual spectrum.
Fourier transform infrared (FTIR) spectroscopy is a measurement technique that allows one to record
infrared spectra. Infrared light is guided through aninterferometer and then through the sample (or vice versa).
A moving mirror inside the apparatus alters the distribution of infrared light that passes through the
interferometer. The signal directly recorded, called an "interferogram", represents light output as a function of
mirror position. A data-processing technique called Fourier transform turns this raw data into the desired result
(the sample's spectrum): Light output as a function of infrared wavelength (or equivalently,wavenumber). As
described above, the sample's spectrum is always compared to a reference.
There is an alternate method for taking spectra (the "dispersive" or "scanning monochromator" method), where
one wavelength at a time passes through the sample. The dispersive method is more common in UV-Vis
spectroscopy, but is less practical in the infrared than the FTIR method. One reason that FTIR is favored is
called "Fellgett's advantage" or the "multiplex advantage": The information at all frequencies is collected
simultaneously, improving both speed andsignal-to-noise ratio. Another is called "Jacquinot's Throughput
Advantage": A dispersive measurement requires detecting much lower light levels than an FTIR measurement.[2] There are other advantages, as well as some disadvantages,[2] but virtually all modern infrared spectrometers
are FTIR instruments.
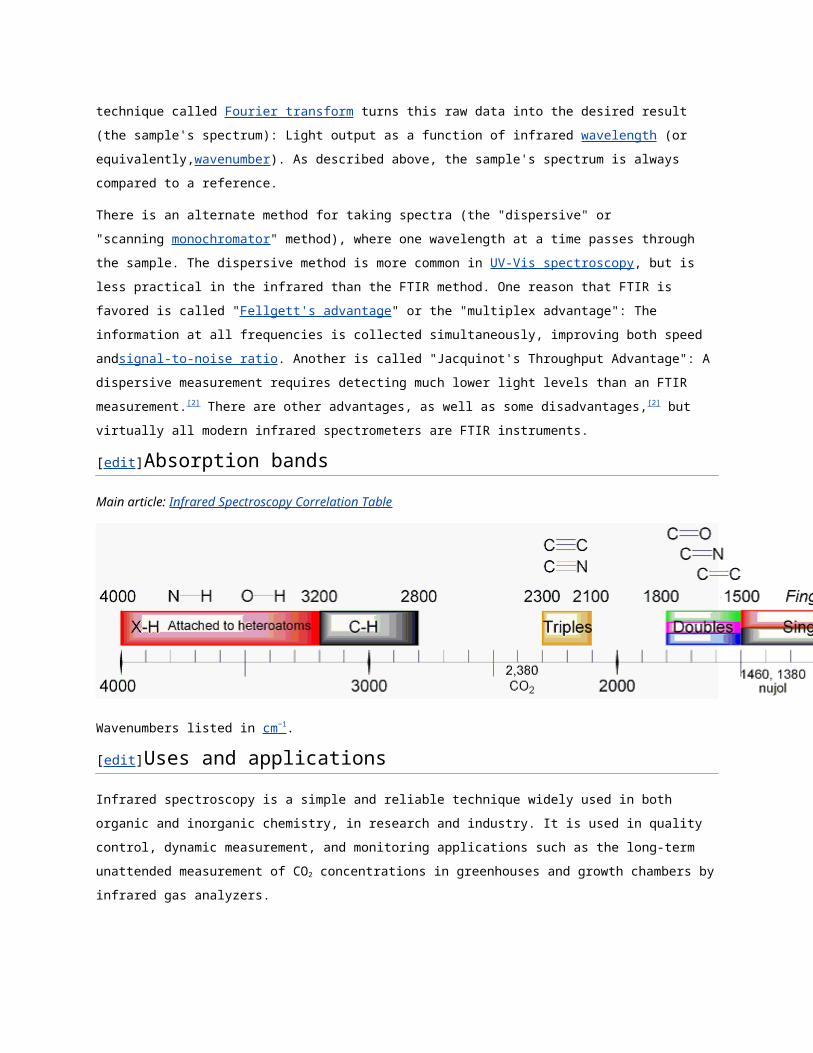
[edit]Absorption bands
Main article: Infrared Spectroscopy Correlation Table
Wavenumbers listed in cm −1 .
[edit]Uses and applications
Infrared spectroscopy is a simple and reliable technique widely used in both organic and inorganic chemistry, in
research and industry. It is used in quality control, dynamic measurement, and monitoring applications such as
the long-term unattended measurement of CO2 concentrations in greenhouses and growth chambers by
infrared gas analyzers.
It is also used in forensic analysis in both criminal and civil cases, for example in identifying polymer
degradation. It can be used in detecting how much alcohol is in the blood of a suspected drink driver measured
as 1/10,000 g/mL = 100 μg/mL.[citation needed]
A useful way of analysing solid samples without the need for cutting samples uses ATR or attenuated total
reflectance spectroscopy. Using this approach, samples are pressed against the face of a single crystal. The
infrared radiation passes through the crystal and only interacts with the sample at the interface between the two
materials.
With increasing technology in computer filtering and manipulation of the results, samples in solution can now
be measured accurately (water produces a broad absorbance across the range of interest, and thus renders
the spectra unreadable without this computer treatment).
Some instruments will also automatically tell you what substance is being measured from a store of thousands
of reference spectra held in storage.
Infrared spectroscopy is also useful in measuring the degree of polymerization in polymer manufacture.
Changes in the character or quantity of a particular bond are assessed by measuring at a specific frequency
over time. Modern research instruments can take infrared measurements across the range of interest as
frequently as 32 times a second. This can be done whilst simultaneous measurements are made using other
techniques. This makes the observations of chemical reactions and processes quicker and more accurate.
Infrared spectroscopy has also been successfully utilized in the field of semiconductor microelectronics: [3] for
example, infrared spectroscopy can be applied to semiconductors like silicon, gallium arsenide, gallium
nitride, zinc selenide, amorphous silicon, silicon nitride, etc.
The instruments are now small, and can be transported, even for use in field trials.
[edit]Isotope effects
The different isotopes in a particular species may give fine detail in infrared spectroscopy. For example, the O–
O stretching frequency (in reciprocal centimeters) of oxyhemocyanin is experimentally determined to be 832
and 788 cm−1 for ν(16O–16O) and ν(18O–18O), respectively.
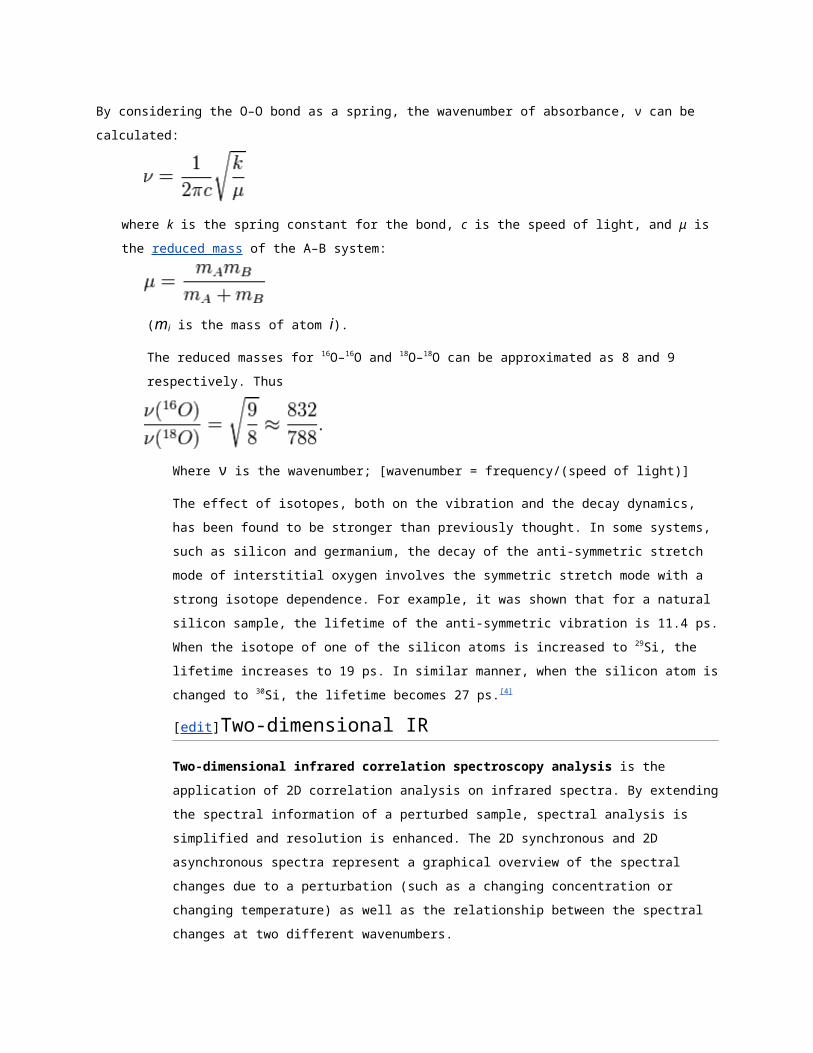
By considering the O–O bond as a spring, the wavenumber of absorbance, ν can be calculated:
where k is the spring constant for the bond, c is the speed of light, and μ is the reduced mass of the A–B
system:
(mi is the mass of atom i).
The reduced masses for 16O–16O and 18O–18O can be approximated as 8 and 9 respectively. Thus
Where ν is the wavenumber; [wavenumber = frequency/(speed of light)]
The effect of isotopes, both on the vibration and the decay dynamics, has been found to be
stronger than previously thought. In some systems, such as silicon and germanium, the decay of
the anti-symmetric stretch mode of interstitial oxygen involves the symmetric stretch mode with a
strong isotope dependence. For example, it was shown that for a natural silicon sample, the
lifetime of the anti-symmetric vibration is 11.4 ps. When the isotope of one of the silicon atoms is
increased to 29Si, the lifetime increases to 19 ps. In similar manner, when the silicon atom is
changed to 30Si, the lifetime becomes 27 ps.[4]
[edit]Two-dimensional IR
Two-dimensional infrared correlation spectroscopy analysis is the application of 2D
correlation analysis on infrared spectra. By extending the spectral information of a perturbed
sample, spectral analysis is simplified and resolution is enhanced. The 2D synchronous and 2D
asynchronous spectra represent a graphical overview of the spectral changes due to a
perturbation (such as a changing concentration or changing temperature) as well as the
relationship between the spectral changes at two different wavenumbers.
Main article: Two-dimensional infrared spectroscopy
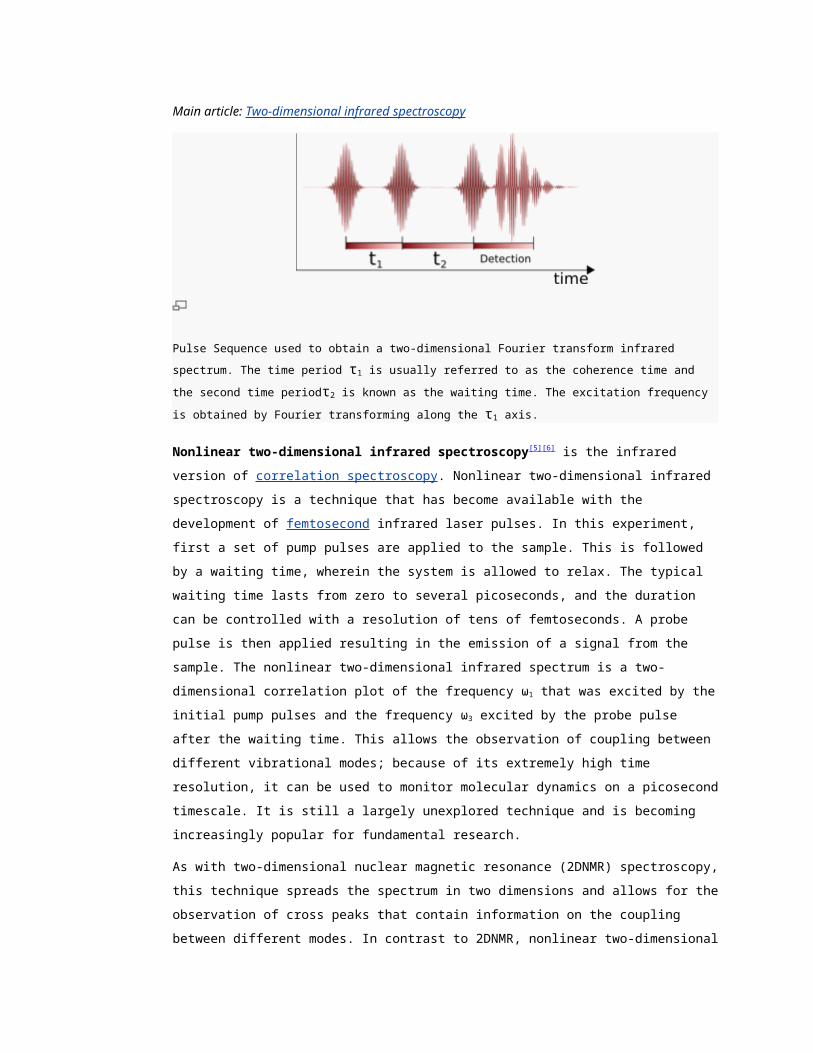
Pulse Sequence used to obtain a two-dimensional Fourier transform infrared spectrum. The time period τ1 is
usually referred to as the coherence time and the second time periodτ2 is known as the waiting time. The
excitation frequency is obtained by Fourier transforming along the τ1 axis.
Nonlinear two-dimensional infrared spectroscopy[5][6] is the infrared version of correlation
spectroscopy. Nonlinear two-dimensional infrared spectroscopy is a technique that has become
available with the development of femtosecond infrared laser pulses. In this experiment, first a set
of pump pulses are applied to the sample. This is followed by a waiting time, wherein the system
is allowed to relax. The typical waiting time lasts from zero to several picoseconds, and the
duration can be controlled with a resolution of tens of femtoseconds. A probe pulse is then
applied resulting in the emission of a signal from the sample. The nonlinear two-dimensional
infrared spectrum is a two-dimensional correlation plot of the frequency ω1 that was excited by
the initial pump pulses and the frequency ω3 excited by the probe pulse after the waiting time.
This allows the observation of coupling between different vibrational modes; because of its
extremely high time resolution, it can be used to monitor molecular dynamics on a picosecond
timescale. It is still a largely unexplored technique and is becoming increasingly popular for
fundamental research.
As with two-dimensional nuclear magnetic resonance (2DNMR) spectroscopy, this technique
spreads the spectrum in two dimensions and allows for the observation of cross peaks that
contain information on the coupling between different modes. In contrast to 2DNMR, nonlinear
two-dimensional infrared spectroscopy also involves the excitation to overtones. These
excitations result in excited state absorption peaks located below the diagonal and cross peaks.
In 2DNMR, two distinct techniques, COSY and NOESY, are frequently used. The cross peaks in
the first are related to the scalar coupling, while in the later they are related to the spin transfer
between different nuclei. In nonlinear two-dimensional infrared spectroscopy, analogs have been
drawn to these 2DNMR techniques. Nonlinear two-dimensional infrared spectroscopy with zero
waiting time corresponds to COSY, and nonlinear two-dimensional infrared spectroscopy with
finite waiting time allowing vibrational population transfer corresponds to NOESY. The COSY
variant of nonlinear two-dimensional infrared spectroscopy has been used for determination of
the secondary structure content proteins.[7]
[edit]See also
Absorption spectroscopy
Applied spectroscopy
Far-infrared astronomy
Forensic chemistry
Forensic engineering
Forensic polymer engineering
Forensic science
Infrared astronomy
Infrared microscopy
Infrared spectroscopy correlation table
Near-infrared spectroscopy
Photothermal microspectroscopy
[edit]References
1. ^ a b Laurence M. Harwood, Christopher J. Moody (1989). Experimental organic chemistry:
Principles and Practice (Illustrated ed.). Wiley-Blackwell. p. 292. ISBN 0632020172.
2. ^ a b Chromatography/Fourier transform infrared spectroscopy and its applications , by Robert
White, p7
3. ̂ Lau, W.S. (1999). Infrared characterization for microelectronics. World
Scientific.ISBN 9810223528.
4. ̂ Kohli, K.; Davies, Gordon; Vinh, N.; West, D.; Estreicher, S.; Gregorkiewicz, T.; Izeddin, I.;
Itoh, K. (2006). "Isotope Dependence of the Lifetime of the 1136-cm-1 Vibration of Oxygen in
Silicon".Physical Review Letters 96 (22):
225503. Bibcode 2006PhRvL..96v5503K.doi:10.1103/PhysRevLett.96.225503. PMID 168033
20.
5. ̂ P. Hamm, M. H. Lim, R. M. Hochstrasser (1998). "Structure of the amide I band of peptides
measured by femtosecond nonlinear-infrared spectroscopy". J. Phys. Chem. B 102 (31):
6123.doi:10.1021/jp9813286.
6. ̂ S. Mukamel (2000). "Multidimensional Fentosecond Correlation Spectroscopies of
Electronic and Vibrational Excitations". Annual Review of Physics and Chemistry 51 (1):
691.doi:10.1146/annurev.physchem.51.1.691. PMID 11031297.
7. ̂ N. Demirdöven, C. M. Cheatum, H. S. Chung, M. Khalil, J. Knoester, A. Tokmakoff (2004).
"Two-dimensional infrared spectroscopy of antiparallel beta-sheet secondary
structure". Journal of the American Chemical Society 126 (25):
7981. doi:10.1021/ja049811j. PMID 15212548.
[edit]External links
Wikimedia Commons has
media related to: Infrared
spectroscopy
A useful gif animation of different vibrational modes: SHU.ac.uk
Illustrated guide to basic IR spectra interpretation
Infrared spectroscopy for organic chemists
Organic compounds spectrum database [hide]v · d · e Spectroscopy
Atomic spectroscopy · Emission spectroscopy · Electron spin resonance · Fluorescence spectroscopy · Gamma spectroscopy · Infrared spectroscopy
spectroscopy · Raman spectroscopy · Resonance enhanced multiphoton ionization · Rotational spectroscopy · Terahertz spectroscopy · Ultraviolet-visible spectroscopy
View page ratings
Rate this page
What's this?
Trustworthy
Objective
Complete
Well-written
I am highly knowledgeable about this topic (optional)
Submit ratings
Categories: Infrared spectroscopy
Log in / create account
Article Discussion

Read Edit View history
Main page Contents Featured content Current events Random article Donate to Wikipedia
Interaction Help About Wikipedia Community portal Recent changes Contact Wikipedia
ToolboxPrint/exportLanguages
العربية Български Česky Dansk Deutsch Ελληνικά Español فارسی Français Bahasa Indonesia Italiano Magyar Bahasa Melayu Nederlands 日本語 Norsk (bokmål) Polski Português Русский Українська 中文 This page was last modified on 31 August 2011 at 06:16.
Text is available under the Creative Commons Attribution-ShareAlike License; additional terms may apply.
See Terms of use for details.
Wikipedia® is a registered trademark of the Wikimedia Foundation, Inc., a non-profit organization.
Contact us

Privacy policy
About Wikipedia
Disclaimers
Mobile view
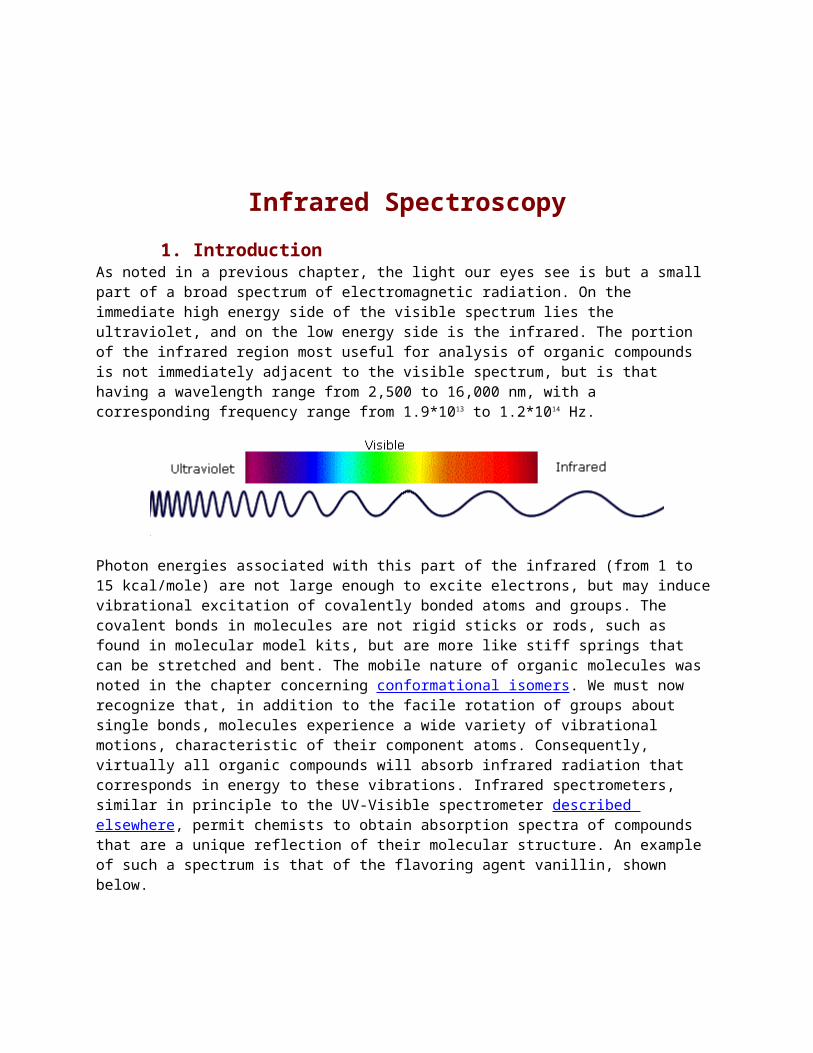
Infrared Spectroscopy 1. IntroductionAs noted in a previous chapter, the light our eyes see is but a small part of a broad spectrum of electromagnetic radiation. On the immediate high energy side of the visible spectrum lies the ultraviolet, and on the low energy side is the infrared. The portion of the infrared region most useful for analysis of organic compounds is not immediately adjacent to the visible spectrum, but is that having a wavelength range from 2,500 to 16,000 nm, with a corresponding frequency range from 1.9*1013 to 1.2*1014 Hz.

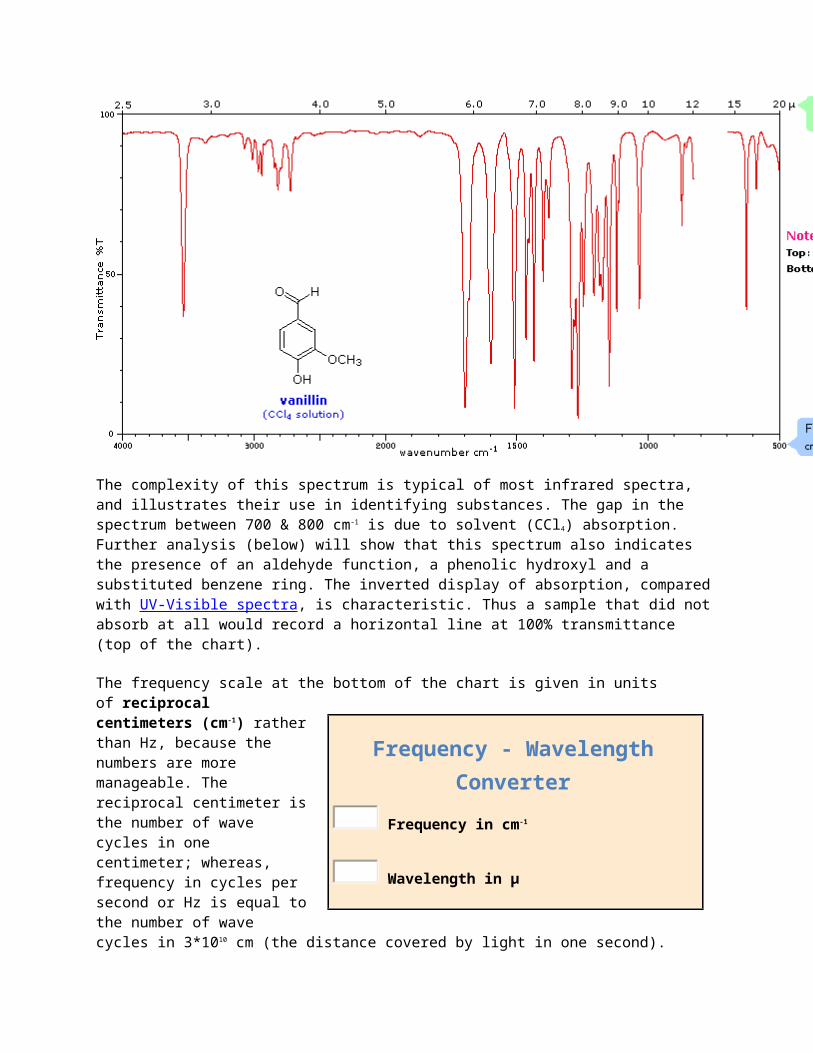
Photon energies associated with this part of the infrared (from 1 to 15 kcal/mole) are not large enough to excite electrons, but may induce vibrational excitation of covalently bonded atoms and groups. The covalent bonds in molecules are not rigid sticks or rods, such as found in molecular model kits, but are more like stiff springs that can be stretched and bent. The mobile nature of organic molecules was noted in the chapter concerning conformational isomers. We must now recognize that, in addition to the facile rotation of groups about single bonds, molecules experience a wide variety of vibrational motions, characteristic of their component atoms. Consequently, virtually all organic compounds will absorb infrared radiation that corresponds in energy to these vibrations. Infrared spectrometers, similar in principle to the UV-Visible spectrometer described elsewhere, permit chemists to obtain absorption spectra of compounds that are a unique reflection of their molecular structure. An example of such a spectrum is that of the flavoring agent vanillin, shown below.
The complexity of this spectrum is typical of most infrared spectra, and illustrates their use in identifying substances. The gap in the spectrum between 700 & 800 cm-1 is due to solvent (CCl4) absorption. Further analysis (below) will show that this spectrum also indicates the presence of an aldehyde function, a phenolic hydroxyl and a substituted benzene ring. The inverted display of absorption, compared with UV-Visible spectra, is characteristic. Thus a sample that did not absorb at all would record a horizontal line at 100% transmittance (top of the chart).

The frequency scale at the bottom of the chart is given in units of reciprocal centimeters (cm-
1) rather than Hz, because the numbers are more manageable. The reciprocal centimeter is the number of wave cycles in one centimeter; whereas, frequency in cycles per second or Hz is equal to the number of wave cycles in 3*1010 cm (the distance covered by light in one second). Wavelength units are in micrometers,microns (μ), instead of nanometers for the same reason. Most infrared spectra are displayed on a linear frequency scale, as shown here, but in some older texts a linear wavelength scale is used. A calculator for interconverting these frequency and wavelength values is provided on the right. Simply enter the value to be converted in the appropriate box, press "Calculate" and the equivalent number will appear in the empty box.Infrared spectra may be obtained from samples in all phases (liquid, solid and gaseous). Liquids are usually examined as a thin film sandwiched between two polished salt plates (note that glass absorbs infrared radiation, whereas NaCl is transparent). If solvents are used to dissolve solids, care must be taken to avoid obscuring important spectral regions by solvent absorption. Perchlorinated solvents such as carbon tetrachloride, chloroform and tetrachloroethene are commonly used. Alternatively, solids may either be incorporated in a thin KBr disk, prepared under high pressure, or mixed with a little non-volatile liquid and ground to a paste (or mull) that is smeared between salt plates.
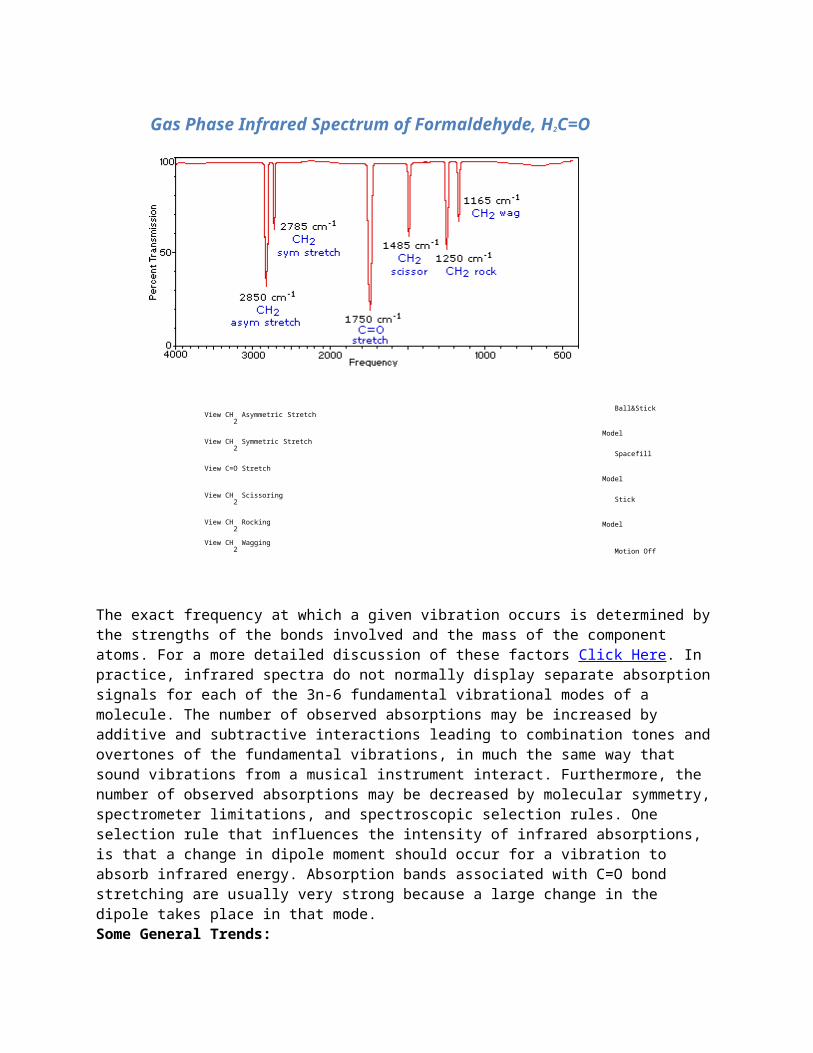
2. Vibrational SpectroscopyA molecule composed of n-atoms has 3n degrees of freedom, six of which are translations and rotations of the molecule itself. This leaves 3n-6 degrees of vibrational freedom (3n-5 if the molecule is linear). Vibrational modes are often given descriptive names, such as stretching, bending, scissoring, rocking and twisting. The four-atom molecule of formaldehyde, the gas phase spectrum of which is shown below, provides an example of these terms. If a ball & stick model of formaldehyde is not displayed to the right of the spectrum, press the view ball&stick model button on the right. We expect six fundamental vibrations (12 minus 6), and these have been assigned to the spectrum absorptions. To see the formaldehyde molecule display a vibration, click one of the buttons under the spectrum, or click on one of the absorption peaks in the spectrum.
Frequency - Wavelength Converter Frequency in cm-1
Wavelength in μ
Gas Phase Infrared Spectrum of Formaldehyde, H2C=O
View CH2 Asymmetric Stretch
View CH2 Symmetric Stretch
View C=O Stretch View CH
2 Scissoring
View CH2 Rocking
View CH2 Wagging
Ball&Stick Model Spacefill Model Stick Model Motion Off
The exact frequency at which a given vibration occurs is determined by the strengths of the bonds involved and the mass of the component atoms. For a more detailed discussion of these factors Click Here. In practice, infrared spectra do not normally display separate absorption signals for each of the 3n-6 fundamental vibrational modes of a molecule. The number of observed absorptions may be increased by additive and subtractive interactions leading to combination tones and overtones of the fundamental vibrations, in much the same way that sound vibrations from a musical instrument interact. Furthermore, the number of observed absorptions may be decreased by molecular symmetry, spectrometer limitations, and spectroscopic selection rules. One selection rule that influences the intensity of infrared absorptions, is that a change in dipole moment should occur for a vibration to absorb infrared energy. Absorption bands associated with C=O bond stretching are usually very strong because a large change in the dipole takes place in that mode.Some General Trends:
i) Stretching frequencies are higher than corresponding bending frequencies. (It is easier to bend a bond than to stretch or compress it.)ii) Bonds to hydrogen have higher stretching frequencies than those to heavier atoms.iii) Triple bonds have higher stretching frequencies than corresponding double bonds, which in turn have higher frequencies than single bonds. (Except for bonds to hydrogen).
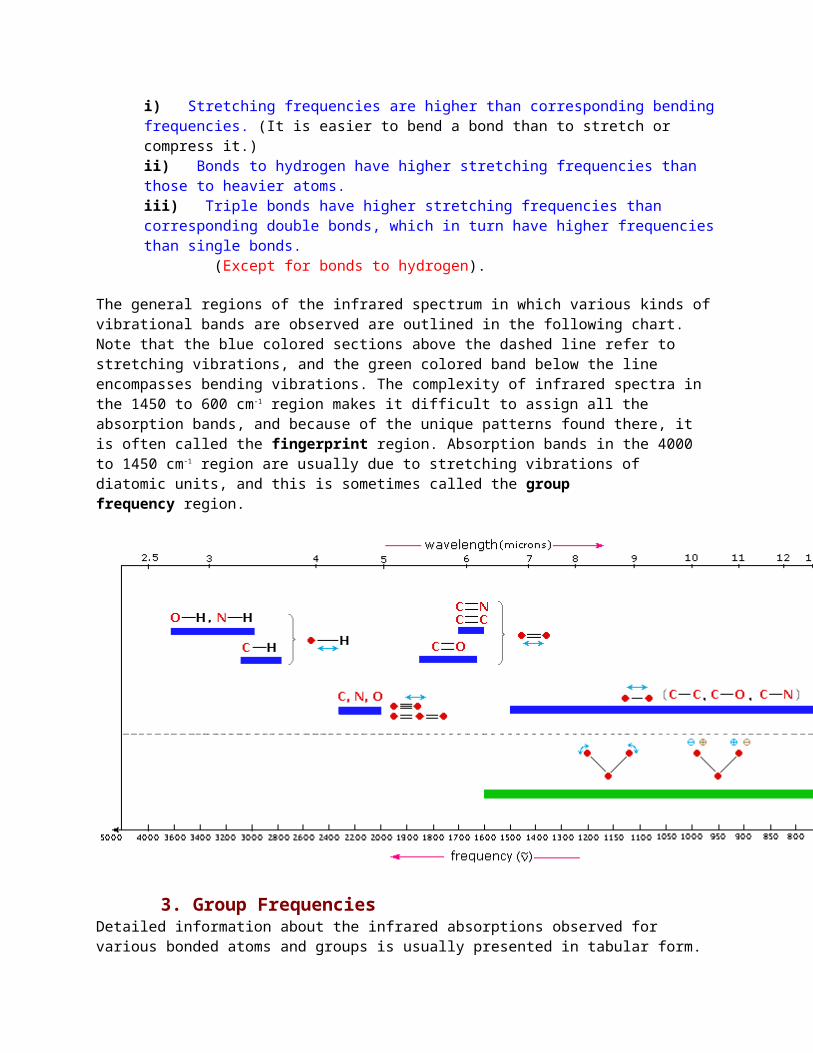
The general regions of the infrared spectrum in which various kinds of vibrational bands are observed are outlined in the following chart. Note that the blue colored sections above the dashed line refer to stretching vibrations, and the green colored band below the line encompasses bending vibrations. The complexity of infrared spectra in the 1450 to 600 cm-
1 region makes it difficult to assign all the absorption bands, and because of the unique patterns found there, it is often called the fingerprint region. Absorption bands in the 4000 to 1450 cm-
1 region are usually due to stretching vibrations of diatomic units, and this is sometimes called the group frequency region.
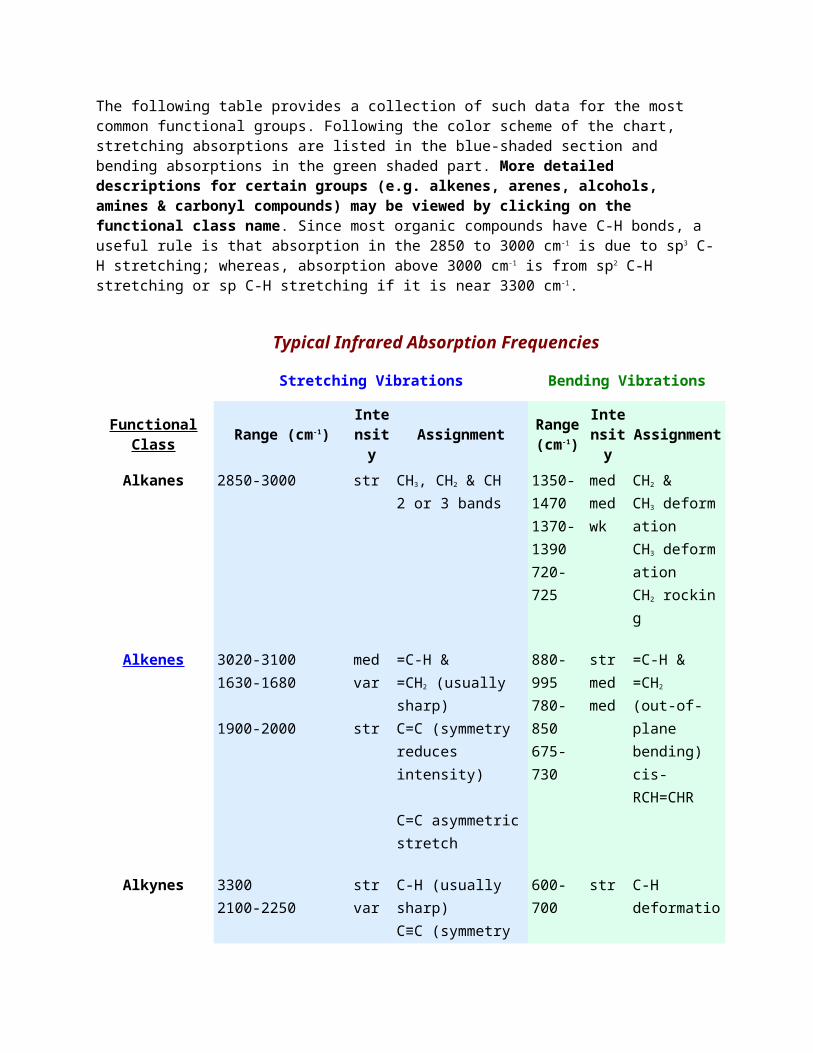
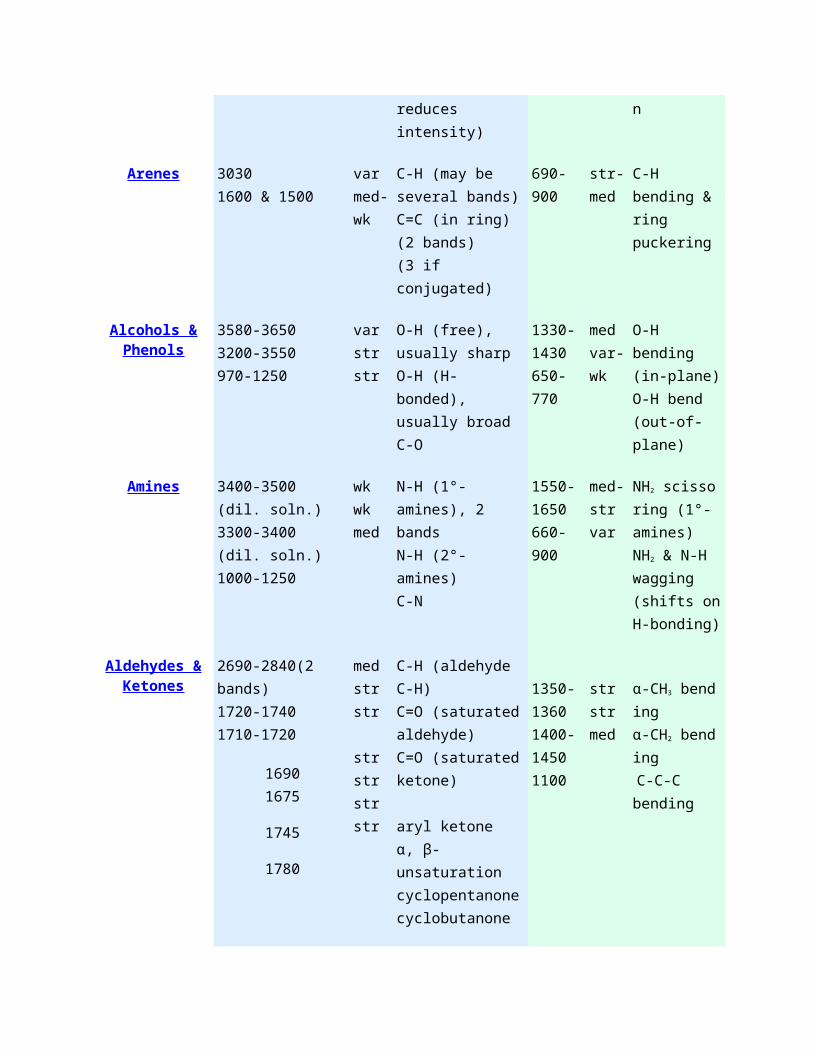
3. Group FrequenciesDetailed information about the infrared absorptions observed for various bonded atoms and groups is usually presented in tabular form. The following table provides a collection of such data for the most common functional groups. Following the color scheme of the chart, stretching absorptions are listed in the blue-shaded section and bending absorptions in the green shaded part. More detailed descriptions for certain groups (e.g. alkenes, arenes, alcohols, amines & carbonyl compounds) may be viewed by clicking on the functional class name. Since most organic compounds have C-H bonds, a useful rule is that absorption in the 2850 to 3000 cm-1 is due to sp3 C-H stretching; whereas, absorption above 3000 cm-1 is from sp2 C-H stretching or sp C-H stretching if it is near 3300 cm-1.
Typical Infrared Absorption Frequencies
Stretching Vibrations Bending Vibrations
Functional Class Range (cm-1) Intensity Assignment Range
(cm-1)Intensity Assignment
Alkanes 2850-3000 str CH3, CH2 & CH 1350- med CH2 &
2 or 3 bands 14701370-1390720-725
medwk
CH3 deformationCH3 deformationCH2 rocking
Alkenes 3020-31001630-1680
1900-2000
medvar
str
=C-H & =CH2 (usually sharp) C=C (symmetry reduces intensity)
C=C asymmetric stretch
880-995780-850675-730
strmedmed
=C-H & =CH2
(out-of-plane bending)cis-RCH=CHR
Alkynes 33002100-2250
strvar
C-H (usually sharp)C≡C (symmetry reduces intensity)
600-700 str C-H deformation
Arenes 30301600 & 1500
varmed-wk
C-H (may be several bands)C=C (in ring) (2 bands)(3 if conjugated)
690-900 str-med
C-H bending &ring puckering
Alcohols & Phenols
3580-36503200-3550970-1250
varstrstr
O-H (free), usually sharpO-H (H-bonded), usually broadC-O
1330-1430650-770
medvar-wk
O-H bending (in-plane)O-H bend (out-of-plane)
Amines 3400-3500 (dil. soln.)3300-3400 (dil. soln.)1000-1250
wkwkmed
N-H (1°-amines), 2 bandsN-H (2°-amines)C-N
1550-1650660-900
med-strvar
NH2 scissoring (1°-amines)NH2 & N-H wagging(shifts on H-bonding)
Aldehydes & Ketones
2690-2840(2 bands)1720-17401710-1720
1690
medstrstr
str
C-H (aldehyde C-H)C=O (saturated aldehyde) C=O (saturated ketone)
1350-13601400-1450
strstrmed
α-CH3 bendingα-CH2 bending C-C-C bending
1675
1745
1780
strstrstr
aryl ketoneα, β-unsaturationcyclopentanonecyclobutanone
1100
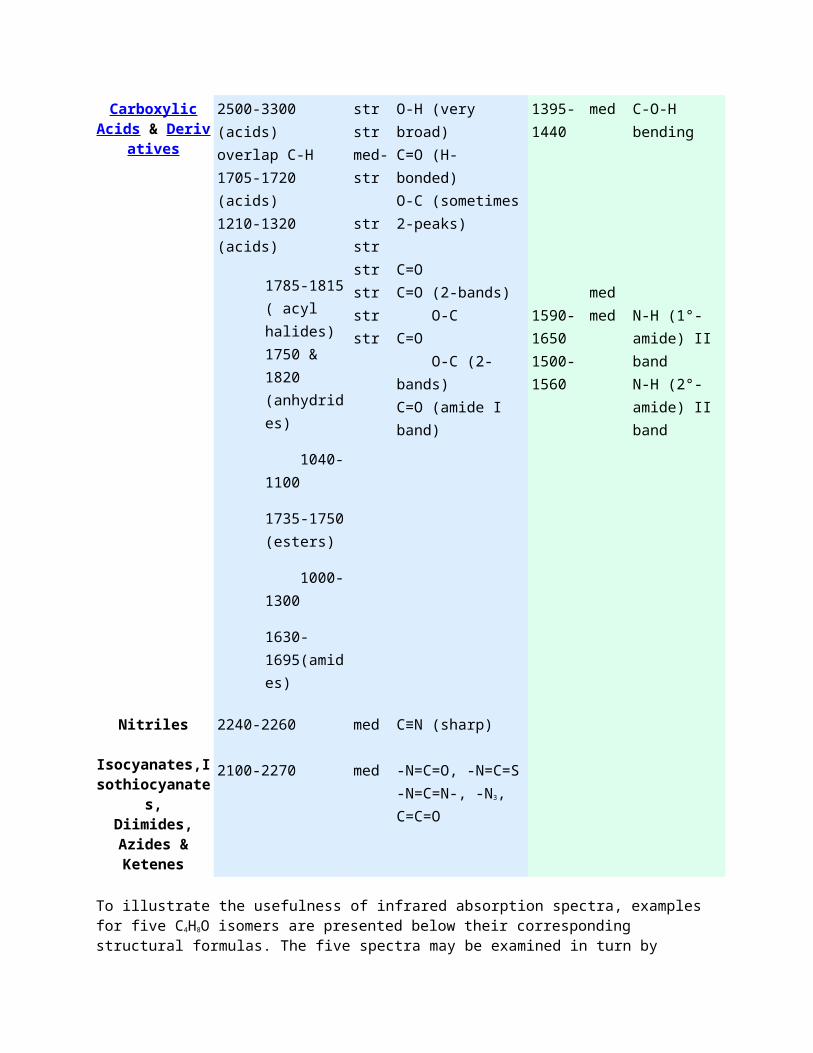
Carboxylic Acids & Derivativ
es
2500-3300 (acids) overlap C-H1705-1720 (acids)1210-1320 (acids)
1785-1815 ( acyl halides)1750 & 1820 (anhydrides)
1040-1100
1735-1750 (esters)
1000-1300
1630-1695(amides)
strstrmed-str
strstrstrstrstrstr
O-H (very broad)C=O (H-bonded) O-C (sometimes 2-peaks)
C=OC=O (2-bands) O-CC=O O-C (2-bands)C=O (amide I band)
1395-1440
1590-1650 1500-1560
med
medmed
C-O-H bending
N-H (1°-amide) II bandN-H (2°-amide) II band
Nitriles
Isocyanates,Isothiocyanates,
Diimides, Azides & Ketenes
2240-2260
2100-2270
med
med
C≡N (sharp)
-N=C=O, -N=C=S-N=C=N-, -N3, C=C=O
To illustrate the usefulness of infrared absorption spectra, examples for five C4H8O isomers are presented below their corresponding structural formulas. The five spectra may be examined in turn by clicking the "Toggle Spectra" button. Try to associate each spectrum (A - E) with one of the isomers in the row above it. When you have made assignments check your answers by clicking on the structure or name of each isomer.
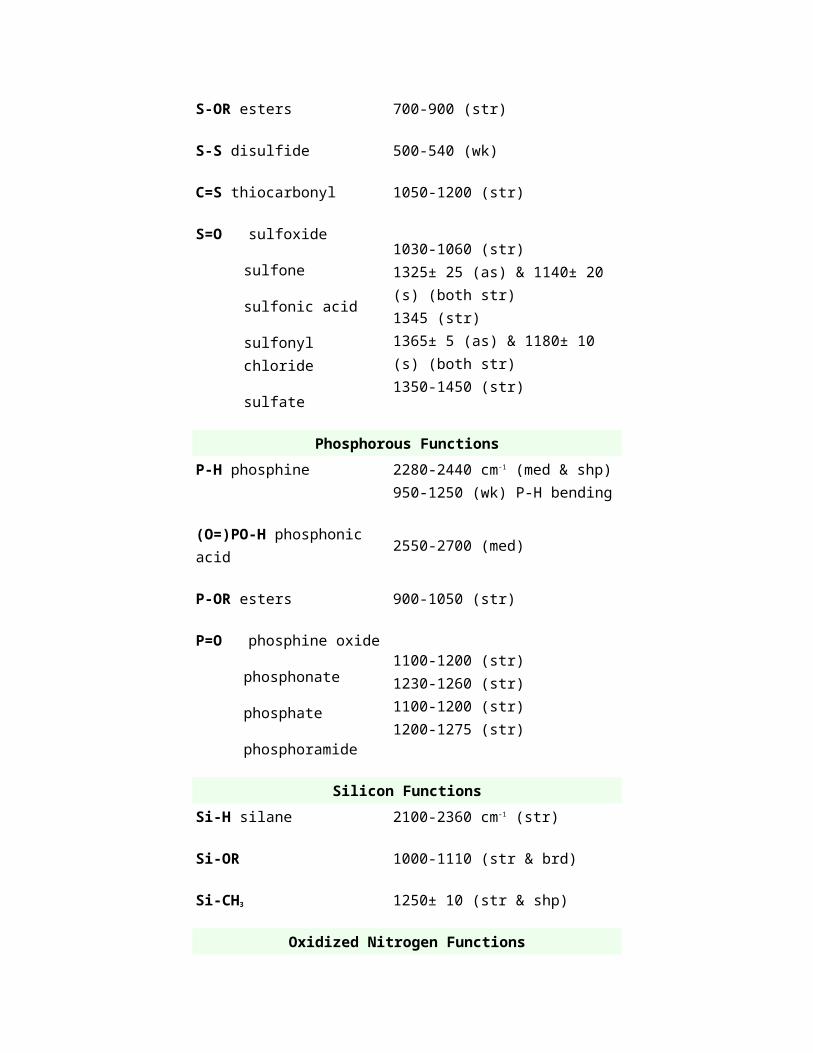
4. Other Functional GroupsInfrared absorption data for some functional groups not listed in the preceding table are given below. Most of the absorptions cited are associated with stretching vibrations. Standard abbreviations (str = strong, wk = weak, brd = broad & shp = sharp) are used to describe the absorption bands.
Functional Class Characteristic AbsorptionsSulfur Functions
S-H thiols 2550-2600 cm-1 (wk & shp)
S-OR esters 700-900 (str)
S-S disulfide 500-540 (wk)
C=S thiocarbonyl 1050-1200 (str)
S=O sulfoxide 1030-1060 (str)1325± 25 (as) & 1140± 20 (s) (both str)
sulfone
sulfonic acid
sulfonyl chloride
sulfate
1345 (str)1365± 5 (as) & 1180± 10 (s) (both str)1350-1450 (str)
Phosphorous FunctionsP-H phosphine 2280-2440 cm-1 (med & shp)
950-1250 (wk) P-H bending
(O=)PO-H phosphonic acid 2550-2700 (med)
P-OR esters 900-1050 (str)
P=O phosphine oxide
phosphonate
phosphate
phosphoramide
1100-1200 (str)1230-1260 (str)1100-1200 (str)1200-1275 (str)
Silicon FunctionsSi-H silane 2100-2360 cm-1 (str)
Si-OR 1000-1110 (str & brd)
Si-CH3 1250± 10 (str & shp)
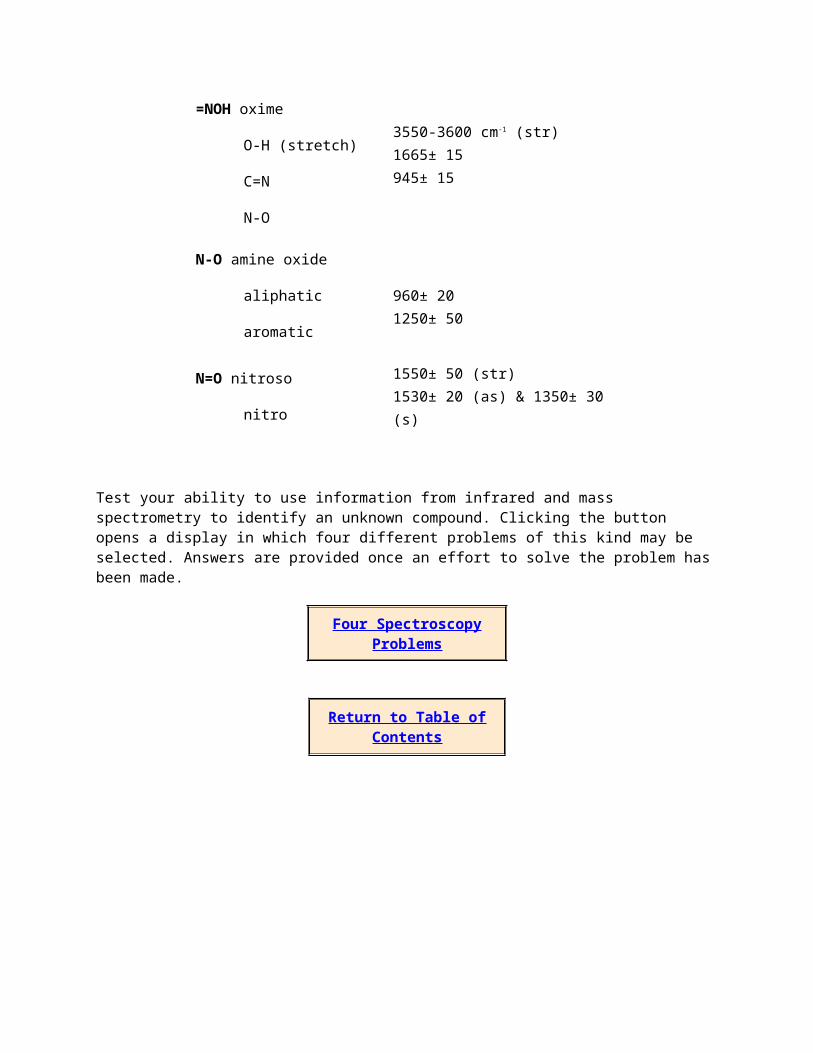
Oxidized Nitrogen Functions=NOH oxime
O-H (stretch)
C=N
N-O
3550-3600 cm-1 (str)1665± 15945± 15
N-O amine oxide
aliphatic
aromatic
960± 201250± 50
N=O nitroso
nitro
1550± 50 (str)1530± 20 (as) & 1350± 30 (s)
Test your ability to use information from infrared and mass spectrometry to identify an unknown compound. Clicking the button opens a display in which four different problems of this kind may be selected. Answers are provided once an effort to solve the problem has been made.
Four Spectroscopy Problems
Return to Table of Contents
Infrared Spectroscopy
Most of us are quite familiar with infrared radiation. We have seen infrared lamps keep food hot and often associate infrared radiation with heat. While the generation of heat is a probable event following the absorption of infrared radiation, it is important to distinguish between the two. Infrared is a form of radiation that can travel through a vacuum while heat is associated with the motion and kinetic energy of molecules. The concept of heat in a vacuum has no meaning because of the lack of molecules and molecular motion. Infrared spectroscopy is the study of how molecules absorb infrared radiation and ultimately convert it to heat. By examining how this occurs, we will not only learn about how infrared radiation is absorbed, but we will also learn about molecular structure and how the study of infrared spectroscopy can provide
information about the structure of organic molecules. An infrared spectrum of a chemical substance, is very much like a photograph of a molecule. However, unlike a normal photograph which would reveal the position of nuclei, the infrared spectrum will only reveal a partial structure. It is the purpose of this narrative to provide you with the tools necessary to interpret infrared spectra, successfully. In some respects, this process is similar to reading an X-ray of the chest. While most of us could easily identify the gross structural features of the chest such as the ribs, most of us would need some guidance in identifying those features on the X-ray film associated with disease.
In order to interpret infrared spectra, having some idea or model of the physical process involved when a molecule interacts with infrared radiation would be useful. You may recall in introductory chemistry, the discussion of how atoms interact with electromagnetic radiation led to the development of quantum theory and the introduction of quantum numbers. The interaction of infrared radiation with molecules requires a similar treatment. While the use of quantum theory is necessary to explain this interaction, most of us live in a world that appears continuous to us and we do not have much experience discussing phenomena that occur in discrete steps. The discussion that follows will attempt to develop a model of how molecules interact with infrared radiation that is based as much as possible on classical physics. When necessary, we will insert the modifications required by quantum mechanics. This model, while perhaps oversimplified, will contain the physical picture that is useful to understand the phenomena and will be correct from a quantum mechanical standpoint.
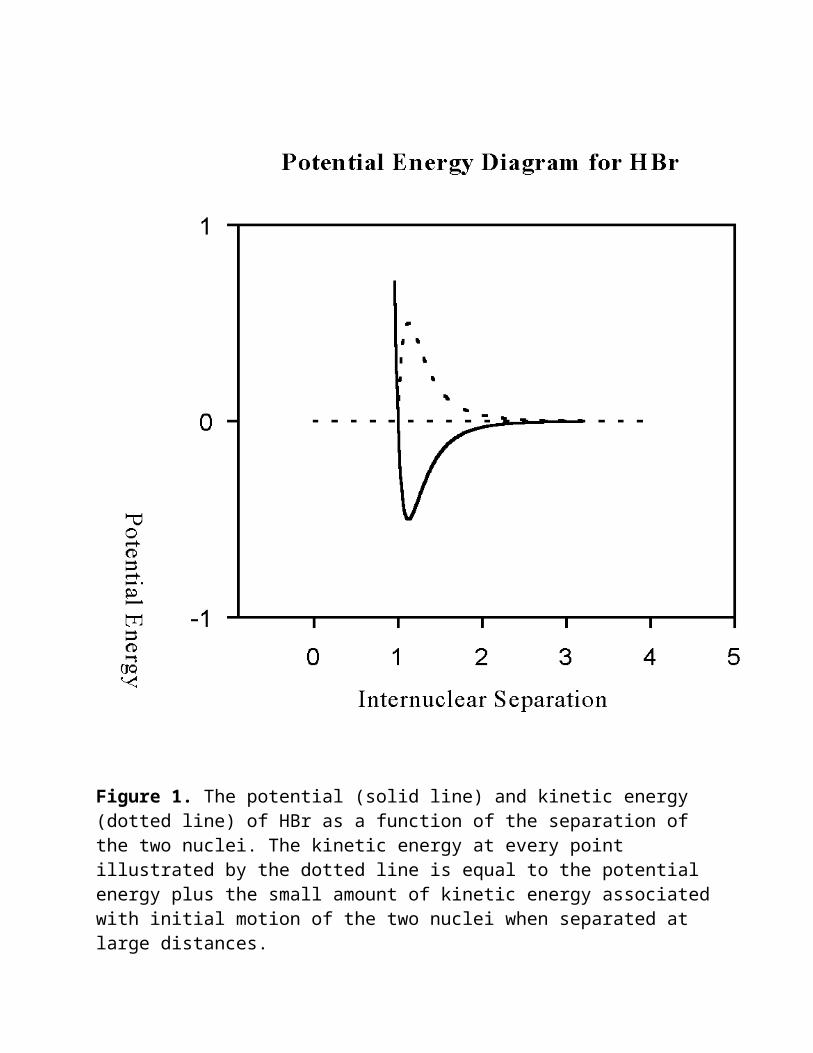
Let's begin first by considering two isolated atoms, a hydrogen and a bromine atom moving toward each other from a great distance. What do you suppose will happen once the atoms approach each other and can feel each others presence? The potential energy curve for the H-Br molecule is shown in Figure 1. As the two atoms approach each other notice that the potential energy drops. If we recall that energy must be conserved, what must happen to the kinetic energy? The two atoms must attract each other and accelerate toward each other, thereby increasing their kinetic energy. The change in kinetic energy is illustrated by the dotted line in the figure. At some point they will "collide" as indicated by the part of the potential energy curve that rises steeply at small interatomic distances and then the atoms will begin to move away from each other. At this point, we might ask, "Will the molecule of HBr survive the collision"? Unless some energy from this system is lost, say by emission of a photon of light or collision by a third body to remove some energy, these are two ships passing in the night. The kinetic energy resulting from the coulombic attraction of the two atoms will exactly equal the drop in potential energy and the two atoms will
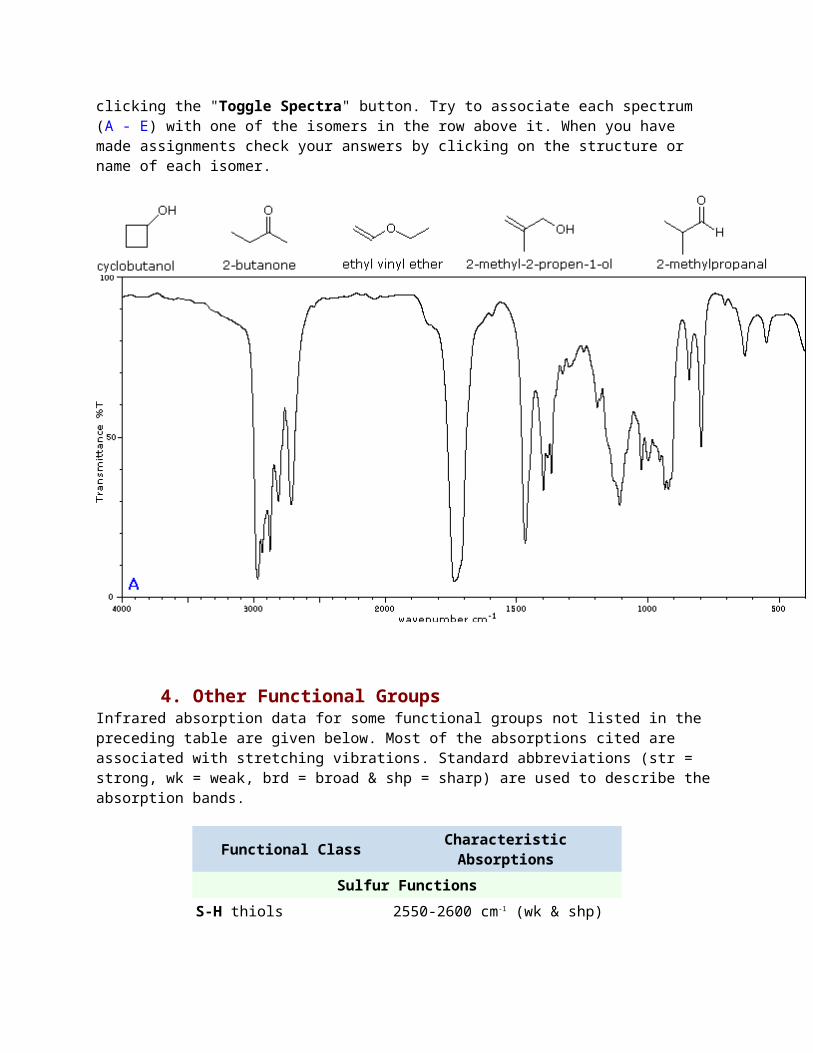
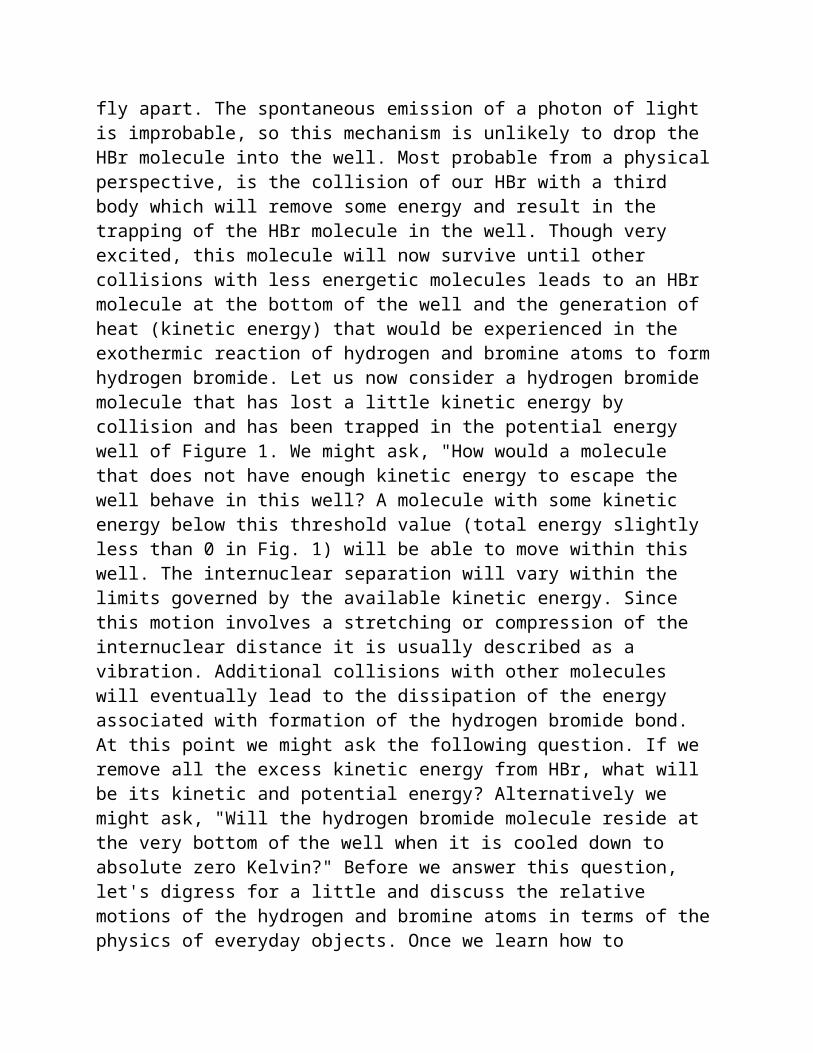
Figure 1. The potential (solid line) and kinetic energy (dotted line) of HBr as a function of the separation of the two nuclei. The kinetic energy at every point illustrated by the dotted line is equal to the potential energy plus the small amount of kinetic energy associated with initial motion of the two nuclei when separated at large distances.
fly apart. The spontaneous emission of a photon of light is improbable, so this mechanism is unlikely to drop the HBr molecule into the well. Most probable from a
physical perspective, is the collision of our HBr with a third body which will remove some energy and result in the trapping of the HBr molecule in the well. Though very excited, this molecule will now survive until other collisions with less energetic molecules leads to an HBr molecule at the bottom of the well and the generation of heat (kinetic energy) that would be experienced in the exothermic reaction of hydrogen and bromine atoms to form hydrogen bromide. Let us now consider a hydrogen bromide molecule that has lost a little kinetic energy by collision and has been trapped in the potential energy well of Figure 1. We might ask, "How would a molecule that does not have enough kinetic energy to escape the well behave in this well? A molecule with some kinetic energy below this threshold value (total energy slightly less than 0 in Fig. 1) will be able to move within this well. The internuclear separation will vary within the limits governed by the available kinetic energy. Since this motion involves a stretching or compression of the internuclear distance it is usually described as a vibration. Additional collisions with other molecules will eventually lead to the dissipation of the energy associated with formation of the hydrogen bromide bond. At this point we might ask the following question. If we remove all the excess kinetic energy from HBr, what will be its kinetic and potential energy? Alternatively we might ask, "Will the hydrogen bromide molecule reside at the very bottom of the well when it is cooled down to absolute zero Kelvin?" Before we answer this question, let's digress for a little and discuss the relative motions of the hydrogen and bromine atoms in terms of the physics of everyday objects. Once we learn how to describe the classical behavior of two objects trapped in a potential energy well, we will return to the question we have just posed.
One model we can use to describe our hydrogen bromide molecule is to consider our HBr molecule to be made up of balls of uneven mass connected to each other by means of a spring. Physicists found many years ago some interesting properties of such a system which they referred to as a harmonic oscillator. Such a system repeatedly interconverts potential and kinetic energy, depending on whether the spring is exerting a force on the balls or the momentum of the balls is causing the spring to be stretched or compressed. The potential energy of this system (PE) is given by the parabola,
PE = k(x-xo)2 1
where x-xo is the displacement of the balls from their equilibrium condition when the system is at rest and k is a measure of the stiffness of the spring. While this simple equation does not apply to molecules, please notice how similar the potential energy surface of the parabola (Figure 3) is to the bottom of the surface of Figure 1. The constant k is used to describe chemical bonds and is referred to as the force constant. As you might imagine, it is a measure of the stiffness of the chemical bond.
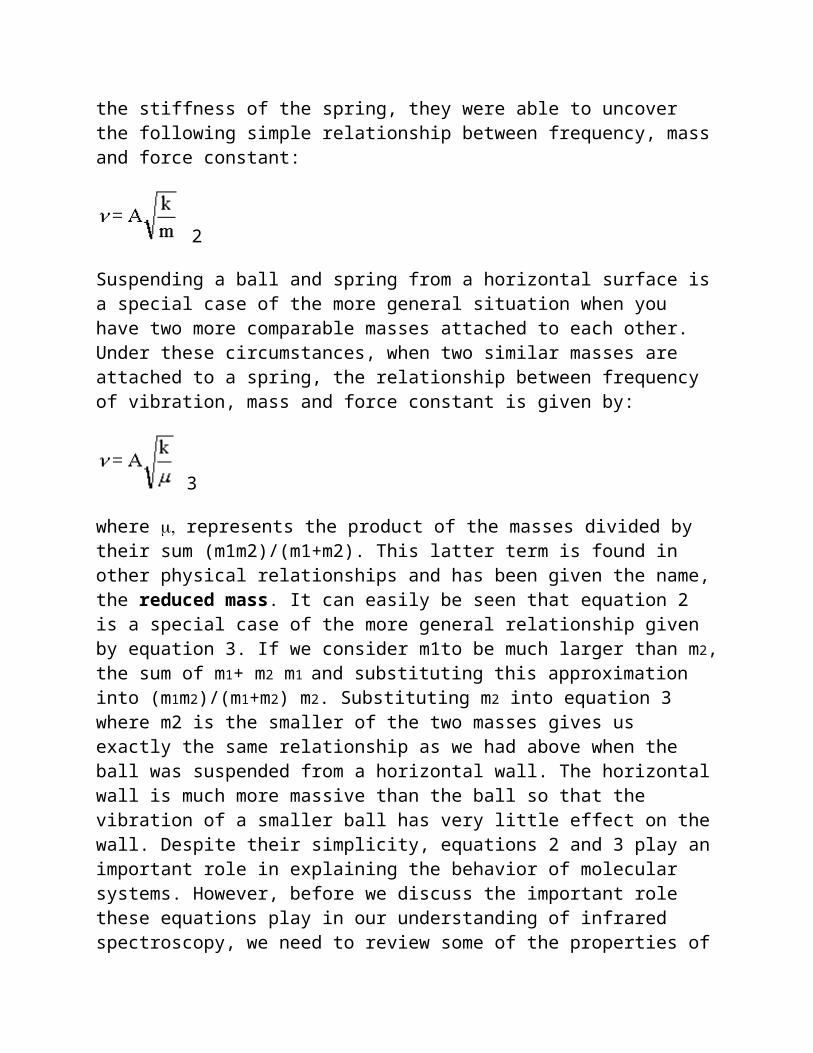
Several other relationships were observed that do carry over in describing molecular systems. For example, they found that when a ball was suspended on a spring from a horizontal wall, the frequency of vibration or oscillation, depended only on the mass of the ball and the stiffness of the spring. The term A is a constant of the proportionality. By varying the mass of the ball and the stiffness of the spring, they were able to uncover the following simple relationship between frequency, mass and force constant:
2
Suspending a ball and spring from a horizontal surface is a special case of the more general situation when you have two more comparable masses attached to each other. Under these circumstances, when two similar masses are attached to a spring, the relationship between frequency of vibration, mass and force constant is given by:
3
where represents the product of the masses divided by their sum (m1m2)/(m1+m2). This latter term is found in other physical relationships and has been given the name, the reduced mass. It can easily be seen that equation 2 is a special case of the more general relationship given by equation 3. If we consider m1to be much larger than m2, the sum of m1+ m2 m1 and substituting this approximation into (m1m2)/(m1+m2) m2. Substituting m2 into equation 3 where m2 is the smaller of the two masses gives us exactly the same relationship as we had above when the ball was suspended from a horizontal wall. The horizontal wall is much more massive than the ball so that the vibration of a smaller ball has very little effect on the wall. Despite their simplicity, equations 2 and 3 play an important role in explaining the behavior of molecular systems. However, before we discuss the important role these equations play in our understanding of infrared spectroscopy, we need to review some of the properties of electromagnetic radiation, particularly radiation in the infrared range.
The electromagnetic spectrum is summarized in Figure 2. On the extreme right we find radiowaves and scan from right to left we encounter terms which have become familiar to us; microwave, infrared, visible ultraviolet and X-rays. All of these forms of electromagnetic radiation
Wavenumbers, cm-1
1010 108 106 2x10⁵ 1x10⁵ 4000 650 12 5 x10⁻² 10-3 10-6
Gamma
RaysX-Rays Ultraviolet
Visible
Light
Near
IR
Infra red
Far
Infrared
Micro
wave
TV
WavesRadio
10-6 10-4 10-2 5x10⁻² 10-1 2.5 15.4 830 4x10⁵ 107 1010
Wavelength (microns)
Figure 2. The electromagnetic spectrum.
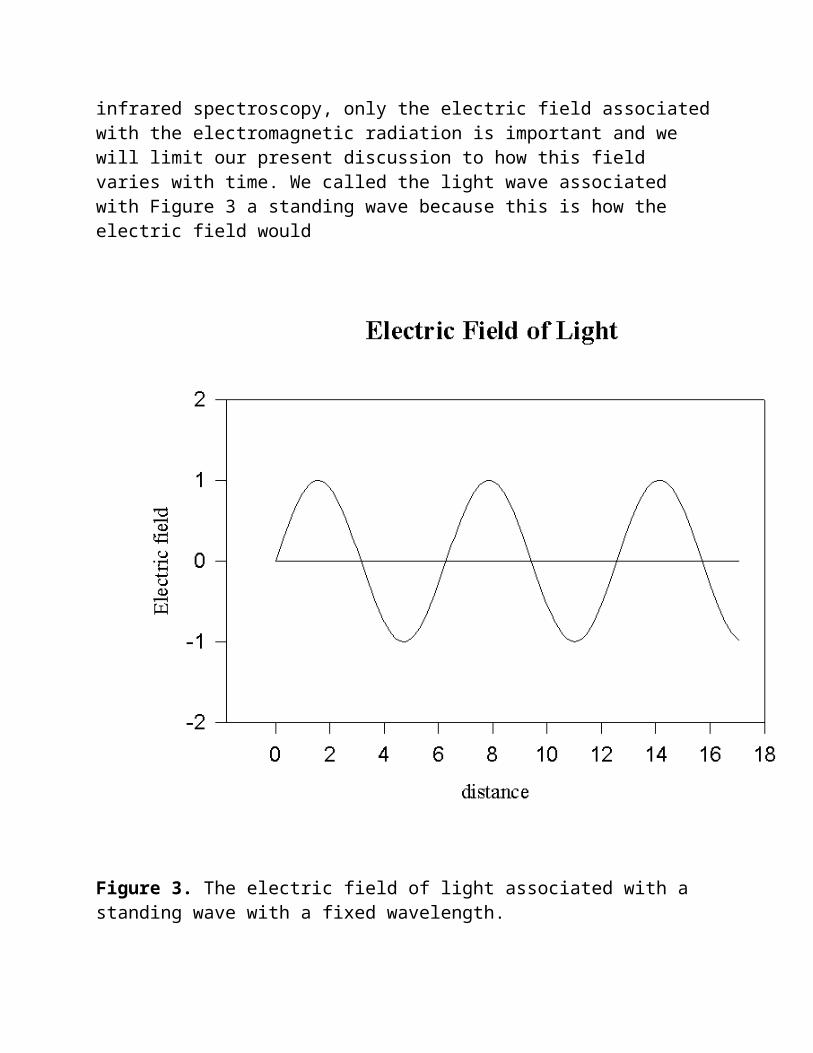
are related to each other in a simple and obvious way. First let us discuss why we refer to these different forms of light as electromagnetic radiation. Simply stated, all these forms of radiation have an electric and magnetic field associated with them that varies as shown for the standing wave in Figure 3. Only the electric field is shown in this figure. If we were to include the magnetic field it would look exactly as the electric field but would be rotated 90 ° out of the plane of the paper and would oscillate above and below the plane of the paper like a sin or cos wave. In
infrared spectroscopy, only the electric field associated with the electromagnetic radiation is important and we will limit our present discussion to how this field varies with time. We called the light wave associated with Figure 3 a standing wave because this is how the electric field would
Figure 3. The electric field of light associated with a standing wave with a fixed wavelength.
vary if we took a picture of the wave. One of the properties of all electromagnetic radiation is that it travels in a vacuum at the speed of 3 x 1010 cm/sec. Therefore, if we were to turn this standing wave "on" we would observe this oscillating field rapidly passing us by. If we examine the electric field (or the magnetic field which is not shown), we observe that the field is repetitive, varying as a cos or sin wave. The length of the repeat unit along the x axis is called the wavelength, , and it is this property which varies continuously from 106 cm (1010 microns) for radio waves down to 10-13 cm (10-6 microns) for cosmic radiation. A unit of length that is frequently used in infrared spectroscopy is the micron. A micron is equivalent to 10-4 cm. If we
were to "stand on the corner and watch all the wavelengths go by", since all electromagnetic radiation would be traveling at 3 x 1010 cm/sec, the frequency, , at which the shorter wavelengths would have to pass by would have to increase in order to keep up with the longer wavelengths. This relationship can be described in the following mathematical equation:
= c; (c = 3 x 1010 cm/sec). 4
The frequency of the light times the wavelength of the light must equal the speed at which the light is traveling.
In addition to having wave properties such as the ones we have been discussing, electromagnetic radiation also has properties we would normally attribute to particles. These "particle like" properties are often referred to as characteristics of photons. We can discuss the wave properties of photons by referring to the wavelength (eqn. 4) and frequency associated with a photon. The energy of a single photon is a measure of a property we would normally associate with a particle. The relationship which determines the energy associated with a single photon of light, E, and the total energy incident on a surface by monochromatic light, ET, is given by:
E = h (or equivalently, E = h c/ from equation 4
ET = n h 6
where h is Planck's constant and is numerically equal to 6.6 x 10⁻²⁷ erg s and n is the number of photons. Equations 4 and 5 tell us that photons with short wavelengths, in addition to having higher frequencies associated with them, also carry more punch! The energy associated with a photon of light is directly proportional to its frequency.
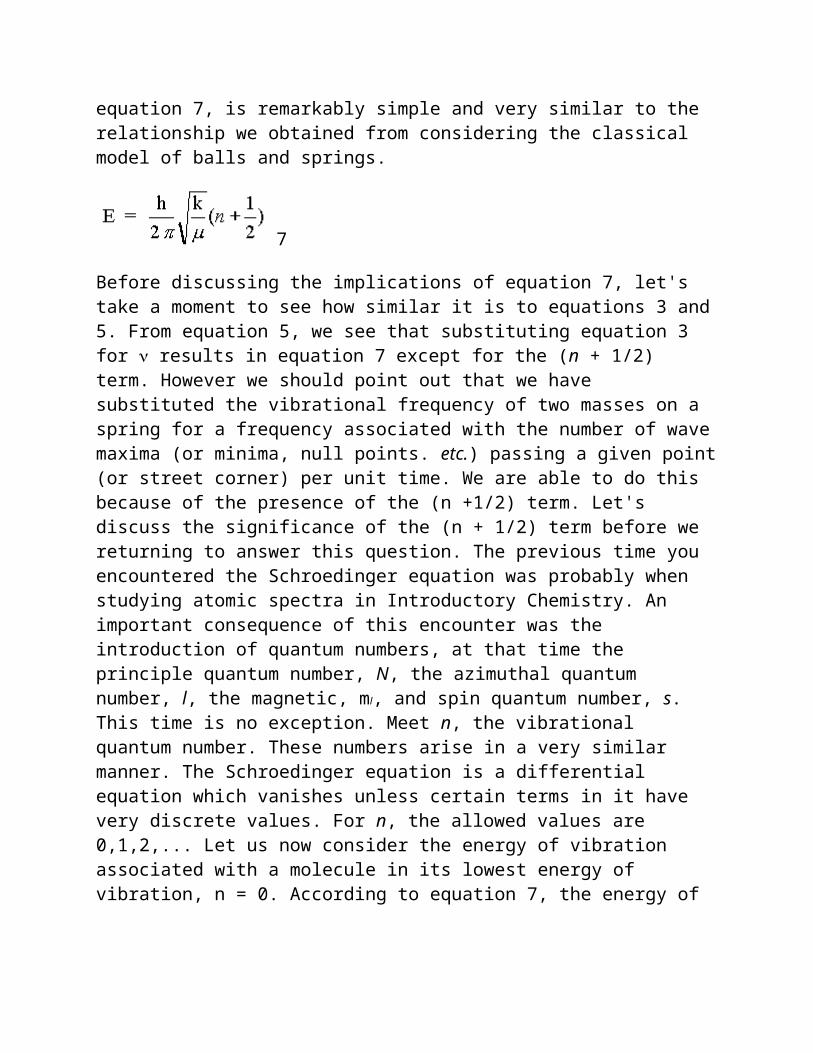
At this point we are ready to return to a discussion of how infrared radiation interacts with molecules. Following our discussion of balls and springs, you have probably figured that infrared spectroscopy deals with the vibration of molecules. Actually, both rotation and vibration of molecules is involved in the absorption of infrared radiation, but since molecular rotation is not usually resolved in most infrared spectra of large organic molecules, we will ignore this additional consideration. In order to derive the relationship between vibrational energy and molecular structure, it is necessary to solve the Schoedinger equation for vibrational-rotational interactions. Since solution of this equation is beyond the scope of this treatment, we will simply use the relationship that is derived for a harmonic oscillator from this equation. As you see, the quantum mechanical solution of a harmonic oscillator, equation 7, is remarkably simple and very similar to the relationship we obtained from considering the classical model of balls and springs.
7
Before discussing the implications of equation 7, let's take a moment to see how similar it is to equations 3 and 5. From equation 5, we see that substituting equation 3 for results in equation 7 except for the (n + 1/2) term. However we should point out that we have substituted the vibrational frequency of two masses on a spring for a frequency associated with the number of wave maxima (or minima, null points. etc.) passing a given point (or street corner) per unit time. We are able to do this because of the presence of the (n +1/2) term. Let's discuss the significance of the (n + 1/2) term before we returning to answer this question. The previous time you encountered the Schroedinger equation was probably when studying atomic spectra in Introductory Chemistry. An important consequence of this encounter was the introduction of quantum numbers, at that time the principle quantum number, N, the azimuthal quantum number, l, the magnetic, ml, and spin quantum number, s. This time is no exception. Meet n, the vibrational quantum number. These numbers arise in a very similar manner. The Schroedinger equation is a differential equation which vanishes unless certain terms in it have very discrete values. For n, the allowed values are 0,1,2,... Let us now consider the energy of vibration associated with a molecule in its lowest energy of vibration, n = 0. According to equation 7, the energy of vibration is
given by , when n = 0, the zero point energy. This equation allows us to answer the question posed earlier about what would happen to the vibrational energy of a molecule at absolute zero. According to quantum theory the molecule would continue to vibrate. From the relationship E = hwe can evaluate the
vibrational frequency as ,the same as found by classical physics for balls and springs. This equation states that the vibrational frequency of a given bond in a molecule depends only on the stiffness of the
chemical
Figure 4. The potential energy surface for a HBr molecule illustrating how the vibrational energy levels vary in energy with increasing vibrational quantum number.
bond and the masses that are attached to that bond. Similarly, according to equation 7, once the structure of a molecule is defined, the force constants and reduced mass are
also defined by the structure. This also defines the vibrational frequencies and energy of absorption. Stated in a slightly different manner, a molecule will not absorb vibrational energy in a continuous fashion but will do so only in discrete steps as determined by the parameters in equation 7 and illustrated for the HBr molecule in Figure 4. We have pointed out that the vibrational quantum number can have positive integer values including a value of zero. Upon absorption of vibration energy, this vibrational quantum number can change by +1 unit. At room temperature, most molecules are in the n = 0 state.
Figure 4 illustrates the real vibrational levels for HBr. Notice that equation 7 predicts that the energy level spacings should all be equal. Notice according to Figure 4, the spacings actually converge to a continuum for large values of n. For small values of n, n = 0, 1, 2, equation 7 gives a good approximation of the vibrational energy levels for HBr. Equation 7 was derived from the approximation that the potential energy surface is like a parabola. Near the minimum of this surface, around the zero point energy, this is a good approximation. As you go up from the minimum, the resemblance decreases and the assumptions made in solving the Schroedinger equation no longer are valid.
Let us now return and question the wisdom of substituting the vibrational frequency of a molecule for the frequency of electromagnetic radiation in equation 5. I hope at this point of the discussion this does not seem so absurd. If the vibrational frequency of the molecule, as determined by the force constant and reduced mass, equals the frequency of the electromagnetic radiation, then this substitution makes good sense. In fact, this gives us a mechanism by which we can envision why a molecule will absorb only distinct frequencies of electromagnetic radiation. It is known that symmetrical diatomic molecules like nitrogen, oxygen and hydrogen, do not absorb infrared radiation, even though their vibrational frequencies are in the infrared region. These homonuclear diatomic molecules have no permanent dipole moment and lack a mechanism by which they can interact with the electric field of the light. Molecules like HBr and HCl which have a permanent dipole, resulting from an unequal sharing of the bonding electrons, have a dipole which oscillates as the bond distance between the atoms oscillate. As the frequency of the electric field of the infrared radiation approaches the frequency of the oscillating bond dipole and the two oscillate at the same frequency and phase, the chemical bond can absorb the infrared photon and increase its vibrational quantum number by +1. This is illustrated in Figure 5. Of course, some HBr molecules may not be correctly oriented toward the light to interact and these molecules will not absorb light. Other factors will also influence the intensity and shape of the absorption. However, when the frequency of the electromagnetic radiation equals the vibrational frequency of a molecule, absorption
of light does occur and this leads to an infrared spectrum that is characteristic of the structure of a molecule.
Up to now we have discussed molecules changing their vibrational quantum number by +1. A change of -1 is also equally possible under the influence of infrared radiation. This would lead to emission of infrared radiation. The reason why we have not discussed this possibility is that most molecules at room temperature are in the ground vibrational level (n=0) and cannot go any lower. If we could get a lot of molecules, let's say with n = 1, use of infrared could be used to stimulate emission. This is how an infrared laser works.
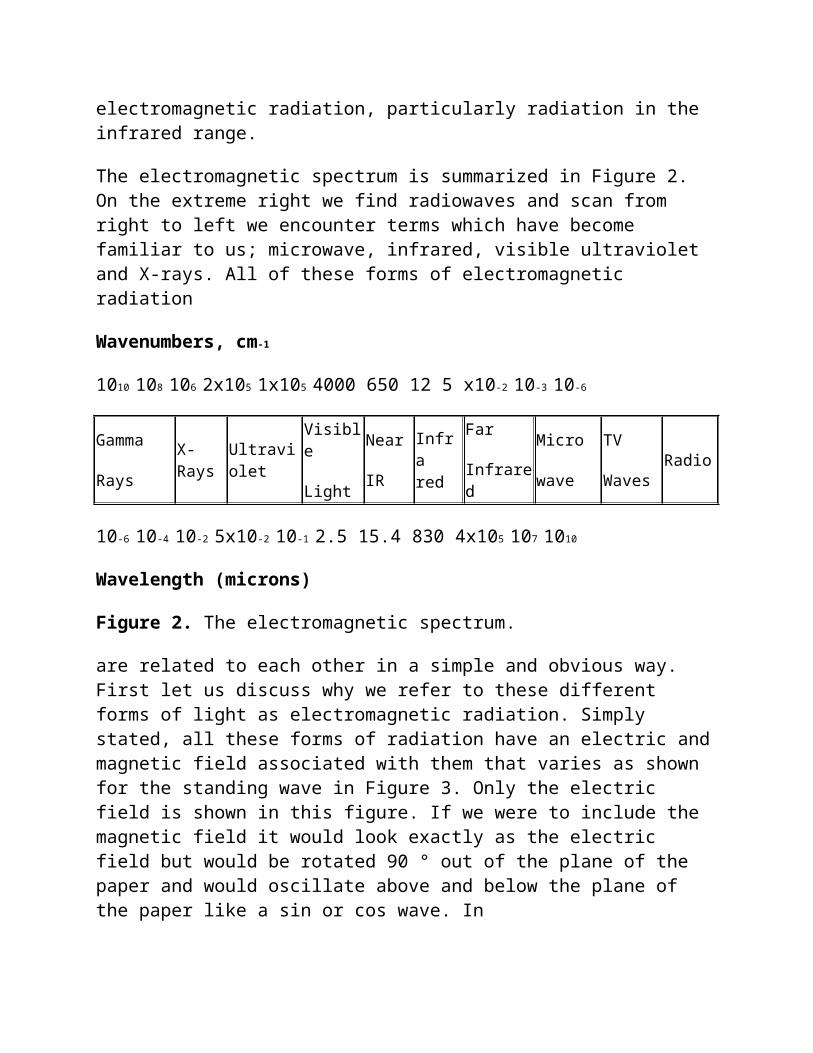
Figure 5. An HBr molecule interacting with electromagnetic radiation. In order for this interaction to occur successfully, the frequency of the light must equal the natural vibrational frequency of the HBr and the electric field must be properly orientated.
We have previously discussed the infrared region of the electromagnetic spectrum in terms of the wavelength of the light that is involved, 2.5-15 ((4000-650 cm-1) (Figure 3). According to equation 4, we can also express this region of the electromagnetic spectrum in terms of the frequency of the light. There is an advantage to discussing the absorption of infrared radiation in frequency units. According to equation 5, energy is directly proportional to frequency. The energy associated with an absorption occurring at twice the frequency of another can be said to require twice the energy. Occasionally, weak bands occur at twice the frequency of more intense bands. These are called overtones and they result when the vibrational quantum number changes by +2. While these transitions are weak and are theoretically forbidden (i.e. they occur with an intensity of less than 5 % of the same transition that involves a change of +1 in the vibrational quantum number) they are easy to identify when units of frequency are used. Sometimes absorption bands involving a combination of frequencies occur. There is no physical significance to adding together wavelengths - there is a physical significance to the addition of frequencies since they are directly proportional to energy. To convert wavelength to frequency according to equation 4, we need to multiply the speed of light by the reciprocal of wavelength. Since the speed of light is a universal constant, the curious convention of simply using the reciprocal of wavelength has evolved. Thus a peak at 5 would be expressed as 1/(5x10-4 cm) or 2000 cm-1. You will note that 2000 cm-1 is not a true frequency. A true frequency would have units of cycles/sec. To convert 2000 cm-1 to a true frequency one would need to multiply by the speed of light (cm/sec). However, 2000 cm-1 is proportional to frequency and this is how frequency units in infrared spectroscopy are expressed. What would be the frequency of light with a wavelength of 10
Analysis of IR Spectra
At this point we are ready to leave diatomic molecules and start talking about complex organic molecules. Before doing so, it should be pointed out that the discussion that follows is an oversimplification of the true vibrational behavior of molecules. Many vibrational motions of molecules are motions that involve the entire molecule. Analysis of such motions can be very difficult if you are dealing with substances of unknown structure. Fortunately, the infrared spectrum can be divided into two regions, one called the functional group region and the other the fingerprint region. The functional group region is generally considered to range from 4000 to approximately 1500 cm-1 and all frequencies below 1500 cm-1 are considered
characteristic of the fingerprint region. The fingerprint region involves molecular vibrations, usually bending motions, that are characteristic of the entire molecule or large fragments of the molecule. Hence the origin of the term. Used together, both regions are very useful for confirming the identity of a chemical substance. This is generally accomplished by a comparison of the spectrum of an authentic sample. As you become more proficient in analyzing infrared spectra, you may begin to assign bands in this region. However, if you are just beginning to interpret spectra of organic molecules, it is best to focus on identifying the characteristic features in the functional group region. The functional group region tends to include motions, generally stretching vibrations, that are more localized and characteristic of the typical functional groups found in organic molecules. While these bands are not very useful in confirming identity, they do provide some very useful information about the nature of the components that make up the molecule. Perhaps most importantly, the frequency of these bands are reliable and their presence or absence can be used confidently by both the novice and expert interpreter of infrared spectra. The discussion which follows focuses primarily on the functional group region of the spectrum. Some functional groups are discussed in more detail than others. You will find that all this information is summarized in Table 1 which should prove useful to you when you try to interpret an unknown spectrum. Finally, you should bear in mind that although we have developed a model that can help us understand the fundamental processes taking place in infrared spectroscopy, interpretation of spectra is to a large extent an empirical science. Information about the nature of a compound can be extracted not only from the frequencies that are present but also by peak shape and intensity. It is very difficult to convey this information in Table form. Only by examining real spectra will you develop the expertise to accurately interpret the information contained within. Be sure to examine the spectra contained in this handout carefully. Whenever you interpret a spectrum and extract structural information, check your assignments by examining the spectrum of a known substance that has similar structural features.
Table 1. A summary of the principle infrared bands and their assignments.
R is an aliphatic group.
Functional
GroupType
Frequencies
cm-1
Peak
Intensity
Examples
Figure No.C-H sp3 hybridized R3C-H 2850-3000 M(sh) 6, 18, 22
sp2 hybridized =CR-H 3000-3250 M(sh) 7, 13, 42sp hybridized C-H 3300 M-S(sh) 13
aldehyde C-H H-(C=O)R 2750, 2850 M(sh) 14, 15N-H primary amine, amide RN-H2, RCON-H2 3300, 3340 S,S(br) 18, 19
secondary amine, amide
RNR-H, RCON-HR 3300-3500 S(br) 20, 21
tertiary amine, amide RN(R3), RCONR2 none 22, 23O-H alcohols, phenols free O-H 3620-3580 W(sh) 17, 24, 25
hydrogen bonded 3600-3650 S(br) 24, 25, 28
carboxylic acids R(C=O)O-H 3500-2400 S(br) 26, 27, 29, 30
CN nitriles RCN 2280-2200 S(sh) 31CC acetylenes R-CC-R 2260-2180 W(sh) 32
R-CC-H 2160-2100 M(sh) 13C=O aldehydes R(C=O)H 1740-1720 S(sh) 14
ketones R(C=O)R 1730-1710 S(sh) 35esters R(CO2)R 1750-1735 S(sh) 33, 34anhydrides R(CO2CO)R 1820, 1750 S, S(sh) 36carboxylates R(CO2)H 1600, 1400 S,S(sh) 42
C=C olefins R2C=CR2 1680-1640 W(sh) 10, 39, 40R2C=CH2 1600-1675 M(sh) 9, 35R2C=C(OR)R 1600-1630 S(sh) 41
-NO2 nitro groups RNO2 1550, 1370 S,S(sh) 28
Factors Influencing the Location and Number of Peaks
Before beginning a detailed analysis of the various peaks observed in the functional group region, it might be useful to mentioned some of the factors that can influence the location and number of peaks we observe in infrared spectroscopy. Theoretically, the number of fundamental vibrations or normal modes available to a polyatomic molecule made up of N atoms is given by 3N-5 for a totally linear molecule and 3N-6 for all others. By a normal mode or fundamental vibration, we mean the simple independent bending or stretching motions of two or more atoms, which when combined with all of normal modes associated with the remainder of the molecule will reproduce the complex vibrational dynamics associated with the real molecules. Normal modes are determined by a normal coordinate analysis (which will not be discussed in this presentation). If each of these fundamental vibrations were to be observed, we would expect either 3N-5 or 3N-6 infrared bands. There are some factors which decrease the number of bands observed and others that cause an increase in this number. Let's discuss the latter first.
We have already mentioned overtones, which are absorption of energy caused by a change of 2 rather than 1 in the vibrational quantum number. While overtones are usually forbidden transitions and therefore are weakly absorbing, they do give rise to more bands than expected. Overtones are easily identified by the presence of a strongly absorbing fundamental transition at slightly more than half the frequency of the overtone. On occasion,combination bands are also observed in the infrared. These bands, as their name implies, are absorption bands observed at frequencies such as 1 + 2 or 1 - 2, where 1 and 2 refer to fundamental frequencies. Other combinations of frequencies are possible. The symmetry properties of the fundamentals play a role in determining which combinations are observed. Fortunately, combination bands are seldom observed in the functional group region of most polyatomic molecules and the presence of these bands seldom cause a problem in identification. Another cause of splitting of bands in infrared is due to a phenomena called Fermi Resonance. While a discussion of Fermi Resonance is beyond the scope of this presentation, this splitting can be observed whenever two fundamental motions or a fundamental and combination band have nearly the same energy (i.e. 1 and 22or 1 and 2 + 3). In this case, the two levels split each other. One level increases while the other decreases in energy. In order to observe Fermi Resonance, in addition to the requirement that a near coincidence of energy levels occurs, other symmetry properties of these vibrations must also be satisfied. As a consequence, Fermi Resonance bands are not frequently encountered.
There are also several factors which decrease the number of infrared bands observed. Symmetry is one of the factors that can significantly reduce the number of bands observed in the infrared. If stretching a bond does not cause a change in the dipole moment, the vibration will not be able to interact with the infrared radiation and the vibration will be infrared inactive. Other factors include the near coincidence of peaks that are not resolved by the spectrometer and the fact that only a portion of the infrared spectrum is usually accessed by most commercial infrared spectrometers.
This concludes the general discussion of infrared spectroscopy. At this point we are ready to start discussing some real spectra.
Carbon-Hydrogen Stretching Frequencies
Let's take one more look at equation 7 and consider the carbon-hydrogen stretching frequencies. Since k and mH are the only two variables in this equation, if we assume that all C-H
stretching force constants are similar in magnitude, we would expect the stretching frequencies of all C-H bonds to be similar. This expectation is based on the fact that the mass of a carbon atom and whatever else is attached to the carbon is much larger
the mass of a hydrogen. The reduced mass for vibration of a hydrogen atom would be approximately the mass of the hydrogen atom which is independent of structure. All C-H stretching frequencies are observed at approximately 3000 cm-1, exactly as expected. Fortunately, force constants do vary some with structure in a fairly predictable manner and therefor it is possible to differentiate between different types of C-H bonds. You may recall in your study of organic chemistry, that the C-H bond strength increased as the s character of the C-H bond increased. Some typical values are given below in Table 2 for various hydridization states of carbon. Bond strength and bond stiffness measure different properties. Bond strength measures the depth of the potential energy well associated with a C-H. Bond stiffness is a measure of how much energy it takes to compress or stretch a bond. While these are different properties, the stiffer bond is usually associated with a deeper potential energy surface. You will note in Table 2 that increasing the bond strength also increases the C-H bond stretching frequency.
Table 2. Carbon Hydrogen Bond Strengths as a Function of Hybridization
Type of C-H bond Bond Strength IR Frequency
kcal/mol cm-1
sp3 hybridized C-H CH3CH2CH2-H 99 <3000sp2 hybridized C-H CH2=CH-H 108 >3000sp hybridized C-H HCC-H 128 3300
C-H sp3 hybridization
Methyl groups, methylene groups and methine hydrogens on sp3 carbon atoms all absorb between 2850 and 3000 cm-1. While it is sometimes possible to differentiate between these types of hydrogen, the beginning student should probably avoid this type of interpretation. It should be
pointed out however, that molecules that have local symmetry, will usually show symmetric and asymmetric stretching frequencies. Take, for example, a CH2 group. It is not possible to isolate an individual frequency for each hydrogen. These two hydrogens will couple and will show two stretching frequencies, a symmetric stretching frequency in which stretching and compression of both hydrogens occurs simultaneously, and an asymmetric stretching frequency in which stretching of one hydrogen is accompanied by compression of the other. While these two motions will occur at different frequencies, both will be found between the 2850-3000 cm-
1 envelope. Similarly for a CH3 group, symmetric and asymmetric vibrations are observed. This behavior is found whenever this type of local symmetry is present. We will find other similar examples in the functional groups we will be discussing. Some examples of spectra containing only sp3 hybridization can be found in Figures 5-6, and located at the end of this discussion. These peaks are usually sharp and of medium intensity. Considerable overlap of several of these bands usually results in absorption that is fairly intense and broad in this region.
C-H sp2 hybridization
Hydrogens attached to sp2 carbons absorb at 3000-3250 cm-1. Both aromatic and vinylic carbon hydrogen bonds are found in this region. An example of a molecule that contains only sp2 hybridization can be found in Figure 7. Other examples of molecules that contain sp2 C-H bonds along with other functional groups include Figures 13, 25 and 37. Examples of hydrocarbons that contain both sp2and sp3 hybridization can be found in Figures 8-12. These peaks are usually sharp and of low to medium intensity.
C-H sp hybridization
Hydrogens attached to sp carbons absorb at 3300 cm-1. An example of a spectrum that contains sp hybridization can be found in Figure 13. These peaks are usually sharp and of medium to strong intensity.
C-H aldehydes
Before concluding the discussion of the carbon hydrogen bond, one additional type of C-H stretch can be distinguished, the C-H bond of an aldehyde. The C-H stretching frequency appears as a doublet, at 2750 and 2850 cm-1. Examples of spectra that contain a C-H stretch of an aldehyde can be found in Figures 14 and 15. You may (should) question why the stretching of a single C-H bond in an aldehyde leads to the two bands just described. The splitting of C-H stretching frequency into a doublet in aldehydes is due to the phenomema we called "Fermi Resonance". It is believed that the aldehyde C-H stretch is in Fermi resonance with the first overtone of the C-H bending motion of the aldehyde. The normal frequency of the C-H bending motion of an aldehyde is at 1390 cm-1. As a result of this interaction, one energy level drops to ca. 2750 and the other increases to ca. 2850 cm-1. Only one C-H stretch is observed for aldehydes that have the C-H bending motion of an aldehyde significantly shifted from 1390 cm-1.
C-H exceptions
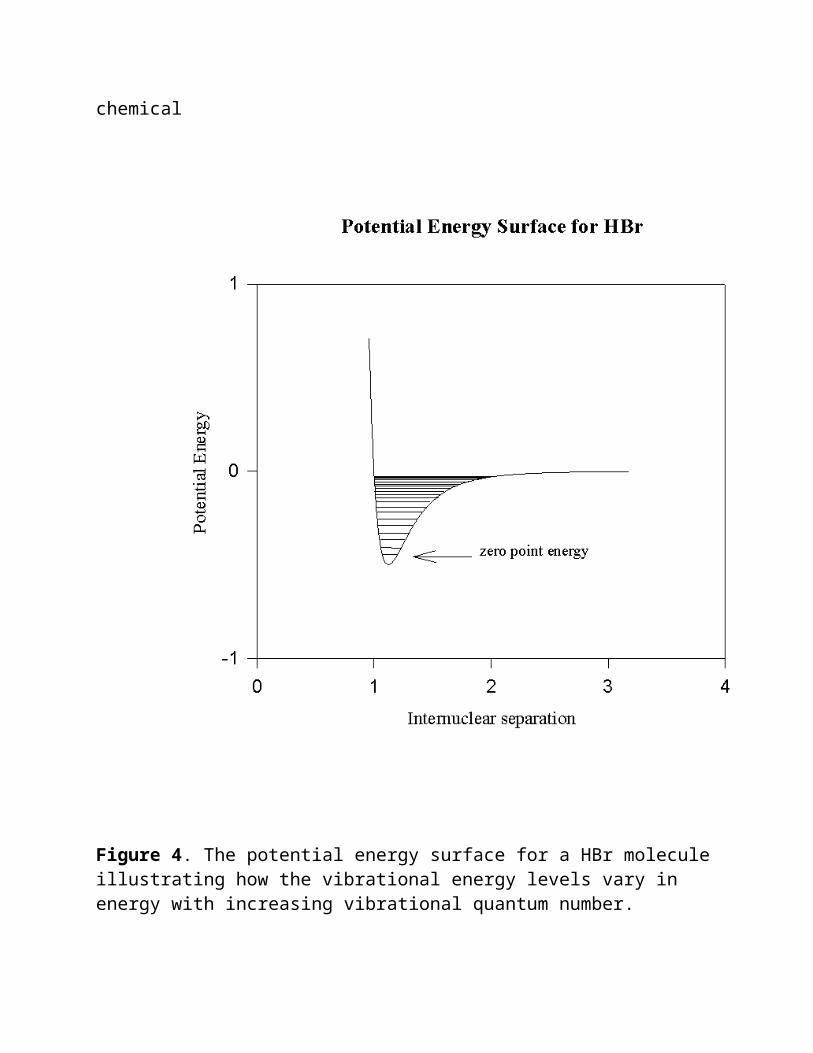
In summary, it is possible to identify the type of hydrogen based on hybridization by examining the infrared spectra in the 3300 to 2750 cm-1 region. Before concluding, we should also mention some exceptions to the rules we just outlined. Cyclopropyl hydrogens which are formally classified as sp3 hybridized actually have more s character than 25 %. Carbon-hydrogen frequencies greater than 3000 cm-1 are observed for these stretching vibrations. Halogen substitution can also affect the C-H stretching frequency. The C-H stretching frequencies of hydrogens attached to a carbon also bearing halogen substitution can also be shifted above 3000 cm-1. This is illustrated in Figure 16. The last exception we will mention is an interesting case in which the force constant is increased because of steric interactions. The infrared spectrum of tri-t-butylcarbinol is given in Figure 17. In this case, the hydrogens are sp3 hybridized but stretching the C-H bonds leads to increased crowding and bumping, and this is manifested by a steeper potential energy surface and an increase in k, the force constant in equation 6.
Nitrogen Hydrogen Stretching Frequencies
Much of what we have discussed regarding C-H stretching frequencies is also applicable here. There are three major differences between the C-H and N-H stretching frequencies. First, the force constant for N-H stretching is stronger, there is a larger dipole moment associated with the N-H bond, and finally, the N-H bond is usually involved in hydrogen bonding. The stronger force constant leads to a higher frequency for absorption. The N-H stretching frequency is usually observed from 3500-3200 cm-1. The larger dipole moment leads to a stronger absorption and the presence of hydrogen bonding has a definite influence on the band shape and frequency position. The presence of hydrogen bonding has two major influences on spectra. First, its presence causes a shift toward lower frequency of all functional groups that are involved in hydrogen bonding and second, the peaks are generally broadened. Keep these two factors in mind as you examine the following spectra, regardless of what atoms and functional groups are involved in the hydrogen bonding.
The N-H stretching frequency is most frequently encountered in amines and amides. The following examples will illustrate the behavior of this functional group in a variety of circumstances.
Primary amines and amides derived from ammonia
The N-H stretching frequency in primary amines and in amides derived from ammonia have the same local symmetry as observed in CH2. Two bands, a symmetric and an asymmetric stretch are observed. It is not possible to assign the symmetric and asymmetric stretches by inspection but their presence at approximately 3300 and 3340 cm-1 are suggestive of a primary amine or amide. These bands are generally broad and
a third peak at frequencies lower than 3300 cm-1, presumably due to hydrogen bonding, is also observed. This is illustrated by the spectra in Figures 18 and 19 for n-butyl amine and benzamide.
Secondary amines and amides
Secondary amines and amides show only one peak in the infrared. This peak is generally in the vicinity of 3300 cm-1. This is illustrated in Figures 20 and 21. Again notice the effect of hydrogen bonding on the broadness of the N-H peak.
Tertiary amines and amides
Tertiary amines and amides from secondary amines have no observable N-H stretching band as is illustrated in Figures 22 and 23.
N-H bending motions
You may recall that we will be ignoring most bending motions because these occur in the fingerprint region of the spectrum. One exception is the N-H bend which occurs at about 1600 cm-1. This band is generally very broad and relatively weak. Since many other important bands occur in this region it is important to note the occurrence of this absorption lest it be mistakenly interpreted as another functional group. Figure 18 illustrates the shape and general intensity of the bending motion. Most other functional groups absorbing in this region are either sharper or more intense.
Hydroxyl Stretch
The hydroxyl stretch is similar to the N-H stretch in that it hydrogen bonds but does so more strongly. As a result it is often broader than the N-H group. In those rare instances when it is not possible to hydrogen bond, the stretch is found as a relative weak to moderate absorption at 3600-3650 cm-1. In tri-t-butylmethanol where steric hindrance prevents hydrogen bonding, a peak at 3600 cm-1 is observed as shown in Figure 17. Similarly for hexanol, phenol, and hexanoic acid, Figures 24, 25, and 26, gas phase and liquid phase spectra illustrate the effect of hydrogen bonding on both the O-H stretch and on the rest of the spectrum. In should be pointed out that, in general, while gas phase spectra are usually very similar, frequencies are generally shifted to slightly higher values in comparison to condensed phase spectra. Gas phase spectra that differ significantly from condensed phase spectra are usually taken as evidence for the presence of some sort of molecular association in the condensed phase.
The hydroxyl group in phenols and alcohols usually is found as a broad peak centered at about 3300 cm-1 in the condensed phase as noted above and in the additional examples of Figures 24, 28, and 29. The O-H of a carboxylic acid, so strongly associated that the O-H absorption in these materials, is often extended to approximately 2500 cm-1. This extended absorption is clearly observed in Figures 26, 27, and 29 and serves to differentiate the O-H stretch of a carboxylic acid from that of an alcohol or phenol. In fact, carboxylic acids associate to form intermolecular hydrogen bonded dimers both in the solid and liquid phases.
The nitrile group
The nitrile group is another reliable functional group that generally is easy to identify. There is a significant dipole moment associated with the CN bond which leads to a significant change when it interacts with infrared radiation usually leading to an intense sharp peak at 2200-2280 cm-1. Very few other groups absorb at this region with this intensity. The spectrum in Figure 31 illustrates the typical behavior of this functional group. If another electronegative atom such as a halogen is attached to the same carbon as the nitrile group, the intensity of this is markedly reduced.
The carbon-carbon triple bond
The CC bond is not considered to be a very reliable functional group. This stems in part by considering that the reduced mass in equation 7 is likely to vary. However it is characterized by a strong force constant and because this stretching frequency falls in a region where very little else absorbs, 2100-2260 cm-1, it can provide useful information. The terminal carbon triple bond (CC-H) is the most reliable and easiest to identify. We have previously discussed the C-H stretching frequency; coupled with a band at 3300 cm-1, the presence of a band at approximately 2100 cm-1 is a strong indication of the -CC-H group. The spectrum in Figure 13 illustrates the presence of this group.
An internal -CC- is more difficult to identify and is often missed. Unless an electronegative atom such as nitrogen or oxygen is directly attached to the sp hybridized carbon, the dipole moment associated with this bond is small; stretching this bond also leads to a very small change. In cases where symmetry is involved, such as in diethyl acetylenedicarboxylate, Figure 32, there is no change in dipole moment and this absorption peak is completely absent. In cases where this peak is observed, it is often weak and difficult to identify with a high degree of certainty.
The carbonyl group
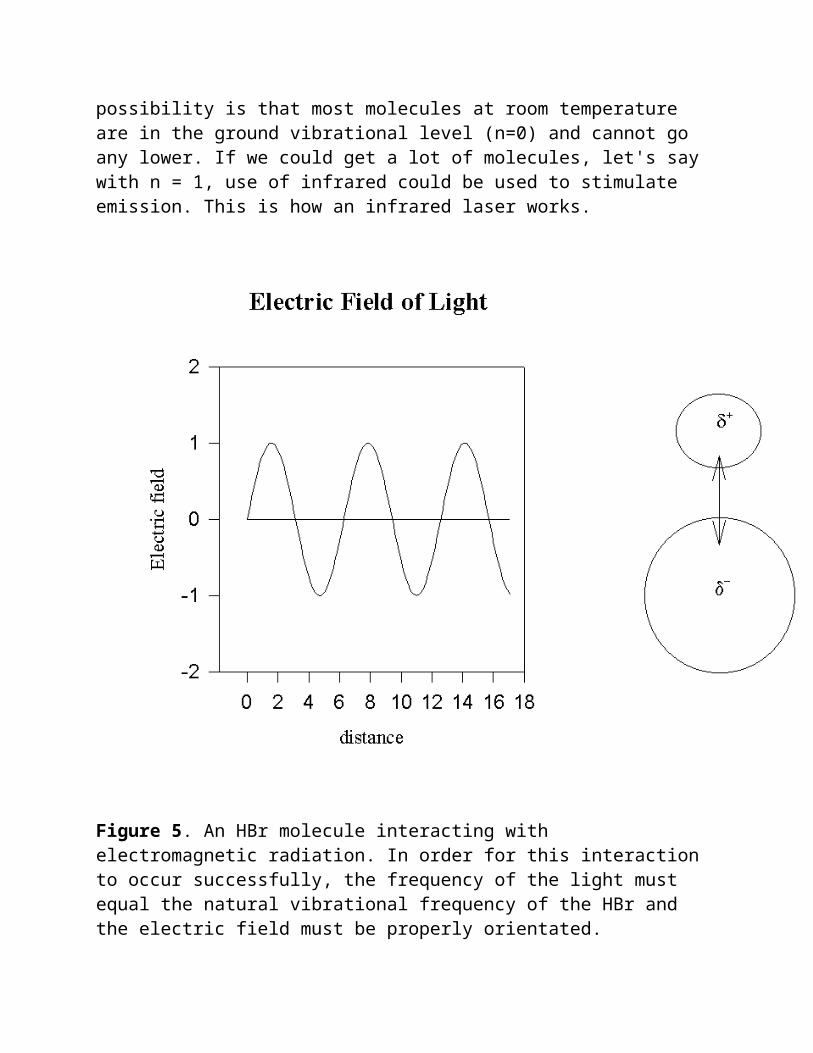
The carbonyl group is probably the most ubiquitous group in organic chemistry. It comes in various disguises. The carbonyl is a polar functional group that frequently is the most intense peak in the spectrum. We will begin by discussing some of the typical acyclic aliphatic molecules that contain a carbonyl group. We will then consider the effect of including a carbonyl as part of a ring and finally we will make some comments of the effect of conjugation on the carbonyl frequency.
Acyclic aliphatic carbonyl groups
Esters, aldehydes, and ketones
Esters, aldehydes, and ketones are frequently encountered examples of molecules exhibiting a C=O stretching frequency. The frequencies, 1735, 1725, 1715 cm-1 respectively, are too close to allow a clear distinction between them. However, aldehydes can be distinguished by examining both the presence of the C-H of an aldehyde (2750, 2850 cm-1) and the presence of a carbonyl group. Examples of an aliphatic aldehyde, ester, and ketone are given in Figures 14, 34, 36, and 35, respectively.
Carboxylic acids, amides and carboxylic acid anhydrides
Carboxylic acids, amides and carboxylic acid anhydrides round out the remaining carbonyl groups frequently found in aliphatic molecules. The carbonyl frequencies of these molecules, 1700-1730 (carboxylic acid), 1640-1670 (amide) and 1800-1830, 1740-1775 cm-1 (anhydride), allow for an easy differentiation when the following factors are also taken into consideration.
A carboxylic acid can easily be distinguished from all the carbonyl containing functional groups by noting that the carbonyl at 1700-1730 cm-1 is strongly hydrogen bonded and broadened as a result. In addition it contains an O-H stretch which shows similar hydrogen bonding as noted above. Spectra which illustrate the effect of hydrogen bonding include Figures 27, and 29.
Amides are distinguished by their characteristic frequency which is the lowest carbonyl frequency observed for an uncharged molecule, 1640-1670 cm-1(Amide I). In addition, amides from ammonia and primary amines exhibit a weaker second band (Amide II) at 1620-1650 cm-1 and 1550 cm-1 respectively, when the spectra are run on the solids. Amides from secondary amines do not have a hydrogen attached at nitrogen and do not show an Amide II band. The Amide I band is mainly attributed to the carbonyl stretch. The Amide II involves several atoms including the N-H bond. We will return to the frequency of the amide carbonyl when we discuss the importance of conjugation and the effect of resonance on carbonyl frequencies. The
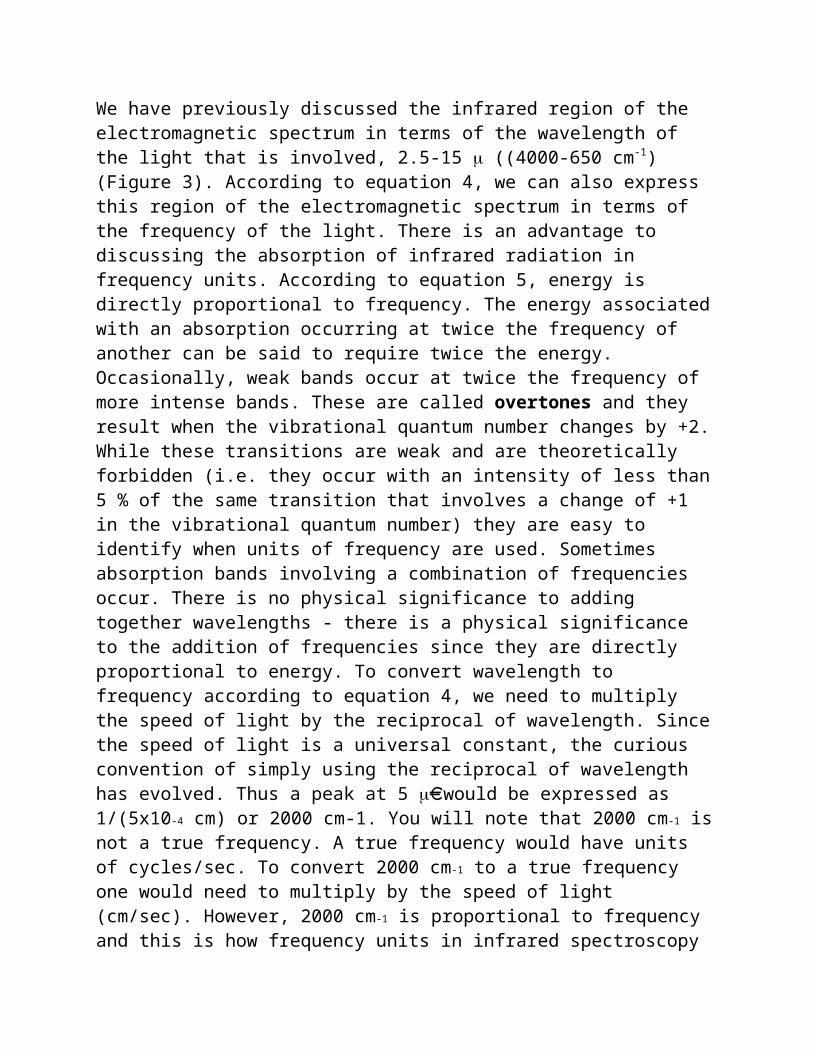
spectra of benzamide, a conjugated amide (Figure 19), and N-methyl acetamide (Figure 21) clearly identify the Amide I and II bands. The spectrum of N,N dimethyl acetamide (Figure 23) illustrates an example of an amide from a secondary amine.
Anhydrides can be distinguished from other simple carbonyl containing compounds in that they contain and exhibit two carbonyl frequencies. However, these frequencies are not characteristic of each carbonyl. Rather they are another example of the effects of local symmetry similar to what we have seen for the CH2 and NH2 groups. The motions involved here encompass the entire anhydride (-(C=O)-O-(O=C-) in a symmetric and asymmetric stretching motion of the two carbonyls. The two carbonyl frequencies often differ in intensity. It is not possible to assign the peaks to the symmetric or asymmetric stretching motion by inspection nor to predict the more intense peak. However, the presence of two carbonyl frequencies and the magnitude of the higher frequency (1800 cm-1) are a good indication of an anhydride. Figure 36 contains a spectrum of an aliphatic anhydride.
Cyclic aliphatic carbonyl containing compounds
The effect on the carbonyl frequency as a result of including a carbonyl group as part of a ring is usually attributed to ring strain. Generally ring strain is believed to be relieved in large rings because of the variety of conformations available. However as the size of the ring gets smaller, this option is not available and a noticeable effect is observed. The effect of increasing ring stain is to increase the carbonyl frequency, independent of whether the carbonyl is a ketone, part of a lactone(cyclic ester), anhydride or lactam (cyclic amide). The carbonyl frequencies for a series of cyclic compounds is summarized in Table 3.
Table 3. The Effect of Ring Strain on the Carbonyl Frequencies of Some Cyclic Molecules
Ring Size ketone: cm-1 lactones: cm-1 lactams: cm-1
3 cyclopropanone: 18004 cyclobutanone: 1775 -propiolactone: 18405 cyclopentanone: 1751 -butyrolactone: 1750 -butyrolactam: 16906 cyclohexanone: 1715 -valerolactone: 1740 -valerolactam: 16687 cycloheptanone: 1702 caprolactone: 1730 caprolactam: 1658
Carbon carbon double bond
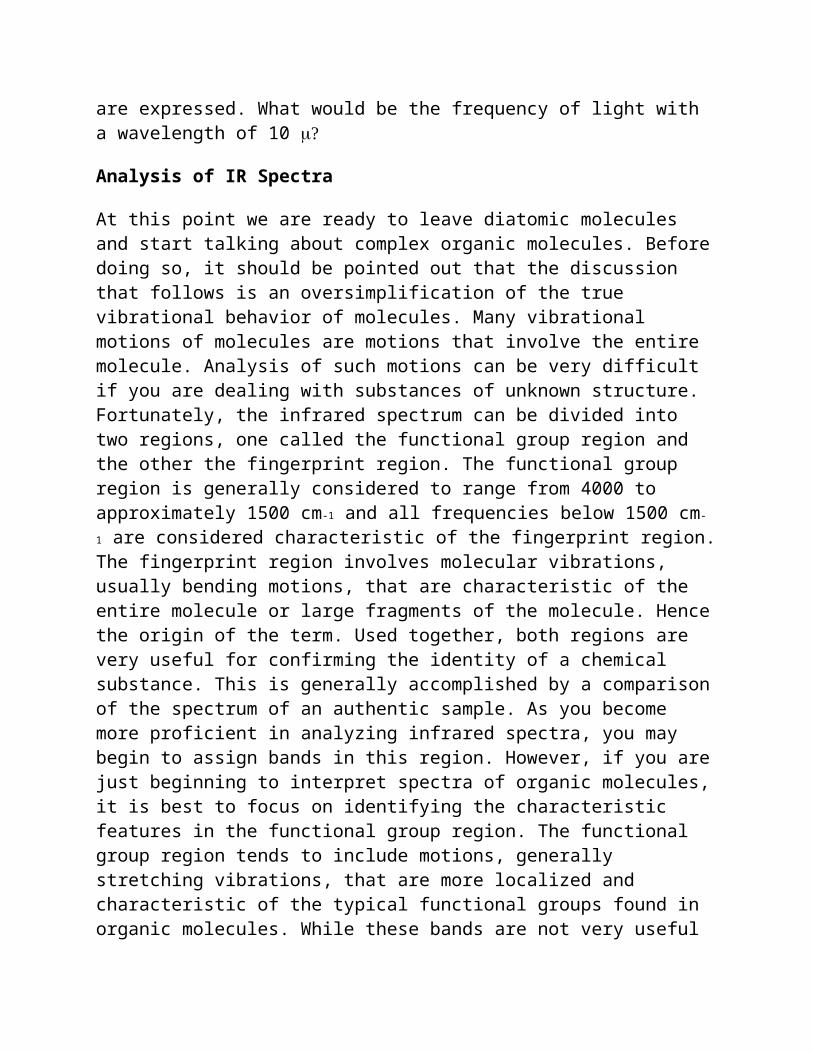
Like the CC bond, the C=C bond stretch is not a very reliable functional group. However, it is also characterized by a strong force constant and because of this and because the effects of conjugation which we will see can enhance the intensity of this stretching frequency, this absorption can provide useful and reliable information.
Terminal C=CH2
In simple systems, the terminal carbon carbon double bond (C=CH2) is the most reliable and easiest to identify since the absorption is of moderate intensity at 1600-1675 cm-1. We have previously discussed the C-H stretching frequency of an sp2 hybridized C-H. The spectrum in Figure 9 illustrates the presence of this group. In addition the terminal C=CH2 is also characterized by a strong band at approximately 900 cm-1. Since this band falls in the fingerprint region, some caution should be exercised in its identification.
Internal C=C
An internal non-conjugated C=C is difficult to identify and can be missed. The dipole moment associated with this bond is small; stretching this bond also leads to a very small change. In cases where symmetry is involved, such as in 4-octene, Figure 10, there is no change in dipole moment and this absorption peak is completely absent. In cases where this peak is observed, it is often weak. In 2,5-dihydrofuran, Figure 39, it is difficult to assign the C=C stretch because of the presence of other weak peaks in the vicinity. The band at approximately 1670 cm-1 may be t