deutsche bank global financial services conference - · pdf filedeutsche bank global financial...
TRANSCRIPT
Deutsche Bank Global Financial Services
Conference
Fredrik Rystedt, Chief Financial Officer / EVP

Disclaimer
2 •
This presentation contains forward-looking statements that reflect management’s current views with respect to certain future events and potential financial performance. Although Nordea believes that the expectations reflected in such forward-looking statements are reasonable, no assurance can be given that such expectations will prove to have been correct. Accordingly, results could differ materially from those set out in the forward-looking statements as a result of various factors.
Important factors that may cause such a difference for Nordea include, but are not limited to: (i) the macroeconomic development, (ii) change in the competitive climate, (iii) change in the regulatory environment and other government actions and (iv) change in interest rate and foreign exchange rate levels.
This presentation does not imply that Nordea has undertaken to revise these forward-looking statements, beyond what is required by applicable law or applicable stock exchange regulations if and when circumstances arise that will lead to changes compared to the date when these statements were provided.

• Business model generates strong financials
• Building the future bank business model

Nordea’s focused and prudent business model
4 •
Well diversified and
balanced model
Relationship banking is key
Very risk focused
Resources efficiently used
on core business
Fully integrated model across
countries and business units
The Nordics and its structure as
the home market
5 •
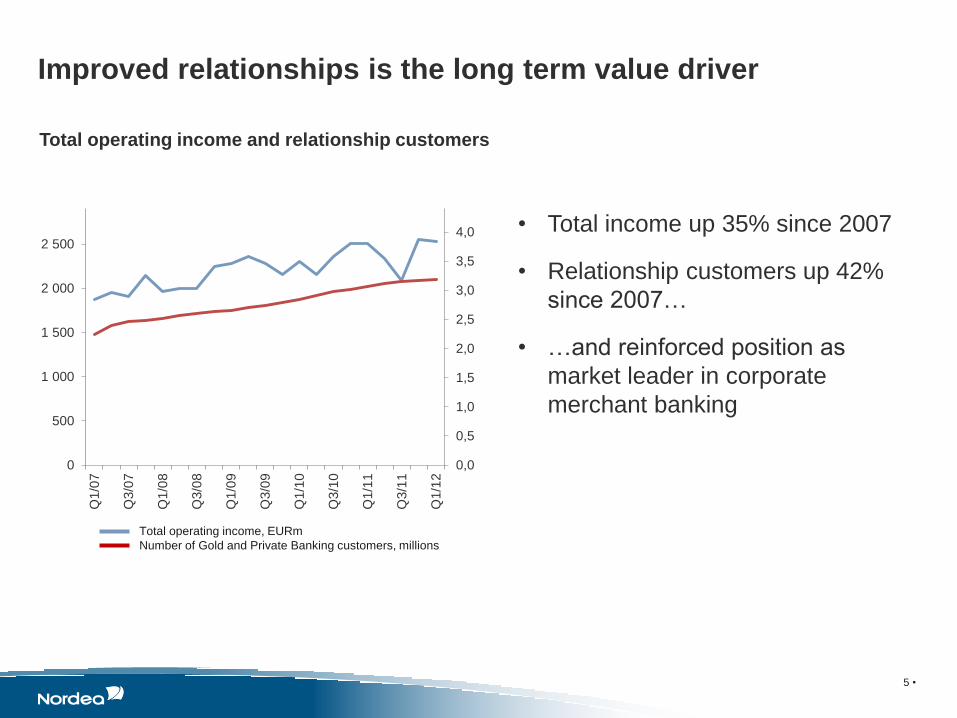
• Total income up 35% since 2007
• Relationship customers up 42%
since 2007…
• …and reinforced position as
market leader in corporate
merchant banking
Improved relationships is the long term value driver
Total operating income and relationship customers
Total operating income, EURm
Number of Gold and Private Banking customers, millions
0,0
0,5
1,0
1,5
2,0
2,5
3,0
3,5
4,0
0
500
1 000
1 500
2 000
2 500
Q1/0
7
Q3/0
7
Q1/0
8
Q3/0
8
Q1/0
9
Q3/0
9
Q1/1
0
Q3/1
0
Q1/1
1
Q3/1
1
Q1/1
2

Customer driven business model
• 95% customer related - Only 5 % from Risk Management
6 •
0
1000
2000
3000
4000
5000
6000
7000
8000
9000
10000
2007 2008 2009 2010 2011
EU
Rm
Nordea Group TOTAL
Retail Banking
Wholesale Banking
Asset Managment + LifeInsurance
Capital Markets riskmanagement result of riskin customer transactions
Group Treasury and GroupFunctions
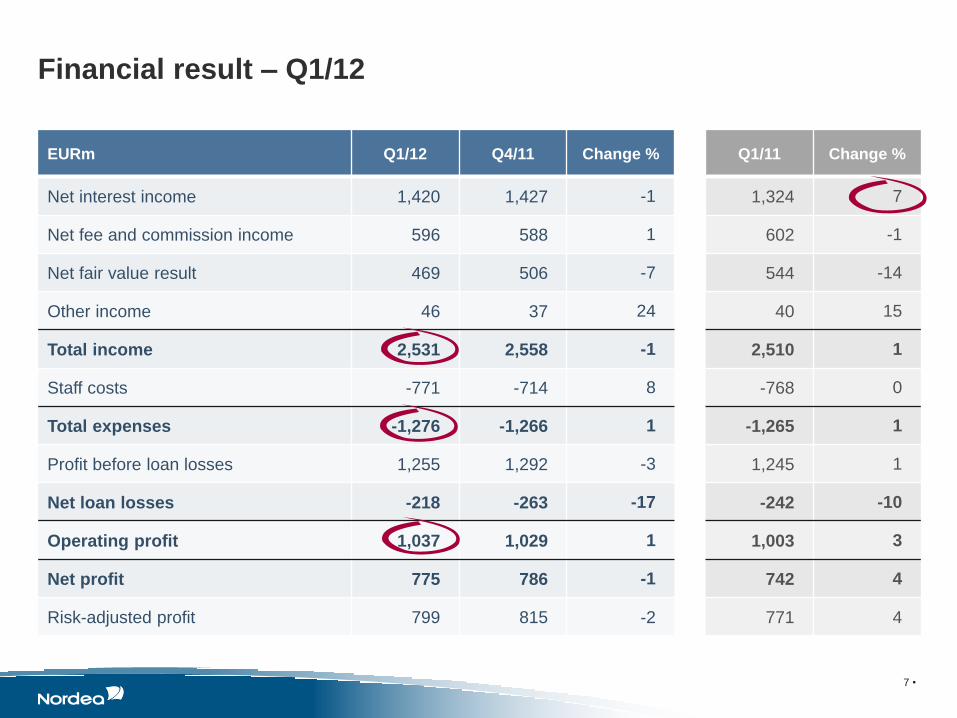
Financial result – Q1/12
7 •
EURm Q1/12 Q4/11 Change % Q1/11 Change %
Net interest income 1,420 1,427 -1 1,324 7
Net fee and commission income 596 588 1 602 -1
Net fair value result 469 506 -7 544 -14
Other income 46 37 24 40 15
Total income 2,531 2,558 -1 2,510 1
Staff costs -771 -714 8 -768 0
Total expenses -1,276 -1,266 1 -1,265 1
Profit before loan losses 1,255 1,292 -3 1,245 1
Net loan losses -218 -263 -17 -242 -10
Operating profit 1,037 1,029 1 1,003 3
Net profit 775 786 -1 742 4
Risk-adjusted profit 799 815 -2 771 4

8 •
0,9
*
Strong business momentum…

9 •
• Nordea will deliver flat costs for a
prolonged period of time
… and expenses under strict control
Total expenses, EURm

High and stable RoE throughout the cycle…
10 •
RoE, adjusted for restructuring costs 2011, percent
Avg. = 19.1
2008 2009 2010 2011
CT1 = 6.8% CT1 = 11.6%
Avg. = 15.3
Avg. = 11.3 Avg. = 11.5
Avg. = 11.1
2012

11 •
… gives strong capital generation…
Core Tier 1 capital, EURm
• Generated capital of EUR 6.9bn
since 2006*
• In addition distributed EUR 6.3bn
to shareholders
• Strong capital generation gives
good flexibility
*Adjusted for rights issue

12 •
… as well as a clear increase in Core Tier 1 ratio
Core Tier 1 capital ratio, % (excl. Hybrids)
• Improved ratio by 150bps since
Q1/10 due to;
• Strong profit generation
• Controlled RWA development
• Lending growth of 17%
• RWA growth of 1%
11,6
Basel 2.5 excluding transition rules

CRD IV suggests that capital requirement for Nordea will be
slightly below 11%
13 •
European Council
Other EU country Domestic
3% from
2013, 5%
from 2015 Max 3 %
3% from
2013, 5%
from 2015
5 %
3 %
5 %
COM
approval
above
5%
INTERPRETATION
If a MS
wants to
set a 3%
buffer they
have to do
it in all EU
countries
COM
approval
above
5%
3rd country

• Business model generates strong financials
• Building the future bank business model

New Normal is execution of a “Focused relationship strategy”
5x
2.5x
4x Segments
Customers
Units
Christian Clausen
President and Group
CEO
Ari Kaperi
Group Risk
Management
Group CRO
Casper von
Koskull
Wholesale
Banking
Peter Nyegaard
(COO)
Michael
Rasmussen
Retail Banking
Torsten H.
Jørgensen
Group Operations
& Other Lines of
Business
Fredrik Rystedt
Group Corporate
Centre,
Group CFO
Gunn Wærsted
Wealth
Management
1. Disciplined ROE focus
2. Cost efficiency
3. Capital efficiency
4. Liquidity efficiency
Themes
15 •

Cost efficiency according to plan
16 •
• FTE’s are down by approx.1,600
(4.6%) since mid-2011
• EUR 120m in cost savings
• 6% staff reduction by end 2012
• Shift in Poland to full relationship
banking approach
• FTE’s reduced by up to 400
Total Group full-time equivalents

17 •
Capital efficiency has clearly strengthened our Core Tier 1
RWA development, EURbn
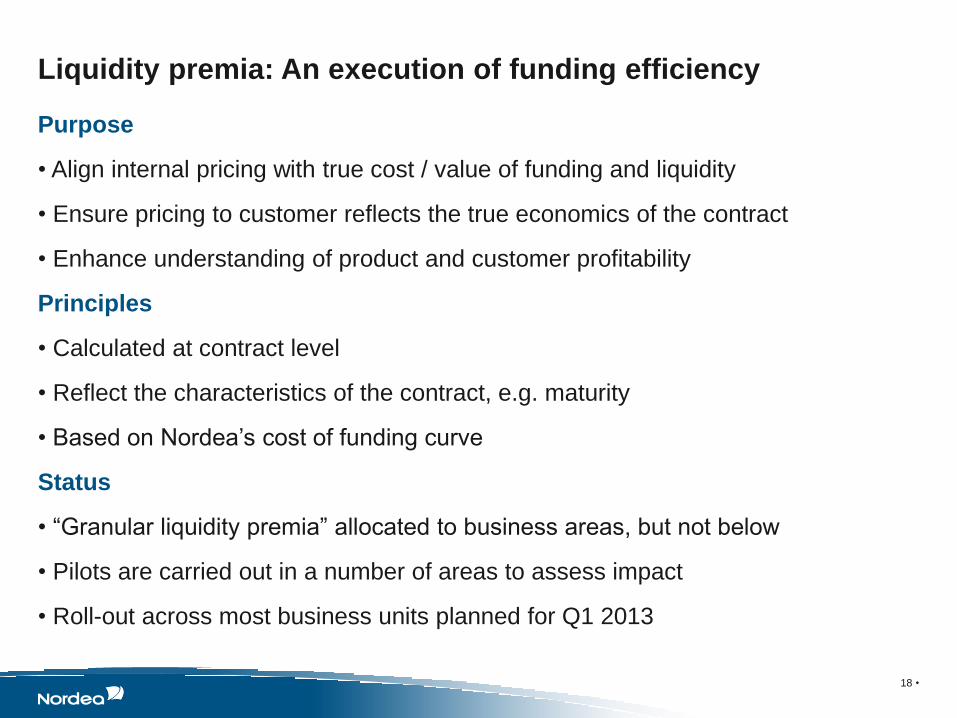
Liquidity premia: An execution of funding efficiency
Purpose
• Align internal pricing with true cost / value of funding and liquidity
• Ensure pricing to customer reflects the true economics of the contract
• Enhance understanding of product and customer profitability
Principles
• Calculated at contract level
• Reflect the characteristics of the contract, e.g. maturity
• Based on Nordea’s cost of funding curve
Status
• “Granular liquidity premia” allocated to business areas, but not below
• Pilots are carried out in a number of areas to assess impact
• Roll-out across most business units planned for Q1 2013
18 •

Customer behaviour supports our distribution journey
Number of manual transactions, million
Number of netbank log-ins, million
Number of unique mobile banking users, thousands
19 • * Semi-annualised
Retail Banking

Transforming the branch network
20 •
Nordic development, manual cash location and share of advisors in branch network staff
Focused on
relationship
customers
78 branches
focused on
Corporate
558 Corporate and
Advisory branches
200 Service
branches
995 Full-service
branches
388 Community
branches
Focused on
daily service
and cash
All Customers
All Services
Nordic branch
network, end 2009
Nordic branch
network 2012
7%
Share of all branches
93%
49%
17%
34%
40%
50%
60%
70%
80%
0
200
400
600
800
1 000
2010 2011 2012 2013 2014
Locations Manual cash
locations
Adviser share
of total staff (rhs)
Retail Banking

21 •
Attracting new customers Net increase of relationship customers, thousands, accumulated
Retail Banking

Taking Wholesale Banking to the next level
• Adapting to the new regulatory framework – what and how we do business with
our customers
‒ Pricing discipline
‒ Cost management
‒ RWA and funding efficiency
• Alignment of the Wholesale Banking value chain
• Focus on core customer relationships, wallet share and fee-based income
22 •
Return
Income
Cost
RWA
Strategy
Wholesale Banking

Relationship strategy is key
Nordic leader in quality and volume
-125 -100 -75 -50 -25 0 25 50 75 100 125
Quality of delivery, index
Imp
ort
an
t re
lati
on
sh
ips (
%) Nordea
100
Nordic leader in customer relationship,
Percent
3
33
0
10
20
30
40
50
60
70
80
90
100
44
12
Nordea Peer 1 Peer 2 Peer 3 Peer 4
41
6
31
10
26
6
10
Core
Basic
Lead
Source: Greenwich Associates 2011
23 •
Wholesale Banking
96
59
42
71 68
60
15 21 18

Successful customer relationship strategy - Swedish corporate customers as an example
24 •
4743
3333
2011 2010 2009 2008
686264
56
2010 2011 2009 2008
59
4744
38
2011 2010 2009 2008
Lead
Relationships (%)
Product Cross-sell
Effectiveness (%)
Share Strategic
Thinking (%)
Source: Greenwich Associates Large Corporate
Banking surveys
The 1 or 2 most important bank
or house bank used for
domestic and/or international
services
The average number of
products bought from the bank
divided by the average number
of products used by its
customers
With which bank customers
share their strategic thinking
Wholesale Banking

Successful advisory business
25 •
#1 Advisor, M&A Nordic region, Q1/12 #1 Bookrunner Syndicated Loans Nordic, Q1/12
Bank Deal value Transactions
Nordea Corporate Finance 2.111 6
Barclays 1.800 1
Deutsche Bank 1.800 1
Goldman Sachs 1.800 1
Handelsbanken Capital Markets 1.600 3
JP Morgan Cazenove 1.600 1
SEB Enskilda 759 3
Morgan Stanley 557 1
Swedbank First Securities 510 2
FIH Partners A/S 510 1
Bank Deal value Transactions
Nordea Markets 673 6
SEB Enskilda 563 5
Swedbank First Securities 342 3
HSBC 297 3
RBS 297 3
Citi 297 3
Danske Bank 268 3
Deutsche Bank 197 2
Barclays 197 2
Mitsubishi UFJ Financial Group 196 2
Source: Merger Market and Dealogic
Wholesale Banking

32
21
78
33 31
23
74
28
Cost/income RaRoCaR RWA Lending to
Q4/11
Q1/12
Execution of New Normal
26 •
Wholesale Banking
(%) (%) (EURbn)
(EURbn)
deposit gap
Strong Q1 performance
• Further alignment of the Wholesale
Banking value chain
• Mitigate impact of new regulations
• Strict internal resource management
• Optimization of capital utilization in
banking and trading books
Business model refinement

Traditional
New
traditional
Unit linked
Risk
products
High guarantee
closed for new business
Asset liability matching
Customer migration to
other products
Fee based product
Premium guarantee
Offered as attractive
alternative to traditional
products
Actively grow business
to all segments via all
channels
Actively grow
business via bundling
with bank products
Life & Pensions product strategy 1
Bring Life & Pensions in line with Group ROE target by
increasing cost and capital efficiency
27
Life & Pensions ROE % by product, 2010
Traditional Unit Linked Risk products
Group
ROE target
2
Extensive cost reduction programme
– including scaling down activities in
less profitable areas
Wealth Management

28 •
2,6
2,8
3,0
3,2
3,4
3,6
3,8
4,0
10
/10
11
/10
12
/10
01
/11
02
/11
03
/11
04
/11
05
/11
06
/11
07
/11
08
/11
09
/11
10
/11
11
/11
12
/11
01
/12
02
/12
Nordea
BankInvest
Danske Invest
Jyske Invest
Nykredit
2,6
2,8
3,0
3,2
3,4
3,6
10
/10
11
/10
12
/10
01
/11
02
/11
03
/11
04
/11
05
/11
06
/11
07
/11
08
/11
09
/11
10
/11
11
/11
12
/11
01
/12
02
/12
Evli
OP
Nordea
FIM
Danske
2,4
2,6
2,8
3,0
3,2
3,4
3,6
10
/10
11
/10
12
/10
01
/11
02
/11
03
/11
04
/11
05
/11
06
/11
07
/11
08
/11
09
/11
10
/11
11
/11
12
/11
01
/12
02
/12
Storebrand
Odin
Nordea
Alfred Berg
DnB NOR
Terra/WarrenWicklund
Denmark #2
2,2
2,4
2,6
2,8
3,0
3,2
3,4
3,6
10
/10
10
/11
10
/12
11
/01
11
/02
11
/03
11
/04
11
/05
11
/06
11
/07
11
/08
11
/09
11
/10
11
/11
11
/12
12
/01
12
/02
SHB
SwedbankRobur
SEB
Nordea
Skandia
LF
SEB Externa
SHB Externa
Norway shared #2
Data as of February 2012
Morningstar ratings picking up
Finland #1
Sweden #2
Wealth Management

Key messages
29 •
• Nordea’s business model delivers strong fundamentals
• Improved relationships
• High diversification
• High RoE
• Strong capital generation
• Execution of New Normal will build the future bank business model
• Building the future bank business model
• Approx. 100 projects in place
• Target is to reduce costs from new regulations by being more efficient on
costs, capital and liquidity

Deutsche Bank Global Financial Services
Conference
Fredrik Rystedt, Chief Financial Officer / EVP