deutsche bank industrials & basic materials conference
TRANSCRIPT

Delta: Setting A New Standard
Deutsche Bank Industrials & Basic Materials Conference
June 4, 2015

2
This presentation contains various projections and other forward-looking statements which represent Delta’s estimates or expectations regarding future events. All forward-looking statements involve a number of assumptions, risks and uncertainties, many of which are beyond Delta’s control, that could cause the actual results to differ materially from the projected results. Factors which could cause such differences include, without limitation, business, economic, competitive, industry, regulatory, market and financial uncertainties and contingencies, as well as the “Risk Factors” discussed in Delta’s SEC filings. Caution should be taken not to place undue reliance on Delta’s forward-looking statements, which represent Delta’s views only as of the date of this presentation, and which Delta has no current intention to update.
In this presentation, we will discuss certain non-GAAP financial measures. You can find the reconciliations of those measures to comparable GAAP measures on our website at delta.com.
Safe Harbor
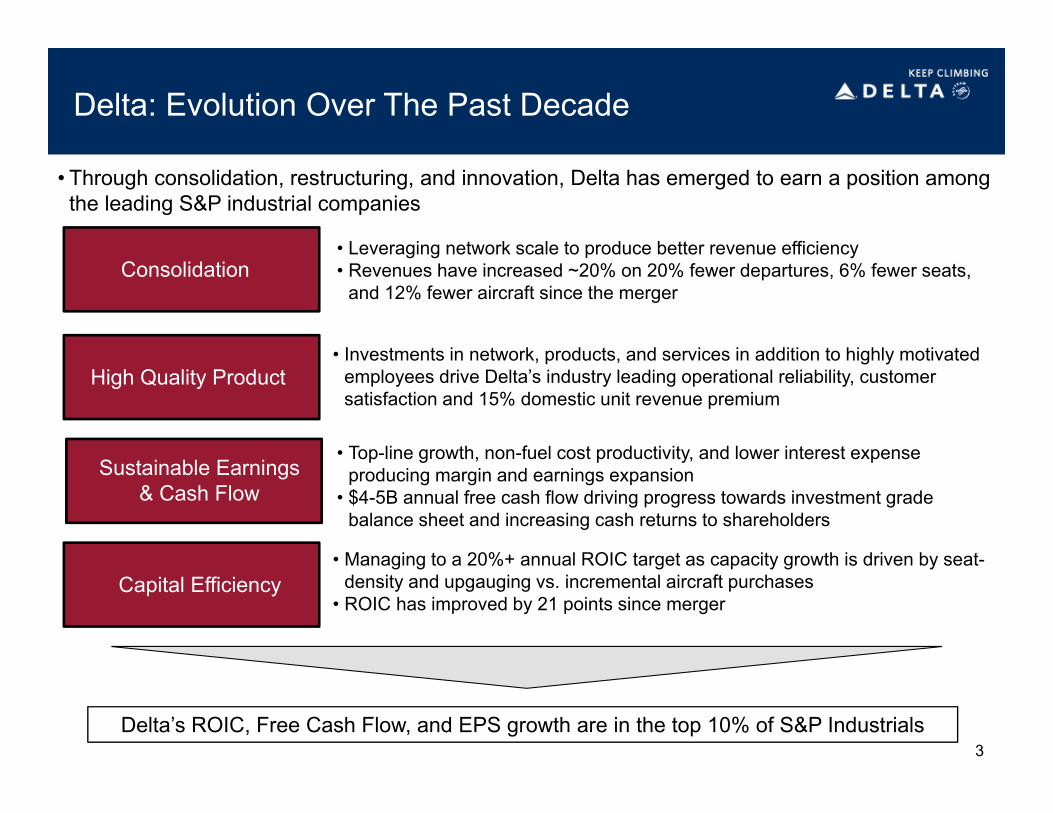
Delta: Evolution Over The Past Decade
Consolidation
High Quality Product
Sustainable Earnings & Cash Flow
• Investments in network, products, and services in addition to highly motivated employees drive Delta’s industry leading operational reliability, customer satisfaction and 15% domestic unit revenue premium
• Leveraging network scale to produce better revenue efficiency• Revenues have increased ~20% on 20% fewer departures, 6% fewer seats,
and 12% fewer aircraft since the merger
• Managing to a 20%+ annual ROIC target as capacity growth is driven by seat-density and upgauging vs. incremental aircraft purchases
• ROIC has improved by 21 points since merger
• Through consolidation, restructuring, and innovation, Delta has emerged to earn a position among the leading S&P industrial companies
3
Capital Efficiency
• Top-line growth, non-fuel cost productivity, and lower interest expense producing margin and earnings expansion
• $4-5B annual free cash flow driving progress towards investment grade balance sheet and increasing cash returns to shareholders
Delta’s ROIC, Free Cash Flow, and EPS growth are in the top 10% of S&P Industrials
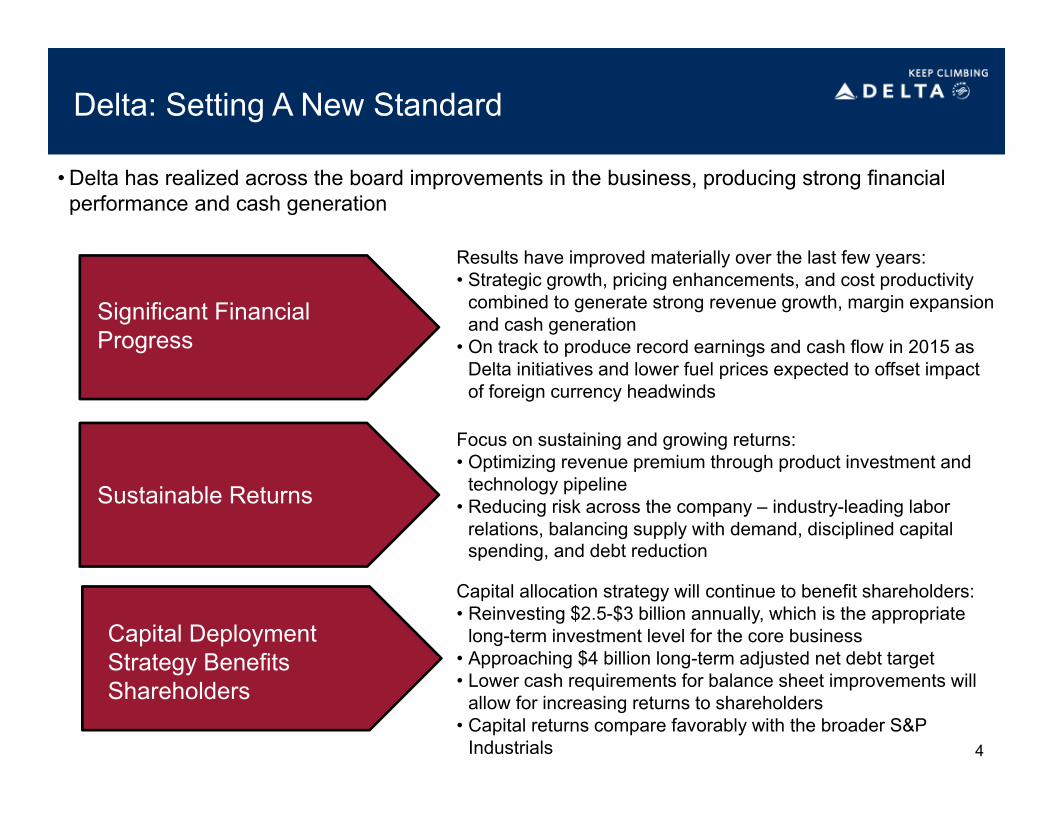
Delta: Setting A New Standard
Significant Financial Progress
Sustainable Returns
Capital Deployment Strategy Benefits Shareholders
Focus on sustaining and growing returns:• Optimizing revenue premium through product investment and
technology pipeline• Reducing risk across the company – industry-leading labor
relations, balancing supply with demand, disciplined capital spending, and debt reduction
Results have improved materially over the last few years:• Strategic growth, pricing enhancements, and cost productivity
combined to generate strong revenue growth, margin expansion and cash generation
• On track to produce record earnings and cash flow in 2015 as Delta initiatives and lower fuel prices expected to offset impact of foreign currency headwinds
Capital allocation strategy will continue to benefit shareholders: • Reinvesting $2.5-$3 billion annually, which is the appropriate
long-term investment level for the core business• Approaching $4 billion long-term adjusted net debt target• Lower cash requirements for balance sheet improvements will
allow for increasing returns to shareholders • Capital returns compare favorably with the broader S&P
Industrials
• Delta has realized across the board improvements in the business, producing strong financial performance and cash generation
4

LTM 1Q14 LTM 1Q15
+54%
5
Across The Board Improvement In The Business
• Delta continues to deliver industry leading operational reliability and customer satisfaction• LTM 1Q15 pretax margin expanded 350bps year over year to 11.5% (13.7% excluding hedges)• Lowered adjusted net debt by nearly $5 billion, while returning over $3 billion to shareholders
since 2012
Excludes special items
Pretax Income Free Cash Flow ROIC
16.4%
22.3%
LTM 1Q14 LTM 1Q15
+590bps$4.7B
$3.0B $2.0B
$3.8B
LTM 1Q14 LTM 1Q15
+1.8B

Operating margin 15.5% - 16.5%
Fuel Price $2.40 - $2.45
Non-operating expense ~$120 million
Passenger unit revenue change year over year Down 4% - 5%
CASM – ex fuel change year over year Flat
System capacity change year over year Up ~3%
Free cash flow ~$1.5 billion
Cash returned to shareholders $1.0 billion
Note: Fuel price includes taxes, settled hedges, refinery contribution and excludes MTM adjustments; CASM ex-fuel excludes special items and profit sharing.
Business continues to generate top line growth, margin expansion and strong free cash flow
June Quarter 2015 Forecast
Producing A Record June Quarter
6

7
Adjustments to Improve Unit Revenue Trajectory
• Capacity reduction initiatives put company on path to achieve unit revenue growth by year end
• Unit revenue performance being negatively impacted by foreign currency, lower international fuel surcharges and weaker than expected domestic yields
• Targeting flat system capacity for the fourth quarter to improve unit revenue performance
• International capacity reductions for post Labor Day schedule to address $600 million revenue headwind from currency
– Will reduce capacity 3% year over year – 6 pts lower growth than originally planned
– Reductions focused on markets most affected by currency and geopolitical issues –including Japan, Brazil, and Russia
• Domestic unit revenues pressured by weakening close in business yields as fuel prices remain low
– Reassessing domestic capacity levels for the Fall – current bias is for a downward revision
Capacity Levels – 2015 vs. 2014
5.2%
3.5% 4.0%
2.0%
4.7%
3.0%
1.5%
-3.0%
1Q 2QE 3QE 4QE
Domestic International2.0% 1Q14 Storm Impact
System: 5% 3% 3% flat

8
Fuel Tailwind Accelerates In Second Half 2015
• 2H15 all-in price per gallon will be ~25% lower than 1H15, despite ~5% higher market fuel prices
• Fuel is expected to be a $9.4 billion expense for Delta in 2015– $1 move in crude impacts expense by $100
million annually– At current market prices, fuel declines will
provide a net $2 billion benefit for Delta in 2015, with further $1 billion benefit in 2016
• Hedge book recognized $1.7 billion in losses in 1H15 after sharp market drop last year– With the bulk of 2015 hedge losses in 1H,
Delta will be at industry average fuel price starting in July
• Refinery provides a unique opportunity for Delta to benefit from lower domestic crude prices
– The refinery has generated ~$225 million in profit in the last year and is expected to produce a $70 million profit in 2Q
Note: Delta fuel prices include taxes and transportation costs, and the impact of hedges and the refinery
$2.93
1Q15 2Q15E 3Q15E 4Q15E
Delta Jet Fuel Prices
$2.05-$2.10$2.05-$2.10$2.40-$2.45
YoY: -3% -15% -30% -20%
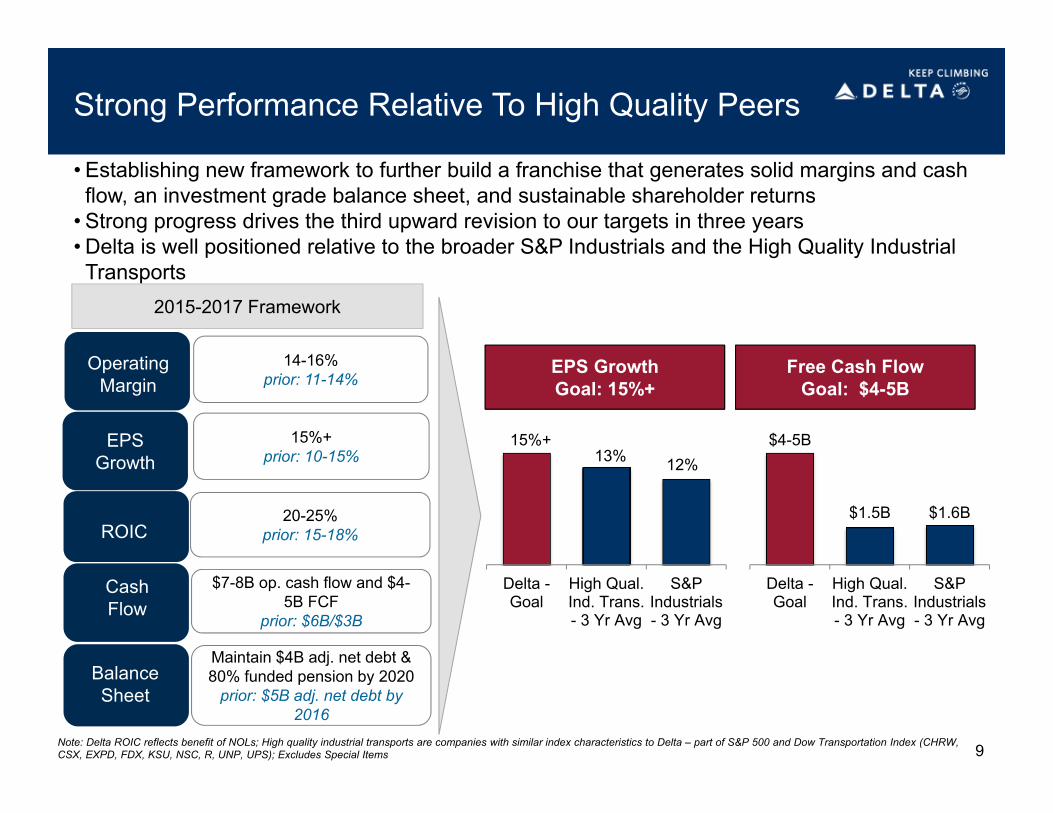
Strong Performance Relative To High Quality Peers
• Establishing new framework to further build a franchise that generates solid margins and cash flow, an investment grade balance sheet, and sustainable shareholder returns
• Strong progress drives the third upward revision to our targets in three years • Delta is well positioned relative to the broader S&P Industrials and the High Quality Industrial Transports
OperatingMargin
14-16%prior: 11-14%
2015-2017 Framework
EPS Growth
15%+prior: 10-15%
20-25%prior: 15-18%
$7-8B op. cash flow and $4-5B FCF
prior: $6B/$3B
CashFlow
Maintain $4B adj. net debt & 80% funded pension by 2020
prior: $5B adj. net debt by 2016
BalanceSheet
ROIC
Delta -Goal
High Qual.Ind. Trans.- 3 Yr Avg
S&PIndustrials- 3 Yr Avg
$4-5B
Delta -Goal
High Qual.Ind. Trans.- 3 Yr Avg
S&PIndustrials- 3 Yr Avg
13%15%+
Free Cash Flow Goal: $4-5B
EPS GrowthGoal: 15%+
12%
$1.6B$1.5B
9Note: Delta ROIC reflects benefit of NOLs; High quality industrial transports are companies with similar index characteristics to Delta – part of S&P 500 and Dow Transportation Index (CHRW, CSX, EXPD, FDX, KSU, NSC, R, UNP, UPS); Excludes Special Items

Reinvest In The Business
• ~50% of operating cash flow to be reinvested in the business
• Plan to invest $2.5 - $3 billion annually into fleet, products, facilities and technology
• Allows for replacement of 20% of Delta’s mainline fleet over next 3 years
Strengthen The Balance Sheet
• Nearly $10 billion in debt reduction in last five years
• Approaching $4 billion long-term adjusted net debt target
• Committed to ~$1 billion per year in pension funding
• Progress toward investment grade metrics evident in three S&P upgrades in last 18 months
• Current ratings two notches away from investment grade
Return Cash To Shareholders
• Completed $2 billion repurchase authorization this quarter, more than one year ahead of expiration.
• Announced new $5 billion repurchase authorization through 2017 - $200 million of June quarter purchases under this authorization
• Delta has now returned over $3 billion in less than two years
• Will return at least 50% of free cash flow to shareholders until debt target is reached
Balanced approach to capital deployment has driven significant value for shareholders
Balanced Capital Deployment Drives Long-Term Value
10Expect to produce over $20 billion in operating cash flow from 2015-2017

Strong Cash Generation Funds Investment in The Future, Reductions in Leverage, and Capital Returns to Owners
• Strong operating cash flow, combined with disciplined capital spending, produces sustainable free cash flow of $4-5 billion annually
Note: Includes pre-merger NWA; Excludes special items 11
$2.6$3.8 $4.1
$4.8$4.1
$2.9$1.8 $1.3 $1.2 $0.9
$2.1 $2.6
$1.2 $1.3 $1.3$2.0
$2.9$2.1
$2.9
($2.0)
$0.0
$2.0
$4.0
$6.0
$8.0Capital Spending and Operating Cash Flow ($B)
CapEx Operating Cash Flow
$8.9 $10.7 $11.6$15.6
$18.6$22.0 $23.8
$26.5
$12.4 $11.2 $13.2$17.0 $17.0 $15.0 $12.9 $11.7 $9.4 $7.3 $6.0
Adjusted Net Debt ($B)

Setting Long-Term Adjusted Net Debt Target at $4B
• Goal is to achieve and maintain $4 billion adjusted net debt levels by 2017
Adjusted Net Debt
$17.0B
$9.4B $7.3B
$4B
2009 2013 2014 LT Target
• Determined $4 billion is optimal long-term debt level
–Results in investment grade credit metrics and a manageable WACC
–Balances EPS efficiency with future flexibility
–Lowers financial risk for the business
• Debt reduction and optimization of debt portfolio provide earnings tailwind through lower interest expense
–Interest expense at $4 billion adjusted net debt target will be $200 million annually –a reduction of $1.1 billion vs. 2009
–Interest expense levels are similar to S&P Industrial peers
• Building a significant unencumbered asset base–Currently $3.2 billion in unencumbered
assets–New aircraft deliveries through 2017 will
increase this amount
12
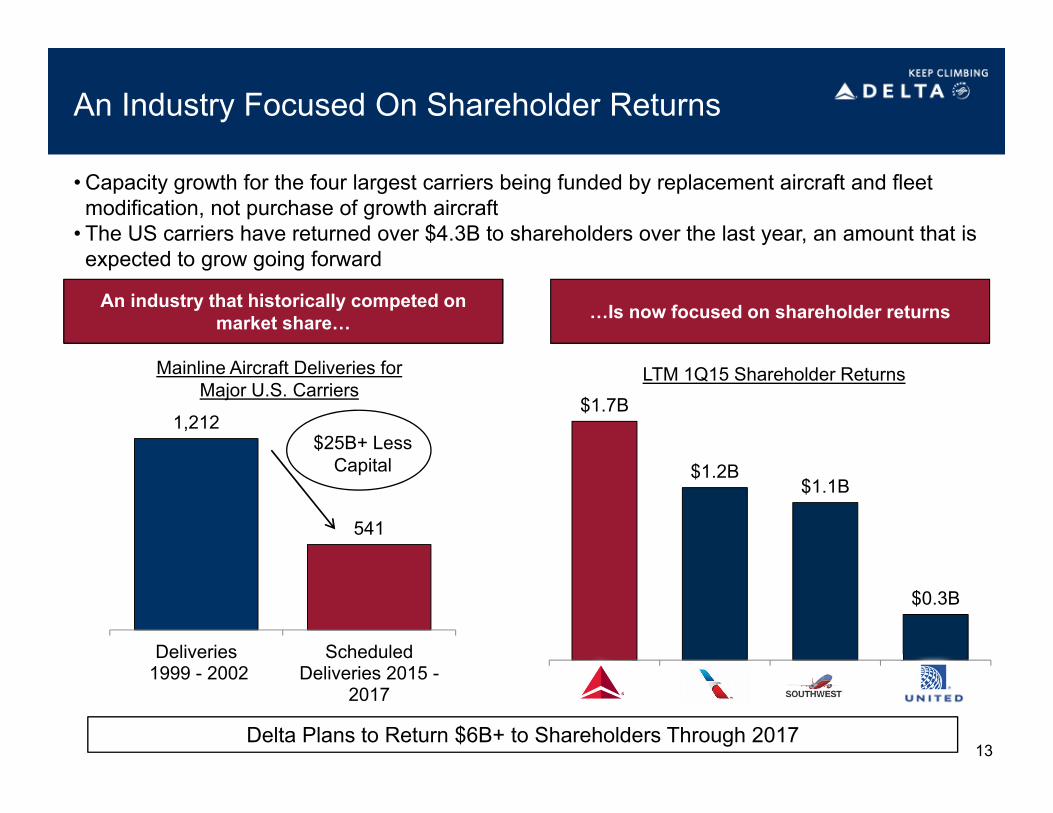
An Industry Focused On Shareholder Returns
• Capacity growth for the four largest carriers being funded by replacement aircraft and fleet modification, not purchase of growth aircraft
• The US carriers have returned over $4.3B to shareholders over the last year, an amount that is expected to grow going forward
13
…Is now focused on shareholder returnsAn industry that historically competed on market share…
LTM 1Q15 Shareholder ReturnsMainline Aircraft Deliveries for Major U.S. Carriers
1,212
541
Deliveries 1999 - 2002
ScheduledDeliveries 2015 -
2017
$25B+ Less Capital
Delta Plans to Return $6B+ to Shareholders Through 2017
$1.7B
$1.2B$1.1B
$0.3B

Delta’s Stock Has Outperformed the Industrial Peers…
• Delta’s strong financial performance and balanced capital deployment strategy has driven share price appreciation well in excess of the peer group over the last several years
0%
50%
100%
150%
200%
250%
300%
350%
1Q13 2Q13 3Q13 4Q13 1Q14 2Q14 3Q14 4Q14 1Q15
Delta 279%
Airlines (XAL) 130%
High Quality Ind. Transports 52%
S&P 500 45%
Stock Price Performance 2013-March 31, 2015
14Note: High quality industrial transports are companies with similar index characteristics to Delta – part of S&P 500 and Dow Transportation Index (CHRW, CSX, EXPD, FDX, KSU, NSC, R, UNP, UPS)

• Plan targets compare favorably with other industrials and should help drive better valuations
…But Valuation Remains at a Significant Discount
15%+13.1%
11.5%
Delta High Qual.Ind.
Transports
S&PIndustrials
EPS Growth
$4-5B
$1.5B $1.6B
Delta High Qual.Ind.
Transports
S&PIndustrials
Free Cash Flow
Note: High quality industrial transports are companies with similar index characteristics to Delta – part of S&P 500 and Dow Transportation Index (CHRW, CSX, EXPD, FDX, KSU, NSC, R, UNP, UPS); For both peer groups, ROIC is the LTM 1Q15 average, shareholder returns are for FY14, and free cash flow and EPS growth is the 2013-15E (cons.) average. Data source is FactSet; Delta ROIC & P/E reflect benefit of NOLs; P/E and P/FCF as of 5/29/15; Excludes Special Items
23.4%
20.1%
Delta High Qual. Ind.Transports
S&PIndustrials
ROIC
20-25%
10.2
18.6 17.8
Delta High Qual.Ind.
Transports
S&PIndustrials
Forward Price to Earnings
8.3
32.9
19.8
Delta High Qual.Ind.
Transports
S&PIndustrials
15
Forward Price to Free Cash Flow
1.2% 1.6% 1.7%
4.5% 3.1% 3.1%
Delta High Qual.Ind.
Transports
S&PIndustrials
Repo Yield Dividend Yield
5.7%
4.7% 4.8%
Shareholder Returns

America’s Best Run Airline
Growing Revenues, Margins and Cash Flows
Lowering Risk Across the Business
• Driving domestic revenue premium by successfully pricing for our product advantages – Branded Fares expand offerings for customers across the pricing spectrum
• Profitable growth opportunities through international partnerships, ancillary revenues, and technology
• Efficient capital spending allows for significant investment in the future while generating 20%+ returns on invested capital
• Growing free cash flow with a commitment to return at least 50% to shareholders through 2017
• Delta is a high-quality S&P Industrial that delivers growing value for employees, customers and investors
16
Investing in the Future and Rewarding Our
Owners
• Diversified revenue portfolio• Industry-leading employee relations• Nearing investment grade balance sheet with an additional $3 billion debt
reduction over next two years
• Proven track record of execution and effectively managing the business to demand - maintaining capacity discipline in low fuel environment
Delta: A High Quality Company
Non-GAAP Reconciliations
17

Non-GAAP Reconciliations
Non-GAAP Financial Measures
18
Delta sometimes uses information ("non-GAAP financial measures") that is derived from the Consolidated Financial Statements, but that is not presented in accordance with accounting principles generally accepted in the U.S. (“GAAP”). Under the U.S. Securities and Exchange Commission rules, non-GAAP financial measures may be considered in addition to results prepared in accordance with GAAP, but should not be considered a substitute for or superior to GAAP results. The tables below show reconciliations of non-GAAP financial measures used in this presentation to the most directly comparable GAAP financial measures.
Forward Look ing Projections. Delta is unable to reconcile certain forward-looking projections to GAAP as the nature or amount of special items cannot be estimated at this time.
Non-GAAP Reconciliations
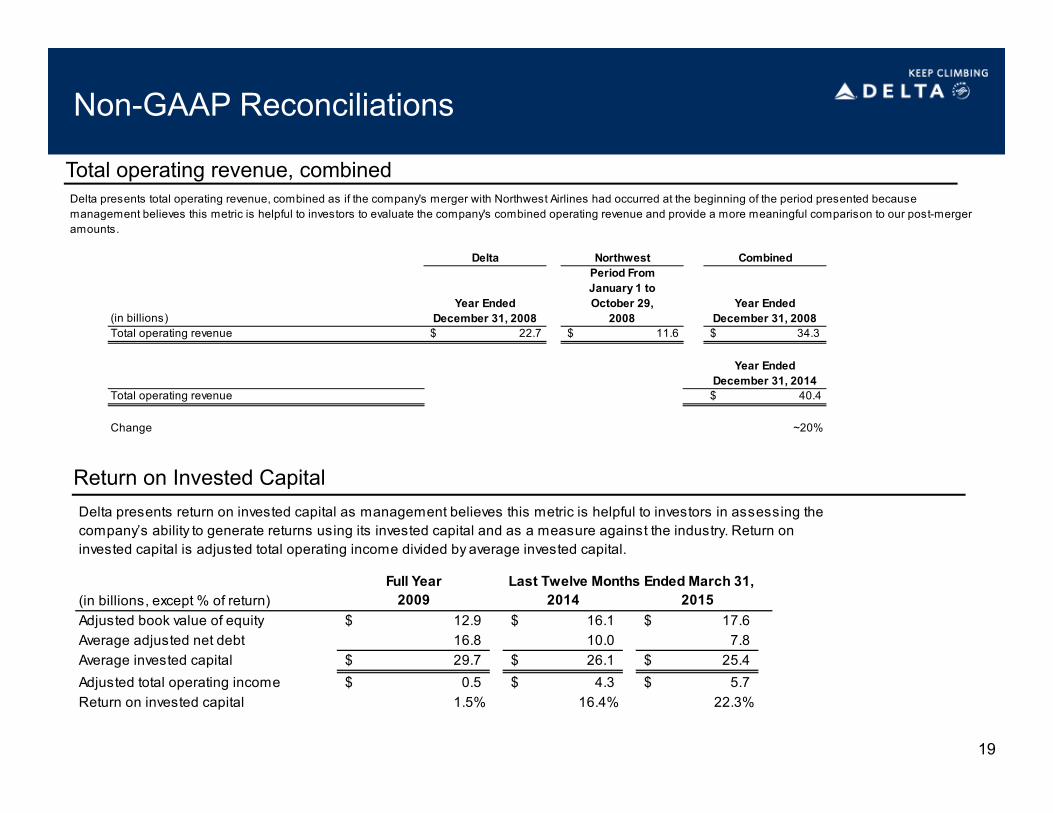
Total operating revenue, combined
19
Delta Northwest CombinedPeriod FromJanuary 1 to
Year Ended October 29, Year Ended(in billions) December 31, 2008 2008 December 31, 2008Total operating revenue $ 22.7 $ 11.6 34.3$
Year EndedDecember 31, 2014
Total operating revenue $ 40.4
Change ~20%
Delta presents total operating revenue, combined as if the company's merger with Northwest Airlines had occurred at the beginning of the period presented because management believes this metric is helpful to investors to evaluate the company's combined operating revenue and provide a more meaningful comparison to our post-merger amounts.
Return on Invested Capital
Full Year(in billions, except % of return) 2009 2014 2015Adjusted book value of equity 12.9$ 16.1$ 17.6$ Average adjusted net debt 16.8 10.0 7.8 Average invested capital 29.7$ 26.1$ 25.4$ Adjusted total operating income 0.5$ 4.3$ 5.7$ Return on invested capital 1.5% 16.4% 22.3%
Last Twelve Months Ended March 31,
Delta presents return on invested capital as management believes this metric is helpful to investors in assessing the company’s ability to generate returns using its invested capital and as a measure against the industry. Return on invested capital is adjusted total operating income divided by average invested capital.

Non-GAAP Reconciliations
Free Cash Flow
20
(in billions) 2014 2015Net cash provided by operating activities 4.4$ 5.6$ Net cash used in investing activities (2.7) (2.7)Adjustments: Net purchases of short-term investments and other - 0.5 Hedge margin - 0.4 SkyMiles used pursuant to advance purchase under AMEX agreement and other 0.3 -Total free cash flow 2.0$ 3.8$
March 31,
Delta presents free cash flow because management believes this metric is helpful to investors to evaluate the company's ability to generate cash that is available for use for debt service or general corporate initiatives. This metric is adjusted for hedge margin as we believe this adjustment removes the impact of current market volatility on our unsettled hedges and allows investors to better understand and analyze the company’s core operational performance in the period shown.
Last Twelve Months Ended

Non-GAAP Reconciliations
Net Income Per Diluted Share, adjusted for special items
21
Net Income Net Income Per Diluted ShareYear Ended Year Ended
(in millions, except per share data) December 31, 2014 December 31, 2014GAAP $ 659 $ 0.78 Adjusted for:
MTM adjustments and settlements 2,346 Restructuring and other 716 Loss on extinguishment of debt 268 Virgin Atlantic MTM adjustments 134 Income Tax (1,290)
Non-GAAP 2,833$ 3.35$
Net Income Net Income Per Diluted ShareYear Ended Year Ended
(in millions, except per share data) December 31, 2013 December 31, 2013GAAP $ 10,540 $ 12.29 Adjusted for:
MTM adjustments and settlements (276)Restructuring and other 424 Release of tax valuation allowance (7,989)
Non-GAAP 2,699$ 3.15$
Net Income Net Income Per Diluted ShareYear Ended Year Ended
(in millions, except per share data) December 31, 2012 December 31, 2012GAAP $ 1,009 $ 1.19 Adjusted for:
MTM adjustments and settlements (27)Restructuring and other 452 Loss on extinguishment of debt 118
Non-GAAP 1,552$ 1.83$
Delta adjusts for MTM adjustments and settlements, restructuring and other, loss on extinguishment of debt and Virgin Atlantic MTM adjustments to determine net income per diluted share, adjusted for special items, for the reasons described below under the heading Pre-Tax Income and Pre-Tax Margin, adjusted for special items. Delta also adjusts for the following:
Income tax. Income tax is adjusted for the income tax effect of special items. We believe this adjustment allows investors to better understand and analyze the company’s core operational performance in the period shown.
Release of tax valuation allowance. Because of the uniqueness of the net gain related to the reversal of the tax valuation allowance at the end of 2013, the adjustment for this item allows investors to better understand and analyze the company's core operational performance in the period shown.

Non-GAAP Reconciliations
Pre-Tax Income and Pre-Tax Margin, adjusted for special items
22
(in millions) 2014 2015Pre-tax income $ 2,859 $ 1,923 Adjusted for:
MTM adjustments and settlements (218) 1,723 Restructuring and other 371 677 Loss on extinguishment of debt 18 250 Virgin Atlantic MTM adjustments 8 113
Pre-tax income, adjusted 3,038$ 4,686$
Last Twelve Months Ended March 31,
2014 2015Pre-tax margin 7.5% 4.7%Adjusted for:
MTM adjustments and settlements (0.6)% 4.2%Restructuring and other 1.0% 1.7%Loss on extinguishment of debt 0.1% 0.6%Virgin Atlantic MTM adjustments - 0.3%
Pre-tax margin, adjusted 8.0% 11.5%Hedge losses 2.2%Pre-tax margin, adjusted for hedge losses 13.7%
Last Twelve Months Ended March 31,
Virgin Atlantic MTM adjustments. We record our proportionate share of earnings from our equity investment in Virgin Atlantic in other expense. We adjust for Virgin Atlantic's MTM adjustments to allow investors to better understand and analyze the company’s financial performance in the periods shown.
Delta adjusts for the following items to determine pre-tax income and pre-tax margin, adjusted for special items, for the reasons described below:
Mark-to-market ("MTM") adjustments and settlements. MTM adjustments are defined as fair value changes recorded in periods other than the settlement period. Such fair value changes are not necessarily indicative of the actual settlement value of the underlying hedge in the contract settlement period. Settlements represent cash received or paid on hedge contracts settling during the period. These items adjust fuel expense to show the economic impact of hedging, including cash received or paid on hedge contracts during the period. Adjusting for these items allows investors to better understand and analyze the company's core operational performance in the periods shown.
Restructuring and other. Because of the variability in restructuring and other, the adjustment for this item is helpful to investors to analyze the company’s recurring core operational performance in the periods shown.
Loss on extinguishment of debt. Because of the variability in loss on extinguishment of debt, the adjustment for this item is helpful to investors to analyze the company’s recurring core operational performance in the periods shown.
Hedge losses. Delta adjusts for settled hedge losses to determine what operating margin would be at market fuel prices. We believe adjusting for fuel hedge losses allows investors to better understand and analyze the company's core operational performance, at market fuel prices, in the periods shown.

Non-GAAP Reconciliations
Average fuel price per gallon, adjusted
23
Adjusted Net Debt
(in millions, except per gallon data) 2015 2014Fuel purchase cost 1.87$ 3.09$ Airline segment fuel hedge losses (gains) 0.51 (0.08) Refinery segment impact (0.09) 0.05 Total fuel expense 2.29$ 3.06$ MTM adjustments and settlements 0.64 (0.03) Total fuel expense, adjusted 2.93$ 3.03$
The tables below show the components of fuel expense, including the impact of the refinery segment and hedging on average price per gallon. We then adjust for MTM adjustments and settlements (as described above under the heading Pre-Tax Income and Net Income, adjusted for special items) because these amounts allow investors to better understand and analyze Delta's costs for the periods reported.
Three Months EndedMarch 31,
(in billions)Debt and capital lease obligations 17.2$ 15.3$ 13.8$ 12.7$ 11.3$ 9.8$ Plus: unamortized discount, net from purchase accounting and fresh start reporti 1.1 0.6 0.6 0.5 0.4 0.1 Adjusted debt and capital lease obligations 18.3$ 15.9$ 14.4$ 13.2$ 11.7$ 9.9$ Plus: 7x last twelve months' aircraft rent 3.4 2.7 2.1 1.9 1.5 1.6 Adjusted total debt 21.7 18.6 16.5 15.1 13.2 11.5 Less: cash, cash equivalents and short-term investments (4.7) (3.6) (3.6) (3.4) (3.8) (3.3) Less: hedge margin receivable - - - - - (0.9) Adjusted net debt 17.0$ 15.0$ 12.9$ 11.7$ 9.4$ 7.3$
Delta uses adjusted total debt, including aircraft rent, in addition to long-term adjusted debt and capital leases, to present estimated financial obligations. Delta reduces adjusted debt by cash, cash equivalents and short-term investments, and hedge margin receivable, resulting in adjusted net debt, to present the amount of assets needed to satisfy the debt. Management believes this metric is helpful to investors in assessing the company’s overall debt profile. Management has reduced adjusted debt by the amount of hedge margin receivable, which reflects cash posted to counterparties, as we believe this removes the impact of current market volatility on our unsettled hedges and is a better representation of the continued progress we have made on our debt initiatives.
December 31, 2013 December 31, 2014December 31, 2009 December 31, 2012December 31, 2011December 31, 2010
Non-GAAP Reconciliations
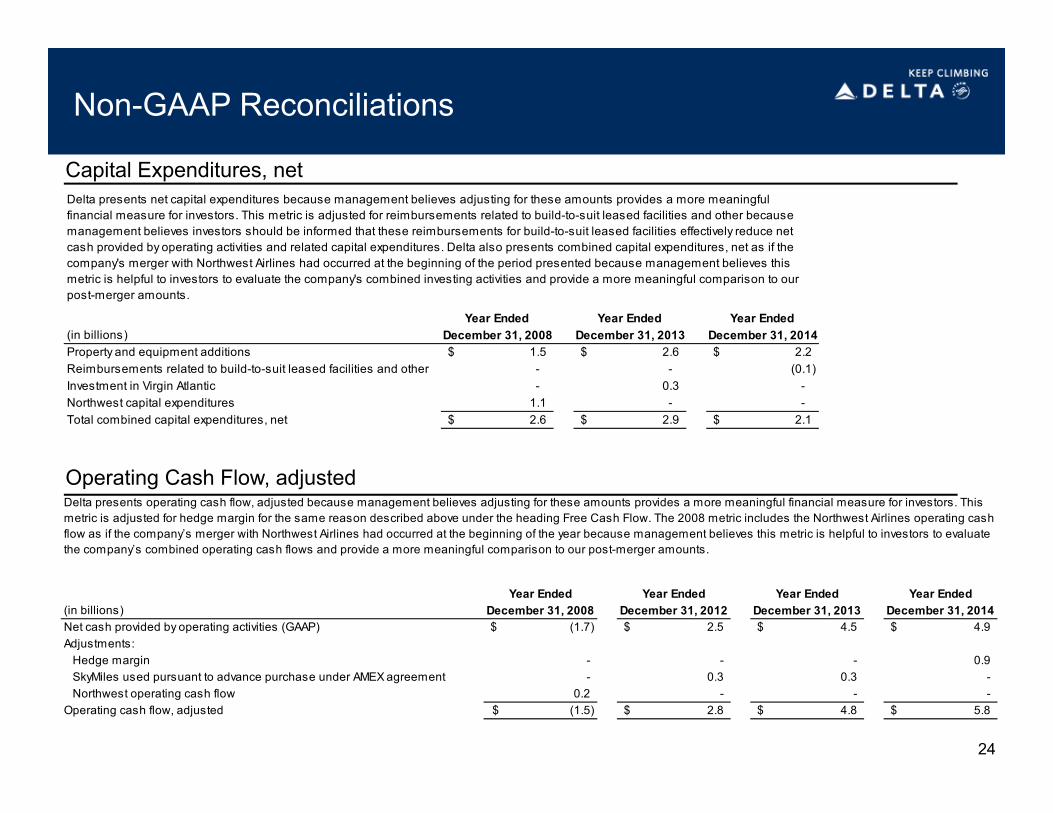
Capital Expenditures, net
24
Operating Cash Flow, adjusted
Year Ended Year Ended Year Ended(in billions) December 31, 2008 December 31, 2013 December 31, 2014Property and equipment additions 1.5$ 2.6$ 2.2$ Reimbursements related to build-to-suit leased facilities and other - - (0.1) Investment in Virgin Atlantic - 0.3 - Northwest capital expenditures 1.1 - - Total combined capital expenditures, net 2.6$ 2.9$ 2.1$
Delta presents net capital expenditures because management believes adjusting for these amounts provides a more meaningful financial measure for investors. This metric is adjusted for reimbursements related to build-to-suit leased facilities and other because management believes investors should be informed that these reimbursements for build-to-suit leased facilities effectively reduce net cash provided by operating activities and related capital expenditures. Delta also presents combined capital expenditures, net as if the company's merger with Northwest Airlines had occurred at the beginning of the period presented because management believes this metric is helpful to investors to evaluate the company's combined investing activities and provide a more meaningful comparison to our post-merger amounts.
Year Ended Year Ended Year Ended Year Ended(in billions) December 31, 2008 December 31, 2012 December 31, 2013 December 31, 2014Net cash provided by operating activities (GAAP) (1.7)$ 2.5$ 4.5$ 4.9$ Adjustments:
Hedge margin - - - 0.9SkyMiles used pursuant to advance purchase under AMEX agreement - 0.3 0.3 - Northwest operating cash flow 0.2 - - -
Operating cash flow, adjusted (1.5)$ 2.8$ 4.8$ 5.8$
Delta presents operating cash flow, adjusted because management believes adjusting for these amounts provides a more meaningful financial measure for investors. This metric is adjusted for hedge margin for the same reason described above under the heading Free Cash Flow. The 2008 metric includes the Northwest Airlines operating cash flow as if the company’s merger with Northwest Airlines had occurred at the beginning of the year because management believes this metric is helpful to investors to evaluate the company’s combined operating cash flows and provide a more meaningful comparison to our post-merger amounts.