deutsche bank screenshow template - columbia...
TRANSCRIPT

October 21 2016
Equity Funds Raise Exposure As Election Polls Shift
Deutsche Bank
Research
Binky Chadha Chief Global Strategist Deutsche Bank New York 212-250-4776 [email protected]
Rajat Dua Strategist Deutsche Bank New York 212-250-2964 [email protected]
Parag Thatte Strategist Deutsche Bank New York 212-250-6605 [email protected]
Deutsche Bank does and seeks to do business with companies covered in its research reports. Thus, investors should be aware that the firm may have a conflict of interest that could affect the objectivity of this report. Investors should consider this report as only a single factor in making their investment decision. DISCLOSURES AND ANALYST CERTIFICATIONS ARE LOCATED IN APPENDIX 1. MCI(P) 057/04/2016
Asset Allocation Investor Positioning And Flows
Distributed on: 21/10/2016 22:03:08 GMT
Research
Deutsche Bank Parag Thatte | (+1) 212 250-6605 | [email protected] October 21 2016
Equity Funds Raise Exposure As Election Polls Shift
Equity funds raise exposure to overweight as election polls shift. Historically, close
elections have seen a rising uncertainty premium and equities flat in the 4 months leading up to
the election, followed by a 5% rally (A Higher Bar Near Term, Jul 2016). However in the last two
weeks, polls have moved sharply in favor of Hillary Clinton, while those favoring Republicans to
retain control of the House have also edged up again after a small pullback. Polls are thus
pointing to a continuation of the political status-quo which combined with already positive data
surprises and a strong start to the Q3 earnings season has seen US equity funds raise their
exposure to overweight.
Rising active equity fund positioning offset by continued outflows but demand-supply
balance to improve after earnings blackout. Even as active equity funds have raised
exposure, end investors have continued to pull money out of developed market equities (-$10bn
in the last two weeks) despite positive data surprises in the US and also in Europe. The
demand-supply backdrop for equities should improve however, as an increasing proportion of
companies exit buyback blackout periods after reporting earnings (70% of S&P 500 market cap
by end of next week).
Third straight week of outflows from defensive bond-like equity funds. The $3bn outflow in
the last 3 weeks is the largest in over a year but still a small fraction of the cumulative inflows of
$50bn ytd and over $180bn since 2010.
Large outflows from money market funds beyond prime-government fund rotation. While
the massive rotation in flows within MM funds out of prime and into government funds has been
in the spotlight, there has also been a large net overall outflow (-$79bn last 3 months). These
outflows go against typical seasonality which points to strong inflows in the 2nd half of the year.
With equities seeing persistent outflows and bank deposits flat over the last 2 months, the
outflows from money market funds are benefiting fixed income funds.
1

Research
Deutsche Bank Parag Thatte | (+1) 212 250-6605 | [email protected] October 21 2016
Equity Funds Raise Exposure As Election Polls Shift
Active managers in fixed income markets positioned for a rate hike but bond funds
continue to get inflows. Aggregate positions in bond futures are extremely short while shorts
in Libor rates futures are also at 2 year lows. Across maturities, futures positions are already
very short in long-dated bonds (25y+) and in the 5y and have fallen to neutral across the rest.
Active bond funds have largely outperformed with rising yields over the last 3.5 months and look
to be underweight duration and overweight credit. Solid inflows into bond funds have continued,
mainly benefiting credit while government bond funds are seeing outflows.
Dollar creeps higher as long positions rise. Rising Fed rate hiking expectations have seen
the dollar moving higher. The dollar is now 4/5th of the way up the flat range it has been in over
the last 21 months, accompanied by rising long speculative dollar positions. Short positions
have risen across most other currencies, led by the euro and the pound while yen longs have
fallen. Mexican peso shorts however have fallen sharply in the last two weeks.
Oil prices now more than 30% overvalued, at extreme of historical valuation band, as
long positioning jumps to record highs. Oil prices are now more than 30% above our
estimate of fair value ($38) based on the dollar and global growth, a level of overvaluation that
has marked historical extremes. The strong rally has been accompanied by net speculative long
positions rising to new record highs as gross longs rose to extremes while gross shorts fell
sharply. Oil long positions are worth over 7 days of global oil production, a record high, and
have also disconnected from their earlier tight relationship with dollar longs. History suggests
that the multiple channels of linkage between the dollar and oil will re-assert themselves and
see prices converge (Oil and The Dollar, Nov 2004).
2
Research
Deutsche Bank Parag Thatte | (+1) 212 250-6605 | [email protected] October 21 2016
Equity Funds Raise Exposure As Election Polls Shift
Equity Funds Raise Exposure As Election Polls Shift
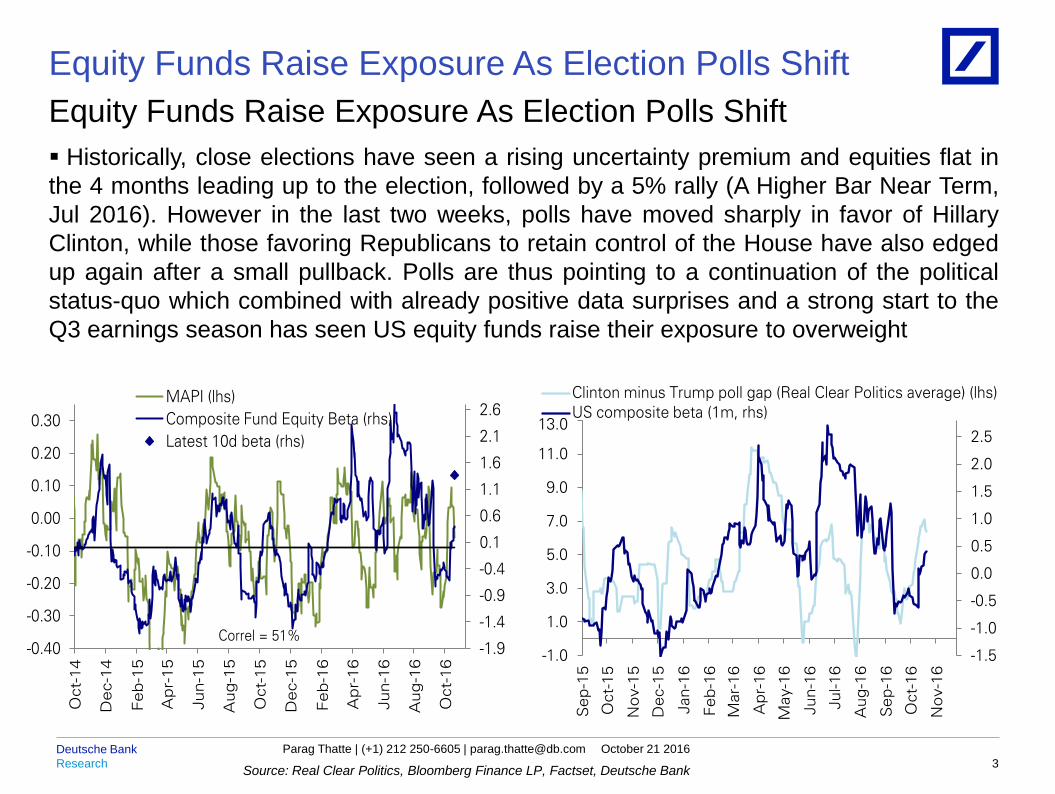
Historically, close elections have seen a rising uncertainty premium and equities flat in
the 4 months leading up to the election, followed by a 5% rally (A Higher Bar Near Term,
Jul 2016). However in the last two weeks, polls have moved sharply in favor of Hillary
Clinton, while those favoring Republicans to retain control of the House have also edged
up again after a small pullback. Polls are thus pointing to a continuation of the political
status-quo which combined with already positive data surprises and a strong start to the
Q3 earnings season has seen US equity funds raise their exposure to overweight
Source: Real Clear Politics, Bloomberg Finance LP, Factset, Deutsche Bank 3
-1.5
-1.0
-0.5
0.0
0.5
1.0
1.5
2.0
2.5
-1.0
1.0
3.0
5.0
7.0
9.0
11.0
13.0
Sep
-15
Oct-
15
No
v-1
5
Dec-1
5
Jan-1
6
Feb
-16
Mar-
16
Ap
r-16
May-1
6
Jun
-16
Jul-16
Aug
-16
Sep
-16
Oct-
16
No
v-1
6
Clinton minus Trump poll gap (Real Clear Politics average) (lhs)
US composite beta (1m, rhs)
-1.9
-1.4
-0.9
-0.4
0.1
0.6
1.1
1.6
2.1
2.6
-0.40
-0.30
-0.20
-0.10
0.00
0.10
0.20
0.30
Oct-
14
Dec-1
4
Feb
-15
Ap
r-15
Jun-1
5
Aug
-15
Oct-
15
Dec-1
5
Feb
-16
Ap
r-16
Jun
-16
Aug
-16
Oct-
16
MAPI (lhs)
Composite Fund Equity Beta (rhs)
Latest 10d beta (rhs)
Correl = 51%
Research
Deutsche Bank Parag Thatte | (+1) 212 250-6605 | [email protected] October 21 2016
Equity Funds Raise Exposure As Election Polls Shift
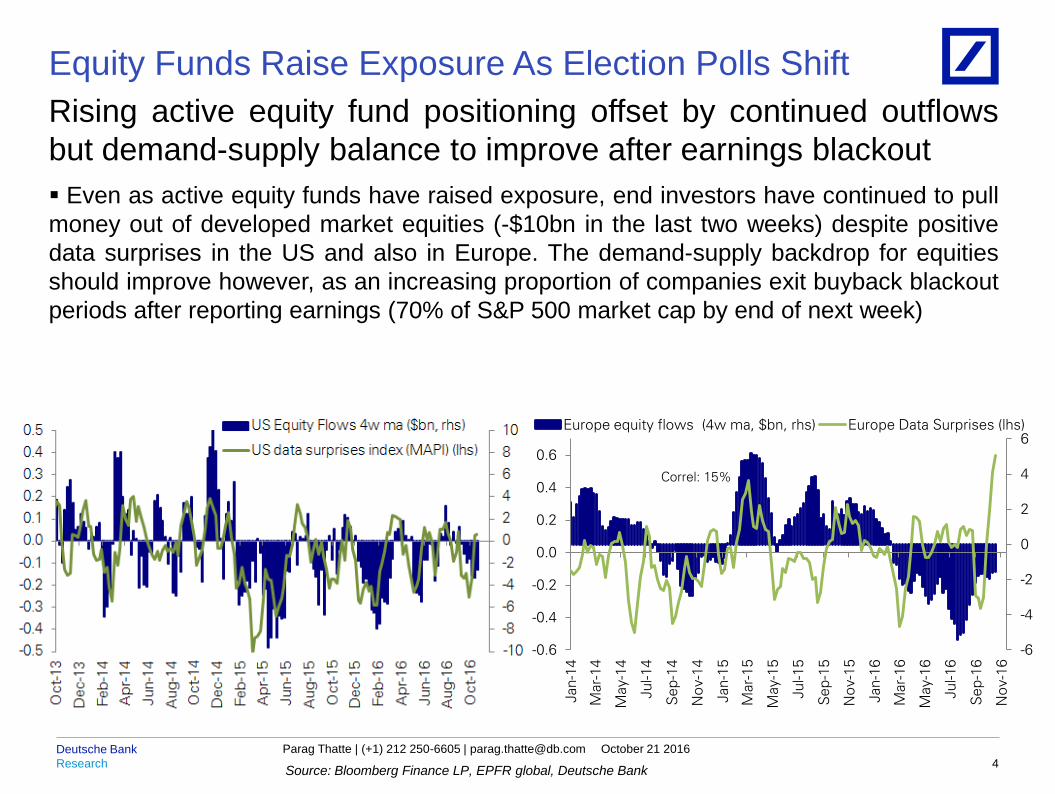
Rising active equity fund positioning offset by continued outflows
but demand-supply balance to improve after earnings blackout
Even as active equity funds have raised exposure, end investors have continued to pull
money out of developed market equities (-$10bn in the last two weeks) despite positive
data surprises in the US and also in Europe. The demand-supply backdrop for equities
should improve however, as an increasing proportion of companies exit buyback blackout
periods after reporting earnings (70% of S&P 500 market cap by end of next week)
Source: Bloomberg Finance LP, EPFR global, Deutsche Bank 4
-6
-4
-2
0
2
4
6
-0.6
-0.4
-0.2
0.0
0.2
0.4
0.6
Jan-1
4
Mar-
14
May-1
4
Jul-14
Sep
-14
No
v-1
4
Jan-1
5
Mar-
15
May-1
5
Jul-15
Sep
-15
No
v-1
5
Jan-1
6
Mar-
16
May-1
6
Jul-16
Sep
-16
No
v-1
6
Europe equity flows (4w ma, $bn, rhs) Europe Data Surprises (lhs)
Correl: 15%

Research
Deutsche Bank Parag Thatte | (+1) 212 250-6605 | [email protected] October 21 2016
Equity Funds Raise Exposure As Election Polls Shift
Large outflows from money market funds beyond prime-
government fund rotation
While the massive rotation in flows within MM funds out of prime and into government
funds has been in the spotlight, there has also been a large net overall outflow (-$79bn
last 3 months). These outflows go against typical seasonality which points to strong
inflows in the 2nd half of the year. With equities seeing persistent outflows and bank
deposits flat over the last 2 months, the outflows from money market funds are benefiting
fixed income funds
Source: ICI, EPFR global, Deutsche Bank 5
-160
-120
-80
-40
0
40
80
120
160
200
240
-160
-120
-80
-40
0
40
80
120
160
200
240
Jan-1
5
Mar-
15
May-1
5
Jul-15
Sep
-15
No
v-1
5
Jan-1
6
Mar-
16
May-1
6
Jul-16
Sep
-16
No
v-1
6
Cumulative flows since Jan 2015 ($bn)
Equity
Bonds
MM
2500
2550
2600
2650
2700
2750
2800
2850
2500
2550
2600
2650
2700
2750
2800
2850
Jun
-11
Jun
-12
Jun-1
3
Jun
-14
Jun
-15
Jun
-16
Money Market Mutual fund assets (weekly, $bn)

Research
Deutsche Bank Parag Thatte | (+1) 212 250-6605 | [email protected] October 21 2016
Equity Funds Raise Exposure As Election Polls Shift
Active managers in fixed income markets positioned for a rate hike
but bond funds continue to get inflows
Aggregate positions in bond futures are extremely short while shorts in Libor rates
futures are also at 2 year lows. Across maturities, futures positions are already very short
in long-dated bonds (25y+) and in the 5y and have fallen to neutral across the rest. Active
bond funds have largely outperformed with rising yields over the last 3.5 months and look
to be underweight duration and overweight credit. Solid inflows into bond funds have
continued, mainly benefiting credit while government bond funds are seeing outflows.
Source: CFTC, FRB, Haver, Bloomberg Finance LP, Deutsche Bank 6
1.0
1.5
2.0
2.5
3.0
3.5
4.0
4.5-550
-450
-350
-250
-150
-50
50
150
250
350
450
Jun
-08
No
v-0
8
Ap
r-09
Sep
-09
Feb
-10
Jul-10
Dec-1
0
May-1
1
Oct-
11
Mar-
12
Aug
-12
Jan
-13
Jun
-13
No
v-1
3
Ap
r-14
Sep
-14
Feb
-15
Jul-15
Dec-1
5
May-1
6
Oct-
16
UST Positions in 10y equivalent (inv lhs, Thous Contracts)
US 10y yield (%, rhs)
QE 1 Calendar
easingQE 2
QE 3
Correl since Mar
2009: -0.61
Op
TwistTaper
comm
Taper ECB
-ve
rates
ECB
QE
ECB
rate
cut
BOJ
rate
cut
-23%-20%-17%-14%-11%-8%-5%-2%1%4%7%10%13%16%
-23%-20%-17%-14%-11%-8%-5%-2%1%4%7%
10%13%16%
Jan
-14
Ap
r-14
Jul-14
Oct-
14
Jan
-15
Ap
r-15
Jul-15
Oct-
15
Jan
-16
Ap
r-16
Jul-16
Oct-
16
Net Long Contracts as % of Open InterestED 2y 5y 10y 15 - 25y 25+y

Research
Deutsche Bank Parag Thatte | (+1) 212 250-6605 | [email protected] October 21 2016
Equity Funds Raise Exposure As Election Polls Shift
Dollar creeps higher as long positions rise
Rising Fed rate hiking expectations have seen the dollar moving higher. The dollar is
now 4/5th of the way up the flat range it has been in over the last 21 months,
accompanied by rising long speculative dollar positions. Short positions have risen across
most other currencies, led by the euro and the pound while yen longs have fallen.
Mexican peso shorts however have fallen sharply in the last two weeks
Source: FRB, Haver, CFTC, Deutsche Bank 7
68
70
72
74
76
78
80
82
84
86
88
90
68
70
72
74
76
78
80
82
84
86
88
90
Jan
-14
Mar-
14
May-1
4
Jul-14
Sep
-14
No
v-1
4
Jan
-15
Mar-
15
May-1
5
Jul-15
Sep
-15
No
v-1
5
Jan
-16
Mar-
16
May-1
6
Jul-16
Sep
-16
No
v-1
6
US trade weighted dollar
(major currencies)
79
80
81
82
83
84
85
86
87
88
-20
-10
0
10
20
30
40
50
60
70
80
Jan-1
6
Jan-1
6
Feb
-16
Mar-
16
Mar-
16
Ap
r-16
May-1
6
May-1
6
Jun
-16
Jul-16
Jul-16
Aug
-16
Sep
-16
Sep
-16
Oct-
16
US trade weighted dollar net long contracts (000s) vs
USTW$
Non commercial contracts (lhs) US TW$ (rhs)
Research
Deutsche Bank Parag Thatte | (+1) 212 250-6605 | [email protected] October 21 2016
Equity Funds Raise Exposure As Election Polls Shift
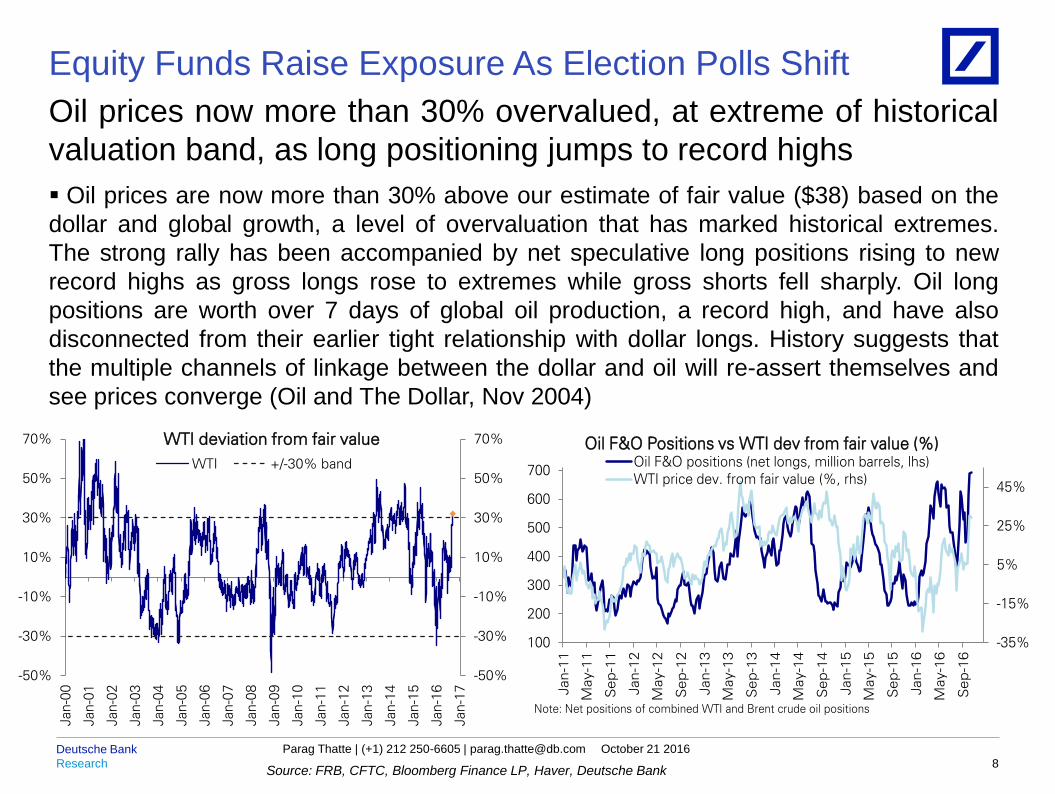
Oil prices now more than 30% overvalued, at extreme of historical
valuation band, as long positioning jumps to record highs
Oil prices are now more than 30% above our estimate of fair value ($38) based on the
dollar and global growth, a level of overvaluation that has marked historical extremes.
The strong rally has been accompanied by net speculative long positions rising to new
record highs as gross longs rose to extremes while gross shorts fell sharply. Oil long
positions are worth over 7 days of global oil production, a record high, and have also
disconnected from their earlier tight relationship with dollar longs. History suggests that
the multiple channels of linkage between the dollar and oil will re-assert themselves and
see prices converge (Oil and The Dollar, Nov 2004)
Source: FRB, CFTC, Bloomberg Finance LP, Haver, Deutsche Bank 8
-50%
-30%
-10%
10%
30%
50%
70%
-50%
-30%
-10%
10%
30%
50%
70%
Jan-0
0
Jan
-01
Jan
-02
Jan
-03
Jan-0
4
Jan
-05
Jan
-06
Jan
-07
Jan-0
8
Jan
-09
Jan
-10
Jan
-11
Jan-1
2
Jan
-13
Jan
-14
Jan
-15
Jan-1
6
Jan
-17
WTI deviation from fair value
WTI +/-30% band
-35%
-15%
5%
25%
45%
100
200
300
400
500
600
700
Jan-1
1
May-1
1
Sep
-11
Jan-1
2
May-1
2
Sep
-12
Jan-1
3
May-1
3
Sep
-13
Jan-1
4
May-1
4
Sep
-14
Jan-1
5
May-1
5
Sep
-15
Jan-1
6
May-1
6
Sep
-16
Oil F&O Positions vs WTI dev from fair value (%) Oil F&O positions (net longs, million barrels, lhs)
WTI price dev. from fair value (%, rhs)
Note: Net positions of combined WTI and Brent crude oil positions

Research
Deutsche Bank Parag Thatte | (+1) 212 250-6605 | [email protected] October 21 2016
Equity positioning US equity fund positioning
Aggregate equity fund positioning has turned up sharply, turning overweight
Source: Factset, Deutsche Bank
9
0.20.3 0.3
0.5
0.0
0.5
1.0
1.5
2.0
0.0
0.5
1.0
1.5
2.0
L/s Equity HFs Macro HFs Asset
Allocation
Funds
US MFs
Positioning by fund type (Z score)
1m 10d
-1.8
-1.2
-0.6
0.0
0.6
1.2
1.8
2.4
3.0
1800
1850
1900
1950
2000
2050
2100
2150
2200
Jan-1
5
Mar-
15
May-1
5
Jul-1
5
Sep
-15
No
v-1
5
Jan-1
6
Mar-
16
May-1
6
Jul-1
6
Sep
-16
No
v-1
6
S&P 500 (lhs)Composite fund equity 1m beta (Z-score, rhs)Latest 10d beta (rhs)

Research
Deutsche Bank Parag Thatte | (+1) 212 250-6605 | [email protected] October 21 2016
Equity positioning Equity beta across major fund groups
Source: Factset, Deutsche Bank
10
0.90
0.95
1.00
1.05
1.10
1800
1850
1900
1950
2000
2050
2100
2150
2200
Jan-1
5
Mar-
15
May-1
5
Jul-15
Sep
-15
No
v-1
5
Jan-1
6
Mar-
16
May-1
6
Jul-16
Sep
-16
No
v-1
6
Large Cap Mutual Funds Beta to S&P 500 (1m)S&P 500 (lhs)
Large Cap Mutual Fund Beta (rhs)
Latest 10d beta (rhs)
Beta = 1
0.20
0.25
0.30
0.35
0.40
0.45
0.50
0.55
0.60
1800
1850
1900
1950
2000
2050
2100
2150
2200
Jan-1
5
Mar-
15
May-1
5
Jul-15
Sep
-15
No
v-1
5
Jan-1
6
Mar-
16
May-1
6
Jul-16
Sep
-16
No
v-1
6
Equity Long Short Hedge Funds Beta to S&P 500(1m)S&P 500 (lhs) Equity Long Short Beta (rhs)
Latest 10d beta (rhs) Average: 0.31
-0.2
-0.1
0.0
0.1
0.2
0.3
0.4
0.5
0.6
0.7
1800
1850
1900
1950
2000
2050
2100
2150
2200
Jan-1
5
Mar-
15
May-1
5
Jul-15
Sep
-15
No
v-1
5
Jan-1
6
Mar-
16
May-1
6
Jul-16
Sep
-16
No
v-1
6
Macro Hedge Funds Beta to the S&P 500 (1m)S&P 500 (lhs) Macro HF Beta (rhs)
Latest 10d beta (rhs) Average: 0.12
0.45
0.50
0.55
0.60
0.65
0.70
0.75
0.80
0.85
1800
1850
1900
1950
2000
2050
2100
2150
2200
Jan-1
5
Mar-
15
May-1
5
Jul-15
Sep
-15
No
v-1
5
Jan-1
6
Mar-
16
May-1
6
Jul-16
Sep
-16
No
v-1
6
Asset allocation funds Beta to S&P 500 (1m)S&P 500 (lhs)
Asset Allocation Funds Beta (rhs)
Latest 10d beta (rhs)
Average: 0.58

Research
Deutsche Bank Parag Thatte | (+1) 212 250-6605 | [email protected] October 21 2016
Equity positioning Sector positioning and mutual fund performance
Mutual funds are somewhat overweight Healthcare, Financials, Consumer Discretionary
and Energy, underweight Consumer Staples, Real Estate, Utilities and Telecom; long-
short equity HFs are overweight Healthcare, Energy and underweight Cons Staples,
Telecom, Technology, Utilities and Real estate
Mutual funds performance rebounded swiftly after underperforming last week
Source: Bloomberg Finance LP, Factset, Deutsche Bank
11
-65%
-45%
-25%
-5%
15%
35%
55%
-65%
-45%
-25%
-5%
15%
35%
55%
He
alth
Care
Fin
ancia
ls
Co
ns D
isc
Ene
rgy
Info
Te
ch
Mate
rials
Ind
ustr
ials
Tele
co
m
Uti
litie
s
Re
al E
sta
te
Co
ns S
tap
les
Fund sector positioning (1m correlation of fund and sector excess returns)
Mutual Funds
Long Short Funds
97.4
97.9
98.4
98.9
99.4
99.9
90
92
94
96
98
100
102
104
106
108
Jan
-16
Feb
-16
Mar-
16
Ap
r-16
May-1
6
Jun
-16
Jul-16
Aug
-16
Sep
-16
Oct-
16
MFs relative performance vs S&P 500 TRI
Dec 2015 = 100
S&P 500 TRI (lhs)
MFs/S&P 500 TRI (rhs)

Research
Deutsche Bank Parag Thatte | (+1) 212 250-6605 | [email protected] October 21 2016
Equity positioning Regional equity mutual fund positioning
UK, US and Europe funds are overweight; broad EM funds are at neutral and rest of the
regional funds are underweight
Source: Bloomberg Finance LP, Factset, Deutsche Bank
12
0.4
0.5
0.6
0.7
0.8
0.9
1.0
1.1
1.2
0.4
0.5
0.6
0.7
0.8
0.9
1.0
1.1
1.2
Jan
-14
Mar-
14
May-1
4
Jul-14
Sep
-14
No
v-1
4
Jan
-15
Mar-
15
May-1
5
Jul-15
Sep
-15
No
v-1
5
Jan
-16
Mar-
16
May-1
6
Jul-16
Sep
-16
No
v-1
6
Rolling 1m beta of EM Funds
Median Beta Average Since 2010: 0.84
0.75
0.80
0.85
0.90
0.95
1.00
1.05
0.75
0.80
0.85
0.90
0.95
1.00
1.05
Jan-1
4
Mar-
14
May-1
4
Jul-14
Sep
-14
No
v-1
4
Jan-1
5
Mar-
15
May-1
5
Jul-15
Sep
-15
No
v-1
5
Jan-1
6
Mar-
16
May-1
6
Jul-16
Sep
-16
No
v-1
6Rolling 1m beta of Japan Funds
Median Beta Average Since 2010: 0.94
0.70
0.75
0.80
0.85
0.90
0.95
1.00
1.05
1.10
1.15
0.70
0.75
0.80
0.85
0.90
0.95
1.00
1.05
1.10
1.15
Jan
-14
Mar-
14
May-1
4
Jul-1
4
Sep
-14
No
v-1
4
Jan
-15
Mar-
15
May-1
5
Jul-15
Sep
-15
No
v-1
5
Jan
-16
Mar-
16
May-1
6
Jul-16
Sep
-16
No
v-1
6
Rolling 1m beta of Europe Funds
Median Beta Average Since 2010: 0.91
-1.4
-0.9
-0.4
0.1
0.6
1.1
1.6
-1.4
-0.9
-0.4
0.1
0.6
1.1
1.6
Japan Latam Asia ex
JP
Global EMEA GEM Europe US
Funds
UK
Regional Mutual Fund PositioningOverweight: Median beta of region to
benchmark is higher than avg (Z-score)
Underweight
Overweight

Research
Deutsche Bank Parag Thatte | (+1) 212 250-6605 | [email protected] October 21 2016
Source: CFTC, Haver, Factset, Deutsche Bank
Bond positioning Libor futures shorts near extreme
Bond futures aggregate short positions fell last week; 2y positions remained short while
10y and 15-25y longs edged up from neutral; 5y shorts fell slightly; shorts in Libor futures
continued to rise
13
-500
-400
-300
-200
-100
0
100
200
300
400
-500
-400
-300
-200
-100
0
100
200
300
400
Jan-1
0
Jul-1
0
Jan-1
1
Jul-1
1
Jan-1
2
Jul-1
2
Jan-1
3
Jul-1
3
Jan-1
4
Jul-1
4
Jan-1
5
Jul-1
5
Jan-1
6
Jul-1
6
Bond net longs in 10y equivalents (thous)
1.0
1.2
1.4
1.6
1.8
2.0
2.2
2.4
2.6
2.8-1600-1400-1200-1000
-800-600-400-200
0200400
Jan-1
4
Ap
r-14
Jul-14
Oct-
14
Jan-1
5
Ap
r-15
Jul-15
Oct-
15
Jan-1
6
Ap
r-16
Jul-16
Oct-
16
3m Eurodollar F&O Positions vs 3m LIBORNet long Contracts (Thous, lhs) ED12 (rhs, inv)
-1.6%
-6.6%
2.7%
1.1%
-17.4%-20%
-15%
-10%
-5%
0%
5%
-20%
-15%
-10%
-5%
0%
5%
2y
5y
10y
15
-2
5y
25y+
Bond Futures Positions as % of OI
Latest 1 week ago
-23%-20%-17%-14%-11%-8%-5%-2%1%4%7%10%13%16%
-23%-20%-17%-14%-11%-8%-5%-2%1%4%7%
10%13%16%
Jan-1
4
Ap
r-14
Jul-14
Oct-
14
Jan-1
5
Ap
r-15
Jul-15
Oct-
15
Jan-1
6
Ap
r-16
Jul-16
Oct-
16
Net Long Contracts as % of Open InterestED 2y 5y 10y 15 - 25y 25+y

Research
Deutsche Bank Parag Thatte | (+1) 212 250-6605 | [email protected] October 21 2016
Bond positioning Bond fund performance
Bond funds performance has been largely flat last week
Source: Bloomberg Finance LP, Factset, Haver, Deutsche Bank
14
97.0
97.5
98.0
98.5
99.0
99.5
100.0
98.0
98.6
99.2
99.8
Jan-1
6
Feb
-16
Mar
-16
Ap
r-16
May
-16
Jun
-16
Jul-1
6
Aug
-16
Sep
-16
Oct
-16
Bond funds vs MBS (both relative to broad market, Dec 31,2015 = 100)
Bond funds(lhs)
MBS(rhs)
92
94
96
98
100
102
104
106
108
110
98.0
98.6
99.2
99.8
Jan
-16
Feb
-16
Mar
-16
Ap
r-16
May
-16
Jun
-16
Jul-1
6
Aug
-16
Sep
-16
Oct
-16
Bond funds vs HY
(both relative to broad index, Dec 31, 2015 = 100)
Bond funds (lhs)
HY (rhs)
98.0
99.0
100.0
101.0
102.0
103.0
98.0
98.5
99.0
99.5
100.0
Jan-1
6
Feb
-16
Mar
-16
Ap
r-16
May
-16
Jun
-16
Jul-1
6
Aug
-16
Sep
-16
Oct
-16
Bond funds vs HG (both relative to broad market, Dec 31,2015 = 100)
Bond funds(lhs)
HG(rhs)
99.0
99.5
100.0
100.5
101.0
101.5
98.0
98.6
99.2
99.8
Jan-1
6
Feb
-16
Mar
-16
Ap
r-16
May
-16
Jun-1
6
Jul-1
6
Aug
-16
Sep
-16
Oct
-16
Bond funds vs Treasuries (both relative to broad market, Dec 31, 2015 = 100)
Bond funds(lhs)
Treasuries(rhs)

Research
Deutsche Bank Parag Thatte | (+1) 212 250-6605 | [email protected] October 21 2016
FX positioning Overall dollar long positions continued to rise; Euro shorts rose while yen longs fell;
GBP shorts fell slightly; MXN shorts have fallen sharply in the last 2 weeks
Source: CFTC, Haver, Deutsche Bank 15
75
80
85
90
95
-20
0
20
40
60
80
100
Jan
-14
Mar-
14
May-1
4
Jul-14
Sep
-14
No
v-1
4
Jan-1
5
Mar-
15
May-1
5
Jul-15
Sep
-15
No
v-1
5
Jan
-16
Mar-
16
May-1
6
Jul-16
Sep
-16
No
v-1
6
Trade Weighted Dollar F&O Positions vs USD IndexNet Long Contracts (Thous, lhs) US trade wtd dollar (rhs)
Trade Weighted Positions in JPY, EUR, GBP,AUD, CHF and CAD are used for calculating
1.05
1.10
1.15
1.20
1.25
1.30
1.35
1.40
-250
-200
-150
-100
-50
0
50
Jan-1
4
Ap
r-14
Jul-14
Oct-
14
Jan-1
5
Ap
r-15
Jul-15
Oct-
15
Jan-1
6
Ap
r-16
Jul-16
Oct-
16
Euro F&O Positions vs EURUSDNet Long Contracts (Thous, lhs) EURUSD (rhs)
99
104
109
114
119
124
129-150
-100
-50
0
50
Jan
-14
Mar-
14
May-1
4
Jul-14
Sep
-14
No
v-1
4
Jan
-15
Mar-
15
May-1
5
Jul-15
Sep
-15
No
v-1
5
Jan
-16
Mar-
16
May-1
6
Jul-16
Sep
-16
No
v-1
6JPY F&O Positions vs USDJPY
Net Long Contracts (Thous, lhs) USDJPY (rhs, inv)
-29%-25% -24% -23%
-12%
0%
10%18% 20%
60%
71%
-40%
-20%
0%
20%
40%
60%
80%
-40%
-20%
0%
20%
40%
60%
80%
GB
P
CH
F
MX
N
EU
R
CA
D
NZD
US
D
JP
Y
AU
D
BR
L
RU
B
Currency positioning as % of Open Interest
Latest 1 wk ago

Research
Deutsche Bank Parag Thatte | (+1) 212 250-6605 | [email protected] October 21 2016
Commodity positioning Oil speculative net longs continued to rise to new all time highs; gold longs continued to
slide; copper positions have turned short again
Source: CFTC, Haver, Bloomberg Finance LP, Deutsche Bank
16
200
300
400
500
600
700
200
300
400
500
600
700
Jan-1
4
Mar-
14
May-1
4
Jul-1
4
Sep
-14
No
v-1
4
Jan-1
5
Mar-
15
May-1
5
Jul-1
5
Sep
-15
No
v-1
5
Jan-1
6
Mar-
16
May-1
6
Jul-1
6
Sep
-16
No
v-1
6
Managed Money: Net Long Positions(million barrels)
Combined crude oil F&O positions
Note: Net positions of combined WTI and Brent crude oil positions
40
240
440
640
840
40
240
440
640
840
Jan-1
4
Mar-
14
May-1
4
Jul-14
Sep
-14
No
v-1
4
Jan-1
5
Mar-
15
May-1
5
Jul-15
Sep
-15
No
v-1
5
Jan-1
6
Mar-
16
May-1
6
Jul-16
Sep
-16
No
v-1
6
Managed Money combined crude oil F&O positions
(million barrels)
Gross longs
Gross Shorts
1.8
2.0
2.2
2.4
2.6
2.8
3.0
3.2
3.4
-50
-40
-30
-20
-10
0
10
20
Jan-1
4
Mar-
14
May-1
4
Jul-14
Sep
-14
No
v-1
4
Jan-1
5
Mar-
15
May-1
5
Jul-15
Sep
-15
No
v-1
5
Jan-1
6
Mar-
16
May-1
6
Jul-16
Sep
-16
Copper F&O Positions vs Copper PriceNet Long Contracts (Thous, lhs) Copper ($/Lb) (rhs)
1050
1100
1150
1200
1250
1300
1350
1400
0
50
100
150
200
250
300
350
Jan-1
4
Mar-
14
May-1
4
Jul-14
Sep
-14
No
v-1
4
Jan-1
5
Mar-
15
May-1
5
Jul-15
Sep
-15
No
v-1
5
Jan-1
6
Mar-
16
May-1
6
Jul-16
Sep
-16
Gold F&O Positions vs Gold PriceNet Long Contracts (Thous, lhs) Gold ($/Troy oz) (rhs)

Research
Deutsche Bank Parag Thatte | (+1) 212 250-6605 | [email protected] October 21 2016
Cross-asset flows Outflows from equities and money market funds continued while bond funds continued to
see inflows
Source: EPFR global, Haver, Deutsche Bank
17
-160
-120
-80
-40
0
40
80
120
160
200
240
-160
-120
-80
-40
0
40
80
120
160
200
240
Jan-1
5
Mar
-15
May
-15
Jul-1
5
Sep
-15
No
v-1
5
Jan-1
6
Mar
-16
May
-16
Jul-1
6
Sep
-16
No
v-16
Cumulative flows since Jan 2015 ($bn)
Equity
Bonds
MM
-240
-140
-40
60
160
260
-240
-140
-40
60
160
260
Jan-1
4
Mar-
14
May-1
4
Jul-14
Sep
-14
No
v-1
4
Jan-1
5
Mar-
15
May-1
5
Jul-15
Sep
-15
No
v-1
5
Jan-1
6
Mar-
16
May-1
6
Jul-16
Sep
-16
No
v-1
6Cumulative equity flows since 2014 ($ bn)*
US Europe
Japan EM
* Adjusted for share of flows into global ex-US funds
-50
-30
-10
10
30
50
70
90
-50
-30
-10
10
30
50
70
90
Jan-1
5
Mar
-15
May
-15
Jul-1
5
Sep
-15
No
v-15
Jan-1
6
Mar
-16
May
-16
Jul-1
6
Sep
-16
No
v-16
Cumulative bond flows since 2015 ($bn)
Corp HY EM
Corp HG Govt Bonds
Munis MBS
TIPS Banks Loans
-0.6
-0.3
0.0
0.3
0.6
-0.6
-0.3
0.0
0.3
0.6
MM Govt
Bonds
Corp
HG
EM
Bonds
Corp
HY
Bal
Funds
Div
Funds
DM
Equity
EM
Equity
Cross asset flows as a % of assets (last 4 weeks)
Sep-28 Oct-05
Oct-12 Oct-19
Safer Riskier

Research
Deutsche Bank Parag Thatte | (+1) 212 250-6605 | [email protected] October 21 2016
Equity flows Equities witnessed outflows this week driven by US and Europe; steady inflows to EM
and global equity funds; Japan funds saw no flows
Source: EPFR global, Haver, Deutsche Bank
18
-10
-5
0
5
10
15
20
25
30
35
40
-10
-5
0
5
10
15
20
25
30
35
40
Jan
-15
Mar-
15
May-1
5
Jul-15
Sep
-15
No
v-1
5
Jan-1
6
Mar-
16
May-1
6
Jul-16
Sep
-16
No
v-1
6
Cumulative sector flows since 2015 ($bn)Materials Cons Goods
Energy Financials
Health Care Industrials
Real Estate Technology
Telecom Utilities
-180
-155
-130
-105
-80
-55
-30
-5
20
-180
-155
-130
-105
-80
-55
-30
-5
20
Jan-1
5
Mar
-15
May
-15
Jul-1
5
Sep
-15
No
v-15
Jan-1
6
Mar
-16
May
-16
Jul-1
6
Sep
-16
No
v-16
Cumulative equity flows since 2015 ($bn)
Growth Value Blend
-210
-160
-110
-60
-10
-210
-160
-110
-60
-10
Jan-1
5
Mar
-15
May
-15
Jul-1
5
Sep
-15
No
v-15
Jan-1
6
Mar
-16
May
-16
Jul-1
6
Sep
-16
No
v-16
Cumulative equity flows since 2015 ($bn)
Large cap Small cap Mid cap
-0.9
-0.7
-0.5
-0.3
-0.1
0.1
0.3
0.5
0.7
0.9
-0.9
-0.7
-0.5
-0.3
-0.1
0.1
0.3
0.5
0.7
0.9
All
Eq
uit
y
US
Euro
pe
Jap
an
Lata
m
Asia
ex J
p
EM
EA
EM
Glo
bal
Regional equity flows (last 4 weeks,% of assets )
28-Sep 5-Oct
12-Oct 19-Oct

Research
Deutsche Bank Parag Thatte | (+1) 212 250-6605 | [email protected] October 21 2016
Bond flows Fixed income funds inflows have continued in the last two weeks but at a slower pace;
inflows to HY and EM bonds lost steam while HG inflows were steady; muni funds saw
the first outflow in 13 months; inflows to MBS, TIPS and bank loan funds continued;
government bonds continued to see outflows
Source: EPFR global, Haver, Deutsche Bank
19
-60
-10
40
90
140
190
240
-60
-10
40
90
140
190
240
Jan
-15
Mar-
15
May-1
5
Jul-15
Sep
-15
No
v-1
5
Jan
-16
Mar-
16
May-1
6
Jul-16
Sep
-16
No
v-1
6
Cumulative bond flows since 2015 ($bn)
Long Term Intermediate Term Short Term
-0.7
-0.5
-0.3
-0.1
0.1
0.3
0.5
0.7
0.9
-0.7
-0.5
-0.3
-0.1
0.1
0.3
0.5
0.7
0.9
All B
ond
s
Co
rp H
Y
Co
rp H
G
EM
Bo
nd
s
Go
vt
Bo
nd
s
Mu
nis
MB
S
TIP
S
Bank L
oans
Bond Flows (last 4 weeks, % of assets)
28-Sep 5-Oct 12-Oct 19-Oct
Research
Deutsche Bank Parag Thatte | (+1) 212 250-6605 | [email protected] October 21 2016
22/10/2016 02:54:09 2010 DB Blue template
Appendix 1 Important Disclosures *Other Information Available upon Request
20
*Prices are current as of the end of the previous trading session unless otherwise indicated and are sourced from local exchanges via Reuters,
Bloomberg and other vendors . Other information is sourced from Deutsche Bank, subject companies, and other sources. For disclosures
pertaining to recommendations or estimates made on securities other than the primary subject of this research, please see the most recently
published company report or visit our global disclosure look-up page on our website at http://gm.db.com/ger/disclosure/DisclosureDirectory.eqsr.
Analyst Certification The views expressed in this report accurately reflect the personal views of the undersigned lead analyst(s) about the subject. In addition, the undersigned lead analyst(s) has not and will not receive any compensation for providing a specific recommendation or view in this report. Parag Thatte/ Binky Chadha/ Rajat Dua.

Research
Deutsche Bank Parag Thatte | (+1) 212 250-6605 | [email protected] October 21 2016
Buy: Based on a current 12-month view of total shareholder return
(TSR = percentage change in share price from current price to
projected target price plus projected dividend yield), we recommend
that investors buy the stock.
Sell: Based on a current 12-month view of total shareholder return,
we recommend that investors sell the stock.
Hold: We take a neutral view on the stock 12 months out and, based
on this time horizon, do not recommend either a Buy or Sell.
Notes:
1. Newly issued research recommendations and target prices always
supersede previously published research.
2. Ratings definitions prior to 27 January, 2007 were:
Buy: Expected total return (including dividends) of 10% or more
over a 12-month period
Hold: Expected total return (including dividends) between -10%
and 10% over a 12-month period
Sell: Expected total return (including dividends) of -10% or
worse over a 12-month period
Equity Rating Key
Equity Rating Dispersion and Banking
Relationships
21
47 % 48 %
6 %
38 %30 %
23 %0
200
400
600
800
1000
1200
1400
1600
Buy Hold Sell
Global Universe
Companies Covered Cos. w/ Banking Relationship

Research
Deutsche Bank Parag Thatte | (+1) 212 250-6605 | [email protected] October 21 2016
22
Additional Information The information and opinions in this report were prepared by Deutsche Bank AG or one of its affiliates (collectively "Deutsche Bank"). Though the information herein is believed to be reliable and has been obtained from public sources believed to be reliable, Deutsche Bank makes no representation as to its accuracy or completeness. If you use the services of Deutsche Bank in connection with a purchase or sale of a security that is discussed in this report, or is included or discussed in another communication (oral or written) from a Deutsche Bank analyst, Deutsche Bank may act as principal for its own account or as agent for another person. Deutsche Bank may consider this report in deciding to trade as principal. It may also engage in transactions, for its own account or with customers, in a manner inconsistent with the views taken in this research report. Others within Deutsche Bank, including strategists, sales staff and other analysts, may take views that are inconsistent with those taken in this research report. Deutsche Bank issues a variety of research products, including fundamental analysis, equity-linked analysis, quantitative analysis and trade ideas. Recommendations contained in one type of communication may differ from recommendations contained in others, whether as a result of differing time horizons, methodologies or otherwise. Deutsche Bank and/or its affiliates may also be holding debt or equity securities of the issuers it writes on. Analysts are paid in part based on the profitability of Deutsche Bank AG and its affiliates, which includes investment banking, trading and principal trading revenues. Opinions, estimates and projections constitute the current judgment of the author as of the date of this report. They do not necessarily reflect the opinions of Deutsche Bank and are subject to change without notice. Deutsche Bank provides liquidity for buyers and sellers of securities issued by the companies it covers. Deutsche Bank research analysts sometimes have shorter-term trade ideas that are consistent or inconsistent with Deutsche Bank's existing longer term ratings. Trade ideas for equities can be found at the SOLAR link at http://gm.db.com. A SOLAR idea represents a high conviction belief by an analyst that a stock will outperform or underperform the market and/or sector delineated over a time frame of no less than two weeks. In addition to SOLAR ideas, the analysts named in this report may from time to time discuss with our clients, Deutsche Bank salespersons and Deutsche Bank traders, trading strategies or ideas that reference catalysts or events that may have a near-term or medium-term impact on the market price of the securities discussed in this report, which impact may be directionally counter to the analysts' current 12-month view of total return or investment return as described herein. Deutsche Bank has no obligation to update, modify or amend this report or to otherwise notify a recipient thereof if any opinion, forecast or estimate contained herein changes or subsequently becomes inaccurate. Coverage and the frequency of changes in market conditions and in both general and company specific economic prospects make it difficult to update research at defined intervals. Updates are at the sole discretion of the coverage analyst concerned or of the Research Department Management and as such the majority of reports are published at irregular intervals. This report is provided for informational purposes only and does not take into account the particular investment objectives, financial situations, or needs of individual clients. It is not an offer or a solicitation of an offer to buy or sell any financial instruments or to participate in any particular trading strategy. Target prices are inherently imprecise and a product of the analyst’s judgment. The financial instruments discussed in this report may not be suitable for all investors and investors must make their own informed investment decisions. Prices and availability of financial instruments are subject to change without notice and investment transactions can lead to losses as a result of price fluctuations and other factors. If a financial instrument is denominated in a currency other than an investor's currency, a change in exchange rates may adversely affect the investment. Past performance is not necessarily indicative of future results. Unless otherwise indicated, prices are current as of the end of the previous trading session, and are sourced from local exchanges via Reuters, Bloomberg and other vendors. Data is sourced from Deutsche Bank, subject companies, and in some cases, other parties. The Deutsche Bank Research Department is independent of other business areas divisions of the Bank. Details regarding our organizational arrangements and information barriers we have to prevent and avoid conflicts of interest with respect to our research is available on our website under Disclaimer found on the Legal tab. Macroeconomic fluctuations often account for most of the risks associated with exposures to instruments that promise to pay fixed or variable interest rates. For an investor who is long fixed rate instruments (thus receiving these cash flows), increases in interest rates naturally lift the discount factors applied to the expected cash flows and thus cause a loss. The longer the maturity of a certain cash flow and the higher the move in the discount factor, the higher will be the loss. Upside surprises in inflation, fiscal funding needs, and FX depreciation rates are among the most common adverse macroeconomic shocks to receivers. But counterparty exposure, issuer creditworthiness, client segmentation, regulation (including changes in assets holding limits for different types of investors), changes in tax policies, currency convertibility (which may constrain currency conversion, repatriation of profits and/or the liquidation of positions), and settlement issues related to local clearing houses are also important risk factors to be considered. The sensitivity of fixed income instruments to macroeconomic shocks may be mitigated by indexing the contracted cash flows to inflation, to FX depreciation, or to specified interest rates – these are common in emerging markets. It is important to note that the index fixings may -- by construction -- lag or mis-measure the actual move in the underlying variables they are intended to track. The choice of the proper fixing (or metric) is particularly important in swaps markets, where floating coupon rates (i.e., coupons indexed to a typically short-dated interest rate reference index) are exchanged for fixed coupons. It is also important to acknowledge that funding in a currency that differs from the currency in which coupons are denominated carries FX risk. Naturally, options on swaps (swaptions) also bear the risks typical to options in addition to the risks related to rates movements. Derivative transactions involve numerous risks including, among others, market, counterparty default and illiquidity risk. The appropriateness or otherwise of these products for use by investors is dependent on the investors' own circumstances including their tax position, their regulatory environment and the nature of their other assets and liabilities, and as such, investors should take expert legal and financial advice before entering into any transaction similar to or inspired by the contents of this publication. The risk of loss in futures trading and options, foreign or domestic, can be substantial. As a result of the high degree of leverage obtainable in futures and options trading, losses may be incurred that are greater than the amount of funds initially deposited. Trading in options involves risk and is not suitable for all investors. Prior to buying or selling an option investors must review the "Characteristics and Risks of Standardized Options”, at http://www.optionsclearing.com/about/publications/character-risks.jsp. If you are unable to access the website please contact your Deutsche Bank representative for a copy of this important document.

Research
Deutsche Bank Parag Thatte | (+1) 212 250-6605 | [email protected] October 21 2016
23
Participants in foreign exchange transactions may incur risks arising from several factors, including the following: ( i) exchange rates can be volatile and are subject to large fluctuations; ( ii) the value of currencies may be affected by numerous market factors, including world and national economic, political and regulatory events, events in equity and debt markets and changes in interest rates; and (iii) currencies may be subject to devaluation or government imposed exchange controls which could affect the value of the currency. Investors in securities such as ADRs, whose values are affected by the currency of an underlying security, effectively assume currency risk. Unless governing law provides otherwise, all transactions should be executed through the Deutsche Bank entity in the investor's home jurisdiction. Aside from within this report, important conflict disclosures can also be found at https://gm.db.com/equities under the "Disclosures Lookup" and "Legal" tabs. Investors are strongly encouraged to review this information before investing. United States: Approved and/or distributed by Deutsche Bank Securities Incorporated, a member of FINRA, NFA and SIPC. Analysts located outside of the United States are employed by non-US affiliates that are not subject to FINRA regulations. Germany: Approved and/or distributed by Deutsche Bank AG, a joint stock corporation with limited liability incorporated in the Federal Republic of Germany with its principal office in Frankfurt am Main. Deutsche Bank AG is authorized under German Banking Law and is subject to supervision by the European Central Bank and by BaFin, Germany’s Federal Financial Supervisory Authority. United Kingdom: Approved and/or distributed by Deutsche Bank AG acting through its London Branch at Winchester House, 1 Great Winchester Street, London EC2N 2DB. Deutsche Bank AG in the United Kingdom is authorised by the Prudential Regulation Authority and is subject to limited regulation by the Prudential Regulation Authority and Financial Conduct Authority. Details about the extent of our authorisation and regulation are available on request. Hong Kong: Distributed by Deutsche Bank AG, Hong Kong Branch. India: Prepared by Deutsche Equities India Pvt Ltd, which is registered by the Securities and Exchange Board of India (SEBI) as a stock broker. Research Analyst SEBI Registration Number is INH000001741. DEIPL may have received administrative warnings from the SEBI for breaches of Indian regulations. Japan: Approved and/or distributed by Deutsche Securities Inc.(DSI). Registration number - Registered as a financial instruments dealer by the Head of the Kanto Local Finance Bureau (Kinsho) No. 117. Member of associations: JSDA, Type II Financial Instruments Firms Association and The Financial Futures Association of Japan. Commissions and risks involved in stock transactions - for stock transactions, we charge stock commissions and consumption tax by multiplying the transaction amount by the commission rate agreed with each customer. Stock transactions can lead to losses as a result of share price fluctuations and other factors. Transactions in foreign stocks can lead to additional losses stemming from foreign exchange fluctuations. We may also charge commissions and fees for certain categories of investment advice, products and services. Recommended investment strategies, products and services carry the risk of losses to principal and other losses as a result of changes in market and/or economic trends, and/or fluctuations in market value. Before deciding on the purchase of financial products and/or services, customers should carefully read the relevant disclosures, prospectuses and other documentation. "Moody's", "Standard & Poor's", and "Fitch" mentioned in this report are not registered credit rating agencies in Japan unless Japan or "Nippon" is specifically designated in the name of the entity. Reports on Japanese listed companies not written by analysts of DSI are written by Deutsche Bank Group's analysts with the coverage companies specified by DSI. Some of the foreign securities stated on this report are not disclosed according to the Financial Instruments and Exchange Law of Japan. Korea: Distributed by Deutsche Securities Korea Co. South Africa: Deutsche Bank AG Johannesburg is incorporated in the Federal Republic of Germany (Branch Register Number in South Africa: 1998/003298/10). Singapore: by Deutsche Bank AG, Singapore Branch or Deutsche Securities Asia Limited, Singapore Branch (One Raffles Quay #18-00 South Tower Singapore 048583, +65 6423 8001), which may be contacted in respect of any matters arising from, or in connection with, this report. Where this report is issued or promulgated in Singapore to a person who is not an accredited investor, expert investor or institutional investor (as defined in the applicable Singapore laws and regulations), they accept legal responsibility to such person for its contents. Taiwan: Information on securities/investments that trade in Taiwan is for your reference only. Readers should independently evaluate investment risks and are solely responsible for their investment decisions. Deutsche Bank research may not be distributed to the Taiwan public media or quoted or used by the Taiwan public media without written consent. Information on securities/instruments that do not trade in Taiwan is for informational purposes only and is not to be construed as a recommendation to trade in such securities/instruments. Deutsche Securities Asia Limited, Taipei Branch may not execute transactions for clients in these securities/instruments. Qatar: Deutsche Bank AG in the Qatar Financial Centre (registered no. 00032) is regulated by the Qatar Financial Centre Regulatory Authority. Deutsche Bank AG - QFC Branch may only undertake the financial services activities that fall within the scope of its existing QFCRA license. Principal place of business in the QFC: Qatar Financial Centre, Tower, West Bay, Level 5, PO Box 14928, Doha, Qatar. This information has been distributed by Deutsche Bank AG. Related financial products or services are only available to Business Customers, as defined by the Qatar Financial Centre Regulatory Authority.
Research
Deutsche Bank Parag Thatte | (+1) 212 250-6605 | [email protected] October 21 2016
24
Russia: This information, interpretation and opinions submitted herein are not in the context of, and do not constitute, any appraisal or evaluation activity requiring a license in the Russian Federation. Kingdom of Saudi Arabia: Deutsche Securities Saudi Arabia LLC Company, (registered no. 07073-37) is regulated by the Capital Market Authority. Deutsche Securities Saudi Arabia may only undertake the financial services activities that fall within the scope of its existing CMA license. Principal place of business in Saudi Arabia: King Fahad Road, Al Olaya District, P.O. Box 301809, Faisaliah Tower - 17th Floor, 11372 Riyadh, Saudi Arabia. United Arab Emirates: Deutsche Bank AG in the Dubai International Financial Centre (registered no. 00045) is regulated by the Dubai Financial Services Authority. Deutsche Bank AG - DIFC Branch may only undertake the financial services activities that fall within the scope of its existing DFSA license. Principal place of business in the DIFC: Dubai International Financial Centre, The Gate Village, Building 5, PO Box 504902, Dubai, U.A.E. This information has been distributed by Deutsche Bank AG. Related financial products or services are only available to Professional Clients, as defined by the Dubai Financial Services Authority. Australia: Retail clients should obtain a copy of a Product Disclosure Statement (PDS) relating to any financial product referred to in this report and consider the PDS before making any decision about whether to acquire the product. Please refer to Australian specific research disclosures and related information at https://australia.db.com/australia/content/research-information.html Australia and New Zealand: This research is intended only for "wholesale clients" within the meaning of the Australian Corporations Act and New Zealand Financial Advisors Act respectively. Additional information relative to securities, other financial products or issuers discussed in this report is available upon request. This report may not be reproduced, distributed or published without Deutsche Bank's prior written consent. Copyright © 2016 Deutsche Bank AG