deutsche beteiligungs ag - dbag-website · 2017-06-09 · homag group ag, schopfloch 788.8 5,038...
TRANSCRIPT
1
HAL F - Y EAR LY R E SUL TS 2 0 13 / 2 0 14
D E U T S C H E B E T E I L I G U N G S A G
1 3 J UN E 2 0 1 4
2
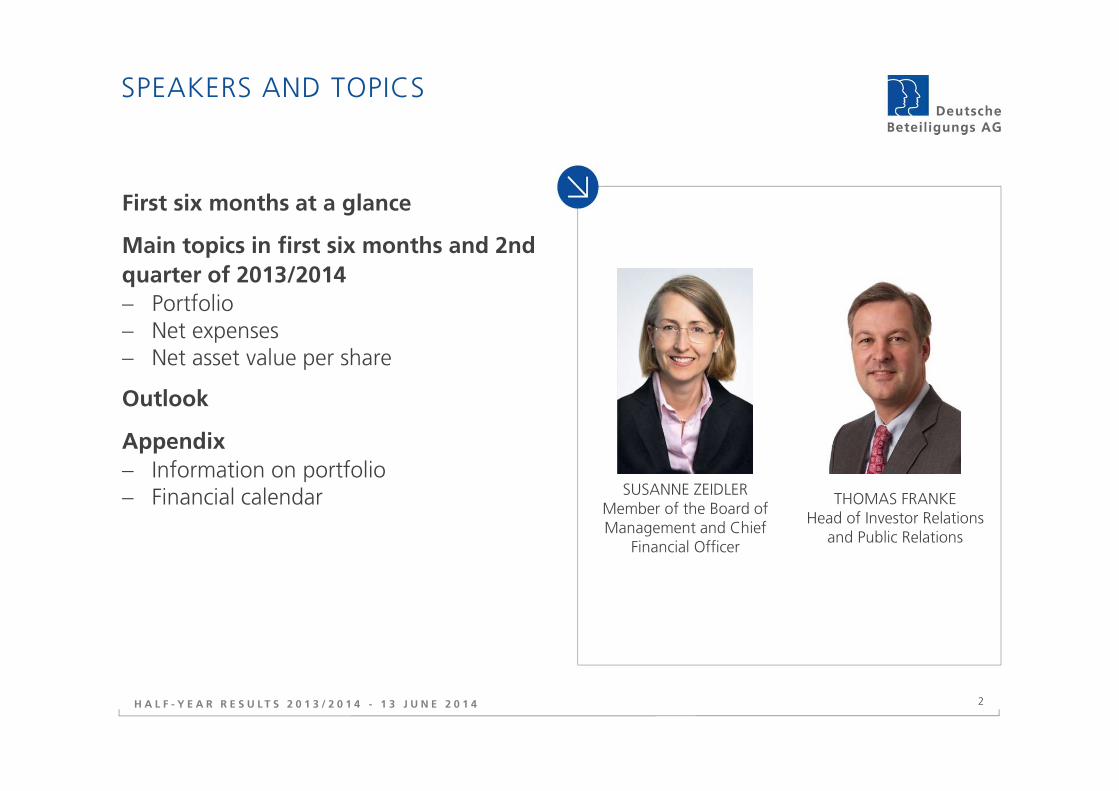
SPEAKERS AND TOPICS
First six months at a glance
Main topics in first six months and 2nd
quarter of 2013/2014
− Portfolio− Net expenses− Net asset value per share
Outlook
Appendix
− Information on portfolio− Financial calendar
H A L F - Y E A R R E S U L T S 2 0 1 3 / 2 0 1 4 - 1 3 J U N E 2 0 1 4
SUSANNE ZEIDLERMember of the Board of Management and Chief
Financial Officer
THOMAS FRANKEHead of Investor Relations
and Public Relations

3
FIRST SIX MONTHS OF FINANCIAL YEAR 2013/2014 AT A GLANCE
Consolidated net income
Financial resources
Equity
€18.1mn
€84.8mn
€279.7mn
H1 2013/14 /
30 April 2014
€18.9mn
H1 2012/13 /
31 October 2013
€98.3mn
€278.4mn
H A L F - Y E A R R E S U L T S 2 0 1 3 / 2 0 1 4 - 1 3 J U N E 2 0 1 4

4
VERY GRATIFYING PORTFOLIO PERFORMANCE:11.9 PERCENT INCREASE
Greatest contribution from price rise of
Homag shares (€10.3mn)
Value contribution of carried portfolio
€7.7mn
Two companies no longer valued at cost
after end of one-year holding period
New investment of 5.0 million euros
Five companies still valued at cost
H A L F - Y E A R R E S U L T S 2 0 1 3 / 2 0 1 4 - 1 3 J U N E 2 0 1 4
78.493.0
56.0
66.3
38.3
29.0
31 Oct. 2013 30 Apr. 2014
Valued at costs
Homag shares
Value of carriedportfolio (withoutHomag)
€193.3mn€172.7mn

5H A L F - Y E A R R E S U L T S 2 0 1 3 / 2 0 1 4 - 1 3 J U N E 2 0 1 4
INVESTMENT OF €14.8MN TO DATE IN FY 2013/2014 (1/2)
Romaco Group acquires IMA Kilian
− Add-on investment in portfolio− DBAG invests €3.5mn− Expansion in range of services to
pharmaceutical industry to include process technology: machines for pressing tablets
Inexio receives additional funding through
profit-sharing certificates
− Follow-on investment− DBAG invests €1.4mn to finance continued
strong growth
DBAG sponsors MBO of Dahlback (in future
called “Unser Heimatbäcker”)
− DBAG invests up to €9.9mn

6H A L F - Y E A R R E S U L T S 2 0 1 3 / 2 0 1 4 - 1 3 J U N E 2 0 1 4
NEW INVESTMENT IN FY 2013/2014 (2/2) –DAHLBACK (“UNSER HEIMATBÄCKER”)
Investment
− €9.9mn for 15.7% of the shares− ~ 67 percent of the shares owned by
DBAG Fund VI − Rest of shares held by founding family and
management
Development approach: expansion of market
position by means of
− proactively shaping the consolidation process− further implementing the “Lila Bäcker”
concept

7
SUPPORTING THE PORTFOLIO COMPANIES’ DEVELOPMENT
“Packaging” (packaging ma-
chines for pharma-ceutical industry)
IMA Kilian (tablet press machines for pharmaceutical
industry)
“Processing” (FrymaKoruma) food processing
(cold)
H A L F - Y E A R R E S U L T S 2 0 1 3 / 2 0 1 4 - 1 3 J U N E 2 0 1 4
“Processing” (FrymaKoruma)
Food processinglines (thermal)+
+
8
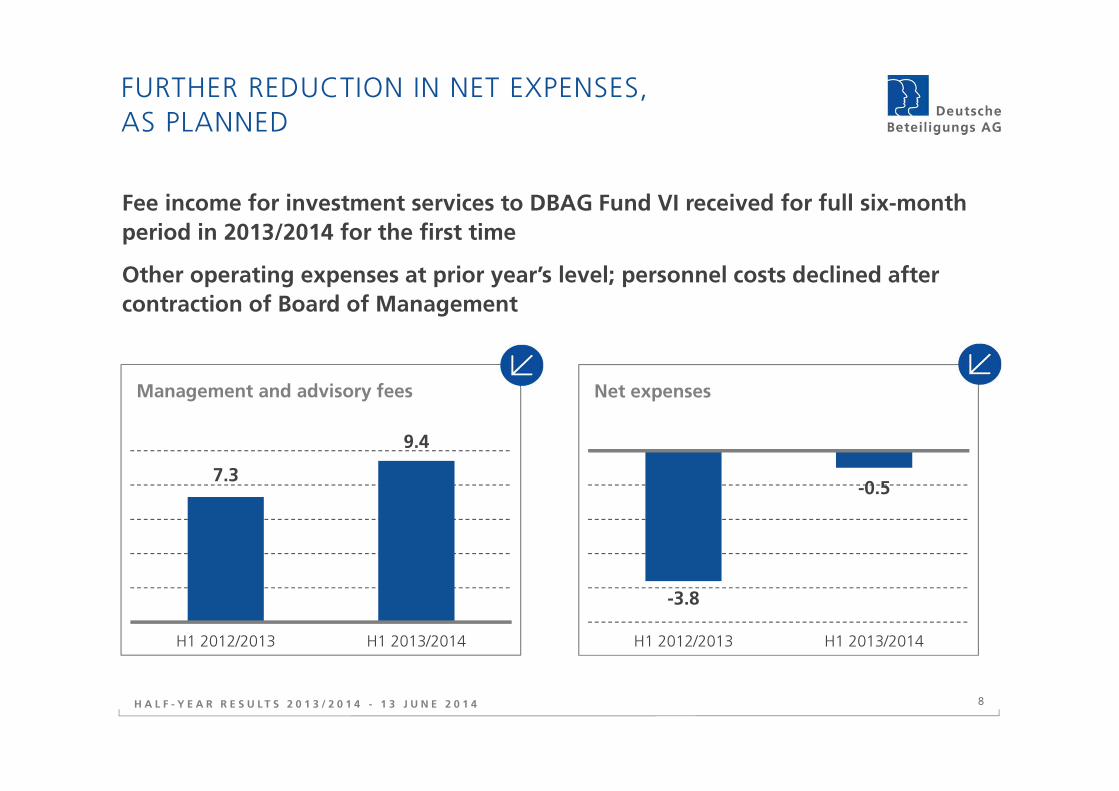
FURTHER REDUCTION IN NET EXPENSES, AS PLANNED
Fee income for investment services to DBAG Fund VI received for full six-month
period in 2013/2014 for the first time
Other operating expenses at prior year’s level; personnel costs declined after
contraction of Board of Management
H A L F - Y E A R R E S U L T S 2 0 1 3 / 2 0 1 4 - 1 3 J U N E 2 0 1 4
7.3
9.4
H1 2012/2013 H1 2013/2014
Management and advisory fees
-3.8
-0.5
H1 2012/2013 H1 2013/2014
Net expenses
9
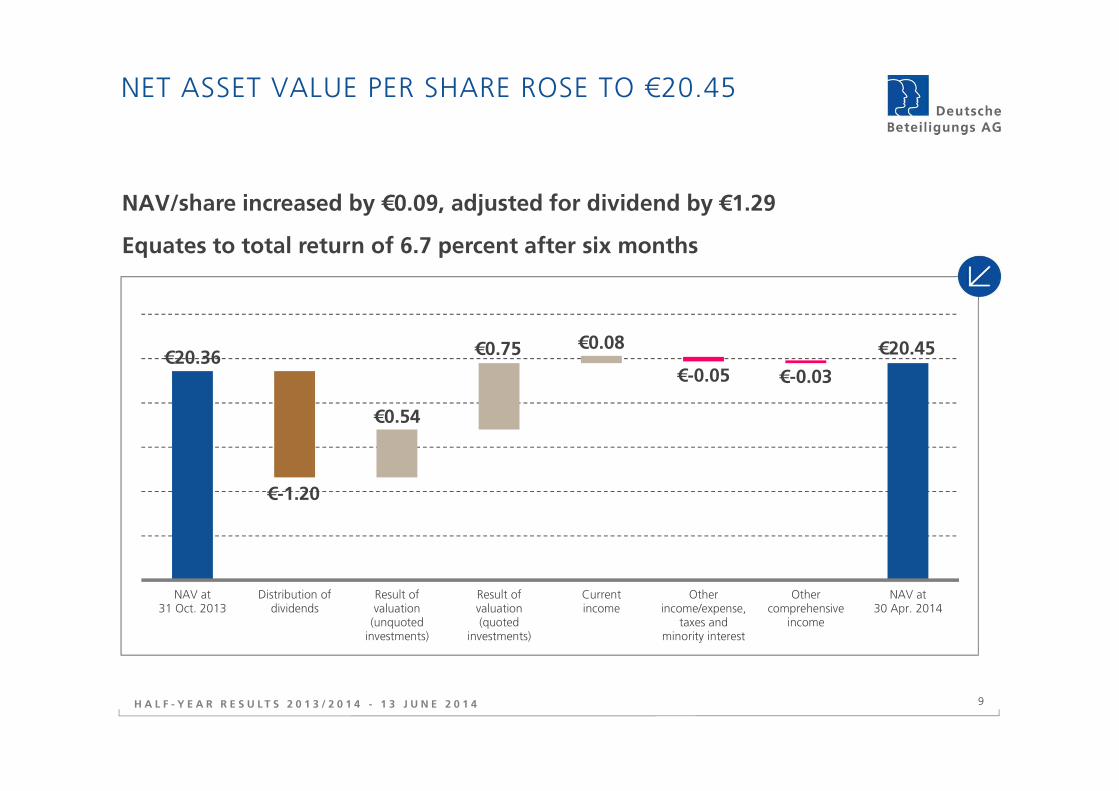
NET ASSET VALUE PER SHARE ROSE TO €20.45
NAV/share increased by €0.09, adjusted for dividend by €1.29
Equates to total return of 6.7 percent after six months
H A L F - Y E A R R E S U L T S 2 0 1 3 / 2 0 1 4 - 1 3 J U N E 2 0 1 4
€20.36€20.45
€-1.20
€0.54
€0.75 €0.08
€-0.05 €-0.03
NAV at31 Oct. 2013
Distribution ofdividends
Result ofvaluation(unquotedinvestments)
Result ofvaluation(quoted
investments)
Currentincome
Otherincome/expense,
taxes andminority interest
Othercomprehensive
income
NAV at30 Apr. 2014

10
OUTLOOK: FORECAST UNCHANGED
Forecasts for 2013/2014:
− "Continuation of high rate of investments"
− "Higher contribution from portfolio of non-listed holdings"
− "No forecast of Homag’s future share price as at 31 October 2014"
− "Expense ratio below 3%"
Status after first six months:
− Attractive deal pipeline
− No further rise in value of non-listed portfolio in Q2 only for reasons of reporting date
− Higher Homag share price (currently)
− Costs on target
"Overall, consolidated net income clearly below the previous year"
"Cost of equity serves as minimum expected return"
H A L F - Y E A R R E S U L T S 2 0 1 3 / 2 0 1 4 - 1 3 J U N E 2 0 1 4
11
APPENDIX
H A L F - Y E A R R E S U L T S 2 0 1 3 / 2 0 1 4 - 1 3 J U N E 2 0 1 4
12
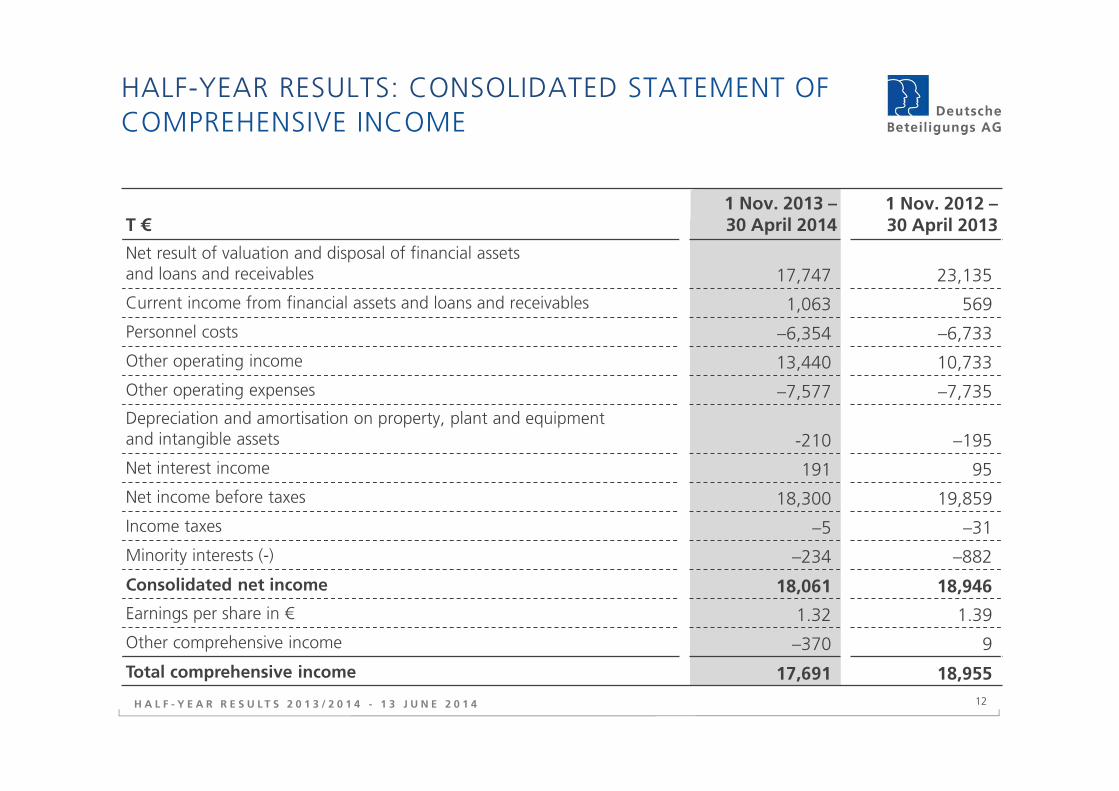
T €1 Nov. 2013 –30 April 2014
1 Nov. 2012 –30 April 2013
Net result of valuation and disposal of financial assetsand loans and receivables 17,747 23,135
Current income from financial assets and loans and receivables 1,063 569
Personnel costs –6,354 –6,733
Other operating income 13,440 10,733
Other operating expenses –7,577 –7,735
Depreciation and amortisation on property, plant and equipment and intangible assets -210 –195
Net interest income 191 95
Net income before taxes 18,300 19,859
Income taxes –5 –31
Minority interests (-) –234 –882
Consolidated net income 18,061 18,946
Earnings per share in € 1.32 1.39
Other comprehensive income –370 9
Total comprehensive income 17,691 18,955
HALF-YEAR RESULTS: CONSOLIDATED STATEMENT OF COMPREHENSIVE INCOME
H A L F - Y E A R R E S U L T S 2 0 1 3 / 2 0 1 4 - 1 3 J U N E 2 0 1 4
13
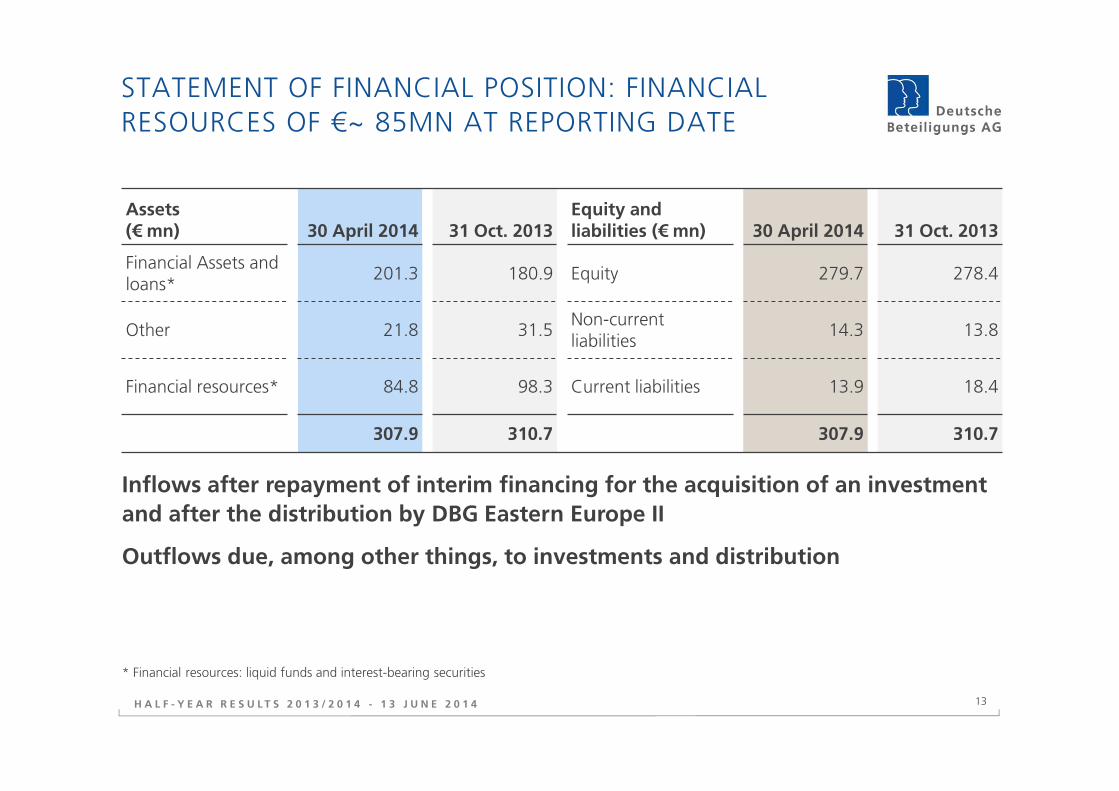
STATEMENT OF FINANCIAL POSITION: FINANCIAL RESOURCES OF €~ 85MN AT REPORTING DATE
Assets(€ mn) 30 April 2014 31 Oct. 2013
Equity andliabilities (€ mn) 30 April 2014 31 Oct. 2013
Financial Assets andloans*
201.3 180.9 Equity 279.7 278.4
Other 21.8 31.5Non-currentliabilities
14.3 13.8
Financial resources* 84.8 98.3 Current liabilities 13.9 18.4
307.9 310.7 307.9 310.7
Inflows after repayment of interim financing for the acquisition of an investment
and after the distribution by DBG Eastern Europe II
Outflows due, among other things, to investments and distribution
* Financial resources: liquid funds and interest-bearing securities
H A L F - Y E A R R E S U L T S 2 0 1 3 / 2 0 1 4 - 1 3 J U N E 2 0 1 4

14
PORTFOLIO (IFRS VALUE)
Number of investments
Value as at 30 April 2014 (IFRS)
Management buyouts 11 €167.4 mn
Growth financing (minority stakes) 6 €17.3 mn
International fund investments 3 €8.6 mn
Total portfolio 20 €193.3 mn
H A L F - Y E A R R E S U L T S 2 0 1 3 / 2 0 1 4 - 1 3 J U N E 2 0 1 4

15
TEN INVESTMENTS ACCOUNT FOR 85% OF PORTFOLIO VOLUME* (IFRS)
Company(alphabetical order)
Investment (acquisition cost, € mn)
DBAG equity share (%) Sector
Broetje-Automation GmbH 5.6 18.8Mechanical engineering and plant construction
Clyde-Bergemann Group 9.2 17.8Mechanical engineering and plant construction
FDG S.A. 4.9 15.5 Industrial services
Formel D GmbH 10.4 15.1 Industrial services
Grohmann GmbH 2.1 25.1Mechanical engineering and plant construction
Heytex Bramsche GmbH 6.4 17.0 Specialty chemicals
Homag Group AG 27.5 20.1Mechanical engineering and plant construction
Romaco GmbH 11.2 18.7Mechanical engineering and plant construction
Schülerhilfe 9.8 15.3 Education
Spheros GmbH 13.9 15.7 Automotive suppliers
Status: 30 April 2014* Portfolio volume: financial assets not including shares in shelf companies or companies largely attributable to third parties
H A L F - Y E A R R E S U L T S 2 0 1 3 / 2 0 1 4 - 1 3 J U N E 2 0 1 4
16
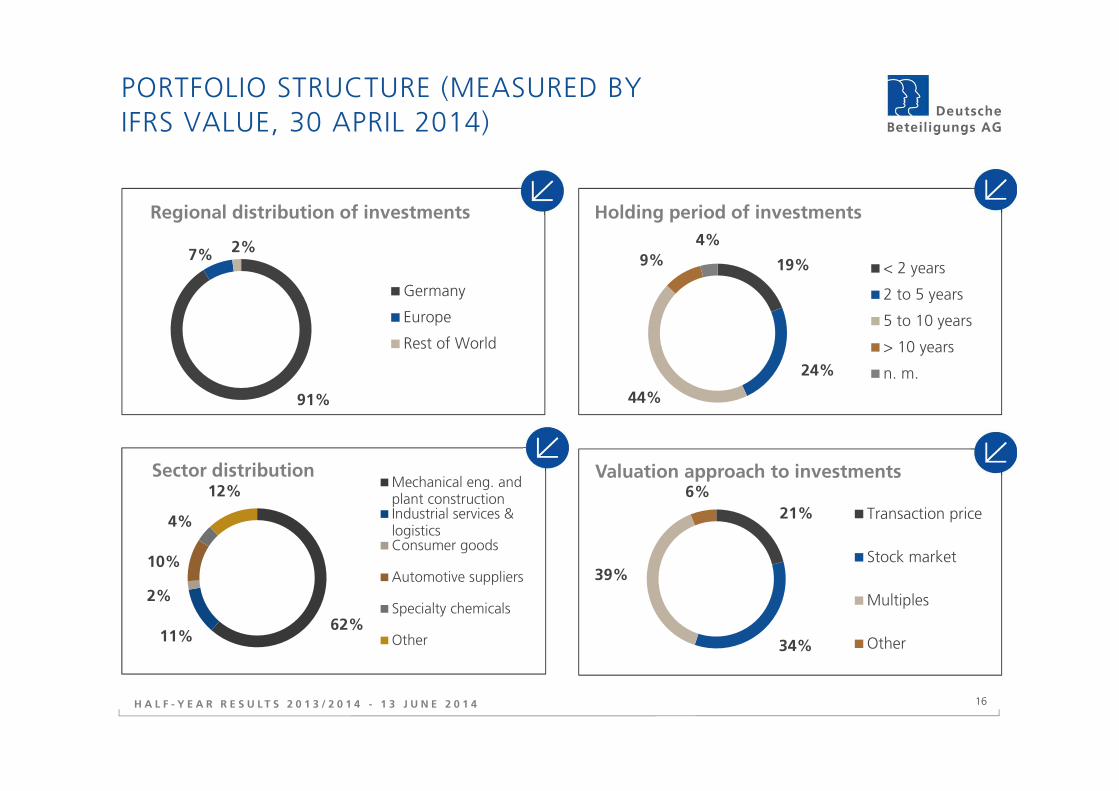
PORTFOLIO STRUCTURE (MEASURED BY IFRS VALUE, 30 APRIL 2014)
H A L F - Y E A R R E S U L T S 2 0 1 3 / 2 0 1 4 - 1 3 J U N E 2 0 1 4
91%
7% 2%
Regional distribution of investments
Germany
Europe
Rest of World
62%11%
2%
10%
4%
12%
Sector distributionMechanical eng. andplant constructionIndustrial services &logisticsConsumer goods
Automotive suppliers
Specialty chemicals
Other
19%
24%
44%
9%
4%
Holding period of investments
< 2 years
2 to 5 years
5 to 10 years
> 10 years
n. m.
21%
34%
39%
6%Valuation approach to investments
Transaction price
Stock market
Multiples
Other

17
PORTFOLIO: CURRENT INVESTMENTS OF HIGH QUALITY
Current portfolio value based on 2014 budgets
2014 budgets largely exceed 2013 results
Basis: Portfolio value as at 30 April 2014, less interest in legacy portfolio (retention for warranties), DBG Eastern Europe, Harvest Partners andHSBC PE India; net debt and EBITDA for 2014 forecast by portfolio companies and analysts (Homag Group AG; 2014).
H A L F - Y E A R R E S U L T S 2 0 1 3 / 2 0 1 4 - 1 3 J U N E 2 0 1 4
2%
57%
41%
Portfolio according to underlying EBITDA multiple
< 4.0 4.0 - < 6.0 >= 6.0x
53%
23%
20%
4%
Equity according to net debt/EBITDA for 2014
< 1.0 1.0 - < 2.0 2.0 - < 3.0 > 3.0
18
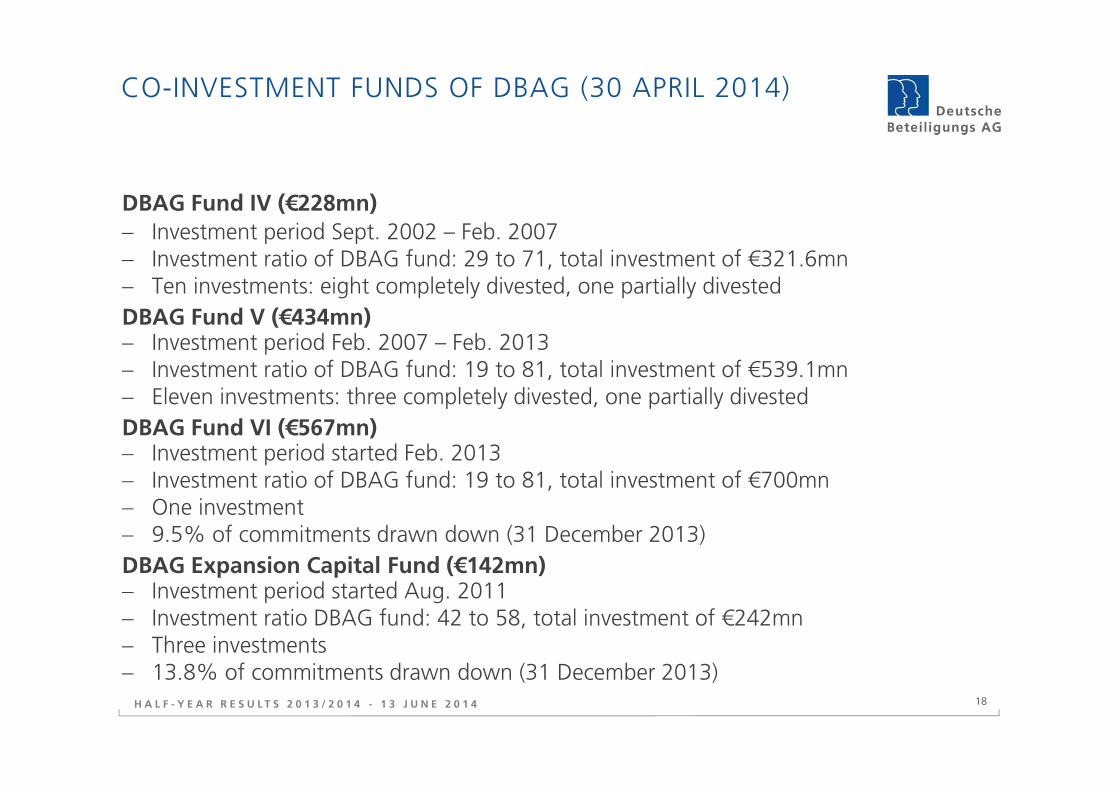
CO-INVESTMENT FUNDS OF DBAG (30 APRIL 2014)
DBAG Fund IV (€228mn)
− Investment period Sept. 2002 – Feb. 2007− Investment ratio of DBAG fund: 29 to 71, total investment of €321.6mn− Ten investments: eight completely divested, one partially divested
DBAG Fund V (€434mn)− Investment period Feb. 2007 – Feb. 2013− Investment ratio of DBAG fund: 19 to 81, total investment of €539.1mn− Eleven investments: three completely divested, one partially divested
DBAG Fund VI (€567mn)− Investment period started Feb. 2013− Investment ratio of DBAG fund: 19 to 81, total investment of €700mn− One investment− 9.5% of commitments drawn down (31 December 2013)
DBAG Expansion Capital Fund (€142mn)− Investment period started Aug. 2011− Investment ratio DBAG fund: 42 to 58, total investment of €242mn− Three investments − 13.8% of commitments drawn down (31 December 2013)
H A L F - Y E A R R E S U L T S 2 0 1 3 / 2 0 1 4 - 1 3 J U N E 2 0 1 4
19
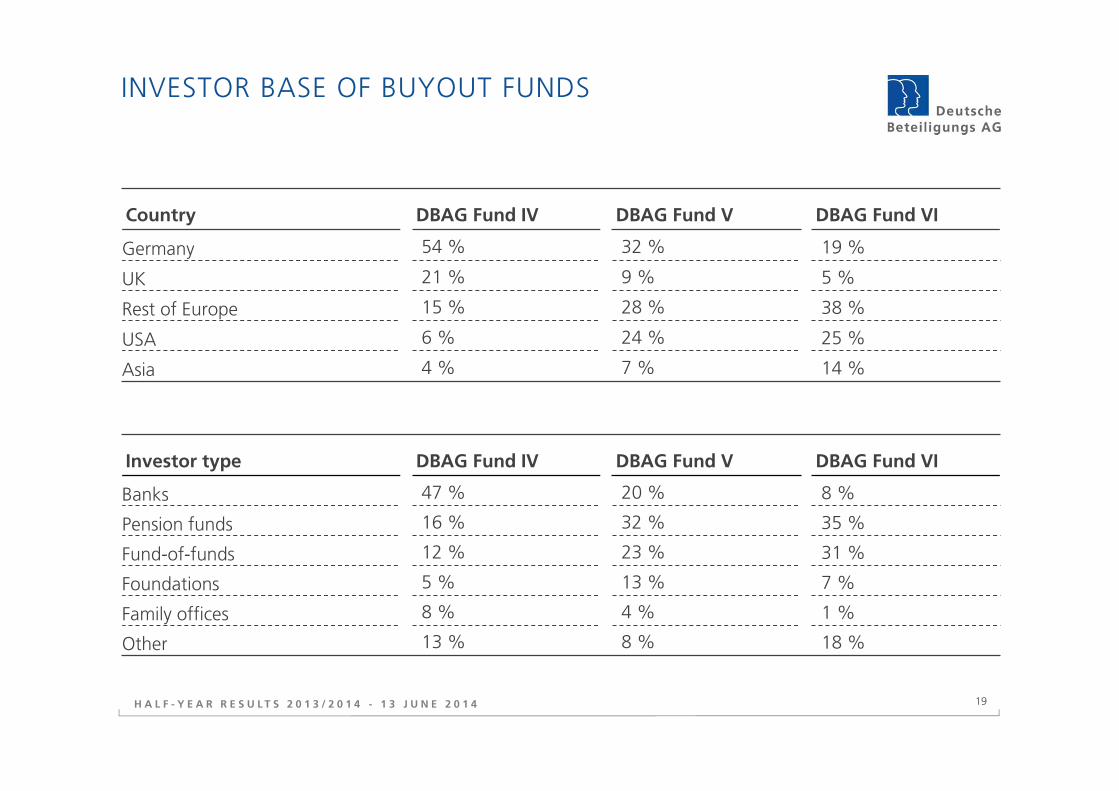
INVESTOR BASE OF BUYOUT FUNDS
H A L F - Y E A R R E S U L T S 2 0 1 3 / 2 0 1 4 - 1 3 J U N E 2 0 1 4
Country DBAG Fund IV DBAG Fund V DBAG Fund VI
Germany 54 % 32 % 19 %
UK 21 % 9 % 5 %
Rest of Europe 15 % 28 % 38 %
USA 6 % 24 % 25 %
Asia 4 % 7 % 14 %
Investor type DBAG Fund IV DBAG Fund V DBAG Fund VI
Banks 47 % 20 % 8 %
Pension funds 16 % 32 % 35 %
Fund-of-funds 12 % 23 % 31 %
Foundations 5 % 13 % 7 %
Family offices 8 % 4 % 1 %
Other 13 % 8 % 18 %

20
CURRENT PORTFOLIO COMPANIES (I)
Company2013 Reven.in € mn Employees Core business Markets
Broetje-Automation GmbH, Wiefelstede
87.3(FY 12/13) 500
Development and production ofmachinery and equipment for automated assembly of aircraft Worldwide
Clyde-Bergemann Group, Wesel/Glasgow/Delaware
544.8(US $; FY 13/14) 1,700
Development and production of components for power plants Worldwide
DNS:NET Internet Service GmbH, Berlin 10.7* 30
Telecommunication and IT services based on high-quality fibre-optic infrastructure Germany
FDG S.A.,Orly, France 110.0 760
Services for supermarkets in France and other countries
France, neigh-bouring countries
Formel D GmbH,Troisdorf 137.1 3,300
Services for automobile manufacturers and their suppliers Worldwide
Status: 30 April 2014* preliminary/forecast
H A L F - Y E A R R E S U L T S 2 0 1 3 / 2 0 1 4 - 1 3 J U N E 2 0 1 4
21
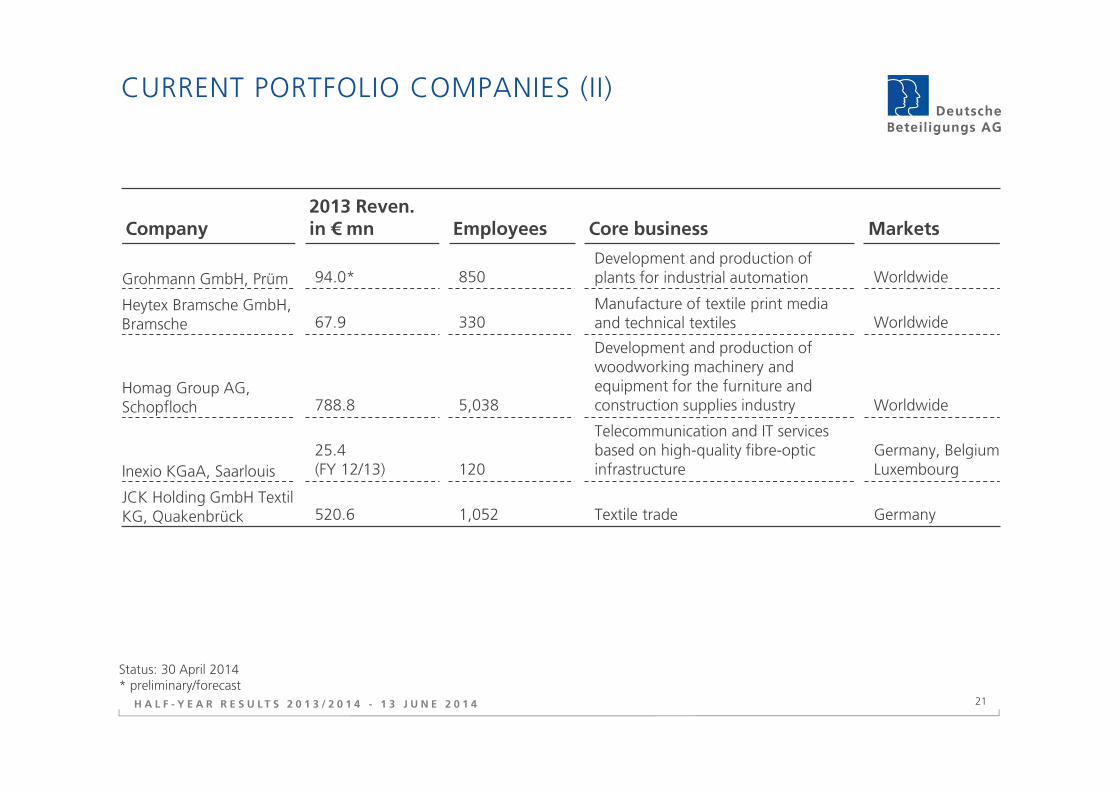
CURRENT PORTFOLIO COMPANIES (II)
Company2013 Reven.in € mn Employees Core business Markets
Grohmann GmbH, Prüm 94.0* 850Development and production of plants for industrial automation Worldwide
Heytex Bramsche GmbH, Bramsche 67.9 330
Manufacture of textile print media and technical textiles Worldwide
Homag Group AG, Schopfloch 788.8 5,038
Development and production of woodworking machinery and equipment for the furniture and construction supplies industry Worldwide
Inexio KGaA, Saarlouis25.4(FY 12/13) 120
Telecommunication and IT services based on high-quality fibre-optic infrastructure
Germany, Belgium, Luxembourg
JCK Holding GmbH Textil KG, Quakenbrück 520.6 1,052 Textile trade Germany
H A L F - Y E A R R E S U L T S 2 0 1 3 / 2 0 1 4 - 1 3 J U N E 2 0 1 4
Status: 30 April 2014* preliminary/forecast
22
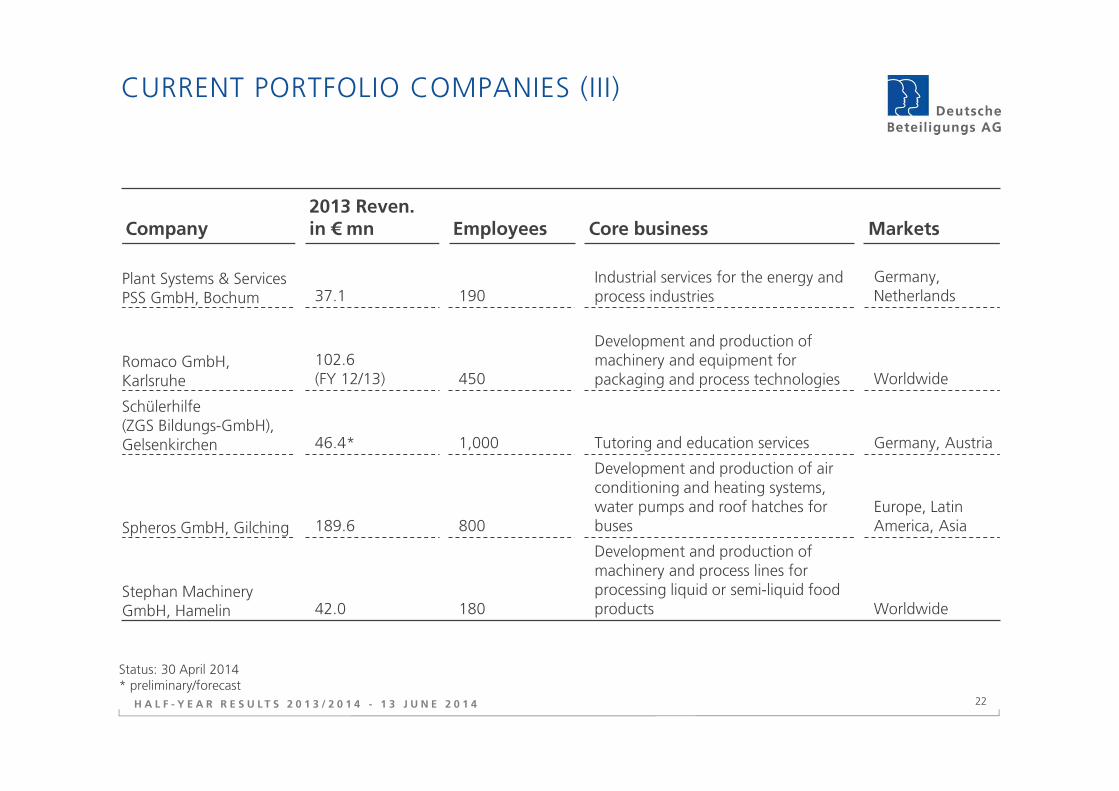
CURRENT PORTFOLIO COMPANIES (III)
Company2013 Reven.in € mn Employees Core business Markets
Plant Systems & Services PSS GmbH, Bochum 37.1 190
Industrial services for the energy and process industries
Germany, Netherlands
Romaco GmbH, Karlsruhe
102.6(FY 12/13) 450
Development and production of machinery and equipment for packaging and process technologies Worldwide
Schülerhilfe(ZGS Bildungs-GmbH), Gelsenkirchen 46.4* 1,000 Tutoring and education services Germany, Austria
Spheros GmbH, Gilching 189.6 800
Development and production of air conditioning and heating systems, water pumps and roof hatches for buses
Europe, Latin America, Asia
Stephan Machinery GmbH, Hamelin 42.0 180
Development and production of machinery and process lines for processing liquid or semi-liquid food products Worldwide
H A L F - Y E A R R E S U L T S 2 0 1 3 / 2 0 1 4 - 1 3 J U N E 2 0 1 4
Status: 30 April 2014* preliminary/forecast

23
SHAREHOLDER STRUCTURE
Free float (as defined by Deutsche Börse) 69.96%
Anchor shareholder Roßmann increased stake to over 25% in August 2012
Shareholder Portabella (Ventos S.A.) increased stake to 5.0% in October 2012
46.8
40.6
25.0
25.0
5.0
5.0
6.4
7.4
6.0
13.1
10.8
7.61.3
Nov. 2012
Sept.2013
SHAREHOLDER STRUCTURE (IN PERCENT) Individual private shareholders
Dirk Roßmann
Anpora Patrimonio
Institutional investors, Germany
Institutional investors, Europe
Institutional investors, USA
Institutional investors, rest ofworld
H A L F - Y E A R R E S U L T S 2 0 1 3 / 2 0 1 4 - 1 3 J U N E 2 0 1 4
24
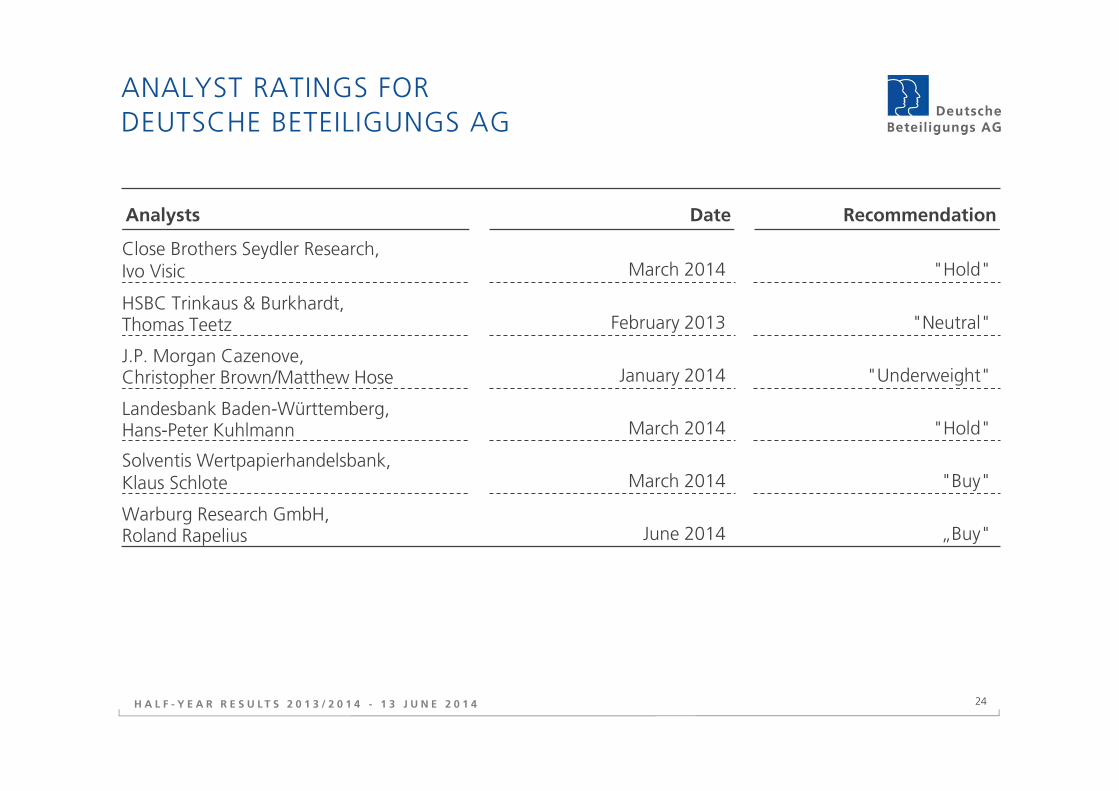
ANALYST RATINGS FORDEUTSCHE BETEILIGUNGS AG
Analysts Date Recommendation
Close Brothers Seydler Research,Ivo Visic March 2014 "Hold"
HSBC Trinkaus & Burkhardt,Thomas Teetz February 2013 "Neutral"
J.P. Morgan Cazenove,Christopher Brown/Matthew Hose January 2014 "Underweight"
Landesbank Baden-Württemberg,Hans-Peter Kuhlmann March 2014 "Hold"
Solventis Wertpapierhandelsbank,Klaus Schlote March 2014 "Buy"
Warburg Research GmbH,Roland Rapelius June 2014 „Buy"
H A L F - Y E A R R E S U L T S 2 0 1 3 / 2 0 1 4 - 1 3 J U N E 2 0 1 4
25
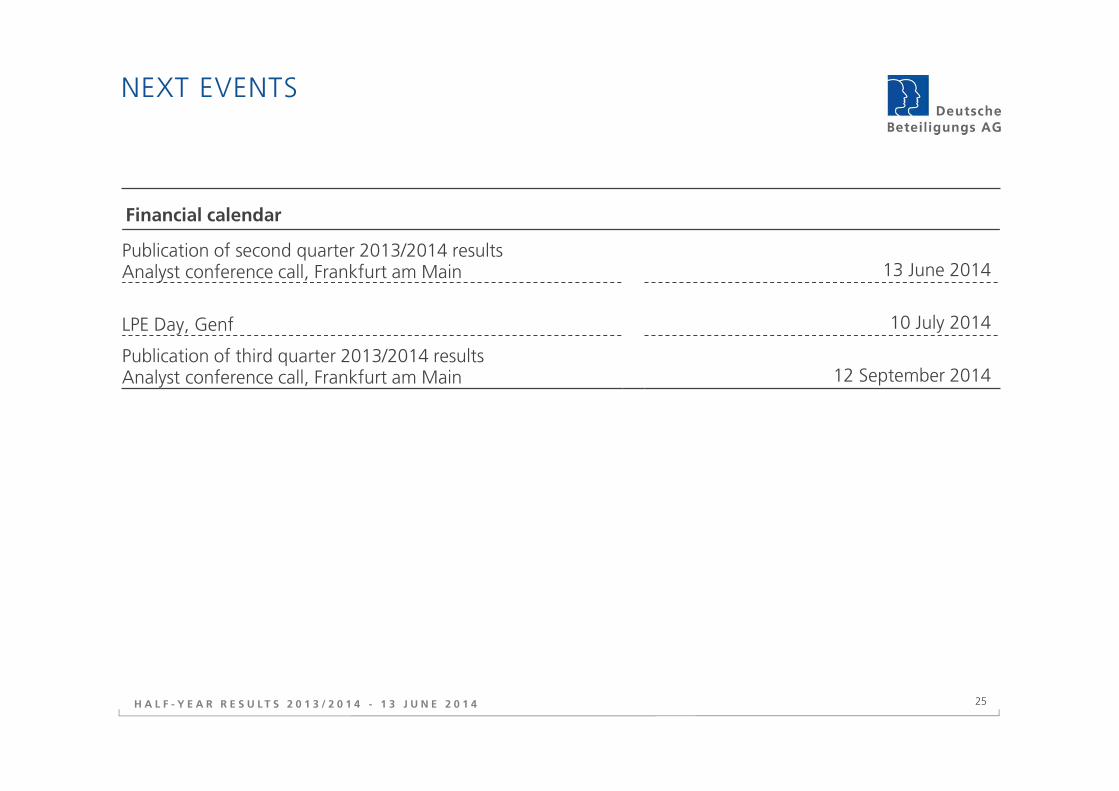
NEXT EVENTS
Financial calendar
Publication of second quarter 2013/2014 resultsAnalyst conference call, Frankfurt am Main 13 June 2014
LPE Day, Genf 10 July 2014
Publication of third quarter 2013/2014 resultsAnalyst conference call, Frankfurt am Main 12 September 2014
H A L F - Y E A R R E S U L T S 2 0 1 3 / 2 0 1 4 - 1 3 J U N E 2 0 1 4
26
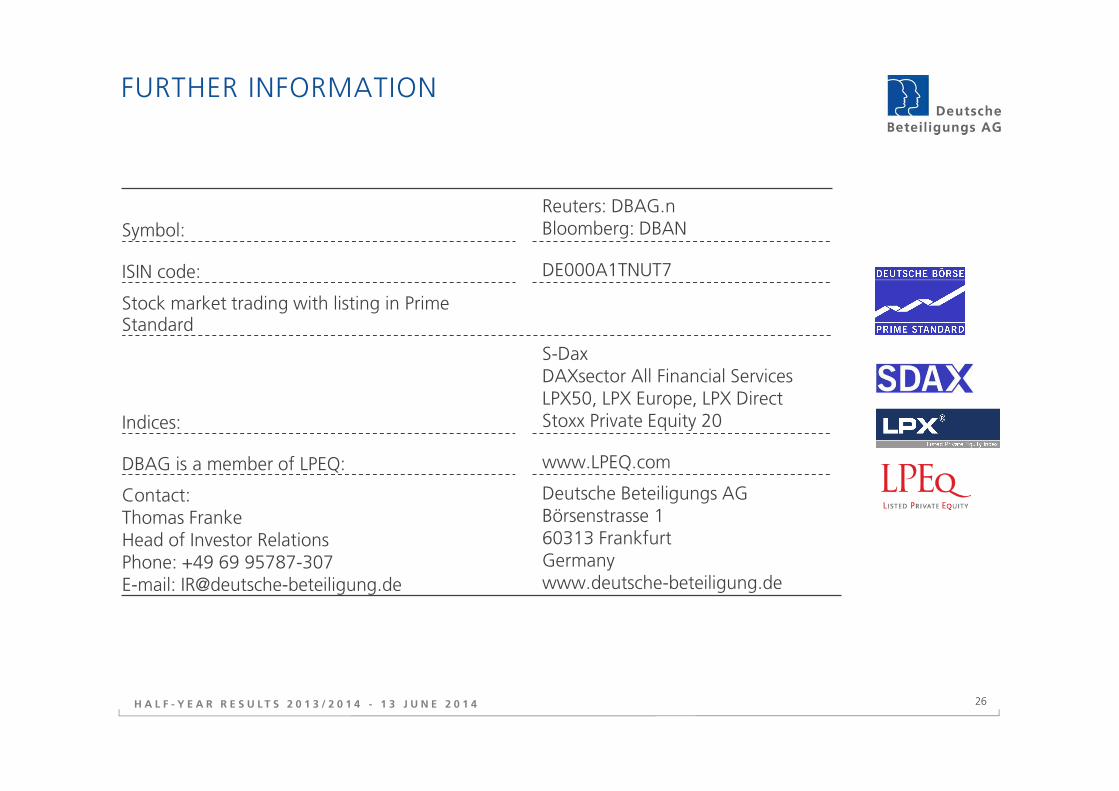
FURTHER INFORMATION
Symbol:Reuters: DBAG.nBloomberg: DBAN
ISIN code: DE000A1TNUT7
Stock market trading with listing in Prime Standard
Indices:
S-DaxDAXsector All Financial Services LPX50, LPX Europe, LPX DirectStoxx Private Equity 20
DBAG is a member of LPEQ: www.LPEQ.com
Contact:Thomas FrankeHead of Investor RelationsPhone: +49 69 95787-307E-mail: [email protected]
Deutsche Beteiligungs AGBörsenstrasse 160313 FrankfurtGermanywww.deutsche-beteiligung.de
H A L F - Y E A R R E S U L T S 2 0 1 3 / 2 0 1 4 - 1 3 J U N E 2 0 1 4
27
FORWARD-LOOKING STATEMENTSINVOLVE RISKS
This presentation contains forward-looking statements. Forward-looking statements are statements that do not describe facts or past events; they also include statements about our assumptions and expectations.
Any statement in this report that states our intentions, assumptions, expectations or predictions and the underlying assumptions is a forward-looking statement. These statements are based on plans, estimates and projections currently available to the Board of Management of Deutsche Beteiligungs AG. Therefore, forward-looking statements only relate to the date on which they are made. We do not assume any obligation to update such statements in light of new information or future events.
Forward-looking statements involve inherent risks and uncertainties. A number of important factors may cause actual events to differ significantly from those in forward-looking statements. Such factors include the conditions in the financial markets in Germany, in Europe, in the United States and elsewhere – the key regions for our investment activities.
H A L F - Y E A R R E S U L T S 2 0 1 3 / 2 0 1 4 - 1 3 J U N E 2 0 1 4