developing a scale of anxiety towards using graphs in
TRANSCRIPT

34
introduction
Human is a biological entity interacting with the cultural stimuli of his birthplace continuously. As a result of their interac-tion with the cultural and social environment, individuals attain several new cognitive, affective or psychomotor behaviors. This process, named as “socialization” or “acculturation”, is mainly a comprehensive learning and teaching process. Learning, which is defined as the permanent changes in behaviors or potential behaviors as a result of experiences (Kızıloluk, 2002), is closely related to knowledge. All actions performed by the human organ-ism are called behaviors; however, all behaviors do not correspond to learning. For example, the temporary behaviors of individuals and the behaviors that occur as a result of an individual’s natural growth and maturation are not considered as learning. There are many criteria affecting learning, which are listed under five titles: learner, learning, learnt, teacher and learning environment. Look-ing at these five features in terms of their affects on learning, it is observed that the last two do not affect learning directly. However, they are quite effective on indirect learning through affecting the other three features. Therefore, factors affecting learning are classified under three titles being related to the learning meth-odology as well as learner and learning equipment (Senemoğlu, 2005; Bacanlı, 2005):
1. Factors Related to the Learning Methodology:a. Structure of the topic to be learnt,b. Time dedicated to learning,c. Feedback,d. Active participation of the student.
2. Factors Related to the Learning Material:a. Perceptual Differentiability,b. Semantic association,c. Conceptual Classification (Concept Maps – Webs).
DeVeLoPInG A sCALe oF AnXIetY toWARDs UsInG GRAPHs In CHeMIstRY CLAsses
nilgün seçkenHacettepe University, Ankara, Turkey
nuray ZanYunus Emre Vocational High School,
Ankara, Turkey
nilgün seçkennuray Zan
Abstract. Graphs are indispensable ele-ments of education in terms of expressing
qualitative and quantitative data and laws of science. Individuals need to have the skill to use graphs. The ability to use
graphs is listed under three groups as inter-pretation skill, modeling skill, transforma-
tion skill. The lack of performing these skills, failing to overcome these challenges
may cause students to develop anxieties towards using graphs. Students’ existing anxieties towards using graphs may pre-
vent the emerging of these skills, reinforce the emerging of the challenges. There-
fore, this study focused on developing a scale for anxiety towards using graphs in chemistry using a draft scale along with
its validity and reliability studies. The reliability and validity analysis of the scale concluded with a one dimensional assess-
ment tool of 15 items with a reliability level of 0,903.
Key words: affective, anxiety, chemistry education, graphic.

35
Journal of Baltic Science Education, Vol. 12, No. 1, 2013
ISSN 1648–3898
3. Factors Related to the Learner:a. Motivation,b. Past experiences (positive & negative transfer),c. Attention,d. Readiness for the type,e. Maturation,f. General state of arousal and anxiety.
General state of arousal and anxiety are considered to be amongst the sub factors affecting learn-ing extensively. The level of arousal is related to the level of an individual’s perception of the stimuli. If the individual perceives little stimuli from the environment or is closed to the external stimuli, then s/he has a low level of arousal. If the individual perceives a lot of external stimuli, then s/he is considered to have a high level of arousal. Regardless of its level, arousal affects learning. In order the affective learn-ing to occur, the level of arousal shall be at the medium (Seven and Engin, 2008). The affect of anxiety on learning is similar to the general level of arousal. Anxiety has entered into the Turkish language with the translation of the “anxiety” concept. Among various definitions, anxiety means the occurring of a thought that something bad would happen and it could not be prevented (Antony, and Swinson, 2000).
According to Tas (Tas, 2011), it is a state of arousal displayed through physical, emotional and mental changes when an individual is face to face with a stimuli. Beck and Steer (Beck and Steer, 1984) defines anxiety as a general state of worry and unpleasantness about potential future events or uncertainties. According to the American Psychology Association (APA, 2010), anxiety is a feeling that is displayed through physical changes such as increase in the blood pressure.
Anxiety is a feeling of fear and worry. In case anxiety starts to affect and individual’s life quality, this could be considered as anxiety disorder (Uçar, 2004). Research on the reasons for anxiety mainly focuses on the state of feeling that experience during an uncertain and uncontrollable situations. It is also individuals considered as a factor reinforcing anxiety when individuals lack some knowledge during knowledge processing process and considers this situation the sign a potential disaster.
Despite its association with negative feelings, anxiety, from a different point of view, is a feeling that exists in all individuals, which shall be experienced at a certain level (Hamarta, 2009). Anxiety at an appro-. Anxiety at an appro- Anxiety at an appro-priate level, help individuals to get motivated, make decisions, proceed and increase performance.
Research on the affects of anxiety in learning concluded that low level of anxiety resulted in low level of productivity, high level of anxiety caused the lowest level of learning while medium level of anxiety lead to high level of productivity (Cuceloğlu, 1997; Gall, 1996;) However, in order learning to occur at the maximum level, the negative effects of anxiety should be minimized. In addition to the personal efforts of students, the environment plays a role in this situation. Students experience anxiety in various lessons due to various reasons during their education years. These anxieties might affect their learning positively or negatively. Students tend to have anxieties through the utilization of graphs in teaching the relations between concepts in Chemistry. Chemistry is a field of science analyzing all substances found in nature. The laws are expressed through a mathematical language in chemistry. Mathematics is a tool frequently made use of in expressing the laws, solving problems and expressing problems. Graphs are quite commonly utilized in chemistry in proceeding these functions. In evaluating the relationship between concepts, in expressing the directions and sizes of these relationships, in organizing and sum-marizing data, graphs are effectively utilized tools. Graphs make it easier for us to see the relationship amongst the large data sets. They are also useful in displaying the relationships that are difficult to express in numbers. For solving the arithmetical and algebraic problems, graphs are functional tools (Beichner, 1994; Ersoy, 2004; Mc Kenzie and Padilla, 1986; Padilla, Mc Kenzie, and Shaw, 1986). The literature was observed to contain various studies on using, understanding and interpreting graphs.
In the study of Beichner’in (1994), it was determined that students have difficulties in explaining position, speed and momentum vs. time graphs and finding slope and interpreting spaces under the slopes.
In the study of McDermott, Rosenquist and Van Zee, (1987), it was expressed that when students have to draw a graph for given any situation, they usually tend to draw linear graphs and prospect for encountering graphs which are consist of regular, symmetrical and sustainable.
DeVeLoPInG A sCALe oF AnXIetY toWARDs UsInG GRAPHs In CHeMIstRY CLAsses(P. 34-46)

36
Journal of Baltic Science Education, Vol. 12, No. 1, 2013
ISSN 1648–3898
In his study, Kwon, (2002) said that middle school students can learn to communicate with graphs in the context of appropriate Calculator-Based Ranger activities. Three issues about Calculator-Based Ranger activities on graphing abilities were addressed in this study:
a) the effect of Calculator-Based Ranger activities on graphing abilities; b) the extent to which prior knowledge about graphing skills affects graphing ability;c) the influence of instructional styles on students’ graphing abilities.
Following the use of Calculator-Based Ranger activities, students’ graphing abilities were significantly more developed in three components interpreting, modeling, and transforming.
However, no studies were found on the anxiety students experience during using graphs.Graphs are indispensable elements of education in terms of expressing qualitative and quantitative
data and laws of science. Therefore, individuals need to have the skill to use graphs. The ability to use graphs is listed under three groups as interpretation skill, modeling skill, transformation skill.
Interpretation skill is related to the verbal expression of a graphic. Modeling skill is the ability to express an observation through a graphic. Transformation skill is creating another graphic by using a graphic related to the same event (Kwon, 2002). Studies concluded that students face some difficulties in drawing graphs or interpreting the drawn graphs as follows:
Students generally tend to draw linear graphs. They also expect to see proper, symmetrical •and continuous graphs.Students tend to draw y = x graphs even though it is not appropriate. •Origin is the essential part of the graphic according to the students and they always tend •to start the graphic from the origin. Most students see graphs as a picture of a situation instead of seeing them as abstract •presentations displaying relationships.Students tend to reverse x and y coordinates and lack the ability to adapt their knowledge •into unfamiliar situations. Students use the scale of 1s or 10s; therefore, they misread the scale. (Kwon, 2002; Hadjid- •emetriou, and Williams, 2002)
As summarized above, students do not only need to have the three skills in order to interpret, draw and organize graphs but also need to overcome these challenges. The lack of performing these skills or failing to overcome these challenges may cause students to develop anxieties towards using graphs. Similarly, students’ existing anxieties towards using graphs may prevent the emerging of these skills or reinforce the emerging of the challenges. Therefore, this study focused on developing a scale for anxiety towards using graphs in chemistry using a draft scale along with its validity and reliability studies.
methodology of research
General Background of Research
The purpose of the study is to develop an assessment tool in order to determine general high school students’ anxieties towards using graphs in chemistry classes and making recommendations for overcoming these anxieties.
Sample of Research
253 students participated in the study. The results , according to their schools, genders, and classes, are shown in Table 1.
DeVeLoPInG A sCALe oF AnXIetY toWARDs UsInG GRAPHs In CHeMIstRY CLAsses(P. 34-46)

37
Journal of Baltic Science Education, Vol. 12, No. 1, 2013
ISSN 1648–3898
table 1. the Distribution of 235 students According to Level of school, Gender and class.
Class Level Female Male Total
Class 1Private high school 3 7 10
Anatolian high school * 1 2 3
Anatolian vocational high school 5 8 13
Total 9 16 26
Class 2
Health vocational high school 6 4 10
Private high school 5 7 12
Anatolian high school * 36 28 64
Anatolian vocational high school 8 7 15
Industrialvocationalhighschool 5 6 11
Total 60 52 112
Class 3
Health vocational Lisesi 14 3 17
Private high school 5 4 9
Anatolian vocational high school * 25 22 47
Industrialvocationalhighschool 12 12 24
Total 56 41 97
* The sample of Anatolian High School consisted of 4 schools: Dr. Rıdvan Binnaz Ege Anatolian High School, Başkent Anatolian High School, Cumhuriyet Anatolian High School, Kurtuluş Anatolian High School.
The socio-economic status of students at private schools are a bit better than the socio-economic status of students at other schools. Giving examples of students from different kinds of schools repre-sents the universe. The students who participated in the study have to take science in primary school, and take physics, chemistry, biology, and mathematics in high school. During their education, when they come across graphics, they have to use their reading, interpreting, translating skills. To give an example, in chemistry lessons (books), the graphics are often used in the units (chapters) of “the state of substance (solid, liquid and gas), speed, balance, acids , bases, and thermodynamics. It was accepted that the sample represents the universe because it was chosen among students who are studying in different types of schools.
Data Analysis
Descriptive statistics were made for each item score and scale scores. For the item analysis, item analysis based on correlations and item analysis technique based on the lower and upper group aver-ages were administered (Murphy and Davidshofer, 1991; Tezbasaran, 1997). For the reliability estimation of the scale, Cronbach α coefficient was used. Additionally, factor analysis was conducted in order to analyze the structure of the scale.
Findings
The anxieties towards using graphs in chemistry classes, as intended to be assessed in this study, express the tendencies towards reacting negatively or positively in relation with the anxiety. In order to write the expressions in the light of the definition above, student opinions were recorded. In line with the items of the anxiety scale, 37 anxiety items were written provided that all these items involved cognitive, affective and behavioral attitudes. The anxiety scale was evaluated by one philologist and
DeVeLoPInG A sCALe oF AnXIetY toWARDs UsInG GRAPHs In CHeMIstRY CLAsses(P. 34-46)

38
Journal of Baltic Science Education, Vol. 12, No. 1, 2013
ISSN 1648–3898
one assessment and evaluation specialist in terms of both grammar and coherence with the item writ-ing principles. Two chemistry field experts, who teach chemistry at the university, were consulted for providing the content validity. The feedback received after the analysis lead to the removal of similar items or items that are difficult to understand. Following this stage, a scale of 33 items was obtained, where negative and positive items were almost equal in number. The responses to the anxiety items were degreed in 5 points. The responders were asked to evaluate each anxiety items in five categories as strongly disagree, disagree, neither agree nor disagree, agree and strongly agree. The responses were scored between 1 and 5 by scoring the most positive category with 5 and the most negative with 1 (Turgut, 1977). Since the number of items in the scale is 33, the lowest expected score was 33.00 and the highest expected score was 165.00 where the difference is 132.00. While positive items are graded as 5, 4, 3, 2, 1 from completely agree to completely disagree, negative items are graded as 1, 2, 3, 4, 5.
After the draft scale was organized in a way to facilitate responding, the application was made. For the validity and reliability of the data collection tool, draft data collection tool form was administered to students studying at M. Rustu Uzel Vocational High School of Chemistry, Dr. Ridvan-Binnaz Ege Ana-tolian High School, Ragip Uner Vocational High School of Medicine, Private Ari High School, Baskent Anatolian High School, Yunus Emre Anatolian Vocational High School, Cumhuriyet High School and Kurtuluş Anatolian High School.
results of research
The item-scale correlations in the draft scale are calculated through the correlation between each item and scale scores. When the scores of the related item is between the limits of the scale scores, the correlation coefficient tends to be higher than it is in reality (Tezbaşaran 1997). Therefore, the scale scores were calculated by ignoring such items as explained above. The calculations concluded that all items had high correlation values with significant results at the level of p<0.05 (p= level of significance).
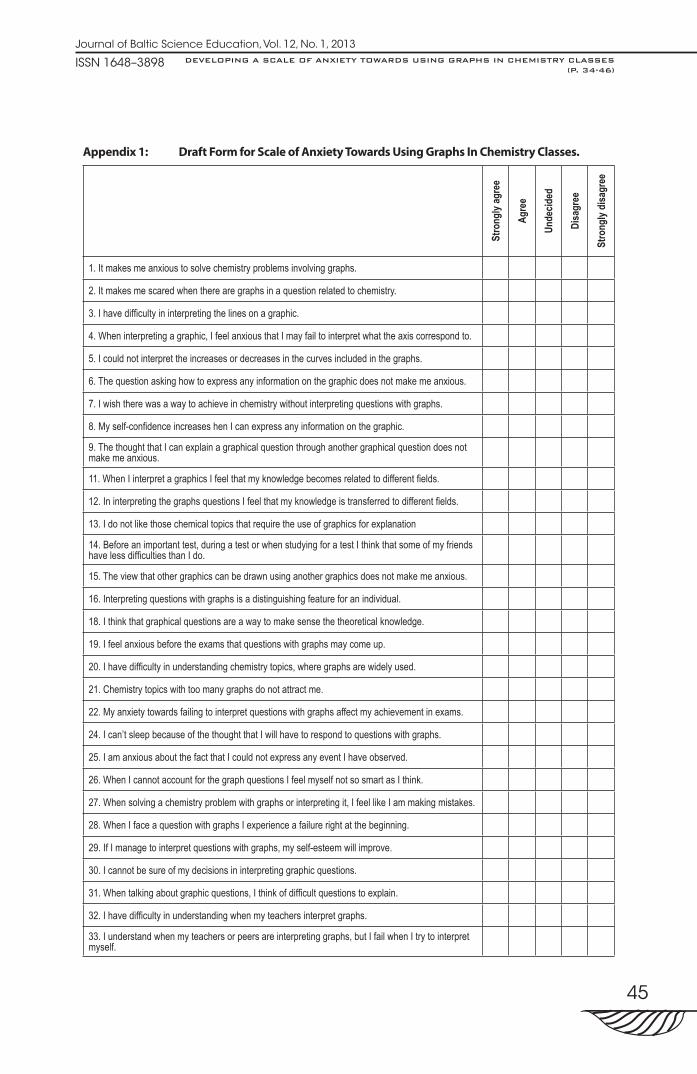
A t-test was administered for the significance of the difference between the averages of the upper and lower groups related to the score distribution of the items in the draft scale. Students with the highest scores were grouped as the 27% upper group; and the students with the lowest scores were grouped as the 27% lower group. The difference between the upper and lower group averages of all items excluding Item 10, 17 and 23 were found to be statistically significant. These items were removed from the scale. The t-test results of the scale with the remaining 30 items (Appendix 1) are displayed in Table 2.
table 2. the t-test results of the Lower and upper Groups of the scale.
Lower Group Upper Group t (p<0.05) Item-Scale
CorrelationAverage SD Average SD
ITEM1 2.10 0.89 3.71 1.27 8.26 0.00**
ITEM2 2.28 1.20 3.54 1.16 6.04 0.47**
ITEM3 2.14 1.03 3.75 0.97 9.04 0.61**
ITEM4 2.06 0.88 3.51 1.12 8.10 0.55**
ITEM5 1.84 0.87 3.26 1.23 7.50 0.50**
ITEM6 2.57 1.42 4.09 1.13 6.66 0.41**
ITEM7 2.54 1.23 4.39 0.95 9.46 0.56**
ITEM8 3.42 1.34 4.03 1.09 2.81 0.19**
ITEM9 2.71 1.17 3.26 1.23 2.56 0.16*
ITEM11 2.59 1.10 3.50 1.06 4.70 0.35**
ITEM12 2.59 1.21 3.25 1.24 3.01 0.19**
DeVeLoPInG A sCALe oF AnXIetY toWARDs UsInG GRAPHs In CHeMIstRY CLAsses(P. 34-46)

39
Journal of Baltic Science Education, Vol. 12, No. 1, 2013
ISSN 1648–3898
Lower Group Upper Group t (p<0.05) Item-Scale
CorrelationAverage SD Average SD
ITEM13 2.40 1.10 3.82 1.20 6.95 0.45**
ITEM14 1.78 0.80 3.39 1.20 8.89 0.52**
ITEM15 2.57 1.30 3.26 1.30 2.98 0.25**
ITEM16 2.78 1.27 3.75 1.18 4.45 0.30**
ITEM18 1.90 0.93 3.90 1.07 11.18 0.64**
ITEM19 1.81 0.73 3.71 1.06 11.83 0.70**
ITEM20 2.57 1.17 3.64 1.17 5.11 0.36**
ITEM21 2.06 1.11 4.10 0.83 11.77 0.67**
ITEM22 1.89 0.85 3.75 1.06 10.86 0.64**
ITEM24 1.65 0.82 3.64 1.37 9.93 0.59**
ITEM25 1.65 0.78 3.45 1.33 9.31 0.54**
ITEM26 2.56 1.06 3.34 1.23 3.82 0.36**
ITEM27 1.57 0.68 3.59 1.23 11.45 0.70**
ITEM28 2.35 1.31 4.20 0.91 9.24 0.57**
ITEM29 2.03 0.92 4.15 0.99 12.51 0.70**
ITEM30 1.60 0.58 3.87 0.95 16.27 0.77**
ITEM31 1.73 0.71 3.60 1.07 11.58 0.67**
ITEM32 2.01 0.93 3.90 1.20 9.92 0.61**
ITEM33 2.21 1.25 3.39 1.13 5,54 0.47**** Correlation is significant at the 0.01 level (2-tailed).* Correlation is significant at the 0.05 level (2-tailed).
The final version was administered to 235 high school students forming the sampling. After the application, the distribution of the total scores of the scale was analyzed. The results obtained from the scale scores are listed in Table 3.
table 3. Desciriptive statistic results of the scale of Anxiety towards using Graphs in chemis-try.
Mean 79.69
Median 80.00
Std. Deviation 16.79
Skewness 0.09
Std. Error of Skewness 0.16
Kurtosis 0.26
Std.ErrorofKurtosis 0.31
Range 92.00
Maximum 127.00
The values obtained in these statistical results (especially Skewness and Kurtosis values) show that the distribution of scale scores is quite close to the normal distribution.
DeVeLoPInG A sCALe oF AnXIetY toWARDs UsInG GRAPHs In CHeMIstRY CLAsses(P. 34-46)

40
Journal of Baltic Science Education, Vol. 12, No. 1, 2013
ISSN 1648–3898
The Reliability of the Scale
While the Cronbach α reliability coefficient of the first draft of the scale was 0.88, it was calculated for the final version with 3 items removed as 0.90.
The Validity of the Scale
Although the reliability of the scale is determined with an appropriate method, this operation does not address the questions such as “what do we want to assess with this assessment tool?”, “can our items assess accurately what we want to assess in line with our purpose?” (Gumus, 1977; Sencer and Sencer 1978). Therefore, the assessment tool needs to be analyzed in terms of the degree to which it assesses behavioral features, especially the ones with dominant cognitive and affective attitudes (Ozcelik, 2010). The concrete features that could be measured directly, assessment tools with high values of serving to the aim are to be utilized (Ozcelik, 2010; Sencer and Sencer 1978). As the feature to be assessed gets abstract, it becomes challenging to assess using the scales with lower or limited values of serving the aim. In order the assessments to fit the assessment purposes, assessment tools shall provide assessments that could be the measures of the variable to be assessed (Oncu, 1994).
The Validity of the Criterion
The inner criteria were evaluated to provide the criterion validity and for the final version, the dif-ference between the averages of the lower group (average=64.32; standard deviation =9.70) and upper group (average=107.47; standard deviation=10.53) was found to be statistically significant (t=24.11, p<0.05).
Evaluation of the Availability of the Data Set for Factor Analysis
In order to determine whether the data are available for the Principal components analysis, Kaiser-Meyer Olkin (KMO) and Barlett Sphericity tests were administered. The KMO coefficient is a statistical method used in determining the availability of the size of the sampling and the data obtained for the analysis to be made. The KMO ratio needs to be higher than 0.5. According to Sharma (Sharma 1996)
the values, which are equal to and higher than 0.90, are evaluated to be perfect. The more the rate is close to 1, the more appropriate the data set is for the factor analysis (Kalayci, 2006). The analysis made on the 235 scales with 30 items concluded that the KMO value was 92.3%. Since 92.3 is bigger than 0.50, the data set is found to be appropriate for the factor analysis.
In order to use the parametric method, the assessed feature needs to display a normal distribu-tion in the universe. Barlett Sphericity test is a statistical technique used to check whether the data are obtained from a multi variable normal distribution. If the test concludes with a significant chi-square test statistic, this shows that the data are obtained from a multi variable normal distribution (Kan and Akbas, 2005). The analysis concluded with significant Barlett test results (χ2=1798.15; p<0.05).
Structure of the Scale: Descriptive Factor Analysis
“Factor analysis” was used in gathering the information regarding the structural validity of the assessment tool. Factor analysis is one of the multi variable statistical techniques commonly used in turning multiple variables with close relations into few, meaningful and independent factors (Kleinbaum, Kupper and Miller, 1998). Among the various factor analysis methods, the most common one is the Principal Component Analysis. In factor analysis, it was considered that the items in each factor shall be coherent in terms of meaning and content, the eigenvalues of factors shall be equal to or higher than 1, each item shall have a factor loading of “0.30” or higher and that the difference between the factor loadings of items within their factors and the factor loading values of other factors shall be at least “0.10” or higher (Buyukozturk, 2002).
DeVeLoPInG A sCALe oF AnXIetY toWARDs UsInG GRAPHs In CHeMIstRY CLAsses(P. 34-46)

41
Journal of Baltic Science Education, Vol. 12, No. 1, 2013
ISSN 1648–3898
Obtaining Factors
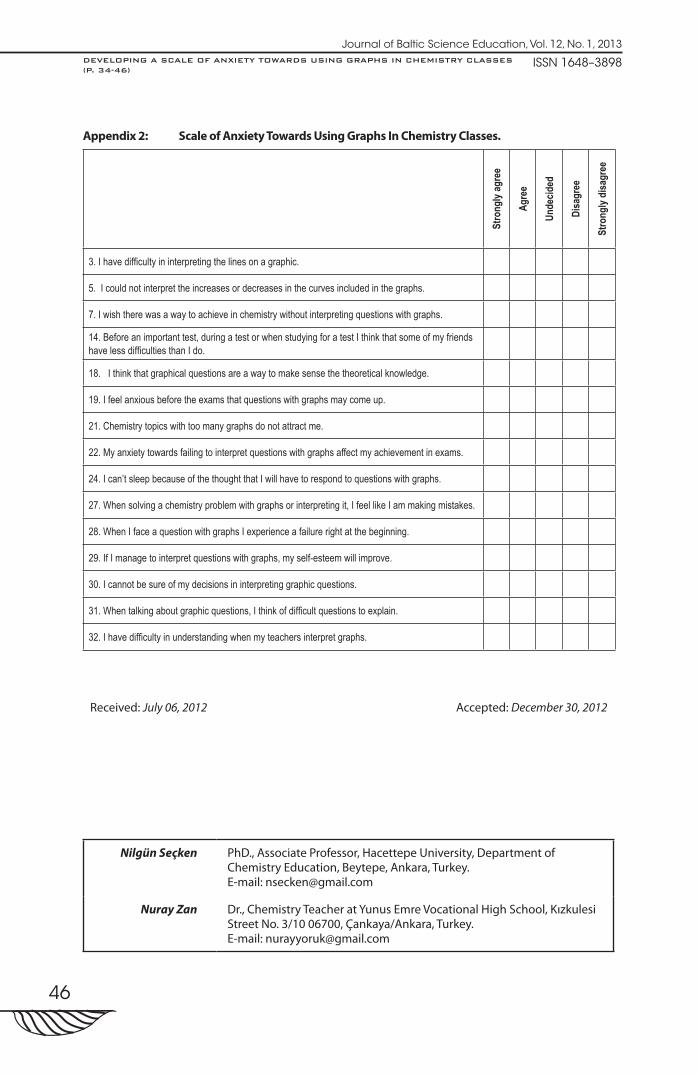
In order to obtain a meaningful structure regarding students’ anxieties towards using graphic in chemistry classes, factor analysis was administered with the aim of revealing structures named as fac-tors or components. The purpose of the factor analysis was to obtain a structure, where there are high degree relationships between variables in a few number of factors (Dunteman, 1989). Following the factor analysis, 15 items (1, 2, 4, 6, 8, 9, 11, 12, 13, 15, 16, 20, 25, 26, 33), which do not fit the structure of the scale, have factor values below 0.30, have less than 0.10 differences between their factor values or give high loadings to more than one factors. When data was examined in Table 4 “Total Variance Explained”, it was seen that 15 items which were analyzed were gathered in one factor which has value more than 1 Appendix 2).
table 4. the factor numbers Depending on the eigenvalue statistics And the explained vari-ance.
Component
Initial Eigenvalues Extraction Sums of Squared Loadings
Total % of Variance
Cumulative % Total % of
VarianceCumulative
%
1 6.48 43.22 43.22 6.48 43.22 43.22
2 0.99 6.58 49.80
3 0.96 6.42 56.23
4 0.86 5.73 61.95
5 0.78 5.17 67.13
6 0.71 4.75 71.88
7 0.64 4.29 76.17
8 0.60 4.02 80.19
9 0.53 3.52 83.71
10 0.50 3.31 87.03
11 0.43 2.89 89.92
12 0.42 2.82 92.74
13 0.40 2.63 95.38
14 0.37 2.47 97.84
15 0.32 2.16 100.00
Explained variance by this single factor related to the scale is 43.22%. According to this, it is seen that the single factor which is appeared as significant factor explains the majority of total variance in the items. The number of significant factor is seen in the linear graph which is drawn according to value criteria.
DeVeLoPInG A sCALe oF AnXIetY toWARDs UsInG GRAPHs In CHeMIstRY CLAsses(P. 34-46)

42
Journal of Baltic Science Education, Vol. 12, No. 1, 2013
ISSN 1648–3898
Component Number
151413121110987654321
Eige
nval
ue
6
4
2
0
figure 1: Line chart of factor Analysis (scree Plot).
A decrease which has high momentum is observed after first factor in Figure 1. This display that scale has a general factor. The graph is horizontal in the next factors and significant tendency of decrease is not observed. So the contribution of second and next factors to variance is close to each other. The calculated coefficient alpha for anxiety scale towards usage of graph in chemistry education is 0.903. Also, calculated item total correlations for item reliability and distinctivity of 15 anxiety statements in the scale were given in Table 5. According to this, it is seen that calculated correlations change between 0.44 and 0.75.
table 5. the factor analyze results.
Item Common Factor Variance(Communalities)
Factor Loading Value (Component Matrix) Item Total Correlation
ö3 0.37 0.61 0.54
ö5 0.31 0.51 0.44
ö7 0.32 0.53 0.46
ö14 0.33 0.55 0.48
ö18 0.46 0.68 0.61
ö19 0.52 0.72 0.66
ö21 0.50 0.71 0.65
ö22 0.44 0.66 0.60
ö24 0.39 0.63 0.56
ö27 0.52 0.72 0.66
ö28 0.36 0.60 0.54
ö29 0.55 0.74 0.75
ö30 0.65 0.80 0.75
ö31 0.47 0.68 0.62
ö32 0.42 0.65 0.58
Explained Variance Total: % 43.22
DeVeLoPInG A sCALe oF AnXIetY toWARDs UsInG GRAPHs In CHeMIstRY CLAsses(P. 34-46)
43
Journal of Baltic Science Education, Vol. 12, No. 1, 2013
ISSN 1648–3898
The analyse results of anxiety scale towards usage of graph in chemistry lessons were displayed that the scale has general factor and it is a one factor scale. Because first factor loading values and separately explained variance by it are high.
conclusions
Anxiety is a state of feeling experienced by all individuals at different levels in our everyday lives. Most of the time, anxiety is an undesirable state of feeling for individuals. Determination of the situa-he time, anxiety is an undesirable state of feeling for individuals. Determination of the situa-tions that create anxiety in students during the learning process plays a n important role in overcoming undesirable problems or turning them into positive situations. In the light of this aim, a scale of anxiety towards using graphs in chemistry classes was developed. The findings concluded that the scale was qualified to determine the anxieties of students towards using graphs.
The reliability and validity analysis of the scale concluded with a one dimensional assessment tool of 15 items with a reliability level of 0.903. Most of the items in anxiety scale prepared towards graph usage are items towards determination of anxieties of graph interpreting skills of students. There are not many activities towards graph modelling and converting in the Turkish Education System. There are mostly activities towards usage of graph interpreting of students. There are too few activities towards graph modelling. So sentences consisted of anxieties towards interpreting are placed in forming anxiet-ies sentences. Anxiety sentences towards modelling and converting were removed from scale. Because their factor loading values were low or one item formed high factor loading value in more than one factors after factor analyse.
It is expected that this scale would set an essential data collection tool for both educators and students. Additionally, it would be beneficial to apply the scale on different sampling to retest its reli-ability and validity.
references
Antony, M. M., & Swinson, R. P. (2000). The shyness and social anxiety workbook: Proven techniques for overcoming your fears, Oakland, CA: New Harbinger Publications.
APA (2010). Do you know the signs of an anxiety disorder? Retrieved August 10, 2011 from http://www.apa.org/helpcenter/anxiety-signs.aspx.
Bacanli, H. (2005). Development and Learning. Ankara: Nobel Publishing and Distribution.Beck, A. T., Steer, R. A. (1984). Internal consistencies of the original and revised beck depression inventory. Journal
of Clinical Psychology, 40, 1365-1367.Beichner, R. (1994). Testing student interpretation of Kinematics. American Journal of Physics, 62, 750-762.Buyukozturk, S. (2002). Handbook of Data Analysis in Social Sciences. Ankara: Pegem Publishing.Cuceloğlu, D. (1997). Human and Behavior. Istanbul: Remzi Publishing.Dunteman, G. H. (1989). Principal Components Analysis. (Sage University Papers Series on Quantitative Applications
in the Social Sciences, series no. 07-69). Thousand Oaks, CA: Sage.Ersoy, A. F. (2004). The Effects of Calculator Based Laboratories on Graphical Interpretation of Kinematic Concepts
in Physics at METU Teacher Candidates, Unpublished master’s Thesis. Ankara: The Graduate School of Applied Sciences of Middle East Technical University.
Gall, S. (1996). Gale Encyclopedia of Psychology. Detroit: Gale Group, Michigan.Gumuş, B. (1977). Assessment and Evaluation in Education. Ankara: Quality Printing Center.Hadjidemetriou, C., Williams, J. S. (2002). Children’s graphical conceptions. Research in Mathematics Education, 4,
69-87.Hamarta, E. (2009). Analysing the social anxieties of adolescents in terms of interpersonal problem solving and
perfectionism. Primary Online, 8 (3), 729-740.Kalayci, S. (2006). Statistical Techniques with Multi Variables and SPSS. Ankara, Asil Publishing Co. Ltd.Kan, A. (2005). A study on developing an attitude scale for high school students’ attitudes towards chemistry classes.
Mersin University Education Faculty Journal, 1 (2), 227-237.Kiziloluk, H. (2002). Basic Concepts Related to Education: Introduction to Teaching Profession. (Ed.: Türkoğlu, A.), Ankara:
Mikro Publishing.Kleinbaum, D. G., Kupper, L. L., Muller, K. E., & Nizam, A. (1998). Applied regression analysis and multivariable methods
(3rd Ed.). Pacific Grove, CA: Duxbury.
DeVeLoPInG A sCALe oF AnXIetY toWARDs UsInG GRAPHs In CHeMIstRY CLAsses(P. 34-46)

44
Journal of Baltic Science Education, Vol. 12, No. 1, 2013
ISSN 1648–3898
McDermott, C. L., Rosenquist, M. L., & Van Zee, E. M. (1987). Student difficulties in connecting graphics and physics: examples from Kinematics. American Association of Physics Teachers, 55 (6), 503-513.
McKenzie, D. L., Padilla, M. J. (1986). The construction and validation of the test of graphing in science (TOGS). Journal of Research in Science Teaching, 23, 571-579.
Murphy, K. R., Davidshofer, C. O. (1991). Psychological Testing: Principle and Applications. Englewood Clias NJ: Prentice Hall.
Kwon, O. N. (2002). The effect of calculator based ranger activities on students’ graphing ability. School Science and Mathematics, 102 (2), 57.
Oncu, H. (1994). Assessment and Evaluation in Education. Ankara: Master Publishing.Ozcelik, D. A. (2010). Assessment and Evaluation. Ankara: Pegem Akademi Publishing.Padilla, M. J., McKenzie, D. L., Shaw, Jr. E. L. (1986). An examination of the line graphing ability of students in grades
seven through twelve. School Science and Mathematics, 86, 20-26.Sencer, M., Sencer, Y. (1978). Science of Methodology in Social Research. Ankara: Dogan Publishing.Senemoglu, N. (2005). Development, Learning and Teaching. Ankara: Gazi Publishing.Seven, M. A., Engin, A. O. (2008). Factors affecting learning. Journal of Graduate School of Social Sciences, 12, 2, 189-
212.Sharma, S. (1996). Applied Multivariate Techniques. New York: John Wiley and Sons Inc.Tas, Y. (2011). Coping with exam anxiety. Retrieved April 10, 2011, from http://www.bilkent.edu.tr/~dos/ogdm/b_si-
navkaygi.html. Tezbaşaran, A. (1997). Likert-type Scale Development Guide. Ankara: Turkish Psychologists Association. Turgut, M. F. (1977). Assessment of Attitudes, Assessment Techniques in Education. Ankara: Nüve Press.Ucar, F. (2004). The role of mind in stress and mental illnesses due to stress. Turkish Psychology Bulletin, 10, 4, 85-
102.
DeVeLoPInG A sCALe oF AnXIetY toWARDs UsInG GRAPHs In CHeMIstRY CLAsses(P. 34-46)
45
Journal of Baltic Science Education, Vol. 12, No. 1, 2013
ISSN 1648–3898
Appendix 1: Draft form for scale of Anxiety towards using Graphs in chemistry classes.
Stro
ngly
agre
e
Agre
e
Unde
cided
Disa
gree
Stro
ngly
disa
gree
1.Itmakesmeanxioustosolvechemistryproblemsinvolvinggraphs.
2.Itmakesmescaredwhentherearegraphsinaquestionrelatedtochemistry.
3.Ihavedifficultyininterpretingthelinesonagraphic.
4.Wheninterpretingagraphic,IfeelanxiousthatImayfailtointerpretwhattheaxiscorrespondto.
5.Icouldnotinterprettheincreasesordecreasesinthecurvesincludedinthegraphs.
6.Thequestionaskinghowtoexpressanyinformationonthegraphicdoesnotmakemeanxious.
7.Iwishtherewasawaytoachieveinchemistrywithoutinterpretingquestionswithgraphs.
8.Myself-confidenceincreaseshenIcanexpressanyinformationonthegraphic.
9.ThethoughtthatIcanexplainagraphicalquestionthroughanothergraphicalquestiondoesnotmakemeanxious.
11.WhenIinterpretagraphicsIfeelthatmyknowledgebecomesrelatedtodifferentfields.
12.IninterpretingthegraphsquestionsIfeelthatmyknowledgeistransferredtodifferentfields.
13.Idonotlikethosechemicaltopicsthatrequiretheuseofgraphicsforexplanation
14.Beforeanimportanttest,duringatestorwhenstudyingforatestIthinkthatsomeofmyfriendshavelessdifficultiesthanIdo.
15.Theviewthatothergraphicscanbedrawnusinganothergraphicsdoesnotmakemeanxious.
16.Interpretingquestionswithgraphsisadistinguishingfeatureforanindividual.
18.Ithinkthatgraphicalquestionsareawaytomakesensethetheoreticalknowledge.
19.Ifeelanxiousbeforetheexamsthatquestionswithgraphsmaycomeup.
20.Ihavedifficultyinunderstandingchemistrytopics,wheregraphsarewidelyused.
21.Chemistrytopicswithtoomanygraphsdonotattractme.
22.Myanxietytowardsfailingtointerpretquestionswithgraphsaffectmyachievementinexams.
24.Ican’tsleepbecauseofthethoughtthatIwillhavetorespondtoquestionswithgraphs.
25.IamanxiousaboutthefactthatIcouldnotexpressanyeventIhaveobserved.
26.WhenIcannotaccountforthegraphquestionsIfeelmyselfnotsosmartasIthink.
27.Whensolvingachemistryproblemwithgraphsorinterpretingit,IfeellikeIammakingmistakes.
28.WhenIfaceaquestionwithgraphsIexperienceafailurerightatthebeginning.
29.IfImanagetointerpretquestionswithgraphs,myself-esteemwillimprove.
30.Icannotbesureofmydecisionsininterpretinggraphicquestions.
31.Whentalkingaboutgraphicquestions,Ithinkofdifficultquestionstoexplain.
32.Ihavedifficultyinunderstandingwhenmyteachersinterpretgraphs.
33.Iunderstandwhenmyteachersorpeersareinterpretinggraphs,butIfailwhenItrytointerpretmyself.
DeVeLoPInG A sCALe oF AnXIetY toWARDs UsInG GRAPHs In CHeMIstRY CLAsses(P. 34-46)
46
Journal of Baltic Science Education, Vol. 12, No. 1, 2013
ISSN 1648–3898
Appendix 2: scale of Anxiety towards using Graphs in chemistry classes.
Stro
ngly
agre
e
Agre
e
Unde
cided
Disa
gree
Stro
ngly
disa
gree
3.Ihavedifficultyininterpretingthelinesonagraphic.
5.Icouldnotinterprettheincreasesordecreasesinthecurvesincludedinthegraphs.
7.Iwishtherewasawaytoachieveinchemistrywithoutinterpretingquestionswithgraphs.
14.Beforeanimportanttest,duringatestorwhenstudyingforatestIthinkthatsomeofmyfriendshavelessdifficultiesthanIdo.
18.Ithinkthatgraphicalquestionsareawaytomakesensethetheoreticalknowledge.
19.Ifeelanxiousbeforetheexamsthatquestionswithgraphsmaycomeup.
21.Chemistrytopicswithtoomanygraphsdonotattractme.
22.Myanxietytowardsfailingtointerpretquestionswithgraphsaffectmyachievementinexams.
24.Ican’tsleepbecauseofthethoughtthatIwillhavetorespondtoquestionswithgraphs.
27.Whensolvingachemistryproblemwithgraphsorinterpretingit,IfeellikeIammakingmistakes.
28.WhenIfaceaquestionwithgraphsIexperienceafailurerightatthebeginning.
29.IfImanagetointerpretquestionswithgraphs,myself-esteemwillimprove.
30.Icannotbesureofmydecisionsininterpretinggraphicquestions.
31.Whentalkingaboutgraphicquestions,Ithinkofdifficultquestionstoexplain.
32.Ihavedifficultyinunderstandingwhenmyteachersinterpretgraphs.
Received: July 06, 2012 Accepted: December 30, 2012
Nilgün Seçken PhD., Associate Professor, Hacettepe University, Department of Chemistry Education, Beytepe, Ankara, Turkey. E-mail: [email protected]
Nuray Zan Dr., Chemistry Teacher at Yunus Emre Vocational High School, Kızkulesi Street No. 3/10 06700, Çankaya/Ankara, Turkey. E-mail: [email protected]
DeVeLoPInG A sCALe oF AnXIetY toWARDs UsInG GRAPHs In CHeMIstRY CLAsses(P. 34-46)