developing an acoustic method for reducing north atlantic
TRANSCRIPT

The University of MaineDigitalCommons@UMaine
Electronic Theses and Dissertations Fogler Library
12-2013
Developing an Acoustic Method for ReducingNorth Atlantic Right Whale (Eubalaena glacialis)Ship Strike Mortality Along the United StatesEastern SeaboardKaitlyn Allen Mullen
Follow this and additional works at: http://digitalcommons.library.umaine.edu/etd
Part of the Oceanography and Atmospheric Sciences and Meteorology Commons
This Open-Access Dissertation is brought to you for free and open access by DigitalCommons@UMaine. It has been accepted for inclusion inElectronic Theses and Dissertations by an authorized administrator of DigitalCommons@UMaine.
Recommended CitationMullen, Kaitlyn Allen, "Developing an Acoustic Method for Reducing North Atlantic Right Whale (Eubalaena glacialis) Ship StrikeMortality Along the United States Eastern Seaboard" (2013). Electronic Theses and Dissertations. 2060.http://digitalcommons.library.umaine.edu/etd/2060
DEVELOPING AN ACOUSTIC METHOD FOR REDUCING NORTH
ATLANTIC RIGHT WHALE (EUBALAENA GLACIALIS) SHIP
STRIKE MORTALITY ALONG THE UNITED STATES
EASTERN SEABOARD
By
Kaitlyn Allen Mullen
B.B.A. Belmont University, 2002
B.S. University of Maine, 2006
A THESIS
Submitted in Partial Fulfillment of the
Requirements for the Degree of
Doctor of Philosophy
(Interdisciplinary in Ocean Engineering)
The Graduate School
The University of Maine
December 2013
Advisory Committee:
Michael L. Peterson, Professor of Mechanical Engineering, Advisor
Sean K. Todd, Professor of Marine Mammal Ecology & Oceanography
Richard Kimball, Professor of Mechanical Engineering
Kate Beard-Tisdale, Professor of Spatial Information Systems
Bruce Segee, Professor of Electrical and Computer Engineering

ii
THESIS ACCEPTANCE STATEMENT
On behalf of the Graduate Committee for Kaitlyn Allen Mullen, I affirm that this
manuscript is the final and accepted thesis. Signatures of all committee members are on
file with the Graduate School at the University of Maine, 42 Stodder Hall, Orono, Maine.
Michael L. Peterson, Committee Chair November 25, 2013

iii
Copyright 2013 Kaitlyn Allen Mullen
All rights reserved.

LIBRARY RIGHTS STATEMENT
In presenting this thesis in partial fulfillment of the requirements for an advanced
degree at the University of Maine, I agree that the Library shall make it freely available
for inspection. I further agree that permission for “fair use” copying of this thesis for
scholarly purposes may be granted by the Librarian. It is understood that any copying or
publication of this thesis for financial gain shall not be allowed without my written
permission.
Signature:
Date: November 25, 2013

DEVELOPING AN ACOUSTIC METHOD FOR REDUCING NORTH
ATLANTIC RIGHT WHALE (EUBALAENA GLACIALIS) SHIP
STRIKE MORTALITY ALONG THE UNITED STATES
EASTERN SEABOARD
By Kaitlyn Allen Mullen
Thesis Advisor: Dr. Michael L. Peterson
An Abstract of the Thesis Presented
in Partial Fulfillment of the Requirements for the
Degree of Doctor of Philosophy
(Interdisciplinary in Ocean Engineering)
December 2013
North Atlantic right whales (Eubalaena glacialis) are among the world’s most
endangered cetaceans. Although protected from commercial whaling since 1949, North
Atlantic right whales exhibit little to no population growth. Ship strike mortality is the
leading known cause of North Atlantic right whale mortality. North Atlantic right whales
exhibit developed auditory systems, and vocalize in the frequency range that dominates
ship acoustic signatures. With no behavioral audiogram published, current literature
assumes these whales should be able to acoustically detect signals in the same
frequencies they vocalize. Recorded ship acoustic signatures occur at intensities that are
similar or higher to those recorded by vocalizing North Atlantic right whales. If North
Atlantic right whales are capable of acoustically detecting oncoming ship, why are they
susceptible to ship strike mortality?
This thesis models potential acoustic impediments to North Atlantic right whale
detection of oncoming ships, and concludes the presence of modeled and observed bow

null effect acoustic shadow zones, located directly ahead of oncoming ships, are likely to
impair the ability of North Atlantic right whales to detect and/or localize oncoming
shipping traffic. This lack of detection and/or localization likely leads to a lack of ship
strike avoidance, and thus contributes to the observed high rates of North Atlantic right
whale ship strike mortality. I propose that North Atlantic right whale ship strike mortality
reduction is possible via reducing and/or eliminating the presence of bow null effect
acoustic shadow zones. This thesis develops and tests one method for bow null effect
acoustic shadow zone reduction on five ships. Finally, I review current United States
policy towards North Atlantic right whale ship strike mortality in an effort to determine if
the bow null effect acoustic shadow zone reduction method developed is a viable method
for reducing North Atlantic right whale ship strike mortality within United States waters.
I recommend that future work include additional prototype modifications and
testing, application for a marine mammal scientific take authorization permit to test the
modified prototype on multiple mysticete species, and continued interfacing of the
prototype with evolving United States North Atlantic right whale ship strike reduction
policies.
iv
ACKNOWLEDGEMENTS
This work was compiled from a series of previously published peer-review
conference proceedings and journal articles. Portions of Chapter 2 were published
previously as Todd, S.K., Allen, J.K., Mahaffey, C.M., Damon, J., Hamilton, P., and
Kenney, R.D. (2009). An Acoustic Mysticete Shipstrike Mortality Risk Assessment for
the Gulf of Maine. Proceedings of the 5th
International Conference on Bio-Acoustics.
Loughborough University, Holywell Park, United Kingdom. 280-287. Portions of
Chapter 3 were published previously as Allen, J.K., Peterson, M.L., Sharrard, G.V.,
Wright, D.L. and Todd, S.K. (2012). Radiated noise from commercial ships in the Gulf of
Maine: Implications for whale/vessel collisions. Journal of the Acoustical Society of
America 132(3) EL229-EL235. Portions of Chapter 4 were submitted as Mullen, K.A..,
Peterson, M.L., Mullen, J.P. and Carpenter, R. (in prep.). An acoustic method for
reducing baleen whale ship strike mortality. Marine Technology Society Journal (13p.).
Portions of Chapter 5 were previously published as Mullen, K.A., Peterson, M.L., and
Todd, S.K. (2013). Has designating and protecting critical habitat had an impact on
endangered North Atlantic right whale ship strike mortality? Marine Policy 42: 293-304.
This work greatly benefitted from pioneering work in the field by Edmund R.
Gerstein, Joseph E. Blue, and Susan E. Parks. The National Science Foundation IGERT
Sensor Science, Engineering, and Informatics Program provided generous financial
support for this work. Other sources of financial support included the University of
Maine Provost Fellowship, the Maine Space Grant Consortium, and the Bar Harbor
Whale Watch Company “Save the Whales, Educate the Children” Scholarship.
Undertaking a project of this size requires many community partnerships in the form of

v
donations of time and supplies. Community contributors to this thesis included Allied
Whale, the Bar Harbor Whale Watch Company, New Horizon Cruises, Frenchman Bay
Boating Company, RPS Geocet, Inc., Glenn Carpenter Metalworks Studio, Penobscot
Bay Pilots Association, College of the Atlantic, and Diver Ed’s Dive-In Theater. Special
thanks also belong to research assistants George V. Sharrard, Dana L. Wright, Dominique
G. Walk, Sabrina Keach, Elija “Lulu” Bates, Julia Stepanuk, and Jonathan Mullen.
This thesis would not have been possible without the innovative and unwavering
support of my advisor, Dr. Michael “Mick” L. Peterson. This thesis benefitted greatly
from the amount of time my committee members committed to guiding my progress.
Thanks to Dr. Sean Todd for introductory field experiences and logistical support, and to
Dr. Richard Kimball and Dr. Christopher Clark for sound advice.
This thesis would not have been completed without all the volunteers who
contributed time in the field, time on their vessels, and time reviewing the manuscript.
Sincere thanks to Capt. Jerry Blandford, Capt. Jeffrey Black, Capt. Gary Fagan, Capt.
Matt McFarland, Capt. Larry Nusselein, Robert “Whitey” Carpenter, Sara Jackson, Alec
Phippen, Jared Cunningham, Dave Spear, Steve Burns, Colby Moore, Sherri Eldridge,
Melinda Neville, Tora Johnson, Neal Currier, Bryce Moody, Kevin Moody, Dennis
Pederson, Chad Probst, Darrell White, and Julianne Taylor.
Finally, this thesis would not have been a success without the support and
patience of my husband, my family, and my friends. Thanks to all of you for countless
hours spent looking beyond the immediate to believe in the possibilities.
vi
TABLE OF CONTENTS
ACKNOWLEDGEMENTS ............................................................................................... iv
LIST OF TABLES .............................................................................................................. x
LIST OF FIGURES ........................................................................................................... xi
LIST OF ABBREVIATIONS .......................................................................................... xiv
CHAPTER 1 INTRODUCTION ........................................................................................ 1
1.1 Introduction ............................................................................................................. 1
1.2 Distribution and Habitat Use .................................................................................. 1
1.3 Review of Population Growth Rate ........................................................................ 4
1.4 Ship Strike Mortality Reduction in United States Waters ...................................... 7
1.5 Are North Atlantic right whales capable of detecting and/or localizing oncoming
ships?..................................................................................................................... 10
1.6 Chapter Descriptions ............................................................................................. 13
CHAPTER 2 MODELING THE ACOUSTICS OF ENDANGERED MYSTICETE/SHIP
INTERACTIONS WITHIN THE GULF OF MAINE ...................................... 15
2.1 Chapter Abstract ................................................................................................... 15
2.2 Introduction ........................................................................................................... 16
2.3 Methods................................................................................................................. 17
2.3.1 Modelling Relative Geographic Shipstrike Risk ......................................... 17
2.3.2 Modeling Acoustic Shipstrike Risk ............................................................. 18
2.4 Results and Discussion ......................................................................................... 21
2.5 Conclusions ........................................................................................................... 27
vii
CHAPTER 3 IN SITU OBSERVATION OF SHIP ACOUSTIC PROPAGATION ....... 29
3.1 Chapter Abstract ................................................................................................... 29
3.2 Introduction ........................................................................................................... 29
3.3 Methods................................................................................................................. 31
3.4 General Spectral Patterns ...................................................................................... 35
3.4.1 Radial Spectral Patterns ............................................................................... 36
3.4.2 Bow-null effect acoustic shadow zones ....................................................... 38
3.5 Implications for mysticete detection of oncoming ships ...................................... 39
CHAPTER 4 AN ACOUSTIC METHOD FOR REDUCING NORTH ATLANTIC
RIGHT WHALE SHIP STRIKE MORTALITY .............................................. 41
4.1 Chapter Abstract ................................................................................................... 41
4.2 Introduction ........................................................................................................... 41
4.3 Acoustic Hardware................................................................................................ 44
4.4 Attachment Platform Design................................................................................. 46
4.5 Calibration Results ................................................................................................ 48
4.6 Sea Trial Design and Results ................................................................................ 50
4.7 Conclusions ........................................................................................................... 57
CHAPTER 5 CRITICAL HABITAT AND ITS IMPACT ON U.S. NORTH ATLANTIC
RIGHT WHALE SHIP STRIKE REDUCTION POLICY ............................... 58
5.1 Abstract ................................................................................................................. 58
5.2 Introduction ........................................................................................................... 59
5.3 Negative anthropogenic impact mitigation actions, 1970-1995 ........................... 63
viii
5.4 Ship strike mitigation actions, 1996-2011 ............................................................ 65
5.4.1. Mariner education ....................................................................................... 66
5.4.2 Direct efforts informing mariners of right whale locations ......................... 68
5.4.2.1 Aerial survey sightings ....................................................................... 68
5.4.2.2 Visual observers .................................................................................. 69
5.4.2.3 Mandatory ship reporting system........................................................ 70
5.4.2.4 Passive acoustic monitoring ................................................................ 70
5.4.3 Rulemaking and IMO Collaboration ........................................................... 71
5.4.3.1 Rulemaking ......................................................................................... 71
5.4.3.2 IMO Collaboration .............................................................................. 73
5.5 Critical habitat: Where does it fit? ........................................................................ 74
5.6 Dealing with habitat fragmentation: Can whales and vessels co-exist? ............... 77
5.6.1 Designate critical migratory habitat based upon best available science ...... 79
5.6.2 Continue to conduct migratory habitat-use studies using the best available
technology. .................................................................................................. 80
5.6.3 Define a difference between protection levels required for migration and
seasonal residence habitat areas. ................................................................. 82
ix
5.6.4 Develop short- and long-term right whale ship strike reduction solutions
specific to migration and seasonal residence critical habitat areas ............. 85
5.6.4.1 Long-term right whale ship strike reduction goals for seasonal use
critical habitat areas ............................................................................ 86
5.6.4.2 Short-term right whale ship strike reduction goals for seasonal use
critical habitat areas ............................................................................ 88
5.6.4.3 Long-term right whale ship strike reduction goals for migratory
corridor critical habitat areas .............................................................. 90
5.6.4.4 Short-term right whale ship strike reduction goals for migratory
corridor critical habitat areas .............................................................. 92
5.7 Conclusions ........................................................................................................... 94
CHAPTER 6 CONCLUSIONS ........................................................................................ 96
6.1 Acoustic shadow zone formation .......................................................................... 96
6.2 Bow null effect acoustic shadow zone formation ................................................. 99
6.3 Definition of design requirements ...................................................................... 103
6.4 Interfacing the developed solution with current policy structure ....................... 105
6.5 Thesis Conclusions ............................................................................................. 107
REFERENCES ............................................................................................................... 110
APPENDIX A: FIELD TEST AREA MAPS ................................................................. 123
APPENDIX B: CALCULATED RADIAL SOURCE LEVELS ................................... 125
APPENDIX C: PROTOTYPE PHOTOS ....................................................................... 127
BIOGRAPHY OF THE AUTHOR................................................................................. 133
x
LIST OF TABLES
Table 1.1 Annual Ship Strike Mortality 1976-2010 ........................................................... 7
Table 2.1 Characteristics of Potential Risk Areas ............................................................ 20
Table 2.2 Relative Acoustic Propagation Impact in the Identified High Ship Strike Risk
Areas .................................................................................................................. 22
Table 3.1 Summary of Ship Characteristics ..................................................................... 34
Table 4.1 Amplifier Specifications ................................................................................... 45
Table 4.2 Speaker Specifications ...................................................................................... 45
Table 4.3 Attachment Platform Specifications ................................................................. 47
Table 4.4 Summary of Test Ship Characteristics ............................................................. 54
Table 5.1 Differences Between Seasonal Residence Critical Habitat and Migratory
Critical Habitat Protection ................................................................................. 83
Table 5.2 Required and Desired Characteristics of Developing Right Whale Ship Strike
Reduction Technology ...................................................................................... 90
xi
LIST OF FIGURES
Figure 1.1 A Map of Historic North Atlantic Right Whale Habitat ................................... 2
Figure 1.2 A Map of Modern North Atlantic Right Whale Habitat ................................... 4
Figure 1.3 Surface Profile of a North Atlantic Right Whale Compared to a Transiting
Motor Vessel ..................................................................................................... 10
Figure 2.1 Buoy Locations Relative to Seven Previously Identified Ship Strike Risk
Areas within the Gulf of Maine ......................................................................... 18
Figure 2.2 Calculated Seasonal Sound Velocity Profiles for the Lower Boston TSS ...... 23
Figure 2.3 Calculated Sound Velocity Profiles for the Great South Channel .................. 23
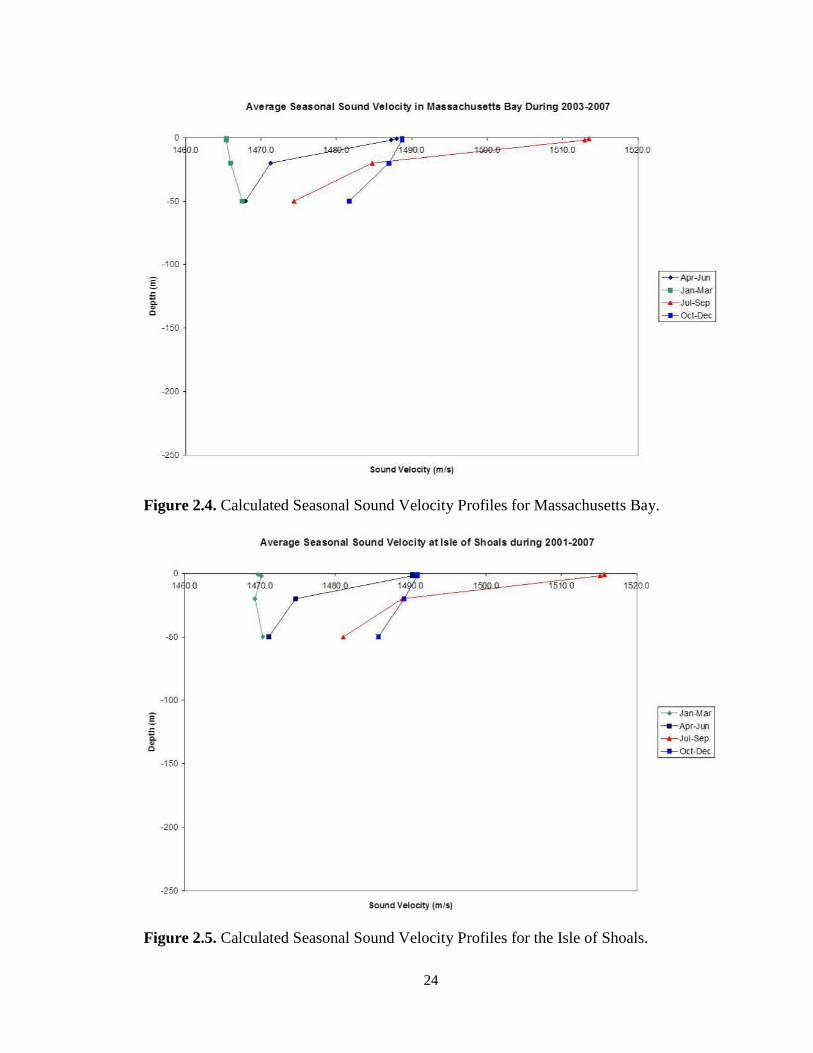
Figure 2.4 Calculated Seasonal Sound Velocity Profiles for Massachusetts Bay ............ 24
Figure 2.5 Calculated Seasonal Sound Velocity Profiles for the Isle of Shoals. .............. 24
Figure 2.6 Calculated Seasonal Sound Velocity Profiles for Jordan Basin. ..................... 25
Figure 2.7 Calculated Sound Velocity Profiles for the Inner Schoodic Ridges. .............. 25
Figure 2.8 Calculated Seasonal Sound Velocity Profiles for the Northeast Channel ....... 26
Figure 2.9 Two Hundred Acoustic Rays Traced for the Inner Schoodic Ridges and Jordan
Basin Risk Areas for April - June. .................................................................... 27
Figure 3.1 Spectrum Levels During Close-Range Ship Passages at 15 m Depth for Four
Ship Classes ....................................................................................................... 37
Figure 3.2 Broadband Source Level (SL) Change with Ship Orientation Change for Four
Ship Classes....................................................................................................... 39
Figure 4.1 Block Diagram of Acoustic Hardware and Power Flow ................................. 44
Figure 4.2 Vertical and Angular Speaker Orientation Adjustments. ................................ 46
xii
Figure 4.3 Prototype Attached to Test Ship Rhumbline Underway at 4.2 Knots ............. 48
Figure 4.4 Calibration Listening Locations Relative to Acoustic Components on
Anchored Test Platform .................................................................................... 49
Figure 4.5 Platform and Speaker Attachment to Test Ships ............................................. 50
Figure 4.6 Platform and Speaker Attachment to Test Ships via Stabilizing Lines ........... 51
Figure 4.7 Spectrum Levels During Close-Range Test Ship Passages at 5 m Depth for
Two Test Ships .................................................................................................. 55
Figure 5.1 Timeline of Actions Taken by U.S. Wildlife Managers to Protect North
Atlantic Right Whales from Negative Anthropogenic Interactions from 1970 to
1995 ................................................................................................................... 63
Figure 5.2 Seasonal Management Areas Designated in 2008 by the Final Rule to
Implement Speed Restrictions to Reduce the Threat of Ship Collisions with
North Atlantic Right Whales. ............................................................................ 65
Figure 5.3 Timeline of Actions Taken by U.S. Wildlife Managers to Protect North
Atlantic Right Whales from Ship Strike Mortality from 1996 to 2011 ............ 66
Figure 5.4 North Atlantic Right Whale Critical Habitat Designations and Alterations
under the Endangered Species Act from 1994 to 2011 ..................................... 74
Figure 6.1 Formation of Bow Null Effect Acoustic Shadow Zones ............................... 101
Figure A.1 Two Ship Tracks Recorded During Chapter 3 Field Work .......................... 123
Figure A.2.Sample Test Ship Track from Prototype Field Testing in Chapter 4 ........... 124
Figure B.1 Calculated Radial Source Levels for the Maasdam. ..................................... 125
Figure C.1 Front View of Attachment Platform ............................................................. 127
Figure C.2 Labeled Side View of Attachment Platform ................................................. 128
xiii
Figure C.3 Extended Side View of Attachment Platform .............................................. 128
Figure C.4 Top View of Attachment Platform ............................................................... 129
Figure C.5 Close-Up of Platform Extensions ................................................................. 130
Figure C.6. Attachment Platform Deployed with Speakers Attached ............................ 130
Figure C.7. Two Views of the Generator and Electronics Complex Secured to the
Attachment Platform ....................................................................................... 131
Figure C.8 Prototype Being Attached to Test Ship Frenchman Bay .............................. 132

xiv
LIST OF ABBREVIATIONS
ADU – Azimuthal drive unit
ATBA – Area to Be Avoided
BNEASZ – Bow null effect acoustic shadow zone
CTD – Conductivity/temperature/depth casts
DMA – Dynamic Management Area
ESA – Endangered Species Act of 1973
GIS – Geographic information system
GOMOOS – Gulf of Maine ocean observation system
GPS – Geographic Positioning System
ICRW - International Convention for the Regulation of Whaling
IMO – International Maritime Organization
MMPA – Marine Mammal Protection Act of 1972
MSRS – Mandatory Ship Reporting System
NEIT – Northeastern Implementation Team
NMFS – National Marine Fisheries Service
NOAA – National Oceanic and Atmospheric Administration
PBR – Potential biological removal
RL – Received intensity level
SEIT – Southeastern Implementation Team
SL – Source intensity level
SMA – Seasonal Management Area
SPUE – Sightings per unit effort
TSS – Traffic Separation Scheme
USGS – United States Geological Survey
1
CHAPTER 1
INTRODUCTION
1.1 Introduction
North Atlantic right whales are among the most endangered mysticete populations
in the world. Protected by an international whaling moratorium in 1949, the population
totals an estimated minimum 444 individuals worldwide (International Convention for
the Regulation of Whaling [ICRW], 1946; National Oceanic and Atmospheric
Administration [NOAA], 2012). The western North Atlantic right whale population
likely consisted of 1,000-2,000 individuals in the early to mid-1600s (Reeves et al.,
1992), and may have included 10,000-15,000 individuals prior to 1000 A.D. (Gaskin,
1991; National Marine Fisheries Service [NMFS], 1991). No historical population
estimate is available for eastern North Atlantic right whales, a population now
functionally extinct (Best et al., 2001). Commercial whaling conducted prior to 1850
likely reduced the global North Atlantic right whale population to 100 or less individuals
by 1949 (Reeves et al., 2007).
1.2 Distribution and Habitat Use
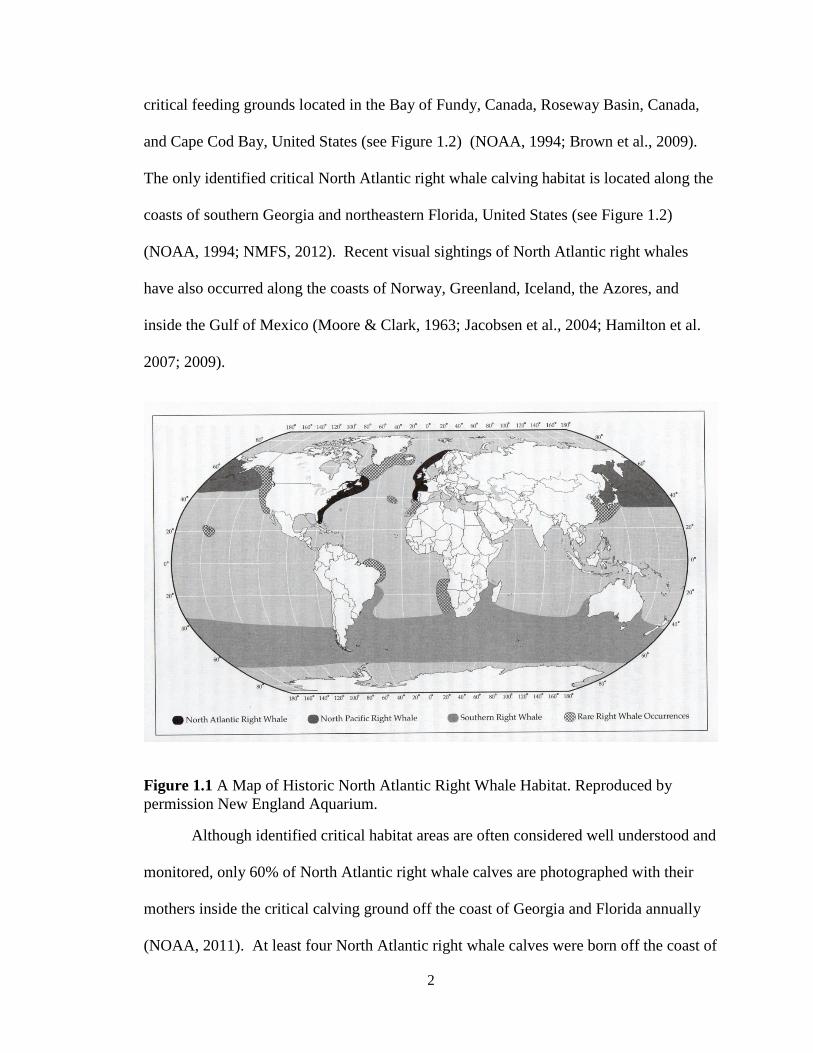
Commercial whaling records indicate the North Atlantic right whale’s historic
geographic range included the coasts of eastern Canada, eastern United States, southern
Greenland, Iceland, Ireland, United Kingdom, western Europe and northwest Africa (see
Figure 1.1) (Reeves et al., 2007). North Atlantic right whales were likely found close to
coastlines in continental shelf waters, although some subarctic oceanic basin travel may
have occurred (Reeves et al., 2007; NOAA, 2011). Today North Atlantic right whales
primarily inhabit the eastern coasts of Canada and the United States, with identified
2
critical feeding grounds located in the Bay of Fundy, Canada, Roseway Basin, Canada,
and Cape Cod Bay, United States (see Figure 1.2) (NOAA, 1994; Brown et al., 2009).
The only identified critical North Atlantic right whale calving habitat is located along the
coasts of southern Georgia and northeastern Florida, United States (see Figure 1.2)
(NOAA, 1994; NMFS, 2012). Recent visual sightings of North Atlantic right whales
have also occurred along the coasts of Norway, Greenland, Iceland, the Azores, and
inside the Gulf of Mexico (Moore & Clark, 1963; Jacobsen et al., 2004; Hamilton et al.
2007; 2009).
Figure 1.1 A Map of Historic North Atlantic Right Whale Habitat. Reproduced by
permission New England Aquarium.
Although identified critical habitat areas are often considered well understood and
monitored, only 60% of North Atlantic right whale calves are photographed with their
mothers inside the critical calving ground off the coast of Georgia and Florida annually
(NOAA, 2011). At least four North Atlantic right whale calves were born off the coast of

3
North Carolina, United States, well outside the identified critical calving ground
(McLellan et al., 2004). In addition, satellite telemetry tagging of individuals indicates
North Atlantic right whales can travel great distances in short periods of time (Mate et al.,
1997). An individual North Atlantic right whale has also been photo-identified transiting
from an identified calving ground to an identified feeding ground twice within three
months (Brown & Marx, 2000), suggesting that giving birth and nursing may not be the
only reason for North Atlantic right whales to utilize the identified critical calving
ground. Genetic research indicates only 45% of North Atlantic right whale fathers
currently belong to the genetic catalogue (Frasier et al., 2007), suggesting modern science
is unaware of the location of many North Atlantic right whale males from birth to sexual
maturity. A North Atlantic right whale breeding ground has recently been discovered
inside the Gulf of Maine during November – January (NMFS, 2012), potentially
accounting for a portion of the missing genetic population. Photo-identification
catalogues also indicate North Atlantic right whales show high inter-annual variability in
feeding ground locations, often not visiting a specific feeding ground for years at a time
(Hamilton et al., 2007; NMFS, 2012). Given these results, much remains to be learned
about North Atlantic right whale habitat use and distribution.

4
Figure 1.2. A Map of Modern North Atlantic Right Whale Habitat. Map reproduced with
permission from New England Aquarium.
1.3 Review of Population Growth Rate
While an international moratorium on commercial whaling of North Atlantic right
whales has been in effect since 1949 (ICRW, 1946), the population has been slow to
rebound. North Atlantic right whales sustained an average annual population growth rate
of 2.4% during 1990-2007, with annual growth rates ranging from 6.1% to -0.8%
(NOAA, 2011). In contrast, Southern right whales, a comparative population also
significantly reduced by the effects of commercial whaling, exhibit an average annual
growth rate of 6.2% (Best et al., 2001). While the North Atlantic right whale population
appears to be growing, the inter-annual variability of a comparatively low growth rate
(NMFS, 2011), combined with its foray into negative numbers (Caswell et al., 1999),
indicates these whales are struggling to survive at a population level.
5
Generically, a low growth rate is a function of high mortality and low birth rate.
Many factors may contribute to observed high mortality rates and low birth rates in North
Atlantic right whales (Kraus et al., 2001; 2005; Kenney, 2007; Rolland et al., 2007).
Genetic bottleneck effects resulting from commercial whaling may be partially
responsible for the long inter-calf intervals observed in female North Atlantic right
whales (Waldick et al., 2002). Genetic bottle neck effects may also be partially
responsible for high neonate and juvenile right whale mortality levels observed (Waldick
et al., 2002; Frasier et al., 2007) as a limited genetic pool may increase the probability of
birth defects, premature births, and still births, and decrease the probability of resilience.
Absorbed biotoxins as a result of living in polluted coastal areas may further contribute to
variable inter-calf intervals observed in female right whales (Reeves et al., 2001; Rolland
et al., 2007). Biotoxin presence may also negatively impact neonate and juvenile North
Atlantic right whale health (Kraus et al., 2001; Browning et al., 2010), further
contributing to observed high mortality rates. Changes in annual copepod locations and
life cycle timing that result from an increase in ocean surface temperatures may further
contribute to observed long and variable North Atlantic right whale inter-calf intervals as
mothers spend more time searching for food and less time accumulating the energy
reserves necessary to support successful pregnancy and high neonate survival rates
(Kraus et al., 2001; Kenney, 2007). Commercial whaling is currently banned worldwide
(ICRW, 1946), and thus has only residual impacts on North Atlantic right whale
population recovery. Ocean pollution and rising global sea temperatures may have more
direct effects on North Atlantic right whale population recovery (Kraus et al., 2001;
Kenney, 2007; Rolland et al., 2007). However, ocean pollution and rising sea
6
temperatures are also global issues that are hard to regulate in a timely and consistent
manner (Kenney, 2007). Thus, the ability of wildlife managers to regulate the causes of
ocean pollution and rising sea temperatures is limited to manager-specific watershed
jurisdictions, and therefore unlikely to produce a positive impact that will be felt
throughout known North Atlantic right whale habitat.
Currently, the largest known source of North Atlantic right whale mortality is ship
strike (Moore et al., 2005; Henry et al., 2011). Ship strikes result in an average of 1.6
known North Atlantic right whale mortalities per year (1.2 in the U.S., 0.4 in Canada)
(NOAA, 2011). While these numbers appear small, the National Oceanic and
Atmospheric Administration (NOAA) has set the potential biological removal (PBR) rate
for North Atlantic right whales at 0.8 individuals annually (2011). Therefore the average
ship strike mortality rate is above the prescribed PBR, and has accounted for up to four
known North Atlantic right whale mortalities annually (see Table 1.1) (Jensen & Silber,
2004; Henry et al., 2011). In 1993 and 2006, two of the four North Atlantic right whale
ship strike mortalities observed were adult females (Jensen & Silber, 2004; Henry et al.,
2011) In 2006 both ship struck adult females were killed while carrying near-term fetuses
(Jensen & Silber, 2004; Henry et al., 2012). The deaths of mature females are of
concern, as those deaths negatively impact the potential long-term North Atlantic right
whale population growth rate (Kraus et al., 2005). As the North Atlantic right whale
population appears to be sensitive to any biological removal (NOAA, 2011), it is crucial
to eliminate preventable North Atlantic right whale mortalities inside United States
waters if the population is to recover.

7
Year Ship strike
Mortality
Ship Strike
Serious Injury
1976 2 0
1977 0 0
1978 0 0
1979 1 0
1980 0 2
1981 0 0
1982 0 0
1983 1 0
1984 0 0
1985 0 0
1986 1 0
1987 0 1
1988 0 0
1989 0 0
1990 0 0
1991 2 1
1992 0 0
1993 4 0
1994 1 0
1995 0 0
1996 3 0
1997 0 0
1998 1 1
1999 1 0
2000 0 0
2001 2 1
2002 1 0
2003 1 0
2004 2 0
2005 2 1
2006 4 1
2007 0 0
2008 0 0
2009 0 0
2010 1 0
Table 1.1 Annual Ship Strike Mortality 1976-2010. Compiled from Jensen & Silber
(2003), Nelson et al. (2007), Glass et al. (2010), and Henry et al. (2011; 2012).
1.4 Ship Strike Mortality Reduction in United States Waters
North Atlantic right whales were so named because they were considered the
“right” whale to hunt (Frasier et al., 2007). As slow-moving whales found in coastal
waters that floated after death, North Atlantic right whales were heavily targeted by
commercial whaling fleets from 1000 A.D. – 1949 (Reeves et al., 2007). Whaling was
one of the leading economic industries in North America from 1630 – 1924 (Dolin,
8
2007). As a result many of today’s largest North American east coast ports are located in
or near historic right whale habitat (see Figure 1.1). Several large North American ports
are also located inside or near modern identified NARW critical habitat areas (see Figure
1.2). In 1995, commercial shipping contributed $8 billion in revenue and 9,000 jobs to
the port of Boston, Massachusetts (Haar & Cox, 1996). Commercial shipping increased
steadily during 2000-2007, contributing $19 billion in economic impact and 66,000 jobs
to the port of Jacksonville, Florida in 2009 (Martin Associates, 2009; Dalsoren et al.,
2010). Cruise ship passenger landings totaled 380,000 passengers at the port of Boston,
Massachusetts, in 2012, breaking records (Massachusetts Port Authority, 2012). This
increasing trend is predicted to continue through 2020 (Byington et al., 2011).
This dichotomy presents a serious challenge for wildlife managers in the United
States. North Atlantic right whales are protected under federal law by the Marine
Mammal Protection Act of 1972 (MMPA) and the Endangered Species Act of 1973
(ESA) (MMPA, 1972; ESA, 1973). Both of these acts are designed to limit negative
anthropogenic impacts on the North Atlantic right whale population (MMPA, 1972; ESA,
1973; Suckling & Taylor, 2006). The MMPA specifically makes it illegal to “take” a
marine mammal, where a “take” is defined as “to harass, hunt, capture, or kill, or attempt
to harass, hunt, capture or kill” marine mammals without holding marine mammal take
authorization permits (MMPA, 1972). Further, the ESA empowers wildlife managers to
develop species-specific recovery plans and to identify and protect areas considered to be
critical to population level recovery (ESA, 1973). The ESA specifically limits wildlife
managers, stating that critical habitat may not comprise all known habitat for an
endangered species (ESA, 1973). The ESA further requires wildlife managers to
9
designate critical habitat only if that designation, and thus subsequent protection, does not
negatively impact local economies and industries to the point where they cannot function
(ESA, 1973; Suckling & Taylor, 2006). While several rules have been passed aimed at
reducing North Atlantic right whale ship strike mortality within United States waters
(NOAA, 2004; 2008), ship strike remains the leading known cause of North Atlantic
right whale mortality (Henry et al., 2012).
United States rules aimed at reducing ship strike mortality involve limiting ship
proximity to North Atlantic right whales by re-routing commercial shipping lanes around
known North Atlantic right whale seasonal concentrations (NOAA, 2008), requiring
individual ships to maintain distances of at least 500 yards from any observed North
Atlantic right whale (NOAA, 2004), and reducing the speed of ships entering identified
North Atlantic right whale critical habitat areas and/or known seasonal concentrations
(NOAA, 2008). The success of these strategies relies on reducing co-occurrence of ships
and North Atlantic right whales, and on successful detection and avoidance of North
Atlantic right whales by mariners.
While many commercial ships post dedicated lookouts in and around reported
North Atlantic right whale concentrations, visual detection of North Atlantic right whales
is often difficult. North Atlantic right whales exhibit low, finless profiles when at the
surface, making them difficult to detect visually while transiting (see Figure 1.3). In
addition, North Atlantic right whales participate in skim feeding, a behavior in which a
North Atlantic right whale swims with its mouth open at or just below the surface of the
ocean for extended periods of time ingesting zooplankton (Mayo & Marx, 1990).
Subsurface skim feeding may make an individual North Atlantic right whale undetectable
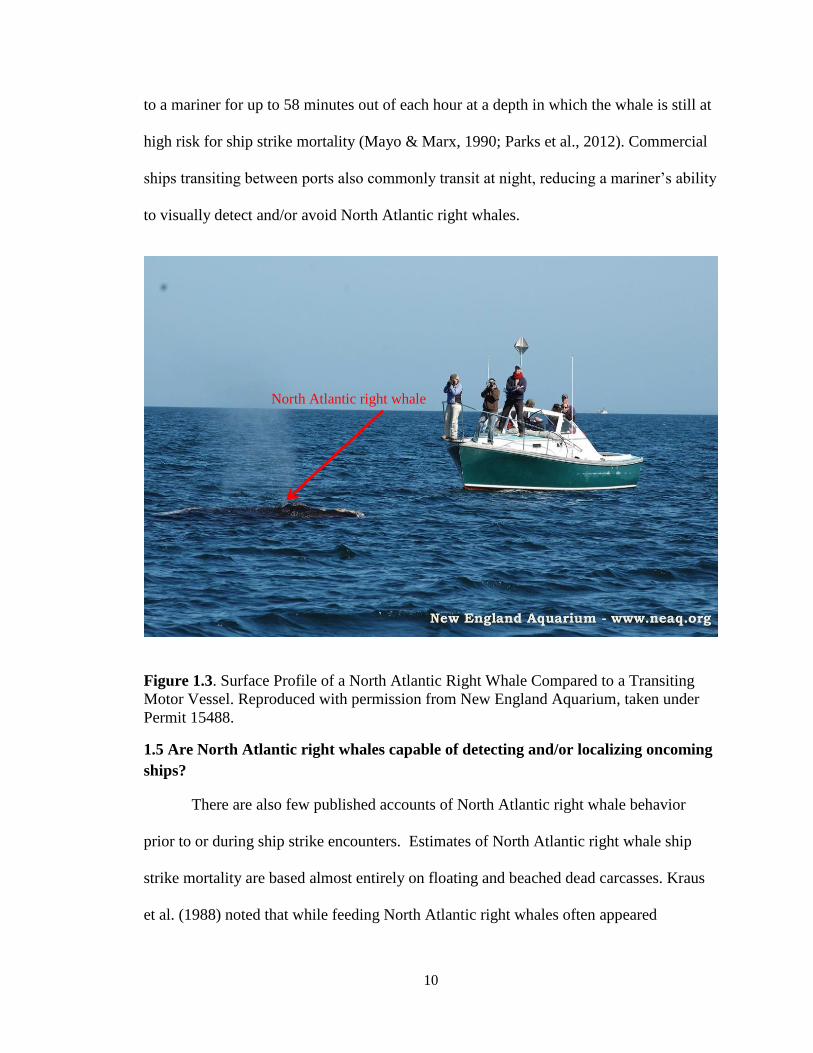
10
to a mariner for up to 58 minutes out of each hour at a depth in which the whale is still at
high risk for ship strike mortality (Mayo & Marx, 1990; Parks et al., 2012). Commercial
ships transiting between ports also commonly transit at night, reducing a mariner’s ability
to visually detect and/or avoid North Atlantic right whales.
Figure 1.3. Surface Profile of a North Atlantic Right Whale Compared to a Transiting
Motor Vessel. Reproduced with permission from New England Aquarium, taken under
Permit 15488.
1.5 Are North Atlantic right whales capable of detecting and/or localizing oncoming
ships?
There are also few published accounts of North Atlantic right whale behavior
prior to or during ship strike encounters. Estimates of North Atlantic right whale ship
strike mortality are based almost entirely on floating and beached dead carcasses. Kraus
et al. (1988) noted that while feeding North Atlantic right whales often appeared
North Atlantic right whale
11
oblivious to ships. Mayo & Marx (1990) observed that on 64 of 137 occasions, North
Atlantic right whales turned into the path of ships transiting parallel to them. Richardson
et al. (1995) reported that North Atlantic right whales tend to move away from rapidly
approaching ships. Terhune & Verboom (1999) observed an individual North Atlantic
right whale swimming directly into the path of a transiting ship. Nowacek et al. (2004)
noted that five of six tested North Atlantic right whales rose to the surface to investigate a
near-stationary ship playing back a series of “alert” signals. Although these accounts are
limited, and likely do not comprise the full range of individual North Atlantic right whale
reactions to close ship encounters, they indicate that in general, North Atlantic right
whales do not accurately detect and/or accurately localize moving ships. However,
research indicates that North Atlantic right whales may be capable of detecting and
localizing stationary ships playing back signals of at least 173 dB re 1μPa @ 1m
(Nowacek et al., 2004).
Current literature assumes that as a first approximation, North Atlantic right
whales should be able to acoustically detect and localize signals in the same frequency
and intensity ranges that comprise recorded vocalizations. This is supported by paired
acoustic and visual observations of individual North Atlantic right whales orienting
towards the location of vocalizing surface active groups (Parks, 2003). Therefore, North
Atlantic right whales should be able to acoustically detect and localize audio signals 50-
2500 Hz at signal to noise ratio intensities of 43.8 – 51.8 dB re 1 μPa (Parks, 2003).
Published assessments of commercial shipping noise reveal that most ship acoustic
signatures are dominated by frequencies <1000 Hz, and are louder than 150 dB re 1 μPa
@ 1m when transiting at speeds greater than five knots (Arveson & Vendettis, 2000;
12
Hatch et al., 2008; McKenna et al., 2012). Current literature also suggests oceanic
background noise in these frequencies appears to be increasing as shipping traffic
increases (Hatch et al., 2008; Hildebrand, 2009). Recent broadband ambient noise levels
published for a variety of oceanic environments ranged from 92 - 140 dB re 1 μPa (Hatch
et al., 2008; Hildebrand, 2009; Parks et al., 2011), likely rendering individual ship
acoustic signatures detectable to North Atlantic right whales at close ranges. Why then,
do North Atlantic right whales appear able to accurately detect and localize a near-
stationary research vessel playing back an “alert” signal, but appear unable to detect,
localize, and/or react to oncoming ships?
This thesis chronicles an effort to characterize the acoustics of close whale/ship
encounters in an effort to determine if there are acoustic barriers to North Atlantic right
whales detecting a vessel’s signature, thereby facilitating such behaviors as turning into
the paths of oncoming ships. Specifically, this thesis asks: Are there acoustic
impediments that may prevent North Atlantic right whales from detecting and/or
localizing an oncoming vessel in time to successfully react to and avoid that vessel? If so,
can a North Atlantic right whale’s ability to detect and/or localize an oncoming vessel be
enhanced by a technological solution, potentially extending the North Atlantic right
whale’s ability to react in time to avoid ship strike mortality? Finally, is the
technological solution proposed and developed compatible with United States North
Atlantic right whale ship strike reduction policy?

13
1.6 Chapter Descriptions
Thus, Chapter 2 describes the effort undertaken to characterize the acoustic
environment during close North Atlantic right whale/ship encounters within an identified
critical feeding ground. Acoustic signatures were obtained from peer-reviewed literature
and input into a ray-tracing program. The ray-tracing program also included seasonal sea
temperatures and salinities measured at a variety of depths, obtained from the Gulf of
Maine Ocean Observation System (GOMOOS), for seven locations within the Gulf of
Maine (GOMOOS, 2008). Bottom rugosity for those same seven locations was obtained
from the United States Geological Survey (2004). All Gulf of Maine locations modeled
in the ray-tracing program were identified as having a high risk of North Atlantic right
whale ship strike mortality based on the co-occurrence of North Atlantic right whales and
shipping traffic. Results from the ray-tracing program models revealed the presence of
bow-null effect acoustic shadow zones in five of the seven modeled locations during the
summer and fall seasons for all ship acoustic signatures modeled. Bow-null effect
acoustic shadow zones appeared in the model 189 of 196 scenarios, and varied in length,
depth, and aspect ratio based on season, ship type, and location modeled.
Chapter 3 verifies the presence of the modeled bow-null effect acoustic shadow
zones by recording three-dimensional orbital sound spectra from passing vessels located
in the Bar Harbor, Maine shipping channel June – September 2009. Ship source levels
recorded ranged from 178 ± 3.1 to 219 ± 3.8 dB re 1μPa@1m. Ship noise radiated
asymmetrically, and was observed to be loudest at the stern aspect and quietest at the bow
aspect regardless of ship type. Bow null effect acoustic shadow zones were also observed

14
in all four ship types recorded. The intensity of bow-null effect acoustic shadow zones
was found to vary with ship speed and vessel type, and to correlate with ship length to
draft ratios.
Chapter 4 describes the development, design and initial field-testing of a
technological solution to reduce and/or eliminate bow-null effect acoustic shadow zones.
Pre-recorded vessel noise was played back through a pair of underwater speakers at
specified depths and angles to change the orbital vessel sound spectra; thus providing
baleen whales with an increased opportunity to acoustically detect and/or localize an
oncoming ship. Field-testing was conducted on five different motor vessels within the
Bar Harbor, Maine shipping channel. Bow null effect acoustic shadow zones were
eliminated for all five ships tested at speeds of less than 5.5 knots.
Chapter 5 reviews the effect identifying critical North Atlantic right whale habitat
has had on ship strike mortality within United States waters. Chapter 5 identifies current
North Atlantic right whale ship strike reduction policy based on protecting North Atlantic
right whales within critical habitat areas, and then assesses if the technological solution
developed in Chapter 4 may become a viable ship strike reduction strategy within the
context of the Endangered Species Act.
Finally, Chapter 6 reviews the findings of Chapters 2-5, and provides suggestions
for future work.
15
CHAPTER 2
MODELING THE ACOUSTICS OF ENDANGERED MYSTICETE/SHIP
STRIKE INTERACTIONS IN THE GULF OF MAINE
2.1 Chapter Abstract
Shipstrike is one of the leading causes of mysticete mortality in the world,
particularly in the Gulf of Maine, a mysticete feeding ground. To determine if there is
acoustic basis for shipstrike mortality, we analyzed multiple factors contributing to
mysticete shipstrike events. These factors include: physical properties influencing the
speed, propagation and shadowing of sound both spatially and seasonally, vessel acoustic
signatures and shielding properties, and substrate-based reflection based on sediment type
and rugosity. In all sound velocity profiles, sound velocity reaches a maximum at the
surface, and declines rapidly during the first 10-50 meters below the surface, increasing
localization difficulty for mysticetes present in all identified risk areas. Sound velocity
profiles at all locations change due to seasonal variation in thermocline and halocline
depths, varying by as much as 30 m/s among locations during any single given season.
Furthermore, the reflectivity of ocean floor sediment type has a large impact on how
quickly a vessel’s signal attenuates, with mud reflecting the lowest signal intensity and
granite reflecting the highest signal intensity for each vessel signature analyzed; distinct
acoustic shadow zones develop in five of the seven areas modeled during the summer and
fall seasons. Regardless of the depth of the modeled area, at least one shadow zone is
present at the surface 100 meters – 2000 meters directly in front of the oncoming boat,
presenting a significant handicap to mysticetes attempting to detect and localize an
oncoming vessel.

16
2.2 Introduction
Whale-vessel collisions—or ship strikes—are one of the most common
anthropogenic causes of cetacean mortality. Data suggest that the U.S. eastern seaboard
has the greatest frequency of ship strikes world-wide (Jensen & Silber, 2003). More
specifically, the Gulf of Maine is of particular interest because of its established value as
a feeding area for several species. The geographic location of a strike often goes
unreported, making area-based protective measures difficult. Therefore, it is useful to
model areas of high-predicted ship strike risk.
Studies have demonstrated that the frequency of ship strikes is associated with both
vessel-specific factors and the species involved (Laist et al., 2001; Jensen & Silber,
2003). A vessel’s acoustic signature and the physical properties of the water column
surrounding the ship may be two of these factors (Blue & Gerstein, 2005). A vessel’s
acoustic signature varies with engine type and placement, propeller type and placement,
hull material, and speed (Arveson & Vendittis, 2000). In addition, the temperature,
salinity, depth, ocean floor sediment type, and rugosity all affect underwater transmission
of a vessel’s acoustic signature (Urick, 1983). Accordingly, a vessel’s acoustic signature
may change significantly over time, as speed and environmental factors change.
Furthermore, commercial vessels locate their main service engines and propellers at the
rear of the vessel, causing a portion of the engine-based acoustic signature to be reflected
by the hull before being transmitted into the water column, creating an acoustic shadow
directly in front of the vessel, known as the bow null effect (Arveson & Vendittis, 2000;
17
Blue & Gerstein, 2005). Thus, source environmentally-based variation in vessel acoustic
signatures may hinder a baleen whale’s ability to detect, localize and avoid potential
harmful encounters with shipping traffic.
Here, we develop a model that accounts for environmental variability in ship
acoustic signature propagation in seven areas previously identified to have high ship
strike mortality risk for North Atlantic right whales based on the co-occurrence of ships
and whales (Mahaffey, 2006). In developing this model, we used site-specific
oceanographic properties to simulate a two-dimensional sound field directly in front of a
vessel, thus characterizing the acoustic landscape a whale might experience. This model
will enable us to determine if and when acoustic shadow zones occur in these areas,
increasing the difficulty of detecting, localizing and avoiding an oncoming vessel.
2.3 Methods
2.3.1 Modelling Relative Geographic Shipstrike Risk
Seven locations within the Gulf of Maine, the primary feeding ground for North
Atlantic right whales, were identified to have qualitative “high” ship strike mortality risk
based on predictive GIS modeling of the co-occurrence of North Atlantic right whales
and shipping traffic (Mahaffey, 2006). These seven regions are the Isle of Shoals, Great
South Channel, Lower Boston Traffic Separation Scheme (TSS), Massachusetts Bay, the
Inner Schoodic Ridges, Jordan Basin, and the Northeast Channel (Figure 2.1). Acoustic
models were developed for each of these seven identified locations in order to
characterize the acoustics of close North Atlantic right whale/ship encounters where the
risk of ship strike mortality was likely to be highest.

18
Figure 2.1. Buoy Locations Relative to Seven Previously Identified Ship Strike Risk
Areas within the Gulf of Maine. The location of the GOMOOS buoys utilized for
hydrography data are shown as black circles. High ship strike risk areas were previously
identified by Mahaffey (2006).
2.3.2 Modeling Acoustic Shipstrike Risk
The Gulf of Maine Ocean Observation System (GOMOOS) provided basic
hydrography data for Massachusetts Bay (Buoy A01), Isle of Shoals (Buoy B01), the
Inner Schoodic Ridges (Buoy I01), Jordan Basin (Buoy M01) and the Northeast Channel
(Buoy N01) from January 1, 2002 – December 31, 2007 (GOMOOS, 2008). Data
obtained included sea surface temperature and salinity, as well as temperatures and
salinities at multiple depths specific to each buoy. We separated all data by season (Jan-
Mar, Apr-Jun, Jul-Sep and Oct-Dec) and calculated pooled averages, standard deviations
and standard errors. We obtained equivalent oceanographic variables for the Boston TSS
and George’s Bank by using data from conductivity/temperature/depth (CTD) casts taken
19
on transects with similar coordinates (Flagg, 1987). The seasonal averages of water
temperatures and salinities used the same three-month season segregation as the
GOMOOS-derived data. We then converted seasonally averaged hydrography data to
sound velocity profiles for each of the seven identified collision risk areas using
Medwin’s equation for sound velocity
zSTTTTc 016.0)35)(01.034.1(00029.0055.05.42.1449 32 (2.1)
where c = sound velocity in meters per second, T = temperature in degrees Celsius, S =
salinity in practical salinity units, and z = depth in meters ( 1975).
Using Gulf of Maine 15 arc-second bathymetry data (Roworth & Signell, 2002)
and sediment data from the US Geological Survey East Coast Sediment Texture Database
(USGS, 2004) we identified the approximate depth and the average composition of the
sediment at each of the seven identified collision risk areas. We calculated an
approximate reflection coefficient for each risk area by multiplying the percentage of
each sediment type found in a given area by a standard reflection coefficient for that
sediment type. For example, in Jordan Basin, the mean sediment composition was 0.27%
gravel, 7.81% sand, 61.00% silt and 30.93% clay. Thus, the calculation for the sediment
reflection coefficient in Jordan Basin is seen below
3093.0*61.0*0781.0*0027.0* CSISAGJB RRRRR (2.2)
where RJB= reflection coefficient for Jordan’s Basin, RG = reflection coefficient of gravel,
RSA = reflection coefficient of sand, RSI = reflection coefficient of silt, and RC = reflection
coefficient of clay

20
In addition, we constructed mock rugosity profiles of the ocean floor in each of
the seven identified risk areas after determining “typical” patterns existing in those areas
from Gulf of Maine 15 arc second bathymetry data (Roworth & Signell, 2002) (Table
2.1).
Region
Minimum
Depth (m)
Maximum
Depth (m)
Mean
Depth (m)
Mean
Sediment Size
(phi units)
Combined
Reflection
Coefficient
(% reflectance)
Great South Channel -209 -35 -123 2.07 76.652
Inner Schoodic Ridges -254 -64 -140 6.36 59.706
Lower Boston TSS -211 -31 -111 1.91 77.188
Northeast Channel -351 -259 -311 4.54 69.834
Jordan Basin -305 -185 -242 6.92 56.550
Isle of Shoals -197 3 -91 3.95 70.398
Massachusetts Bay -214 -12 -73 2.24 75.723
Table 2.1. Characteristics of Potential Risk Areas.
We then input the above-derived data into Ray v.1.47, a MATLAB two-
dimensional acoustic ray-tracing program to determine underwater sound propagation in
the seven identified shipstrike risk areas (Bowlin et al., 1992). An acoustic profile of the
M/V Overseas Harriette, a Japanese cargo ship (length 173 meters, displacement 25,515
tons, propeller depth 7.5 meters, average speed 15.5 knots) was used as a representative
ship design for all acoustic rays traced in this model (Arveson & Vendittis, 2000). For
any given model run, we traced 200 individual acoustic rays from the vessel to a distance
five kilometers ahead of the vessel, highlighting areas where acoustic shadow zones and
acoustic channels likely form under different seasonal and environmental factors in each
of the seven identified risk areas.
21
We qualitatively categorized the resulting sound fields derived by the model into
four grades of propagation impact (low, mild, moderate, severe), based on the influence
of environmental variables on signal transmission. We propose that environments that
minimally affect propagation constitute low ship strike risk areas, as signal degradation is
minimized and thus vessel detection is maximized. For example, low propagation impact
may be characterized by highly reflective sediments, little variation in ocean floor depth,
a homogenous sound velocity profile, and few shadow zones. Severe propagation impact
may be the result of highly absorptive sediments, significant variation in ocean floor
depth, a heterogeneous sound velocity profile, and the presence of three or more acoustic
shadow zones within the first kilometer ahead of the boat.
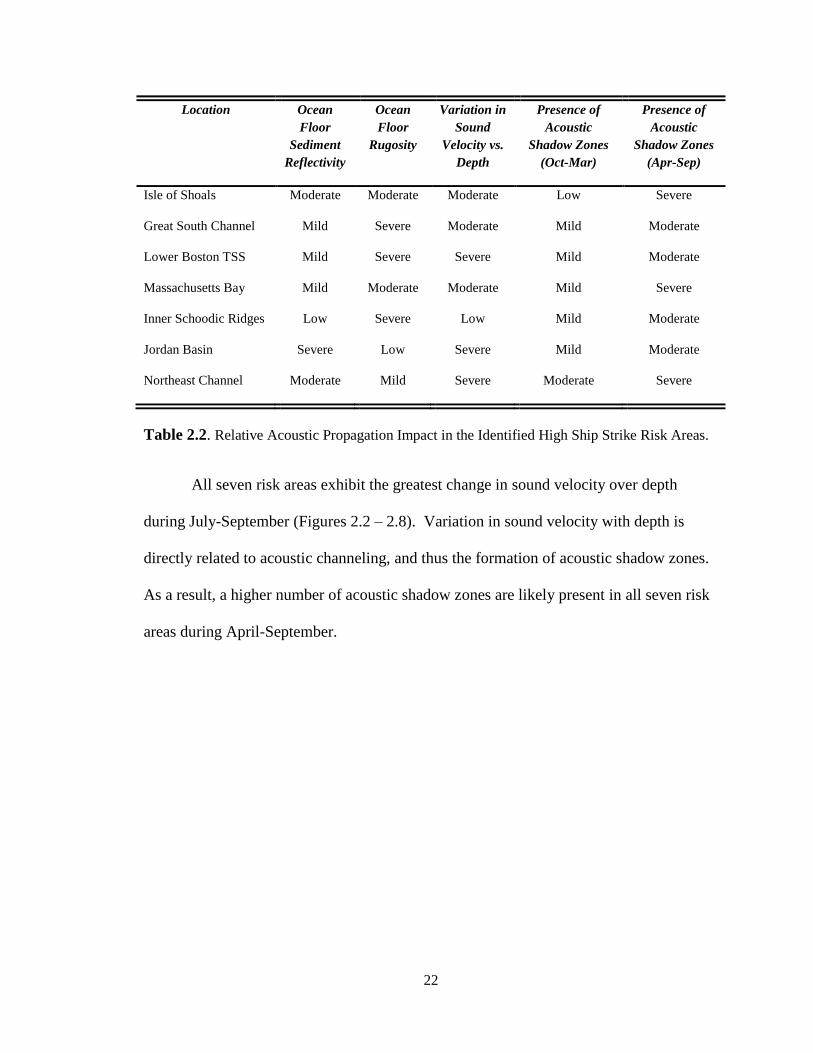
2.4 Results and Discussion
Environmentally-induced impacts on signal propagation are summarized in Table
2.2. During the months of October – March, environmental impact on signal transmission
was significantly reduced in all areas except the Northeast Channel. For all seasons, the
most severe impact on acoustic propagation, and therefore the conditions most conducive
to hinder vessel detection appeared to occur at the Isle of Shoals, Massachusetts Bay, and
the Northeast Channel areas. We therefore identify these areas as higher risk for baleen
whale ship strike, based on their more cryptic propagation characteristics. The Northeast
Channel is an area with less dedicated survey effort compared to the other identified
geographic shipstrike risk areas. Given the results of our analysis, additional survey
effort in this area is encouraged.
22
Location Ocean
Floor
Sediment
Reflectivity
Ocean
Floor
Rugosity
Variation in
Sound
Velocity vs.
Depth
Presence of
Acoustic
Shadow Zones
(Oct-Mar)
Presence of
Acoustic
Shadow Zones
(Apr-Sep)
Isle of Shoals Moderate Moderate Moderate Low Severe
Great South Channel Mild Severe Moderate Mild Moderate
Lower Boston TSS Mild Severe Severe Mild Moderate
Massachusetts Bay Mild Moderate Moderate Mild Severe
Inner Schoodic Ridges Low Severe Low Mild Moderate
Jordan Basin Severe Low Severe Mild Moderate
Northeast Channel Moderate Mild Severe Moderate Severe
Table 2.2. Relative Acoustic Propagation Impact in the Identified High Ship Strike Risk Areas.
All seven risk areas exhibit the greatest change in sound velocity over depth
during July-September (Figures 2.2 – 2.8). Variation in sound velocity with depth is
directly related to acoustic channeling, and thus the formation of acoustic shadow zones.
As a result, a higher number of acoustic shadow zones are likely present in all seven risk
areas during April-September.

23
Figure 2.2. Calculated Seasonal Sound Velocity Profiles for the Lower Boston TSS.
Figure 2.3. Calculated Sound Velocity Profiles for the Great South Channel.
24
Figure 2.4. Calculated Seasonal Sound Velocity Profiles for Massachusetts Bay.
Figure 2.5. Calculated Seasonal Sound Velocity Profiles for the Isle of Shoals.

25
Figure 2.6. Calculated Seasonal Sound Velocity Profiles for Jordan Basin.
Figure 2.7. Calculated Sound Velocity Profiles for the Inner Schoodic Ridges.

26
Figure 2.8. Calculated Seasonal Sound Velocity Profiles for the Northeast Channel.
Rugosity, or the amount of variation in ocean depth over any given area, appears
to have little to no effect on acoustic ray transmission except when combined with highly
reflective ocean floor sediment types and shallow seas. In our study, the effects of
rugosity on acoustic ray transmission were only seen at the Inner Schoodic Ridges, where
large variations in ocean depth over small areas led to an increase in the number of
acoustic shadow zones present near the surface (within the first 30 meters). In all other
cases, rugosity had little to no effect on acoustic ray transmission, and thus is likely not a
significant consideration when modeling ship strike risk based on acoustic detection.
27
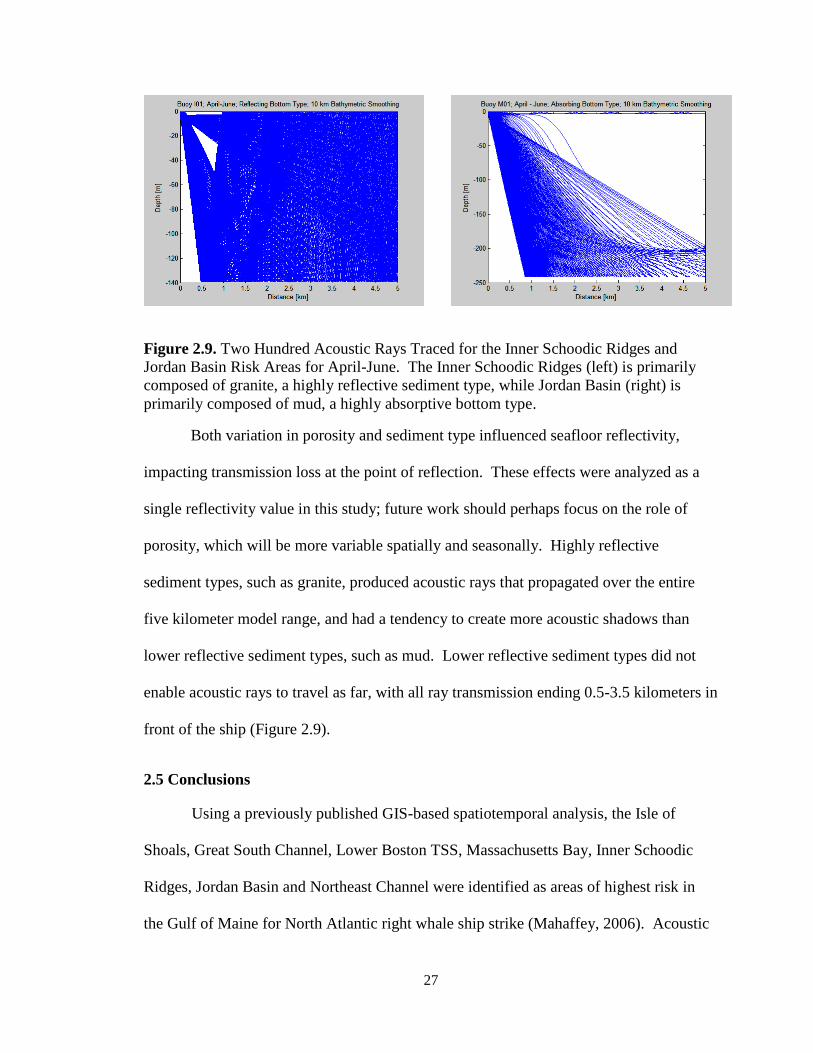
Figure 2.9. Two Hundred Acoustic Rays Traced for the Inner Schoodic Ridges and
Jordan Basin Risk Areas for April-June. The Inner Schoodic Ridges (left) is primarily
composed of granite, a highly reflective sediment type, while Jordan Basin (right) is
primarily composed of mud, a highly absorptive bottom type.
Both variation in porosity and sediment type influenced seafloor reflectivity,
impacting transmission loss at the point of reflection. These effects were analyzed as a
single reflectivity value in this study; future work should perhaps focus on the role of
porosity, which will be more variable spatially and seasonally. Highly reflective
sediment types, such as granite, produced acoustic rays that propagated over the entire
five kilometer model range, and had a tendency to create more acoustic shadows than
lower reflective sediment types, such as mud. Lower reflective sediment types did not
enable acoustic rays to travel as far, with all ray transmission ending 0.5-3.5 kilometers in
front of the ship (Figure 2.9).
2.5 Conclusions
Using a previously published GIS-based spatiotemporal analysis, the Isle of
Shoals, Great South Channel, Lower Boston TSS, Massachusetts Bay, Inner Schoodic
Ridges, Jordan Basin and Northeast Channel were identified as areas of highest risk in
the Gulf of Maine for North Atlantic right whale ship strike (Mahaffey, 2006). Acoustic
28
modeling suggested that within these areas propagation of a vessel’s acoustic signature
would be most compromised, and therefore acoustic-based detection of a vessel would be
most hindered, in the Isle of Shoals, Massachusetts Bay, and the Northeast Channel
during April-September. Acoustic propagation of vessel signature was modeled as
moderately impacted in the Great South Channel, Lower Boston TSS, Inner Schoodic
Ridges and Jordan Basin. During October – March impacts on propagation characteristic
were significantly reduced in all areas except the Northeast Channel.
Particularly, the presence of modeled bow null effect acoustic shadow zones is
likely to have a negative impact on the ability of baleen whales to accurately detect
and/or localize oncoming ships. Most animals respond to sensory gradients by moving
away from gradients likely to cause danger. In the case of bow null effect acoustic
shadow zones, North Atlantic right whales detecting oncoming ships in the presence of
this sensory gradient are therefore likely to avoid oncoming ships by following a
reduction in the overall sensory gradient; i.e. avoiding oncoming ships by moving closer
to the bow null effect acoustic shadow zone region. As bow null effect acoustic shadow
zones were present at all modeled locations and during every modeled season, it is
suggested that future studies focus on better identifying physical factors which contribute
to the formation of these shadow zones, the spatial area of these shadow zones, and
potential methods for reducing the presence of these shadow zones.

29
CHAPTER 3
IN SITU OBSERVATION OF SHIP ACOUSTIC PROPAGATION
3.1 Chapter Abstract
To understand mysticete acoustic-based detection of ships, radiated noise from
high-speed craft, cruise ships, catamarans and fishing vessels was recorded June-
September 2009. Calibrated acoustic data (<2500 Hz) from a vertical hydrophone array
was combined with ship passage information. A cruise ship had the highest broadband
source level, while a fishing vessel had the lowest. Ship noise radiated asymmetrically
and varied with depth. Bow null-effect acoustic shadow zones were observed for all ship
classes and were correlated with ship-length-to-draft-ratios. These shadow zones may
reduce ship detection by near-surface mysticetes.
3.2 Introduction
Shipping traffic has increased worldwide (International Maritime Organization
[IMO], 2007; 2009), coinciding with an increase in reported whale/ship collisions (Laist
et al., 2001; Panigada et al., 2006; Douglas et al., 2008; Carillo & Ritter, 2010) . Ship
collision has been identified as a significant anthropogenic cause of mysticete mortality
(IMO,2008; 2009), and as the leading known cause of mortality for highly endangered
North Atlantic right whales (Kraus et al., 2005; Moore et al., 2005).
The majority of reported whale/ship collisions indicate the ship hitting a whale,
but a number have noted mysticetes hitting slow moving ships (British Broadcasting
Company, 2010; Gabriele et al., 2011). Of the reported whale/ship collisions that have
been observed, in some documented cases an individual whale transiting parallel to a
30
vessel turned directly into the path of the ship (Mayo & Marx, 1990; Terhune &
Verboom, 1999). This action may imply the whale did not correctly detect and/or localize
the ship.
Long-range ship detection, or its failure, might be based in the acoustics of the
ship and the sensory perception of the whale. Current literature assumes that mysticete
hearing should encompass the same frequencies at which they vocalize (Richardson et al.,
1995). If this is accurate, the mysticete auditory range overlaps substantially with peak
intensities recorded from transiting ships (Arveson & Vendittis, 2000; Gerstein & Blue,
2005; Trevorrow et al., 2008; McKenna et al., 2012). Thus, mysticetes should have the
capacity to acoustically detect an oncoming ship (Richardson et al., 2005). Why, then, do
whale/ship collisions occur?
Several recent studies have analyzed concurrent distribution of ships and
mysticetes (DeStephanis & Urquiola, 2006; Todd et al., 2009; Ritter, 2010; William &
O’Hara, 2010). Additional work has considered probability of lethal impact based on ship
speed (Laist et al., 2001; Ward-Geiger et al., 2005; Vanderlaan & Taggert, 2007). Few
studies have examined three-dimensional propagation of ship acoustic signatures
transiting mysticete habitat. Combining ship spectral information and propagation with
whale behavior is critical to understanding the causes of mysticete shipstrike.
In this work, a vertical hydrophone array was used to record 24 ships of four ship
classes transiting the Bar Harbor, Maine, USA, shipping channel during June –
September 2009. Just offshore of this location is an important feeding habitat for
endangered North Atlantic right whales, and an established feeding ground for
endangered finback and humpback whales (Waring et al., 2011). Source levels were
31
calculated at hydrophone depths of 5, 15 and 25 meters to characterize the three-
dimensional acoustic environment a mysticete would encounter during a whale/ship
approach.
3.3 Methods
Received levels (RLs) were measured by obtaining calibrated vertical hydrophone
array recordings of ship acoustic signatures. The array was comprised of three
omnidirectional C54XRS hydrophones with flat frequency response range of 6 Hz - 203
kHz and calibrated sensitivity of -20 dB re: 1 V/μPa. RL data were associated with
transiting ship track data determined by onboard GPS recorders accurate to +/- 1 meter.
Ship orientation relative to the hydrophone array was calculated using directional
compass observations. After each passage, vertical sound speed profiles were calculated
using data from conductivity/temperature/depth (CTD) casts. Additional bathymetric
topography and sediment characterization data were obtained from the Gulf of Maine 15
arc-second bathymetry database (Roworth & Signell, 2002) and the U.S. Geological
Survey East Coast Sediment Texture Database (US Geological Survey, 2004)
respectively. The hydrophone array was suspended near the Bar Harbor shipping lane,
with water depth of 38.7-46.0 meters and a rocky sea floor (for sample ship tracks, see
Appendix A).
Ship GPS tracks were used to calculate ship speed and distance from the
hydrophone array. All ships recorded passed the array on their starboard side. Trials
were not used in data analysis if ships significantly changed their orientation or if
multiple ships were in close proximity to the hydrophone array.

32
Source levels (SLs) for each ship were calculated as follows:
( ) ( ) at location ( ) (3.1)
(3.2)
(3.3)
where RL = pressure level recorded by the hydrophone (dB re 1μPa2/Hz), SL = source
pressure level (dB re 1μPa2 @ 1m), r = ship range from the hydrophone array (m), N =
coefficient for geometric transmission loss (dB/m), α = coefficient for absorption
transmission loss (dB/m), d = hydrophone depth (m), θ = ship orientation relative to the
hydrophone array (directional compass degrees, fr = molecular relaxation frequency
(kHz), f = frequency (kHz), c= sound velocity (m/s), τr = molecular relaxation time of salt
water (s) (Urick, 1983; Arveson & Vendettis, 2000; Medwin, 2005)
Geometric transmission loss was further defined as follows:
(3.4)
If , then ( ) (3.5)
If , then ( ) until (3.6)
If , then ( ) (3.7)
where λ = wavelength (m), d= depth of the water column (m), and x = a constant specific
to each wavelength relative to the source depth (Urick, 1983).
33
Equation 3.5 applies to long wavelengths in comparison to water column depth,
accounting only for cylindrical spreading loss at low frequency components. For shorter
wavelengths, Equation 3.6 and Equation 3.7 are combined to calculate geometric
spreading loss in two portions: 1) from the source to the first wave bottom reflection and
2) from the first wave bottom reflection to the hydrophone location.
CTD casts and depth estimates were combined to calculate sound speed profiles
in a manner consistent with Mackenzie (1981). Sound speed profiles were used to
calculate the wavelength (m) at each frequency component of recorded ship acoustic
signatures, as well as to calculate the coefficient of absorption transmission loss (α) (see
Equation 3.2 and Equation 3.4).
SL calculations were made in 1 Hz bins from 1-2500 Hz for each ship recorded at
hydrophone depths of 5, 15 and 25 m. Source intensities in 1 Hz bins were integrated
over frequency to compute broadband pressure level at each depth. All SL calculations
reflect ship pressure variation above the ambient noise level; not a ship’s absolute source
level. As ship signal pressure is related to ship speed, all calculated SLs are for a specific
ship speed.
An estimate of the root mean square error in the SL calculation can be obtained
using the attenuation from a range of empirical values collected by Francois and Garrison
(1982) and the ΔSL = root mean square error (dB) relationship:
√ (
) ( ) ( ) )
(3.8)

Ship information (Lloyd’s Registry of ships) Maine DMR
Acoustic Measurements
Ship
Type
MMSI
number/
official
number*
Ship
length
(m)
Ship
draft
(m)
Year
built
Gross
tonnage
(103)
Horse
power
(103)
Propulsion
Type
Registration
number
Vessel
speed
(kts)
Range
at
CPAb
(km)
Received
level at
CPAc
Source
level
at 1
mc
Peak
frequency
(Hz)
Water
depth
at
CPA
(m)
Maximum
range data was
collected
bow-
aspect
(km)
Maximum
range data was
collected
stern-
aspect
(km)
Average
Ambient
Noisec
High Speed Craft
311364000* 97.2 3.4 2002 6.6 38.5 jet n/a 35.8 2.3 119 210 44 58.8 3.6 3.7 56
Cruise Ships
247117400a 203.2 6.2 2003 42.3 37.5 propeller n/a 21.9 1.7 129 219 44 56.1 2.1 2.1 56
311307000 294.1 8.2 2002 92.3 79.9 ADU n/a 19.3 2.5 96 203 48 59.7 3.1 3.2 64
244958000 219.2 7.7 1993 55.6 47.0 propeller n/a 17.4 2.8 91 196 40 62.4 3.5 3.4 59
311583000 293.2 8.5 2004 90.1 68.0 ADU n/a 20.5 1.9 116 210 43 57.2 2.6 2.5 52
Catamarans
1144667* 37.8 1.8 2003 0.5 7.2 jet n/a 29.9 0.6 97 189 45 57.2 2.7 2.9 67
1040508*,a
34.1 1.5 1996 0.2 2.7 jet n/a 27.4 1.5 117 197 44 25.9 3.4 3.4 43
1101923* 28.0 1.4 1999 0.1 3.1 jet n/a 27.1 3.2 84 201 46 35.8 4.1 4.3 54
Fishing Vessels
n/a* 12.1 1.2 1997 <0.1 0.5 propeller 221984 12.4 1.5 103 187 44 30.5 2.1 2.2 52
n/a 10.4 1.1 1994 <0.1 0.3 propeller 411937 18.6 0.7 133 193 50 36.6 1.3 1.4 58 n/a 11.6 1.2 1998 <0.1 0.6 propeller 313451 8.4 0.2 131 174 48 34.6 1.1 1.1 53
n/a 11.0 1.1 1985 <0.1 0.3 propeller 230474 13.5 1.1 112 181 43 37.2 1.9 1.9 54
n/a 11.3 1.1 1989 <0.1 0.4 propeller 468112 14.8 0.9 119 184 47 47.8 1.3 1.3 62
n/a 11.5 1.1 2003 <0.1 0.4 propeller 213975 11.2 1.8 113 192 45 61.5 2.2 2.1 59
n/a 10.8 1.1 1999 <0.1 0.3 propeller 233856 16.9 2.0 101 188 44 54.9 2.4 2.4 55
n/a 12.2 1.2 1991 <0.1 0.6 propeller 329644 18.4 1.6 118 195 46 52.7 2.1 2.0 56
n/a 11.6 1.2 2000 <0.1 0.6 propeller 213765 15.9 1.3 115 187 46 34.8 1.8 1.7 74
n/a 11.6 1.2 2001 <0.1 0.5 propeller 319017 15.2 2.1 95 184 44 39.7 2.4 2.5 69 n/a 12.2 1.2 2006 <0.1 0.6 propeller 412556 13.7 0.6 126 182 48 55.1 1.1 1.1 51
n/a 10.7 1.1 2003 <0.1 0.3 propeller 312884 11.6 0.5 129 180 51 56.3 1.2 1.1 55
n/a 12.2 1.2 2009 <0.1 0.5 propeller 114801 14.1 1.3 112 184 43 46.4 1.7 1.8 54
n/a 10.4 1.1 1998 <0.1 0.3 propeller 501873 12.9 1.5 107 182 44 37.2 1.9 2.0 65
n/a 11.0 1.1 1983 <0.1 0.3 propeller 591313 10.5 1.6 102 179 47 34.6 2.1 2.1 68
n/a 10.4 1.1 1992 <0.1 0.3 propeller 266474 9.9 1.9 98 178 49 35.9 2.3 2.4 49
*No MMSI Number available; official number as listed in Lloyd’s Registry of ships
aShips shown in Figs. 3.1 and 3.2.
bCPA is the closest point of approach
cdB re 1 μPa
2 (1-2500 Hz).
Table 3.1. Summary of Ship Characteristics.
34

35
3.4 General Spectral Patterns
A total of 24 ships in four ship classes were recorded (see Table 3.1). All four
cruise ships were placed in the same ship class for comparison purposes, although two
are azimuthal drive unit (ADU) –driven and two are propeller-driven. A single ship class
was used because when these ships are transiting an area at a constant bearing ADUs
function like regular propellers and the placement of working ADUs is similar to
comparable propeller placement.
The highest broadband source level was for a cruise ship and calculated to be 219
± 3.8 dB re 1μPa@1m, while a fishing vessel had the lowest at 178 ± 3.1 dB re
1μPa@1m. Difference in source level, in part, is likely a function of variation in ship
speed and size (gross tonnage). Comparison of all 24 ships showed a moderate effect on
SLs with increasing speed (R2
= 0.5017; n = 24) and increasing size (R2
= 0.3738; n =
24). However, this did not hold true when comparing ships within each ship class.
Increasing catamaran ship length resulted in a negative relationship with increasing SLs
(R2
= 0.9454; n = 3), while increasing cruise ship size had no relationship to increasing
SLs (R2
= 0.0757; n = 4).
The calculated SLs presented here are higher and qualitatively different than those
reported for modern commercial ships (McKenna et al., 2012), and may be attributed to a
difference in ship classes studied. In contrast to McKenna et al. (2012), commercial ships
in this study were smaller, transited at higher speeds and utilized multiple propulsion
methods, all of which could affect resulting SLs. In general, smaller vessels require less
power to propel them forward, and thus tend to exhibit lower broadband SLs than larger
vessels. In addition, increasing ship speed is often related to increasing broadband SLs.

36
Finally, modern commercial ship SLs recorded in McKenna’s study (2012) were from
propeller-driven ships, while SLs recorded by this study included propeller-, ADU-, and
jet-driven ships.
3.4.1 Radial Spectral Patterns
Three-dimensional acoustic data is shown for a subset of representative vessels in
Figure 3.1. Comparisons can be made between ship classes, however significant
variability also exists within ship classes. For additional three-dimensional ship passage
data, see Appendix B. Surface (5 m) and deep water (25 m) broadband SLs were 10-15 ±
2.8 dB less than mid-water (15 m) broadband SLs for the catamaran (Figure 3.1.c.) and
fishing vessel (Figure 3.1.d.). The catamaran and fishing vessel were observed transiting
the shipping lane at shallower water depths than the cruise ship (Figure 3.1.a.) and high-
speed craft (Figure 3.1.b. and Table 3.1). Lower RLs observed at 5m and 25m in the
smaller boats may be a result of variations in depth-dependent transmission loss at
frequencies higher than 100 Hz (Urick, 1983; Gerstein & Blue, 2005).
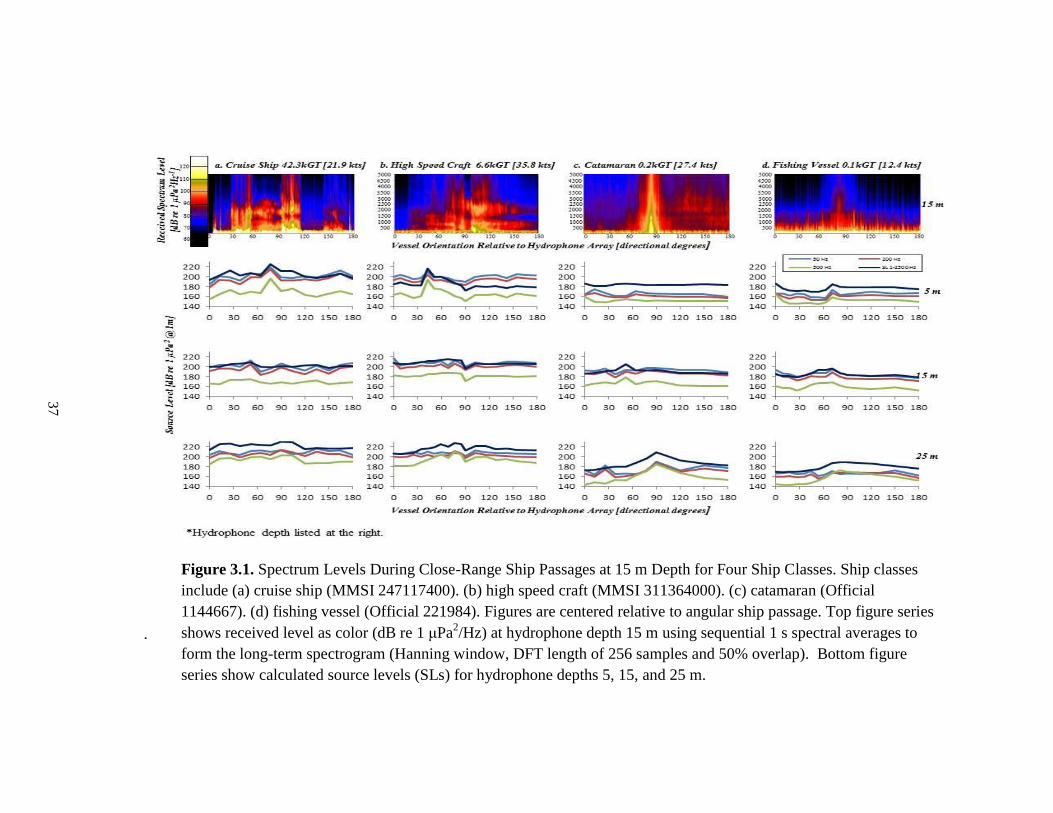
.
Figure 3.1. Spectrum Levels During Close-Range Ship Passages at 15 m Depth for Four Ship Classes. Ship classes
include (a) cruise ship (MMSI 247117400). (b) high speed craft (MMSI 311364000). (c) catamaran (Official
1144667). (d) fishing vessel (Official 221984). Figures are centered relative to angular ship passage. Top figure series
shows received level as color (dB re 1 μPa2/Hz) at hydrophone depth 15 m using sequential 1 s spectral averages to
form the long-term spectrogram (Hanning window, DFT length of 256 samples and 50% overlap). Bottom figure
series show calculated source levels (SLs) for hydrophone depths 5, 15, and 25 m.
37
38
All four ship classes exhibited peak (3 dB bandwidth) broadband SLs aft at
orientations >90˚ and minimum broadband SLs off the bow at orientations <60˚ at 25 m,
supporting previous data that deep water modern commercial ship acoustic signatures are
louder from the side-aspect and stern-aspect than from the bow-aspect (McKenna et al,
2012). This result was observed for all four ship classes despite differences in hull design,
propulsion-type and speed. Factors such as a poorly maintained propeller can increase
overall ship noise from cavitation bubbles (Arveson & Vendittis, 2000). Jet-propelled
ships may be quieter near the stern as jet-created bubbles absorb acoustic energy from
internal engines and generators (Medwin, 2005). Finally, variations in ship speed can
impact the directionality of a ship’s signal as different ship components (propellers,
engines, generators, etc.) dominate the acoustic signature at different ship speeds
(Arveson & Vendittis, 2000; Gerstein & Blue, 2005; Medwin, 2005).
All ship classes exhibited an increase of 1-15 ± 2.8 dB in 15˚ broadband SLs
relative to bow broadband SLs at 5 m, while no real pattern of increase emerged from
bow to 15˚ at other depths. This is indicative of bow-null effect acoustic shadow zones
(Gerstein & Blue, 2005; Trevorrow et al, 2008). This is a key result since mysticetes
located near the surface of the water column may thus have increased difficulty detecting,
and therefore avoiding oncoming ships.
3.4.2 Bow-null effect acoustic shadow zones
Bow null effect acoustic shadow zones (BNEASZs) were observed for all ship
classes (Figure 3.1). At 5 m depth, the cruise ship exhibited the greatest variation in
broadband source level from the bow to 15˚ (+15 ± 2.8 dB), while the fishing vessel had
the least (+6 ± 3.4 dB) (Figure 3.3). Although the high-speed craft and catamaran were

39
transiting at greater speeds than the cruise ship, they exhibited less change in broadband
source level from 0-15˚ (+11 ± 2.2 dB and +9 ± 2.4 dB respectively). This difference
suggests that hull construction and/or propulsion-type may play a larger role in the
development and size of observed BNEASZs than increased ship speed. Increasing length
to draft (L:D) ratios showed a positive relationship with increasing SLs observed from
the bow to 15˚ for all ship classes (R2=0.6252; n=4) (Figure 3.2). Thus, L:D ratios may
be useful when predicting radiated ship noise.
Figure 3.2. Broadband Source Level (SL) Change with Ship Orientation Change for
Four Ship Classes. Ship classes include catamaran (Official 1144667), high speed craft
(MMSI 311364000), cruise ship (MMSI 247117400), fishing vessel (Official 221984)
relative to ship speed (kts) and ship length to draft ratio. Increase in length to draft ratio
parallels increase in source levels from bow to 15˚. Source levels were recorded at 5 m
depth at frequencies 1-2500 Hz.
3.5 Implications for mysticete detection of oncoming ships
Assuming sufficient signal strength, North Atlantic right whales should be
physically capable of acoustically detecting all studied ship classes. North Atlantic right
whales located in near sea surface waters may experience greater difficulty localizing

40
oncoming ships than when they are located in deeper waters. This risk is the combined
result of lower SLs at the surface in shallow locations, BNEASZs, and masking from
ambient noise. As a consequence, the range of detection for a ship may be too close for a
North Atlantic right whale to execute a successful avoidance maneuver.
Future studies should model the 3-D acoustic environment created by several
oncoming ship classes in high-risk areas. Additional research could also focus on
examining North Atlantic right whale behavior relative to ship class to ascertain if
patterns of avoidance vary with ship class, hull design and/or propulsion method. Further
research should also seek to develop a method for reducing and/or eliminating the
presence of bow null effect acoustic shadow zones for different ship types. While it is
important to understand the physical environmental properties and the ship design
properties that contribute to bow null effect acoustic shadow zone formation, developing
a method for eliminating these shadow zones and/or maximizing ship acoustic signature
intensity at the bow could provide North Atlantic right whales increased opportunity to
acoustically detect and avoid oncoming ships. If a ship’s acoustic signature could be
made significantly louder from the bow to 15˚ only, such a solution might provide North
Atlantic right whales with an extended opportunity to accurately localize the presence of
oncoming ships, potentially reducing North Atlantic right whale ship strike mortality.

41
CHAPTER 4
AN ACOUSTIC METHOD FOR REDUCING NORTH ATLANTIC RIGHT
WHALE SHIP STRIKE MORTALITY
4.1 Chapter Abstract
International rates of baleen whale ship strike mortality are rising, corresponding
to an increase in commercial shipping traffic. Baleen whales possess reduced
chemosensory systems and environmentally limited vision, suggesting baleen whale
detection of oncoming ships is auditory. The presence of observed bow null effect
acoustic shadow zones in front of oncoming ships likely contributes to observed high
rates of baleen whale ship strike mortality. Here, we present an acoustic method to reduce
and/or eliminate the presence of bow null effect acoustic shadow zones from ship
acoustic signatures. Our method utilizes a dual speaker system attached to a ship’s bow to
project pre-recorded vessel noise ahead of oncoming ships. This method was tested on
five motor vessels in an outdoor environment to ascertain the feasibility of utilizing
acoustics to increase the opportunity for baleen whales to accurately detect and/or
localize oncoming ships, potentially reducing future instances of baleen whale ship strike
mortality.
4.2 Introduction
Baleen whales are protected from commercial hunting by an international whaling
moratorium (ICRW, 1946); however, anthropogenic causes remain the largest known
cause of mortality for many baleen whale populations (Carillo & Ritter, 2010, Kraus et
al., 2005). Specifically, ship strike mortality is the leading known cause of North Atlantic
right whale mortality, and a significant cause of finback, blue, gray, humpback, sei and

42
minke whale mortality (NOAA, 2011, Van Waerebeek et al., 2007, Panagaida et al.,
2006). While it is not known how baleen whales detect the presence of oncoming ships,
it is likely they primarily utilize acoustic cues. Baleen whales have underdeveloped
olfactory systems, and visual cues are unreliable in an oceanic environment (Wartzok &
Ketten, 1999).
There is no published audiogram for any baleen whale. Current literature
assumes baleen whales should be capable of detecting audio signals in the frequencies
and intensities they are heard vocalizing (Nowacek et al., 2004). In fact, given what is
known about ship acoustic signatures at source (Arveson & Vendettis, 2003), baleen
whales should be capable of acoustically detecting oncoming ships (Parks, 2003).
Contrary to this, baleen whales have been observed turning into the paths of transiting
parallel ships (Terhune & Verboom, 1999).
Recent studies have demonstrated that propagation of a ship’s acoustic’s signature
is complex. Research has recorded the presence of bow null effect acoustic shadow zones
located at the surface, directly ahead of oncoming ships, in a variety of oceanic
environments (Allen et al., 2012, Gerstein & Blue, 2005, Arveson & Vendettis, 2003).
Although the size and intensity of observed acoustic shadow zones vary with ship size,
ship speed, and ship length to draft ratios, bow null effect acoustic shadow zones have
been observed for all ship types recorded to date (Allen et al., 2012, McKenna et al.,
2012, Gerstein & Blue, 2005). We suggest the presence of bow null effect acoustic
shadow zones may impair the ability of a baleen whale to accurately detect and/or
localize an oncoming ship, contributing to this observed behavior and the resulting
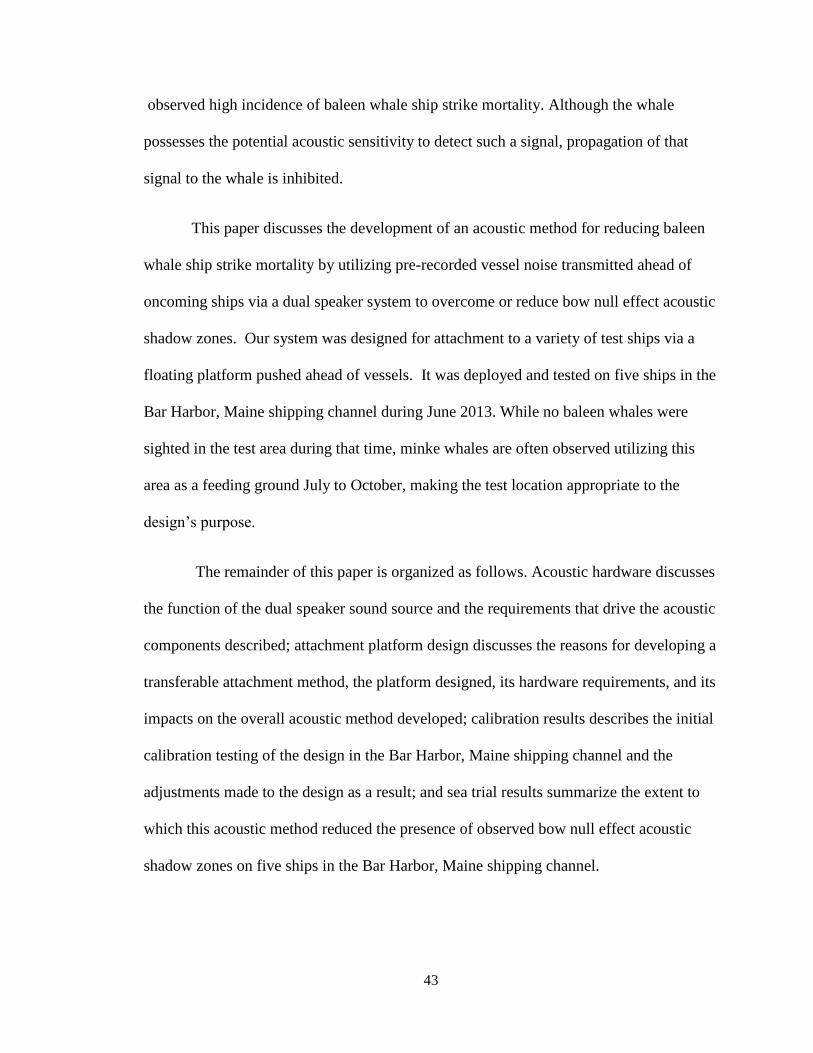
43
observed high incidence of baleen whale ship strike mortality. Although the whale
possesses the potential acoustic sensitivity to detect such a signal, propagation of that
signal to the whale is inhibited.
This paper discusses the development of an acoustic method for reducing baleen
whale ship strike mortality by utilizing pre-recorded vessel noise transmitted ahead of
oncoming ships via a dual speaker system to overcome or reduce bow null effect acoustic
shadow zones. Our system was designed for attachment to a variety of test ships via a
floating platform pushed ahead of vessels. It was deployed and tested on five ships in the
Bar Harbor, Maine shipping channel during June 2013. While no baleen whales were
sighted in the test area during that time, minke whales are often observed utilizing this
area as a feeding ground July to October, making the test location appropriate to the
design’s purpose.
The remainder of this paper is organized as follows. Acoustic hardware discusses
the function of the dual speaker sound source and the requirements that drive the acoustic
components described; attachment platform design discusses the reasons for developing a
transferable attachment method, the platform designed, its hardware requirements, and its
impacts on the overall acoustic method developed; calibration results describes the initial
calibration testing of the design in the Bar Harbor, Maine shipping channel and the
adjustments made to the design as a result; and sea trial results summarize the extent to
which this acoustic method reduced the presence of observed bow null effect acoustic
shadow zones on five ships in the Bar Harbor, Maine shipping channel.

44
4.3 Acoustic Hardware
Figure 4.1 Block Diagram of Acoustic Hardware and Power Flow.
A pair of calibrated underwater speakers (Lubell model LL916C, Columbus, OH)
were connected to a 100 watt amplifier (Peavey model Pvi4B 110, Meridian, MS) via
two speaker cables (HOSA model 16 AWG, Buena Park, CA). For specifications, see
Tables 4.1 and4.2. Pre-recorded ship noise 20-5000 Hz was played back through the
speakers via a recorder (Edirol model R-44, Los Angeles, CA) on a repeating two minute
loop. A 1400 watt generator (Subaru model R1700i, Lake Zurich, IL) provided the 110
volt AC current needed to power all components. For power system structure, see Figure
4.1.
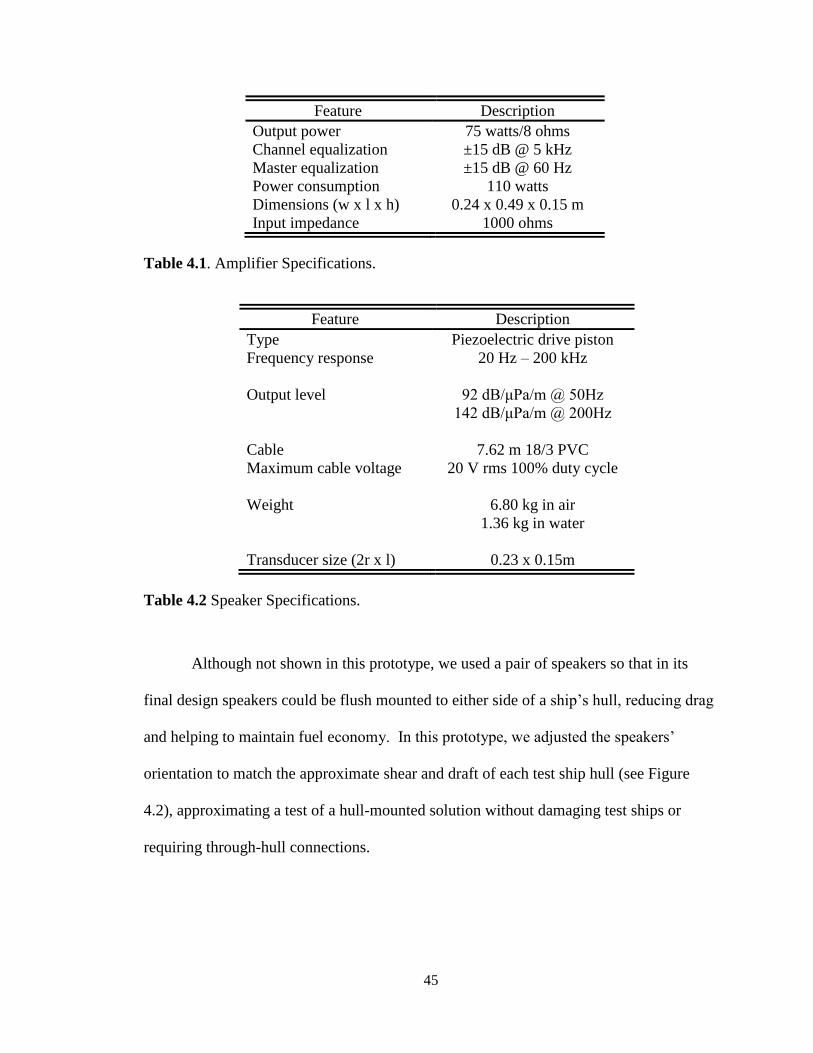
45
Feature Description
Output power 75 watts/8 ohms
Channel equalization ±15 dB @ 5 kHz
Master equalization ±15 dB @ 60 Hz
Power consumption 110 watts
Dimensions (w x l x h) 0.24 x 0.49 x 0.15 m
Input impedance 1000 ohms
Table 4.1. Amplifier Specifications.
Feature Description
Type Piezoelectric drive piston
Frequency response 20 Hz – 200 kHz
Output level 92 dB/μPa/m @ 50Hz
142 dB/μPa/m @ 200Hz
Cable 7.62 m 18/3 PVC
Maximum cable voltage 20 V rms 100% duty cycle
Weight 6.80 kg in air
1.36 kg in water
Transducer size (2r x l) 0.23 x 0.15m
Table 4.2 Speaker Specifications.
Although not shown in this prototype, we used a pair of speakers so that in its
final design speakers could be flush mounted to either side of a ship’s hull, reducing drag
and helping to maintain fuel economy. In this prototype, we adjusted the speakers’
orientation to match the approximate shear and draft of each test ship hull (see Figure
4.2), approximating a test of a hull-mounted solution without damaging test ships or
requiring through-hull connections.

46
Figure 4.2. Vertical and Angular Speaker Orientation Adjustments. Speakers are bolted
to aluminum plates welded to 0.06 m diameter pipe. The 0.07 m diameter pipe was bolted
to the attachment platform. The 0.6 m diameter pipe slid inside and underneath the 0.07
m diameter pipe. A bolt slid through holes in both pipes to allow for depth and angular
speaker adjustment.
4.4 Attachment Platform Design
An issue central to initial field testing of our prototype was for it to be
transferable to a variety of ships. We thus designed a floating platform to accommodate
variations in hull drafts and bow shears. Our platform allowed secure attachment of the
speakers at a variety of depths and angles with a degree of standardization that would
have been unachievable had we attached the speakers directly to each hull. The platform
also provided flexibility, adapting to differences in bow to waterline height, ship draft,
and bow width. For platform specifications, see Table 4.3.

47
Feature Description
Overall length 2.38 m
Overall width 0.66 m
Overall depth 1.23m
Bow width 0.33 m
Bow length 1.02 m
Keel length 2.47 m
Keel width 0.05 m
Keel depth 0.15 m
Minimum speaker depth 0.31 m
Maximum speaker depth 2.14 m
Distance between speaker centers 1.33 m
Testable speaker angles 0 degrees
20 degrees right of center
20 degrees left of center
Testable speaker depths 0.31 m
0.61 m
0.91 m
1.22 m
1.52 m
1.83 m
2.14 m
Platform extensions length 1.23 m
Minimum distance between platform
extensions
0.44 m
Maximum distance between platform
extensions
1.71 m
Table 4.3 Attachment Platform Specifications.
The introduction of a platform also presented challenges. As this acoustic method
is primarily concerned with reducing bow null effect acoustic shadow zones for
frequencies less than 500 Hz, the platform needed to be less than 2.4 m long in order to
avoid moving the test speakers more than one wavelength ahead of the test ship bow. As
a result of the moment induced on the speakers during test runs, downward force was
required on the rear of the platform at speeds greater than 3 knots to prevent platform

48
rollover. In addition, an extension was required that could be fitted to each hull width to
reduce lateral platform sway (see Figure 4.3). To increase platform tracking ability, a
false “keel” was laid onto the bottom. Finally, to reduce noise introduced by platform
improvements, thin rubber sheets were placed between all metal and/or wooden platform
components. Fire hose was glued to the exterior of the 0.06 meter diameter pipe to
reduce rattling between the angular and depth adjustment pipes. For additional prototype
photos, see Appendix C.
Figure 4.3 Prototype Attached to Test Ship Rhumbline Underway at 4.2 Knots. The
adjustable platform extensions are located below the rub rails, providing downward force
on the rear of the platform thereby increasing platform stability.
4.5 Calibration Results
The speaker/platform complex was anchored to the middle of the Bar Harbor,
Maine shipping lane on May 31, 2013. The generator and the electronic components
transmitted a single frequency recording increasing from 20-2500 Hz, 1/3 octave at a
time, with each tone having a 2 second duration. A calibrated vertical hydrophone array
was deployed to obtain received levels (RLs) for both speakers at a series of locations
stabilizing platform extensions
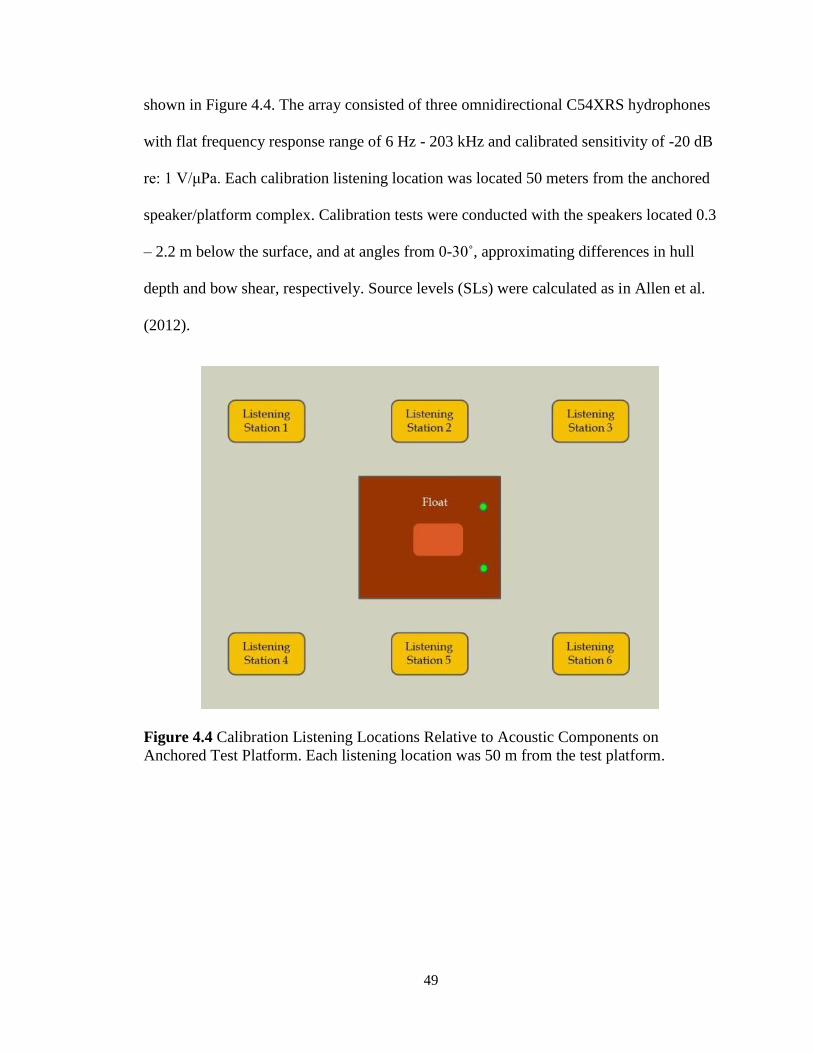
49
shown in Figure 4.4. The array consisted of three omnidirectional C54XRS hydrophones
with flat frequency response range of 6 Hz - 203 kHz and calibrated sensitivity of -20 dB
re: 1 V/μPa. Each calibration listening location was located 50 meters from the anchored
speaker/platform complex. Calibration tests were conducted with the speakers located 0.3
– 2.2 m below the surface, and at angles from 0-30˚, approximating differences in hull
depth and bow shear, respectively. Source levels (SLs) were calculated as in Allen et al.
(2012).
Figure 4.4 Calibration Listening Locations Relative to Acoustic Components on
Anchored Test Platform. Each listening location was 50 m from the test platform.

50
As a result of the speaker calibration testing, the low frequency (20-200 Hz)
master equalization was set 4 dB higher on the port speaker to account for a reduction at
frequencies 20-50 Hz relative to that recorded from the starboard speaker. In addition,
speaker depths during test ship trial runs were allowed to range from 0.9 -2.2 m below the
surface corresponding with differences in ship draft. Speaker calibration tests conducted
at depths less than 0.9 m resulted in reduced source levels at frequencies below 250 Hz.
4.6 Sea Trial Design and Results
Figure 4.5 Platform and Speaker Attachment to Test Ships.
For each test, the platform was attached to the bow of the ship as shown in
Figures 4.3 and 4.5. The supportive limbs were manually adjusted to the angle of each
test ship’s bow. When a bow rub rail was present, the supportive limbs were positioned
directly below the rub rail to increase platform stability (see Figure 4.3). All lines were
secured to the test ship as shown in Figures 4.3 and 4.6.
51
Figure 4.6 Platform and Speaker Attachment to Test Ships via Stabilizing Lines.
Received levels (RLs) were measured by obtaining calibrated vertical hydrophone
array recordings of passing test ship acoustic signatures as detailed above. RL data were
associated with transiting test ship track data determined by onboard GIS recorders
accurate to ± 1 m. Ship orientation relative to the hydrophone array was calculated using
directional compass observations. After each passage, vertical sound speed profiles were
calculated using data from conductivity/temperature/depth (CTD) casts. Additional
bathymetric topography and sediment characterization data were obtained from the Gulf
of Maine 15 arc-second bathymetry database (Roworth & Signell, 2002) and the U.S.
Geological Survey East Coast Sediment Texture Database (U.S. Geological Survey,

52
2004) respectively. The hydrophone array was suspended near the Bar Harbor shipping
lane, with water depth range of 38.7-46.0 meters and a rocky sea floor (see Appendix A
for chart information).
Ship GIS tracks were used to calculate ship speed and distance from the
hydrophone array. All ships recorded passed the array on their starboard side. Test tracks
were conducted so test ships passed within 50 meters of the vertical hydrophone array at
their closest point of approach.
Source levels (SLs) were calculated as in Allen et al. (2012). SL calculations were
made in 1 Hz bins from 1-2500 Hz for each ship recorded at hydrophone depths of 5, 15
and 25 meters. Source intensities in 1 Hz bins were integrated over frequency to compute
the broadband pressure level at each depth. It is important to note that SL calculations
reflect the oncoming ship’s pressure variation above the ambient noise level; not the
ship’s absolute source level. As ship signal pressure is related to ship speed, all
calculated SLs are for a specific ship speed.
An estimate of the root mean square error in the SL calculation can be obtained
using the attenuation from a range of empirical values collected by Francois & Garrison
(1982) and the ΔSL = root mean square error (dB) relationship:
√ (
) ( ) ( ) ). (4.1)
where SL = source pressure level (dB re 1μPa2 @ 1m), RL = pressure level recorded by
the hydrophone (dB re 1μPa2/Hz), N = coefficient for geometric transmission loss
(dB/m), r = ship range from the hydrophone array (m), and α = coefficient for absorption
transmission loss (dB/m).
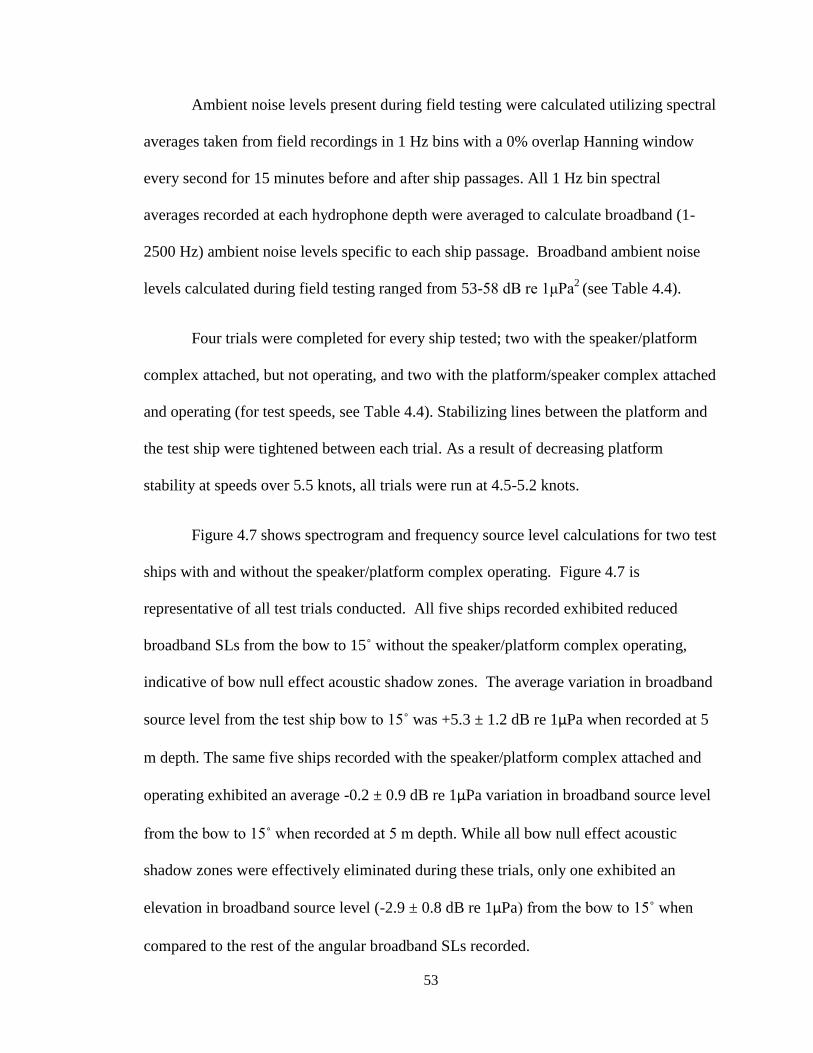
53
Ambient noise levels present during field testing were calculated utilizing spectral
averages taken from field recordings in 1 Hz bins with a 0% overlap Hanning window
every second for 15 minutes before and after ship passages. All 1 Hz bin spectral
averages recorded at each hydrophone depth were averaged to calculate broadband (1-
2500 Hz) ambient noise levels specific to each ship passage. Broadband ambient noise
levels calculated during field testing ranged from 53-58 dB re 1μPa2
(see Table 4.4).
Four trials were completed for every ship tested; two with the speaker/platform
complex attached, but not operating, and two with the platform/speaker complex attached
and operating (for test speeds, see Table 4.4). Stabilizing lines between the platform and
the test ship were tightened between each trial. As a result of decreasing platform
stability at speeds over 5.5 knots, all trials were run at 4.5-5.2 knots.
Figure 4.7 shows spectrogram and frequency source level calculations for two test
ships with and without the speaker/platform complex operating. Figure 4.7 is
representative of all test trials conducted. All five ships recorded exhibited reduced
broadband SLs from the bow to 15˚ without the speaker/platform complex operating,
indicative of bow null effect acoustic shadow zones. The average variation in broadband
source level from the test ship bow to 15˚ was +5.3 ± 1.2 dB re 1μPa when recorded at 5
m depth. The same five ships recorded with the speaker/platform complex attached and
operating exhibited an average -0.2 ± 0.9 dB re 1μPa variation in broadband source level
from the bow to 15˚ when recorded at 5 m depth. While all bow null effect acoustic
shadow zones were effectively eliminated during these trials, only one exhibited an
elevation in broadband source level (-2.9 ± 0.8 dB re 1μPa) from the bow to 15˚ when
compared to the rest of the angular broadband SLs recorded.
Ship information Maine
DMR/USCG Acoustic measurements
Ship name
Ship
length (m)
Ship
draft (m)
Year built
Gross tonnage
Horse power
Propulsion type
Registration number
Ship
speed
null 1 (kts)
Ship
speed
test 1 (kts)
Ship
speed
null 2 (kts)
Ship
speed
test 2 (kts)
Source
level @
1mc null 1
Source
level @
1mc test 1
Source
level @
1mc null 2
Source
level @
1mc test 2
Ambient
noise levelc
Passenger Vessels
Acadian* 19.8 1.2 1969 58 600 2 propellers 525499 4.6 4.8 5.2 5.1 122 138 125 146 53
Islander 17.7 1.1 1995 42 1140 2 propellers 907086 4.5 4.6 4.9 5.1 119 136 122 139 55
Fishing Vessels
Julie B* 11.0 0.9 2001 37 300 1 propeller 975940 4.5 4.6 4.9 5.0 121 137 122 143 54
Rhumbline 12.1 1.1 2003 40 350 1 propeller 1151471 4.7 4.9 5.1 5.2 122 135 123 139 58
Frenchman Bay
11.6 1.0 2008 39 450 1 propeller 1107341 4.9 5.1 5.2 5.2 119 141 126 144 58
*Ships shown in Figure 4.7 aMaine Department of Marine Resources registration number bUnited States Coast Guard registration number cdB re 1μPa2 (1-2500 Hz)
Table 4.4. Summary of Test Ship Characteristics.
54

Figure 4.7. Spectrum Levels During Close-Range Test Ship Passages at 5m Depth for Two Test Ships: Passages shown
are for (a) twin-screw vessel, Acadian, (b) twin-screw vessel, Acadian, with speaker/platform complex operating, (c)
single-screw vessel, Julie B, and (d) single-screw vessel Julie B with speaker/platform complex operating. Figures are
centered relative to angular ship passage. Top figure series shows received level as color (dB re 1 μPa2/Hz) at hydrophone
depth 5m using sequential 1 s spectral averages to form the long-term spectrogram (Hanning window, DFT length of 256
samples and 50% overlap). Presence of bow null effect acoustic shadow zones is indicated in top series with red arrows.
Absence of bow null effect acoustic shadow zones is indicated by green arrows. Bottom figure series show calculated
source levels (SLs) for hydrophone depths 5, 15, and 25 m.
55
56
By adding an additional source signal at the bow, this acoustic method changed
oncoming ship sound radiation patterns from those of monopole sources into those of
dipole sources. While the dipole source caused the bow-aspect signal to equal the stern-
aspect signal of oncoming ships at frequencies below 500 Hz, it did not cause the bow-
aspect signal to be substantially louder than the stern-aspect signal at these same
frequencies. The results in Figure 4.7 indicate the theory of maximizing an acoustic
signal at the bow of an oncoming ship will reduce bow null effect acoustic shadow zones.
This result should increase the opportunity for baleen whales to detect an oncoming ship,
but is unlikely to increase the opportunity for accurate localization of oncoming ships.
The opportunity for accurate localization of the acoustic signal propagated by oncoming
ships by baleen whales should be increased by making the bow-aspect of the oncoming
ship substantially louder than any other aspect.
In order to accomplish this, future prototypes will focus on maximizing signal
intensity and directionality below 500 Hz. This maximization will be accomplished by:
1) increasing the size of the speakers to increase low-frequency speaker
directionality, and;
2) employing an array of at least four speakers, two forward facing and two rear
facing, to increase low-frequency speaker directionality and intensity.
Increasing speaker size will increase the source-size-to-wavelength-size ratio,
increasing the speaker directionality for frequencies less than 500 Hz. Employing an
array of larger forward-facing speakers and slightly smaller rear-facing speakers with

57
differing pre-configured source signal delays to each speaker will result in desirable
constructive and destructive wavelength interference among array speakers, increasing
low-frequency signal intensity and creating increased low-frequency signal directionality.
4.7 Conclusions
An acoustic method for eliminating the presence of bow null effect acoustic
shadow zones has been designed and tested on five ships in an outdoor environment.
Initial field tests indicate this is a viable method for eliminating the presence of bow null
effect acoustic shadow zones at speeds of five knots or less, increasing the opportunity
for baleen whales to detect oncoming ships.
Future testing of this method will maximize source signal intensity for
frequencies below 500 Hz by increasing speaker size and utilizing a speaker array to
create increased low-frequency signal directionality. These design alterations will make
the bow-aspect of an oncoming ship the loudest acoustic aspect, increasing the
opportunity for accurate baleen whale localization and avoidance.
When future designs meet these new design requirements, this acoustic method
should increase the opportunity for baleen whales to accurately detect and localize
oncoming ships, resulting in a reduction in baleen whale ship strike mortality across a
variety of ship designs and ocean environments.

58
CHAPTER 5
CRITICAL HABITAT AND ITS IMPACT ON U.S. NORTH ATLANTIC RIGHT
WHALE SHIP STRIKE REDUCTION POLICY
5.1 Abstract
Ship strike is the major anthropogenic source of mortality for severely endangered
North Atlantic right whales. Two primary tools are given to U.S. wildlife managers by
the Endangered Species Act post-listing to ensure species survival by reducing negative
anthropogenic impacts: 1) creating a recovery plan and 2) defining and protecting critical
habitat. This study reviews and analyzes the impact these strategies have had in reducing
North Atlantic right whale ship strike mortality in U.S. waters from 1973 to 2011.
Defining and protecting critical habitat poses distinct spatial and human-use overlap
challenges when applied to highly migratory species. Managers should consider two
different levels in designating critical habitat for highly migratory species such as the
North Atlantic right whale: permanently protected critical habitat in areas where species
take up seasonal residence, and temporarily protected migratory habitat to maintain
functional migration corridors between seasonal residence critical habitat areas.
Managers and stakeholders should also be aware that, given current definitions for North
Atlantic right whale critical habitat, human-use overlap in critical habitat areas is
inevitable. Instead of eliminating human-use in critical habitat, wildlife managers should
apply a combination of adaptive human-behaviors, functional habitat definitions, and on-
going habitat-use studies to reduce ship strike mortality, particularly for pregnant and
nursing females. Ascertaining methods to effectively manage North Atlantic right whale
critical habitat is particularly relevant as current regulatory actions aimed at reducing
North Atlantic right whale ship strike mortality will be reviewed by the National Oceanic
59
and Atmospheric Administration in December 2013, offering wildlife managers an
opportunity to adjust current ship strike mortality reduction strategies in order to improve
the population growth rate.
5.2 Introduction
The primary aim of the Endangered Species Act of 1973 (ESA) is to reduce or
eliminate the impact of commercial and federal activities on severely threatened or
depleted species in the United States until those species recover to an extent that they no
longer require federal protection to maintain a viable population (ESA, 1973). The ESA
enables wildlife managers to define critical habitat; i.e., portions of habitat currently or
historically occupied by a species that are inherent to its present-day survival (ESA,
1973). The ESA also limits wildlife managers, preventing all space occupied by a
species from being designated as critical habitat (ESA, 1973; Suckling & Taylor, 2006).
Designation of critical habitat can occur only after an economic cost/benefit analysis
demonstrates the conservation benefits of such designation outweigh the economic costs,
or if best available science indicates a habitat must be designated in order for an
endangered species to recover (ESA, 1973; Czech & Krausman, 2001).
While designating critical habitat is useful for focusing negative anthropogenic
impact mitigation efforts, this action does not specify management actions relative to that
habitat, and does not create a habitat preserve (Suckling & Taylor, 2006). To assist in
bridging this gap, the ESA enables managers to develop species-specific recovery plans
delineating mitigation actions necessary to ensure survival and recovery (ESA, 1973).
Recovery plans also define time frames for implementing management actions and

60
estimation of associated costs (ESA, 1973). Finally, the ESA requires a review of each
species recovery plan every 5 years to ascertain plan effectiveness (ESA, 1973; Czech &
Krausman, 2001).
While the ESA has experienced some success, many more listed species have
been extirpated than have recovered (Abbitt & Scott, 2001; Scott et al., 2006a).
Reviewers have pointed to a reduction in ESA funding, a lack of managerial efficiency,
and conflicting managerial priorities as potential reasons for lack of species recovery
under ESA protection (Wallace, 2003; Reeves et al., 2007; Hildreth, 2008).
Improvements in species status have been linked to the creation of species
recovery plans and definition of critical habitat (Suckling & Taylor, 2006). Most
endangered species that improve status post-ESA listing have been sessile, sedentary, or
have had limited ranges (Abitt & Scott, 2001; Scott et al., 2006b). Conversely habitat
fragmentation has been implicated as a reason for the lack of recovery in many highly
migratory species (Czech & Krausman, 2001; Scott et al., 2006b; Elvin & Taggert, 2008;
Bearzi, 2012). Non-recovering endangered species often suffer from a lack of scientific
understanding relative to population dynamics and habitat-use, preventing proactive
management actions (Abbitt & Scott, 2001; Suckling & Taylor, 2006; Hinch & DeSanto,
2011). Although seasonal high-use areas are often protected habitat, migration corridors
between these areas often do not receive similar protection (Czech & Krausman, 2001;
Elvin & Taggert, 2008; Bearzi, 2012) leaving individuals vulnerable to negative
anthropogenic impacts.

61
North Atlantic right whales, Eubalaena glacialis, herein after referred to as right
whales (this paper does not discuss their Pacific counterpart, E. japonica), were listed as
endangered following ESA enactment in 1973 and remain one of the most critically
endangered marine species listed (NMFS, 2005; 2012; Kraus & Rolland, 2007). Right
whales are a highly migratory species with the majority of current species range
contained within 80 km of the shore along the U.S. and Canadian eastern seaboards
(Kraus & Rolland, 2007; Asaro, 2012). Two major anthropogenic causes of mortality
have been identified for this species post-listing; ship strike and entanglement in fishing
gear. Ship strike mortality is currently the largest known cause of all right whale
mortality (Kraus & Rolland, 2007; Moore et al., 2007; Van Der Hoop et al., 2013).
Right whales are further protected by additional legislation within US waters.
The International Convention for the Regulation of Whaling (ICRW) banned commercial
harvesting of right whales in 1949, and right whales are also protected under the Marine
Mammal Protection Act (MMPA) of 1972 (ICRW, 1946; MMPA, 1972). While the
ICRW, the MMPA and the ESA all prevent takes of right whales, only the ESA provides
for habitat definition and protection (ICRW, 1946; MMPA, 1972; ESA, 1973).
In compliance with the ESA, the National Marine Fisheries Service (NMFS)
published a right whale recovery plan in 1991 (NMFS, 2005). NMFS updated this
recovery plan in July 2001 and August 2004 (NMFS, 2005). In compliance with
recovery plan goals, the National Oceanic and Atmospheric Administration (NOAA)
designated right whale critical habitat in 1994 (NOAA, 1994). Of the three areas
62
designated within the U.S., two include feeding grounds located within the Gulf of
Maine, and the third includes calving grounds located along the coast of Georgia and
Florida (NOAA, 1994; NMFS, 2005).
In 1991 the recovery plan estimated the right whale population at a minimum of
350 individuals (NMFS, 2005). As of 2011, the NMFS right whale stock assessment
estimates this population at a minimum of 396 individuals, indicating a minimum average
of 2.3 individuals per year accruing in the population during this time (NOAA, 2011).
The NMFS stock assessment report estimated a mean right whale population growth rate
of 2.4% during 1990-2007 (NOAA, 2011). This low growth rate combined with a
significant decrease in crude survival probability during 1980-1994 (Caswell et al., 1999)
has contributed to stable and/or decreasing right whale population estimates (NMFS,
2005, 2012; NOAA, 2011).
Wildlife managers listed right whales as one of the first endangered species under
the ESA, published right whale recovery plan over 20 years ago, designated right whale
critical habitat more than 15 years ago, and as of yet right whales have not exhibited
significant gains in population growth or survival rates. As such, this paper will examine
the specific impact defining and protecting critical habitat has had on reducing right
whale ship strike mortality during 1973-2011. This paper will focus on wildlife
management actions taken to reduce negative anthropogenic impacts under the ESA
within designated right whale critical habitat areas. Finally, this paper will develop
recommendations to improve the efficiency of future critical habitat management
methods, particularly for similar highly migratory species listed under the ESA.

63
5.3 Negative anthropogenic impact mitigation actions, 1970-1995
After listing right whales under applicable protected species acts in the 1970s,
U.S. wildlife managers appointed the Northern Right Whale Recovery Team in 1987 (see
Figure 5.1) (NMFS, 2005, 2012). As required by the ESA, this team published a recovery
plan in 1991, in which anthropogenic mortality from ship strike and entanglement in
fishing gear were identified as the two largest threats to species recovery (ESA, 1973;
NMFS, 2005). Following ESA recovery plan recommendations, two regional
implementation teams were formed; one for southeastern calving grounds (SEIT) in 1993
and one for northeastern feeding grounds (NEIT) in 1994 (NMFS, 2005). While both the
SEIT and the NEIT included representatives from multiple stake-holder groups, the NEIT
also included international representation from Canada’s Department of Fisheries and
Oceans (NMFS, 2005). In 1993 the SEIT began conducting seasonal aerial surveys in
calving grounds to determine right whale habitat-use, gather population information, and
to alert ships to the presence of right whales (NMFS, 2005).
Figure 5.1. Timeline of Actions Taken by US Wildlife Managers to Protect North
Atlantic Right Whales from Negative Anthropogenic Interactions from 1970 to 1995.
Two distinct periods of activity occur; one in which North Atlantic right whales are listed
under applicable legislative acts, and a second period following publication of the
recovery plan in which basic stock assessment and habitat-use evaluations begin.
64
In 1994 critical right whale habitat was designated under the ESA, consisting of
two feeding grounds within the Gulf of Maine and one calving ground along the coasts of
Georgia and Florida (see Figure 5.2) (ESA, 1973; NOAA, 1994). Also in 1994, the SEIT
published the first issue of a quarterly newsletter available to mariners and the public in
an effort to educate both about the impact of ship strike mortality on the right whale
population (NMFS, 2005). In 1995, the National Marine Fisheries Service (NMFS)
published its first annual right whale stock assessment report (NMFS, 2006).
Although it took wildlife managers 18 years to publish a recovery plan post-ESA
listing, once the recovery plan was published, additional anthropogenic impact mitigation
actions followed at a quicker pace (see Figure 5.1) (NMFS, 2005). As ship strike remains
the leading known cause of right whale mortality, and as major U.S. legislation aimed at
reducing right whale ship strike mortality is due to expire in December 2013 pending
review, this paper will focus on analysis of critical habitat definition impact on this issue
only.
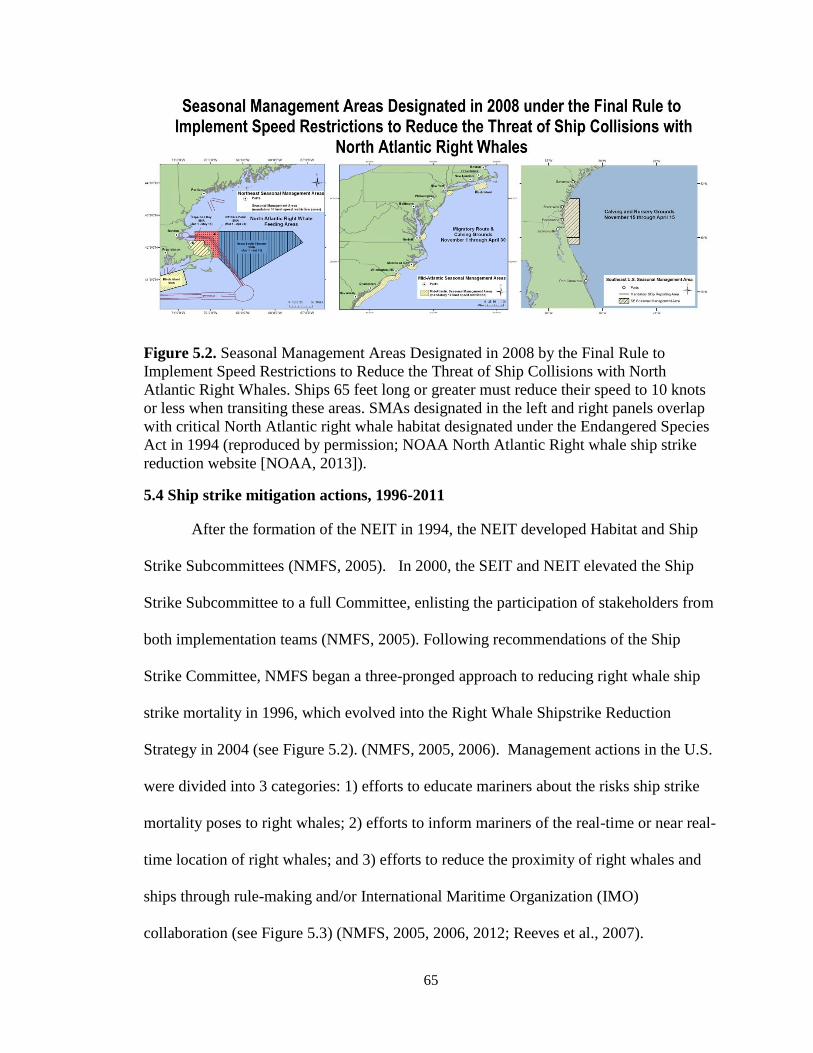
65
Figure 5.2. Seasonal Management Areas Designated in 2008 by the Final Rule to
Implement Speed Restrictions to Reduce the Threat of Ship Collisions with North
Atlantic Right Whales. Ships 65 feet long or greater must reduce their speed to 10 knots
or less when transiting these areas. SMAs designated in the left and right panels overlap
with critical North Atlantic right whale habitat designated under the Endangered Species
Act in 1994 (reproduced by permission; NOAA North Atlantic Right whale ship strike
reduction website [NOAA, 2013]).
5.4 Ship strike mitigation actions, 1996-2011
After the formation of the NEIT in 1994, the NEIT developed Habitat and Ship
Strike Subcommittees (NMFS, 2005). In 2000, the SEIT and NEIT elevated the Ship
Strike Subcommittee to a full Committee, enlisting the participation of stakeholders from
both implementation teams (NMFS, 2005). Following recommendations of the Ship
Strike Committee, NMFS began a three-pronged approach to reducing right whale ship
strike mortality in 1996, which evolved into the Right Whale Shipstrike Reduction
Strategy in 2004 (see Figure 5.2). (NMFS, 2005, 2006). Management actions in the U.S.
were divided into 3 categories: 1) efforts to educate mariners about the risks ship strike
mortality poses to right whales; 2) efforts to inform mariners of the real-time or near real-
time location of right whales; and 3) efforts to reduce the proximity of right whales and
ships through rule-making and/or International Maritime Organization (IMO)
collaboration (see Figure 5.3) (NMFS, 2005, 2006, 2012; Reeves et al., 2007).

66
Figure 5.3. Timeline of Actions Taken by US Wildlife Managers to Protect North
Atlantic Right Whales from Ship Strike Mortality from 1996 to 2011. Management
strategy combines mariner education with communication of real-time whale locations,
federal rulemaking, and international maritime routing measures to accomplish recovery
plan objectives. Only final outcomes of the federal rulemaking process are listed here.
5.4.1. Mariner education
In 1996, NMFS launched an effort to educate mariners about right whale ship
strike mortality vulnerability and about the locations of defined right whale seasonal
residence critical habitat areas in U.S. waters (NMFS, 2005). In 1997, NMFS added this
information to publications including U.S. Coast Pilots, Notice to Mariners, and Sailing
Directions (NMFS, 2005, 2006). Also in 1997, NMFS and the U.S. Coast Guard
collaborated to incorporate similar information into the International Safety Management
Code (NMFS, 2005).
In 1998, the Ship Strike Subcommittee added information on mariner avoidance
of right whales and on right whale seasonal habitat-use to the Cape Cod Canal Tide
Tables (NMFS, 2005). The Subcommittee also produced a free mariner right whale
education and avoidance training video, making this available to the maritime community
67
in 1999 (NMFS, 2005). In 2001 the Ship Strike Committee held a workshop inviting
mariners to assist wildlife managers in identifying voluntary right whale shipstrike
avoidance measures (NMFS, 2005).
In 2005, NMFS contacted other government agencies including the U.S. Navy
and the U.S. Coast Guard requesting they transit designated right whale critical habitat
areas at speeds of 12 knots or less, except when their missions would be compromised by
this speed reduction (NOAA, 2008). This was a request, not a formal mandate (NOAA,
2008).
In 2006, NMFS published and distributed fliers, brochures, and posters
highlighting new voluntary recommended ship entry and exit routes into 4 U.S. ports in
designated right whale critical habitat: Cape Cody Bay, Massachusetts; Brunswick,
Georgia; Fernandina Beach, Florida; and Jacksonville, Florida (NOAA, 2008).
Recommended routes reduced shipping traffic overlap with high seasonal concentrations
of right whales, thus promoting a theoretical reduction in the probability of right whale
shipstrike mortality (NOAA, 2008). Recommended routes were also published on
NOAA nautical charts and posted on NOAA and NMFS websites (NOAA, 2008, 2013).
Finally, advisories about the new recommended routes were broadcast via VHF and
NOAA weather radio to local and regional mariners (NOAA, 2013).
In 2008, prior to and following passage of a rule requiring vessels 65 feet or
greater to maintain speeds of 10 knots or less in Seasonal Management Areas, NMFS
created and distributed “compliance guides” and an interactive compliance training CD
(NMFS, 2012). NMFS further broadcast rule passage and compliance information via
68
NOAA weather radio, U.S. Coast Guard broadcasts, and the Mandatory Ship Reporting
System (NMFS, 2012). Finally, NMFS updated right whale information in mariner
publications to reflect the new rule and rule compliance requirements (NMFS, 2012).
In addition to other efforts, NMFS continually distributed right whale
informational posters, brochures and placards to the maritime community documenting
guidelines, rules and general right whale natural history (NMFS, 2005, 2006, 2012).
5.4.2 Direct efforts informing mariners of right whale locations
5.4.2.1 Aerial survey sightings
In 1997, NMFS initiated seasonal aerial surveys in critical habitat feeding grounds
in the Gulf of Maine (see Figure 5.3) (NMFS, 2005; Reeves et al., 2007). Feeding
ground aerial surveys were supported by opportunistic shipboard surveys conducted by
various stakeholders while engaged in work or research in critical habitat feeding grounds
(NMFS, 2005). Aerial surveys in calving and feeding grounds communicated real-time
right whale locations to vessels encountered during the survey, and broadcasted near real-
time right whale locations to mariners via NOAA weather radio, NAVTEX, and regional
and local U.S. Coast Guard radio broadcasts (NMFS, 2005, 2006). In addition, Cape Cod
Canal Traffic Controllers contacted individual vessels within the canal, informing them
of real-time right whale locations reported by aerial surveys (NMFS, 2006). In feeding
grounds, near real-time location of right whales reported by aerial surveys were used to
update the NMFS sightings advisory system website, fax sightings reports to port
authorities, harbor pilots, and shipping agents (NMFS, 2005). All of these efforts
continue today.
69
In 2001, experimental aerial surveys for right whales began in areas outside of
designated critical habitat (Reeves et al., 2007). These aerial surveys resulted in the
incorporation of annual seasonal aerial surveys along the coasts of North Carolina and
South Carolina beginning in 2004 (Reeves et al., 2007). In an effort to inform mariners
of the presence of right whales and specify actions mariners could take to reduce the
probability of right whale ship strike mortality, in 2005 NOAA began broadcasting
voluntary speed restriction advisories along with right whale locations from aerial
surveys (Reeves et al., 2007). In 2006, additional experimental aerial surveys included
areas in the Gulf of Maine and along the coasts of New York, New Jersey and Rhode
Island (NMFS, 2006). Although infrequent, these additional aerial surveys informed all
ships encountered of real-time right whale locations and communicated right whale
sightings to local broadcasting outlets (NMFS, 2006; Reeves et al., 2007).
5.4.2.2 Visual observers
The Ship Strike Subcommittee held a workshop in 1998 that developed a
partnership with Bay Ferries, placing visual right whale observers onboard the company’s
high speed ferry transiting from Bar Harbor, Maine to Yarmouth, Nova Scotia to reduce
the potential for right whale shipstrike mortality (NMFS, 2005). Right whale visual
observers continued to operate on these ferries until service was cancelled in 2009
(Trotter, 2013).

70
5.4.2.3 Mandatory ship reporting system
In 1999, the International Maritime Organization (IMO) approved and
implemented a U.S. Coast Guard proposal requiring all vessels over 300 gross tons
entering right whale critical habitat to call into a shore-based station, a mandate still in
operation today (see Figure 5.3) (NMFS, 2005, 2006). The ship calling then receives
messages containing recent right whale sightings in the area, and information on
detecting and avoiding right whales (NMFS, 2005, 2006). This Mandatory Ship
Reporting System (MSRS) operates year-round in designated critical habitat feeding
grounds and seasonally in designated critical habitat calving grounds (NMFS, 2006).
5.4.2.4 Passive acoustic monitoring
In 2007, NMFS deployed a real-time passive acoustic monitoring network to
reduce the probability of right whale ship strike mortality near a liquid natural gas
terminal and pipeline construction site in Massachusetts Bay (Bettridge & Silber, 2009).
In this on-going strategy, bottom-mounted acoustic buoys detect vocalizing right whales,
triangulate an approximate right whale location, and transmit this information via satellite
phone to transiting liquid natural gas ships (Bettridge & Silber, 2009). Transiting ships
involved in terminal construction or transporting liquid natural gas are required to
maintain speeds of 10 knots or less when transiting within 5 nautical miles of the
detecting acoustic buoy (Bettridge & Silber, 2009). This system was expanded to include
a second passive acoustic monitoring network in the Boston Traffic Separation Scheme
(TSS) in 2008 (Bettridge & Silber, 2009). Right whale vocalizations detected by this
network are communicated to local shipping traffic via the Boston TSS Sightings
Advisory System (Bettridge & Silber, 2009).
71
In 2012, NOAA launched the Whale Alert Application, linking right whale
vocalizations detected by passive acoustic monitoring networks in the Boston TSS to
mariner cell phones and tablets (NMFS, 2012). The Whale Alert Application is free,
although mariners must sign up for the app and pay any associated cellular service
charges (NMFS, 2012).
5.4.3 Rulemaking and IMO Collaboration
5.4.3.1 Rulemaking
Following Ship Strike Committee recommendations, NMFS published an interim
final rule in 1997 prohibiting ships and aircraft from approaching within 500 yards of a
right whale (see Figure 5.3) (NOAA, 2004). Exceptions to this prohibition include when
doing so endangers the lives onboard; the ship; or the aircraft; when ships are restricted in
their ability to maneuver; when ships are actively disentangling a right whale; or when
ships or aircraft are conducting permitted right whale research (NOAA, 2004). Thus,
NMFS hoped to reduce ship strike mortality by limiting ship proximity to right whales
(NOAA, 2004; NMFS 2005, 2012).
In 2000, NOAA published an advanced notice of proposed rulemaking, soliciting
comments on the appropriateness of codifying a set of right whale watching regulations
to reduce the potential for right whale ship strike mortality (NOAA, 2000; NMFS, 2005).
NMFS later decided not to pursue separate whale watching guidelines; instead relying on
the 500 Yard Approach Rule and the Ship Strike Reduction Rule speed restrictions to
reduce right whale ship strike mortality from this potential source (NOAA, 2004; 2008).

72
In May 2005, NMFS received a petition from multiple stake-holders calling for
emergency rule-making in order to immediately reduce right whale ship strike mortality
occurring inside critical right whale habitat areas (NOAA, 2005). This petition requested
NMFS create emergency regulations to reduce shipping traffic speed to 12 knots or less,
or re-route shipping traffic transiting right whale critical habitat (NOAA, 2005). NMFS
denied this petition, fearing that enacting such emergency rules would limit the amount of
public input to those rules and slow down efforts to create a more permanent and
comprehensive ship strike reduction rule (NOAA, 2005).
Following Ship Strike Committee recommendations and the Ship Strike
Reduction Strategy, NOAA published a Final Rule to “Implement Speed Restrictions to
Reduce the Threat of Ship Collisions with North Atlantic Right Whales” (Ship Strike
Reduction Rule) in 2008 (NOAA, 2008). This rule required vessels 65 feet or longer to
maintain speeds of 10 knots or less when transiting through a series of Seasonal
Management Areas (SMAs) surrounding U.S. ports and designated critical habitat areas
(see Figure 5.2) (NOAA, 2008). SMAs are located in permanent geospatial areas and are
effective annually when right whales are known to occupy or are thought to transit
through these areas (NOAA, 2008). SMAs overlap feeding and calving critical habitat off
the southeastern US coast, in Cape Cod Bay, and in the Great South Channel (NOAA,
2008).
The Ship Strike Reduction Rule also outlines the process undertaken for NOAA
to designate Dynamic Management Areas (DMAs) surrounding right whales sighted
outside of SMA locations (NOAA, 2008). Vessels transiting DMAs are advised, but not
required, to re-route around DMAs or maintain speeds of 10 knots or less when transiting

73
through DMAs (NOAA, 2008). Unlike SMAs, DMAs are triggered by right whale
sightings (NOAA, 2008). DMA size is dependent upon the density of right whales
located in or near a single sighting (NOAA, 2008). DMAs are effective for 15 days, but
may be extended if right whales continue to be present (NOAA, 2008).
Federal vessels, including military vessels, are exempt from the Ship Strike
Reduction Rule, as are police and search-and-rescue vessels engaged in a mission where
adhering to the speed restrictions within the Ship Strike Reduction Rule compromises
that mission (NOAA, 2008). In addition, the Ship Strike Reduction Rule is set to expire
on December 9, 2013, 5 years after the rule was passed (NOAA, 2008). The Ship Strike
Reduction Rule is set to expire in an effort to mitigate the negative economic impacts of
enacting and enforcing this Rule, should the Ship Strike Reduction Rule prove ineffective
at reducing right whale ship strike mortality inside critical habitat (NOAA, 2008). This
was a deliberate expiration, as there was a degree of scientific uncertainty as to how
effective the Ship Strike Reduction Rule may be at the time when it was enacted (NOAA,
2008).
5.4.3.2 IMO Collaboration
In 2007 the IMO approved a U.S. proposal to shift and narrow the east-west leg of
the Boston TSS to reduce overlap between shipping traffic and right whales in a critical
feeding habitat feeding, thus reducing the probability of right whale ship strike mortality
(NMFS, 2012; Silber et al., 2012). In 2009, the IMO approved a second U.S. proposal to
shift and narrow the north-south leg of the Boston TSS for the same reasons (NMFS,
2012; Silber et al., 2012). New Boston TSS lane locations were updated on navigational
charts and the U.S. Coast Guard TSS list (NMFS, 2012).
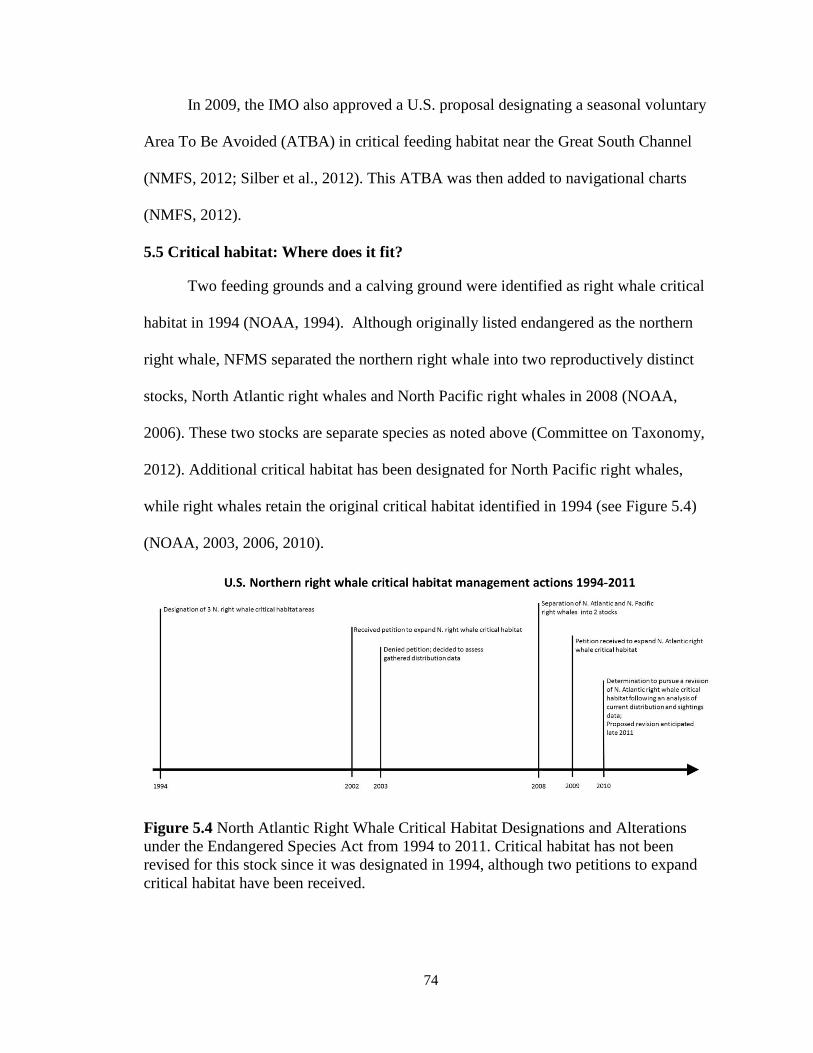
74
In 2009, the IMO also approved a U.S. proposal designating a seasonal voluntary
Area To Be Avoided (ATBA) in critical feeding habitat near the Great South Channel
(NMFS, 2012; Silber et al., 2012). This ATBA was then added to navigational charts
(NMFS, 2012).
5.5 Critical habitat: Where does it fit?
Two feeding grounds and a calving ground were identified as right whale critical
habitat in 1994 (NOAA, 1994). Although originally listed endangered as the northern
right whale, NFMS separated the northern right whale into two reproductively distinct
stocks, North Atlantic right whales and North Pacific right whales in 2008 (NOAA,
2006). These two stocks are separate species as noted above (Committee on Taxonomy,
2012). Additional critical habitat has been designated for North Pacific right whales,
while right whales retain the original critical habitat identified in 1994 (see Figure 5.4)
(NOAA, 2003, 2006, 2010).
Figure 5.4 North Atlantic Right Whale Critical Habitat Designations and Alterations
under the Endangered Species Act from 1994 to 2011. Critical habitat has not been
revised for this stock since it was designated in 1994, although two petitions to expand
critical habitat have been received.

75
Once critical habitat has been defined under the ESA, it does not mean that a
preserve has been created, or that habitat protection has been conferred (ESA, 1973;
Suckling & Taylor, 2006). Instead, it is up to wildlife managers to determine what levels
of protection areas of critical habitat need for a species to maintain a recovering
population growth rate (ESA, 1973; Suckling & Taylor, 2006). However, it remains an
important first step in targeting areas of interest that require particular management
oversight.
The question of what constitutes appropriate critical habitat protection is complex
for highly migratory species (Boyd et al., 2008; Elvin & Taggert, 2008). Because these
species require large spatial areas in order to feed, reproduce, and care for their young,
eliminating all human impacts from an area may be economically and/or culturally
impossible (Harwood, 2001; Fahrig, 2002; Boyd et al., 2008). This is particularly the
case for right whales, whose identified critical habitat areas overlap several major U.S.
shipping ports including Boston, Massachusetts and Jacksonville, Florida (NOAA, 1994;
Kraus & Rolland, 2007). Further, right whales estimated migratory habitat overlaps
nearly every U.S. east coast shipping port (NOAA, 1994; Kraus & Rolland, 2007). Thus,
eliminating shipping traffic completely from right whale critical habitat as a strategy to
reduce ship strike mortality remains unlikely because of competing economic pressures.
Following the designation of right whale critical habitat, U.S. wildlife managers
provided education and right whale detection support to assist mariners operating in these
areas in avoiding right whale ship strike mortality (NMFS, 2005). Informational
pamphlets and newsletters about right whale critical habitat-use became available to the
maritime community immediately following critical habitat designation, and continue
76
today (Reeves et al., 2007; NMFS 2005, 2012). In 1999 the Mandatory Ship Reporting
System became active in all three identified right whale critical habitat areas (see Figure
5.2) (NMFS 2005, 2006). This system originally requested mariners slow down or route
around right whale critical habitat, and communicated known locations of individual right
whales to local mariners (NMFS, 2005). Unfortunately, MSRS monitoring showed low
voluntary compliance rates (Ward-Geiger et al., 2005). This, along with a continued
increase in right whale ship strike mortalities, led to a series of vessel re-routing and
vessel speed reduction measures (Silber & Bettridge, 2010; Silber et al., 2012). Results
from habitat-use studies conducted in critical habitat led NOAA to establish
recommended routes for vessel travel into and out of 4 ports in 2006 to reduce right
whale/shipping use overlap (Merrick, 2005; Nichols & Kite-Powell, 2005; Bettridge &
Silber, 2008). Results from additional habitat-use studies conducted in critical feeding
habitat also resulted in narrowing and rotating the east-west and north-south legs of the
Boston TSS to reduce right whale/shipping use overlap in 2007 and 2009 (Merrick, 2005;
Silber et al., 2012). The 2008 Ship Strike Reduction Rule was enacted, requiring vessels
larger than 65 feet to maintain speeds of 10 knots or less when transiting through
identified seasonal critical habitat and port areas (NOAA, 2008).
Although it may be too soon to statistically determine what effect the Ship Strike
Reduction Rule and various vessel re-routing measures have had on right whale ship
strike mortality, the current literature indicates the overall location of large whale ship
strikes along the east coast has not changed significantly during 1970-2009 (Elvin &
Taggert, 2008; Silber & Bettridge, 2010; Pace, 2011; Van Der Hoop et al., 2013). If
anything, the probability of large whale entanglement and ship strike in the U.S.
77
increased from 1990-2009 (Van Der Hoop et al., 2013). This probability may have
increased as a result of increasing amounts of shipping traffic, as a result of increased
right whale ship strike mortality reporting, and/or as a result of lack of compliance with
current regulations (Van Der Hoop et al., 2013). Of note, the highest numbers of ship
strike mortalities are found in the mid-Atlantic region of the U.S.; a region not currently
designated as right whale critical habitat (Jensen & Silber, 2003; Nelson et al., 2007;
Henry et al., 2011; Van Der Hoop et al., 2013).
5.6 Dealing with habitat fragmentation: Can whales and vessels co-exist?
In the case of right whales, it appears the current designation of critical habitat has
led to habitat fragmentation; i.e., a phenomenon where portions of habitat necessary to
species’ survival has been reasonably protected, but a pathway from one of these
protected portions to the next has not been protected (Andrén, 1994; Harwood, 2001;
Boyd et al., 2008; Elvin & Taggert, 2008; Hinch & DeSanto, 2011). Thus, individual
right whales experience relative safety only in designated critical habitat areas, and
experience higher mortality rates outside of those areas, which may, at least in part,
account for slow, if any, population recovery.
Given that removing all shipping traffic from right whale habitat is not
economically viable, U.S. wildlife managers must find effective solutions to the question:
How can right whales and ships co-exist sustainably?
The ESA tasks U.S. wildlife managers with creating recovery plans and
identifying critical habitat areas so that a species is able to maintain population growth
rates at levels that allow that species not to require further federal protection in order to
sustain a viable population (ESA, 1973). Historically, wildlife managers identified right
whale critical habitat that accounted for feeding and calving, but did not designate any

78
critical habitat to assist individual right whales in migrating between those two critical
life activities (NOAA, 1994; Harwood, 2001; Elvin & Taggert, 2008; Hinch & DeSanto,
2011). Part of this hesitation may lie in reluctance to bring about negative economic
impacts through critical habitat protection, or perhaps in a lack of understanding
concerning right whale migratory habitat-use (ESA, 1973; NOAA, 2003; Reeves et al.,
2007; Firestone, 2009; Schick et al., 2009).
Initial attempts by wildlife managers to reduce right whale ship strike mortality
involved reasonable first strategies: designate well understood right whale critical habitat,
attempt to build voluntary consensus actions that reduce right whale ship strike mortality,
and when that fails, utilize rulemaking to reduce right whale shipstrike mortality by
regulating enforceable commercial actions inside designated right whale critical habitat.
However, as it is clear these strategies have not been enough to reduce right whale ship
strike mortality to potential biological removal (PBR) levels necessary to ensure species
recovery required under the ESA (Elvin & Taggert, 2008; NOAA, 2011; NMFS, 2012;
Van Der Hoop et al., 2013), managers should continue their efforts with a combination of
the following approaches.
1) Designate right whale critical migratory habitat based upon best available science.
2) Continue to conduct migratory habitat-use studies using the best available
technology.
3) Define the difference between protection levels required for migration and
seasonal residence habitat areas.

79
4) Develop short-term and long-term solutions specific to migration and seasonal
residence habitat areas to accelerate a reduction in right whale ship strike
mortality.
5.6.1 Designate critical migratory habitat based upon best available science
There may be resistance to designating critical habitat if wildlife managers do not
feel they understand how right whales use migratory habitat (ESA, 1973; NOAA, 2003,
2010; Firestone et al., 2008; Firestone, 2009; Schick et al., 2009). Although designation
of critical habitat under the ESA does not automatically confer habitat protection (ESA,
1973; Suckling & Taylor, 2006), it does focus managerial efforts (NMFS, 2005). Thus,
for highly migratory endangered species near human disturbances, designation of critical
habitat areas essential to feeding, breeding, calving or nursing without subsequent
designation of any migratory corridor connecting these habitats results in habitat
fragmentation, and slows the overall population recovery process (Harwood, 2001;
Fahrig, 2002; Boyd et al., 2008; Hinch & DeSanto, 2011). Indeed, doing so may
concentrate anthropogenic threats, such as ship strike, outside designated critical habitat,
increasing the probability that individuals within a species will be subjected to these
impacts along a migration corridor (Fahrig, 2002; Boyd et al., 2008; Hinch & DeSanto,
2011).
Best available science has produced models, but no direct evidence of right whale
migratory habitat-use since the late 1990s (Mate et al., 1997; Kenney et al., 2001;
Knowlton et al., 2002; Firestone et al., 2008; Firestone, 2009; Schick et al., 2009).
Further, designating critical habitat that does not include a migration corridor has not
significantly reduced anthropogenic mortality for right whales. As most large whale ship

80
strikes along the east coast of the U.S. continue to take place along the right whale
migration corridor (Glass et al., 2010; Henry et al., 2011; NOAA, 2011), designating
right whale critical migratory habitat based on current understanding of right whale
migration habitat-use is a logical and imperative next step.
5.6.2 Continue to conduct migratory habitat-use studies using the best available
technology.
In part, migratory critical habitat has not been designated because wildlife
managers do not understand exactly when right whales migrate, and through which exact
pathways (Kenney et al., 2001; Reeves et al., 2007; Firestone et al., 2008; Schick et al.,
2009; Hinch & DeSanto, 2011). There may be no predictable annual answer to these
questions, in part because variability in the marine environment may influence and
change the timing and availability of right whale prey (Harwood, 2001; Kenney et al.,
2001; Boyd et al., 2008; Hinch & DeSanto, 2011; NMFS, 2012) or navigational cues that
guide migration. For example, pregnant right whales might not migrate to calving
grounds until their own biological needs have been met (Garrison, 2007), and thus right
whale migration timing and routes may change considerably from year to year.
In addition, the majority of consistent right whale aerial, ship board, and acoustic
monitoring surveys have been conducted inside designated critical habitat (Reeves et al.,
2007; NMFS, 2005, 2006, 2012). This has limited the availability of financial resources
required to conduct these surveys in right whale migration habitat (Reeves et al., 2007;
Firestone, 2009; Silber et al., 2009), resulting in a prolonged lack of understanding about
right whale migration habitat-use.
81
Wildlife managers should re-examine the utility of satellite tagging, or other
similar long term tracking technology, to help better understand right whale migration
habitat-use (Reeves et al., 2007; Schick et al., 2009; Silber et al., 2009). Although
current tag attachment methods may be invasive (Mate et al., 1997; Baumgartner et al.,
2005; Mate et al., 2007; Silber et al., 2009), alternative attachment methods are being
developed which may allow for less invasive long-term tagging (Kamino, 2013). In
addition, the right whale population is small enough that tagging tracks from a few
migrating females could provide a significant increase in understanding migration timing,
migration routing, and preferred migration habitat (Reeves et al., 2007; Firestone, 2009;
Schick et al., 2009). It is important to monitor the right whale migration both from a
feeding ground to a calving ground, and from a calving ground to a feeding ground
(Schick et al., 2009); although impacts of the latter scenario may be prohibitive, as tag
attachment may negatively impact mother/calf proximity (Garrison, 2007). With the
development of less invasive attachment methods, wildlife managers may want to weigh
the consequences of tagging and tracking a few individual right whales against the
potential benefits of better understanding right whale ship strike vulnerability during
migration.
Wildlife managers should also consider reducing the amount of aerial surveys
flown in feeding and calving critical habitat, and consider increasing passive acoustic
monitoring in those areas to more cost-effectively monitor right whale seasonal resident
critical habitat-use (Reeves et al., 2007; Silber et al., 2009). The limited funding released
by this exercise might be better reprioritized to gain a more complete understanding of
right whale migratory habitat-use.

82
Knowledge gained about migratory habitat-use from these efforts should assist in
designating and revising right whale migration corridor critical habitat (Firestone, 2009;
Schick et al., 2009). Knowledge gained should also enable wildlife managers to ascertain
where and when right whales are most vulnerable to migration ship strike mortality
(Reeves et al., 2007, Firestone, 2009; Schick et al., 2009). This knowledge should inform
future ship strike mitigation actions.
5.6.3 Define a difference between protection levels required for migration and
seasonal residence habitat areas.
The ESA enables wildlife managers to designate critical habitat, but does not limit
wildlife managers by defining what constitutes habitat protection (ESA, 1973; Suckling
& Taylor, 2006). Accordingly, highly migratory species may benefit from two distinctly
different levels of habitat protection: permanently protected feeding, breeding, calving,
and nursing seasonal residence habitat combined with temporarily protected migration
habitat.

83
Seasonal Residence Habitat Migratory Habitat
Definition Allows limited amounts of low-
impact human use
Allows maximum, blanketed
species protection
Permanent protection allows for
least management flexibility
Allows most human uses
Allows minimum, directed
individual-responsive protection
Temporary protection allows for
maximum management flexibility
General
Migratory
Species
Application
Uses human- behavior
modification as main protection
tool
Uses only proven management
tools
Rules apply to fixed spatial
areas during fixed seasons,
reducing stakeholder confusion
Standardized species seasonal
habitat-use location information
is obtained
Location information obtained is
communicated through long-
term broadcasting outlets
Uses a combination of human-
behavior modification and
experimental technology as main
protection tools
Uses proven and potential
management tools
Rules and recommendations are
applied for short periods of time
and space
Standardized and opportunistic
individual location information
obtained
Near real-time location
information is communicated
through short-term broadcasting
outlets
North Atlantic
Right Whale
Application
Mandatory vessel re-routing,
vessel speed restrictions, and
onboard visual observers
Blanket restriction of
recreational activities that have
been shown to negatively impact
right whales
Continuous seasonal passive
acoustic monitoring combined
with periodic aerial surveys to
verify known habitat-use and
assist with population studies
Limited mandatory vessel re-
routing and vessel speed
restrictions, combined with
satellite tagging technology, and
aerial surveys
Use of experimental technology
on government vessels to better
locate individual right whales
and/or to alert right whales to the
presence of oncoming ships
Ongoing use of technology,
surveys, and verified opportunistic
sightings to ascertain migration
timing, routing and preferred
habitat
Table 5.1. Differences Between Seasonal Residence Critical Habitat and Migratory
Critical Habitat Protection. These differences have been applied to potential ship strike
reduction measures for migratory species in general, and North Atlantic right whales
specifically, inside each habitat-type.

84
Permanently protected seasonal residence feeding, breeding, calving, and nursing
grounds should limit the amount of human use within these designated critical habitats to
ensure species recovery (see Table 5.1). Limiting human-use should be aimed at
eliminating identified anthropogenic threats to a species within these critical habitats, yet
minimizing negative economic impacts by encouraging reasonable, low-impact human
uses (Vanderlaan et al., 2009; Wiley et al., 2011). Seasonal residence critical habitats
should use human-behavior modification as a means to maintain adequate annual
population growth rates. Proven anthropogenic impact mitigation methods and
technology should be used inside seasonal residence critical habitats in order to reduce
unintended impacts from new anthropogenic impact reduction technology and strategies
(Silber et al., 2009). Further, seasonal residence critical habitats should remain in
consistent locations and be valid during consistent portions of the year to reduce
stakeholder confusion. Designated seasonal residence critical habitats should make use
of rulemaking once mitigation needs are shown. Seasonal residence critical habitat areas
and the rules governing human-use inside them should be evaluated for effectiveness
every 10 years, and adjusted if needed to allow for management flexibility and
endangered species protection stability.
Critical migration habitat should allow for more human-use than seasonal
residence critical habitat areas, but should provide directed protection for migrating
endangered species. Limiting human-use in these areas should involve reducing
identified anthropogenic threats only in portions of migration habitat currently in use.
Because individuals do not normally take up long-term residence in migration corridors
(Mate et al., 1997; Firestone et al., 2008), migratory critical habitat should allow for

85
flexible individual protection, thus reducing negative economic impacts by allowing for
maximum sustainable human-use. A combination of human-behavior modification and
permitted experimental technology should be used to reduce spatial overlap between
humans and endangered species. Restrained use of rulemaking is required; instead the
focus should be on obtaining accurate endangered species location information and
communicating location information to stakeholders efficiently to prevent negative
anthropogenic impacts. Rulemaking should encourage the use of temporary, short-term
protection zones within the migratory habitat. Managers should also provide incentive for
increased reporting of negative anthropogenic impacts in these areas in order to better
understand endangered species habitat-use and anthropogenic impact vulnerability.
5.6.4 Develop short- and long-term right whale ship strike reduction solutions
specific to migration and seasonal residence critical habitat areas
Rulemaking is a long, complex process composed of many steps, most of which
require public notification and comment (ESA, 1973, NOAA 1994, 2000, 2005, 2008;
Reeves et al., 2007). As a result, wildlife managers in the U.S. cannot be expected to
designate critical habitat for an endangered species in one day, and adequately protect it
the next (Reeves et al., 2007). However, NOAA and NMFS have received several
petitions from stakeholders requesting revisions of right critical habitat and use of
emergency interim rulemaking in order to more effectively reduce right whale ship strike
mortality during 2000-2011 (NOAA, 2002; 2005; 2010). Those agencies have denied
each petition (NOAA 2003; 2005; 2010). Regardless of outcome, this series of petitions
highlights stakeholder frustration stemming from an important oversight in current right

86
whale ship strike mortality reduction strategies: a lack of development and
implementation for short- and long-term right whale ship strike mitigation solutions
(Reeves et al., 2007).
Accordingly, wildlife managers should apply the migratory and seasonal
residence critical habitat labels to establish a series of both short- and long-term
management goals to accelerate a reduction in right whale ship strike mortality. Short-
term solutions may be phased out once long-term solutions become available. For highly
endangered species such as the right whale, a dearth of interim solutions may lead to
reduced population growth rates (NOAA, 2005; Reeves et al., 2007) and in extreme
cases, prevent the species from maintaining a viable population long enough to benefit
from more ideal long-term solutions (Fujiwara & Caswell, 2001).
5.6.4.1 Long-term right whale ship strike reduction goals for seasonal use critical
habitat areas
While it is not economically possible or desirable to eliminate shipping activity in
designated right whale critical habitat (Reeves et al., 2007; Silber et al., 2009), it should
be possible to limit shipping traffic. Specifically, the mandatory routing changes to the
Boston TSS and the 2008 Ship Strike Reduction Rule speed restrictions are a well-
conceived beginning. Requiring vessels entering and exiting critical habitat to utilize
routes that minimize overlap with known right whale concentrations should reduce ship
strike mortality (Vanderlaan et al., 2009; Lagueux et al., 2011; Silber et al., 2012). Also
limiting vessels greater than 65 feet in length transiting feeding and calving critical
habitat to speeds of 10 knots of less in the seasons when right whales are known to
frequent those areas should allow some human-use while limiting the manner to more

87
sustainable “safe” speeds (Vanderlaan et al., 2007; NOAA, 2008). Wildlife managers
should at a minimum expand current speed limitations to include all vessels not involved
directly in a search and rescue operation, police operation, or other military or law
enforcement operation when following such a speed restriction would directly impact the
success of that operation.
Commercial, military and public service vessels choosing to transit through
feeding and calving critical habitat areas should be required to post trained right whale
look-outs while transiting critical habitat areas, and to utilize proven supplementary right
whale detection technology, such as infra-red detectors (Silber et al., 2009) or the Whale
Alert App (NMFS, 2012) when that technology is made available. Right whale-trained
lookouts should hold certification from an appropriate maritime industry, U.S. Navy or
U.S. Coast Guard training course. These measures are similar in nature to right whale
ship strike avoidance measures resulting from Section 7 ESA consultations between
NMFS and various government agencies (Bettridge & Silber, 2008).
Finally, wildlife management agencies responsible for right whale ship strike
reduction should also invest in compliance monitoring and enforcement (Reeves et al.,
2007). Compliance with current routing measures seems to be increasing, but directing
additional efforts towards monitoring and enforcing compliance with reduced vessel
speed measures should be considered (Silber & Bettridge, 2010; Lagueux et al., 2011;
McKenna et al., 2012). Vessels not compliant with current rules should be fined, and
personnel charged accordingly to increase rates of compliance inside seasonal use critical
habitat areas.

88
5.6.4.2 Short-term right whale ship strike reduction goals for seasonal use critical
habitat areas
Short-term solutions to reduce right whale ship strike mortality should assist in
preparing stakeholders for future long-term solutions. As such, a large-whale observer
training program should be developed in partnership with maritime academies, maritime
continuing education institutions, U.S. Coast Guard training programs and U.S. Navy
internal training programs. Any new approved right whale detection technology, and
relative use training, should be integrated into these courses. Use of this training program
should be encouraged by offering participant incentives. A right whale visual detection
training program for U.S. Navy forces and U.S. Coast Guard forces operating in right
whale critical habitat areas has already been developed and is currently being used
(Bettridge & Silber, 2008), but this program should be expanded to offer commercial
training as well.
A recreational boater education campaign on the perils of ship strike for right
whales, right whale field identification, and right whale critical habitat locations should
be developed and established. Recreational boaters should be encouraged to follow the
same speed restrictions valid for vessels greater than 65 feet in right whale critical habitat
areas. Also, recreational boaters should be encouraged to route around right whale
critical habitat areas or to utilize sailing vessels instead in an effort to limit right whale
ship strike mortality. Finally, incentives, including observer immunity to any associated
prosecution, should be used to encourage recreational boaters to report right whale ship
strikes observed in order to gain an understanding of right whale ship strike vulnerability.
The 2008 Report of a Workshop to Identify and Assess Technologies to Reduce Ship
89
Strikes of Large Whales noted that an assessment of ship strike mitigation methods for
smaller craft had not been undertaken, but that smaller craft also hit and kill whales
(Silber et al., 2009). Further, Jensen & Silber note at least one right whale calf death
from ship strike included propeller scars from a twin engine (Jensen & Silber, 2003),
while Henry et al note at least one adult female right whale serious injury from a 43 foot
power yacht where the yacht partially severed the left fluke (Henry et al., 2011).
Therefore, engaging smaller craft in ship strike mitigation strategies should assist in
accelerating a reduction in right whale ship strike mortality.
A competitive grant program should be developed to encourage members of the
shipping industry, educational institutions, and other stake-holders to work together in
order to develop better right whale detection technology within a specific time frame.
Ship strike reduction technology requirements identified by the 2008 Report of a
Workshop to Identify and Assess Technologies to Reduce Ship Strikes of Large Whales
should be included in this program (see Table 5.2) (Silber et al., 2009). These
requirements should be separated into those that must be met within the grant period, and
those requirements for which a solution is foreseeable, but not necessarily met within the
grant period. This program should be utilized to accelerate the development of right
whale ship strike mortality mitigation technology.

90
Required characteristics of ship strike reduction
technology
Desired characteristics of ship strike reduction
technology
It should work with multiple detection
systems.
It should have the ability to be fine-tuned
to area or vessel-type.
It should operate in real-time, but detect a
whale or warn a whale in time for the
appropriate ship strike avoidance action to
occur.
It should require minimal ESA and/or
MMPA permits to test and operate
It must introduce no, or minimal negative
effects to marine organisms and the
surrounding habitat.
It must involve the least amount of time
involvement for mariners while underway.
It must not inject increasing amounts of
ambient noise into the surrounding marine
environment.
It must not significantly increase vessel fuel
consumption.
It must not confer permanent significant
economic costs to the shipping industry.
Table 5.2. Required and Desired Characteristics of Developing Right Whale Ship Strike
Reduction Technology. As identified in a workshop held by the National Oceanic and
Atmospheric Administration in 2008 (Garrison, 2007).
5.6.4.3 Long-term right whale ship strike reduction goals for migratory corridor
critical habitat areas
Although right whales need to transit through a migration corridor, they likely do
not need to stay long in such areas. As a result, slowing vessels down near port entries
within the migration corridor at specific seasons, as is done in the Ship Strike Reduction
Rule (NOAA, 2008), is an appropriate restriction in this area, as long as compliance is
enforced. However, that speed restriction be expanded again to include all vessels not
involved directly in a search-and-rescue operation, police operation, or other military or
law enforcement operation where following such a speed restriction would directly
impact the success of that operation.
Further, the Dynamic Management Area (DMA) system proposed in the Ship
Strike Reduction Rule (NOAA, 2008) is a good attempt at protecting migrating right
whales. While wildlife managers should make speed restrictions inside DMAs
mandatory, wildlife managers should also trigger a DMA lasting a maximum of 3 days
following each right whale sighting in the migration corridor. DMA speed restrictions

91
should be mandatory as compliance monitoring consistently shows a lack of compliance
with voluntary shipping traffic speed restrictions (Silber & Bettridge, 2010; Lagueux,
2011; McKenna et al., 2012). Further, speed restrictions inside DMAs should be enforced
to ensure this change has a measureable effect. This will allow DMAs to provide
immediate protection for each right whale sighted, but also allow DMAs to more closely
reflect satellite tagging observations that show tagged right whales outside feeding areas
range 90-131 km in a single day (Mate et al., 1997). Thus, this change will enable each
DMA to provide time-responsive protection to individual migrating right whales while
also allowing for maximum human-use of the area.
Additionally, as new ship strike mitigation technology and methods become
available, U.S. wildlife managers might examine testing and implementing it first in
migration zones. As right whales do not need to establish long residence times in
migration zones (Mate et al., 1997; Knowlton et al., 2002; Schick et al., 2009),
technology aimed at better identifying right whale locations in real-time, or alerting right
whales to the presence of oncoming ships may be a viable human/whale overlap solution
in these areas, allowing for maximum human and whale use. Further, as right whales are
likely to be less concentrated in migration zones (Reeves et al., 2007; Firestone et al.,
2008; Schick et al., 2009), these technologies assist the mariner/whale detection process
while minimizing the economic impact that further vessel re-routing and speed
restrictions may cause.

92
5.6.4.4 Short-term right whale ship strike reduction goals for migratory corridor
critical habitat areas
Limited aerial surveys should be conducted in suspected migration corridor areas
(Reeves et al., 2007). Although this may be initially expensive, sightings from these
surveys should inform current population status work, inform regional mariners directly
of near real-time right whale locations and contribute to managers’ understanding of right
whale migratory habitat-use (Reeves et al., 2007; Firestone, 2009; Silber et al., 2009).
A recreational boater education program should be developed incorporating right
whale field identification, right whale habitat-use, right whale vulnerability to ship strike,
and actions mariners can take to avoid right whales encountered. Given that mariner
education has been touted as a cost-effective right whale ship strike mitigation strategy
(Moore, 2009), it should be extended to recreational boaters. This program should
include information on how and where to report any right whales sighted in migration
areas in an effort to collect opportunistic migration corridor habitat-use data. Cost-
effectiveness of endangered species management strategies has become a subject of
review during the last decade (Reeves et al., 2007). Given that pregnant and nursing right
whales likely migrate in small numbers (Firestone, 2009; Schick et al., 2009), are likely
to be hard to visually detect (Silber et al., 2009), and are likely to transit large areas in a
single day (Mate et al., 1997; Schick et al., 2009), making effective use of potential
opportunistic right whale observers in the migration zone may significantly improve
managers’ understanding of right whale migratory habitat-use. In order to better utilize
recreational boater sightings, recreational boaters should be encouraged to take
opportunistic photos of right whales sighted from an appropriate distance, and to log
93
approximate GPS locations and dates seen. Building and integrating a free “whale
reporting photo app” for smart phones should be considered to encourage recreational
boater opportunistic sighting reporting and to streamline sightings data collection.
Increased sightings reported by opportunistic recreational boaters should be used to direct
increases in aerial and/or ship board surveys to optimize right whale migratory habitat-
use data gained versus funding spent.
Finally, wildlife managers should reconsider utilizing permitted field tests of alarm
technology and infrared whale detection technology on “trial” vessels (Reeves et al.,
2007). Neither of these technologies is without risk, but allowing engineering and animal
testing to go forward in a migration area ensures: 1) that technological development is
continuing at an adequate pace should an emergency interim solution become imperative,
and 2) that the unquantified risks of utilizing new technology can be quantified by testing
the technology on a very small number of endangered individuals (Reeves et al., 2007;
Silber et al., 2009) in an area where the long-term consequences of displacing those
individuals is minimal. Further, wildlife managers should consider permitting such
technology on government “test” ships to ensure that adequate testing occurs before any
technological solution is approved and applied on a wider level. Use of government
vessels as testing vehicles makes sense as several large naval bases overlap with right
migratory habitat (Knowlton et al., 2002; Firestone, 2009). Further government vessels
not required to abide by the Ship Strike Reduction Rule (NOAA, 2008) may have
increased need of an alternative ship strike mitigation method. Finally, as the largest
numbers of known large whale ship strike occur in right whale migratory habitat (Glass et
al., 2010; Henry et al., 2011; Van Der Hoop et al., 2013) there is a reasonable chance of

94
learning more about close whale/vessel interactions here. Additional benefits of utilizing
government vessels as testing vehicles include streamlining federal funding resources and
encouraging increased inter-agency awareness, communication and cooperation to reduce
right whale ship strike mortality.
5.7 Conclusions
U.S. wildlife managers have designated right whale feeding and calving seasonal
residence areas as critical habitat, and provided right whale ship strike protection in those
critical habitat areas through mariner education, communication of known real-time right
whale locations to mariners, vessel re-routing, and vessel speed restrictions. No
significant reduction in right whale ship strike mortality has occurred following current
critical habitat designation and ship strike mitigation strategy implementation
(Vanderlaan et al., 2009; Pace, 2011; Van Der Hoop et al., 2013).
This lack of reduction in right whale ship strike mortality is a result of habitat
fragmentation based on the current right whale critical habitat designated, and its
protection. Although wildlife managers have protected known right whale seasonal
residence areas, no migratory critical habitat has been identified or protected connecting
seasonal residence areas, leaving individual pregnant and nursing right whales vulnerable
to continued ship strike mortality. Given that statistical analysis indicates preventing the
deaths of 2 female right whales per year could reverse negative population trends
(Fujiwara & Caswell, 2001), identifying and protecting migration habitat for pregnant
and nursing female right whales should enable right whale population recovery under the
ESA.
95
Accordingly, wildlife managers should seek to extend the current Ship Strike
Reduction Rule with small alterations to DMA triggering and time length in migration
habitat. Wildlife managers should also supplement that extension by designating a small
migratory corridor of critical right whale habitat based upon best available science,
continue conducting studies on right whale migratory corridor use, define different levels
of protection for critical right whale seasonal residence areas and migratory corridors,
and implement both short-term and long-term ship strike reduction solutions in both
habitat types. Pursuing these actions should accelerate a reduction in pregnant and
nursing female right whale ship strike mortality.
96
CHAPTER 6
CONCLUSIONS
6.1 Acoustic shadow zone formation
This thesis is comprised of a series of articles intended to address different
audiences across a variety of disciplines, all which must be considered when developing
an acoustic method to reduce North Atlantic right whale ship strike mortality in U.S.
waters. Accordingly, the following discussion explains how the development of each
chapter contributed information to other chapters.
In order to better understand the acoustic landscape a North Atlantic right whale
experiences during close whale/ship encounters, Chapter 2 developed a two-dimensional
acoustic ray tracing model for seven high-risk locations in a known North Atlantic right
whale feeding habitat. During the modeling effort, it became apparent that the presence
of modeled acoustic shadow zones likely reduces the amount of time a North Atlantic
right whale has to detect an oncoming ship. Further, the presence of acoustic shadow
zones also may negatively impact the opportunity for North Atlantic right whales to
accurately localize oncoming ships. Both of these consequences reduce the opportunity
for successful avoidance of oncoming ships.
Acoustic shadow zones result from a combination of the following environmental
factors:
1) changes in water column density, which influence sound velocity gradients
and subsequent sound channeling;
97
2) the composition of reflective surfaces, which influence the amount of sound
scattered, absorbed and reflected at the surface medium;
3) the composition of reflective barriers, which influence the angle of sound
refraction through the barrier medium;
4) the rugosity of reflective surfaces, which influence the angle at which sound
waves encountering the surface are reflected and/or refracted;
5) water column depth, which influences the directional radiation pattern of
sound propagation.
Acoustic shadow zone formation is also influenced by the following source signal
characteristics:
1) depth of the sound source, which influences the amount interference between
direct sound spreading and phase-shifted reflection, or Lloyd’s Mirror Effect,
often resulting in less than expected signal intensity near the surface, and ;
2) sound source frequency, which affects the size of propagating wavelengths,
influencing sound attenuation.
Characterization of the acoustic environment a whale experiences during close
whale/ship encounters was modeled accounting for all of the factors listed above except
for the composition of reflective barriers. The effects of reflective barrier composition on
acoustic shadow zone formation should be explored in future modeling efforts. Results
from the modeling indicate rugosity of the ocean floor is not likely a contributing factor
to the formation of acoustic shadow zones. Instead, sound velocity profile minimums
that create sound channel axes, composition of reflective surfaces and barriers, and water
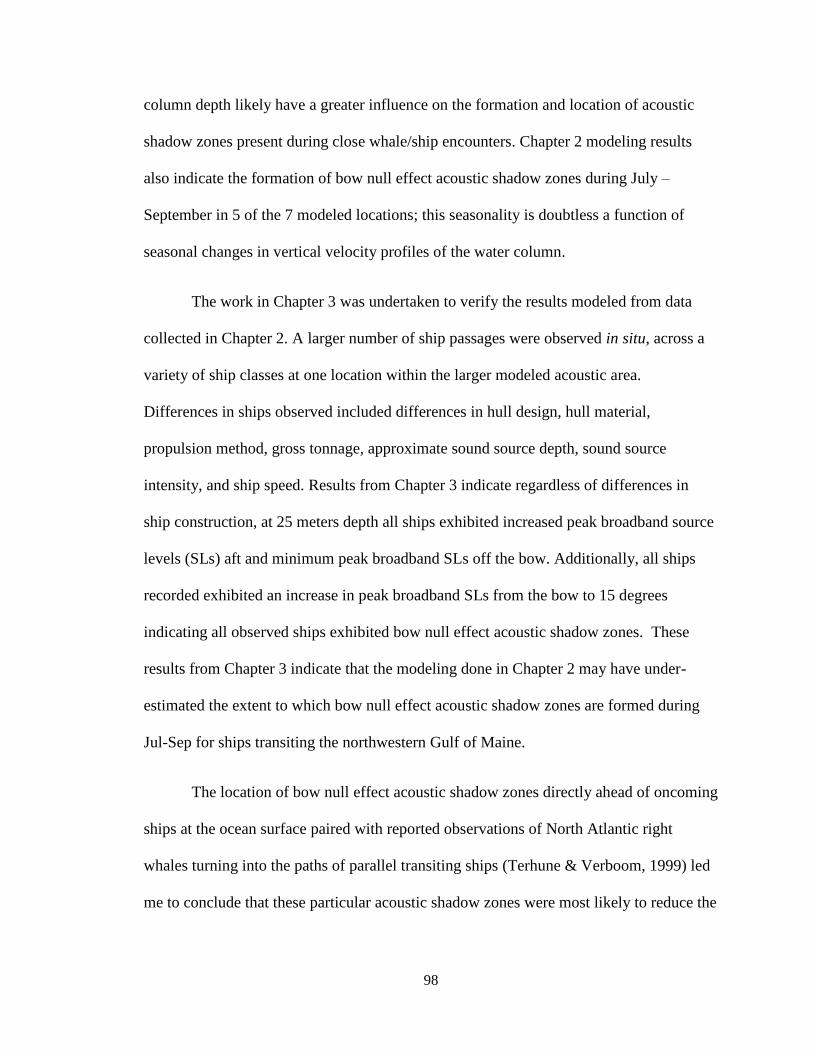
98
column depth likely have a greater influence on the formation and location of acoustic
shadow zones present during close whale/ship encounters. Chapter 2 modeling results
also indicate the formation of bow null effect acoustic shadow zones during July –
September in 5 of the 7 modeled locations; this seasonality is doubtless a function of
seasonal changes in vertical velocity profiles of the water column.
The work in Chapter 3 was undertaken to verify the results modeled from data
collected in Chapter 2. A larger number of ship passages were observed in situ, across a
variety of ship classes at one location within the larger modeled acoustic area.
Differences in ships observed included differences in hull design, hull material,
propulsion method, gross tonnage, approximate sound source depth, sound source
intensity, and ship speed. Results from Chapter 3 indicate regardless of differences in
ship construction, at 25 meters depth all ships exhibited increased peak broadband source
levels (SLs) aft and minimum peak broadband SLs off the bow. Additionally, all ships
recorded exhibited an increase in peak broadband SLs from the bow to 15 degrees
indicating all observed ships exhibited bow null effect acoustic shadow zones. These
results from Chapter 3 indicate that the modeling done in Chapter 2 may have under-
estimated the extent to which bow null effect acoustic shadow zones are formed during
Jul-Sep for ships transiting the northwestern Gulf of Maine.
The location of bow null effect acoustic shadow zones directly ahead of oncoming
ships at the ocean surface paired with reported observations of North Atlantic right
whales turning into the paths of parallel transiting ships (Terhune & Verboom, 1999) led
me to conclude that these particular acoustic shadow zones were most likely to reduce the

99
opportunity for North Atlantic right whales to detect and/or accurately localize oncoming
ships, contributing to high observed rates of North Atlantic right whale ship strike
mortality.
6.2 Bow null effect acoustic shadow zone formation
In the work described in Chapter 3, I examined observed variation in bow null
effect acoustic shadow zones recorded among ships transiting in situ. In addition those
already listed above for general acoustic shadow zone formation, bow null effect acoustic
shadow zone formation is specifically influenced by the following factors:
1) ship draft, which influences source signal depth;
2) ship length and width, which influence the area a source signal must refract
through or reflect around in order to propagate ahead of an oncoming ship;
3) hull material, which in this case is often the refraction/reflection barrier;
4) ship propulsion type, which influences source signal frequency and intensity;
5) placement of propellers, impellers, engines and/or generators relative to ship
design, which influences source signal depth, refraction, and reflection, and;
6) ship speed; which influences source signal frequency and intensity.
Each ship recorded in Chapter 3 was constructed in a slightly different manner.
Low n values prevented statistically significant comparisons of variations in bow null
effect acoustic shadow zone intensities observed within ships of the same type. Further,
the placement of propellers, impellers, engines and/or generators relative to ship design
varied dramatically among the 24 ships observed, as they included V-, U-, and
catamaran-style hulls as well as propeller, jet, and ADU propulsion systems. Further, to

100
standardize comparisons between ships of varying types, only ship construction and
propulsion information available from both Lloyd’s Registry of ships and the Maine
Department of Marine Resources Registered Fishing Vessels database were used. As a
result, analysis of variation in bow null effect acoustic shadow zones observed was
limited to differences in ship length, draft, gross tonnage, horsepower, propulsion type
and speed at time of recorded ship passage.
Of these parameters, only an increase in ship length to draft (L:D) ratio exhibited
a positive relationship to increasing SLs from the bow to 15 degrees. This was a limited
analysis, but as two of the four ship types observed included only catamaran-style hulls
this positive relationship may make sense. Catamaran-style hulls are typically
characterized by shallower drafts than comparable V- and U-style hulls (see Figure 6.1b).
Shallower draft ships generally have acoustic sound sources (in these cases impellers,
engines, and generators) located nearer the surface than deeper draft vessels. While this
could be expected to exacerbate the difference in broadband SLs observed from the bow
to 15 degrees as a result of Lloyd’s Mirror Effect (Gerstein & Blue, 2005; Medwin et al.,
2005), it also reduces the area of hull material a source signal must refract through or
reflect around in order to propagate ahead of the boat. Further, by creating two additional
sound reflection surfaces in the form of the space between the two hulls (see Figure
6.1b), catamaran-style hulls may increase sound channeling at the surface, resulting in
increased signal propagation ahead of the oncoming ship compared to V- and U-style
hulled ships. Thus, while increasing L:D ratios in this study show a positive relationship
with increasing broadband SLs from the bow to 15 degrees, differences in hull design are
likely responsible for that observed relationship.
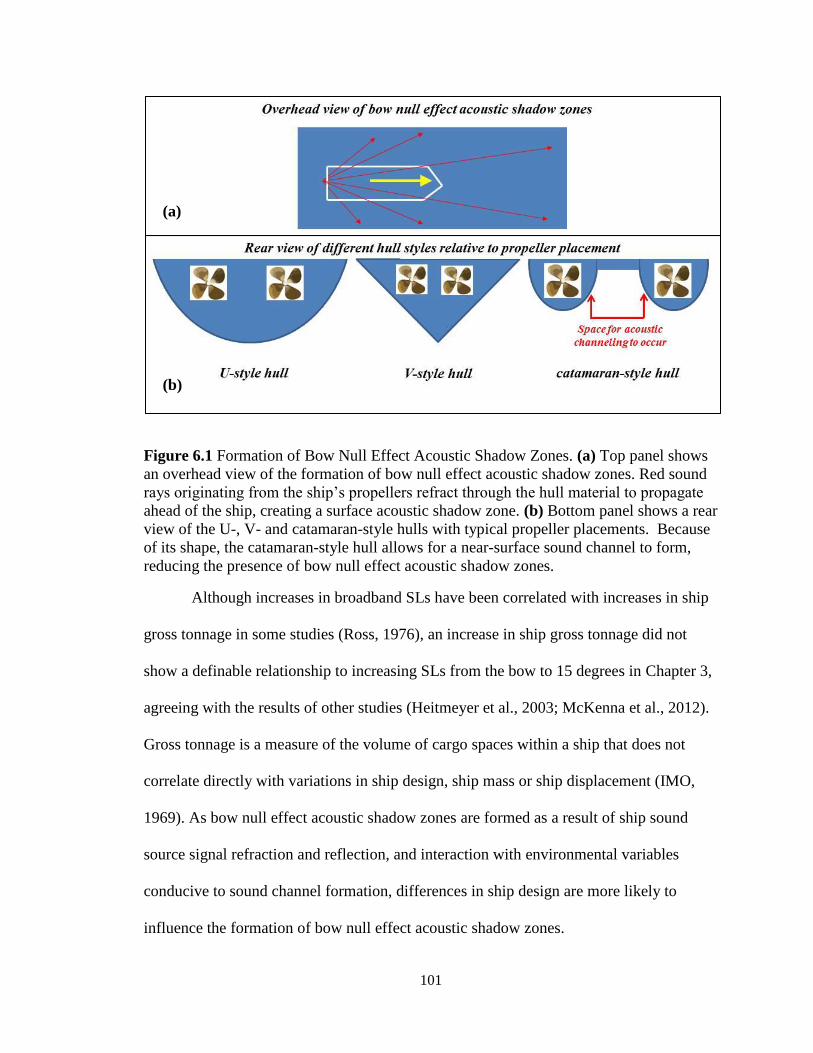
101
Figure 6.1 Formation of Bow Null Effect Acoustic Shadow Zones. (a) Top panel shows
an overhead view of the formation of bow null effect acoustic shadow zones. Red sound
rays originating from the ship’s propellers refract through the hull material to propagate
ahead of the ship, creating a surface acoustic shadow zone. (b) Bottom panel shows a rear
view of the U-, V- and catamaran-style hulls with typical propeller placements. Because
of its shape, the catamaran-style hull allows for a near-surface sound channel to form,
reducing the presence of bow null effect acoustic shadow zones.
Although increases in broadband SLs have been correlated with increases in ship
gross tonnage in some studies (Ross, 1976), an increase in ship gross tonnage did not
show a definable relationship to increasing SLs from the bow to 15 degrees in Chapter 3,
agreeing with the results of other studies (Heitmeyer et al., 2003; McKenna et al., 2012).
Gross tonnage is a measure of the volume of cargo spaces within a ship that does not
correlate directly with variations in ship design, ship mass or ship displacement (IMO,
1969). As bow null effect acoustic shadow zones are formed as a result of ship sound
source signal refraction and reflection, and interaction with environmental variables
conducive to sound channel formation, differences in ship design are more likely to
influence the formation of bow null effect acoustic shadow zones.
(a)
(b)
102
Similar to the results of other recent studies (Heitymeyer et al., 2003; McKenna et
al., 2012) no relationship was found between variations in ship speed and increasing SLs
from the bow to 15 degrees in Chapter 3. It is important to keep in mind relationships, or
lack thereof, reported in Chapter 3 result from comparisons among ships of different ship
types. Like gross tonnage, increasing ship speed has been observed correlating to
increasing broadband SLs in other studies (Ross, 1976; Arveson & Vendettis, 2000;
Trevorrow et al., 2008). Unlike gross tonnage, future studies should explore this
relationship among a larger number of ships within each specific ship type. At different
speeds, different components of a ship’s acoustic signature (propellers, impellers,
engines, and/or generators) tend to dominate a ship’s broadband source signal (Arveson
& Vendettis, 2000; Trevorrow et al., 2008). Thus, different propagation patterns may
dominate at different ship speeds, particular to each ship type.
Hull material was not evaluated as a potential influence on bow null effect
acoustic shadow zone formation in Chapter 3, however future studies should assess this
potential relationship. Acoustic impedance is a function of sound velocity and the
density difference between propagation mediums (Medwin et al., 2005). In general, the
closer the acoustic impedance values for two materials, the less the time-delay between
source signal reflections (Norton & Karczub, 2003). Thus, assuming sound velocity is
approximately equal, an increase in the density difference between a ship’s hull material
and the surrounding water column should result in an increase in observed broadband
SLs from the bow to 15 degrees.

103
Likewise, although not evaluated as part of Chapter 3, future studies should
examine the relationship between increasing stern width relative to increasing broadband
SLs from the bow to 15 degrees. In general stern shape, including width, draft, and
relative propeller placement, likely contributes to bow null effect acoustic shadow zone
formation. When propellers are placed above the keel, low frequency sound generated by
propeller revolution must refract through or reflect beneath the stern before propagating
ahead of an oncoming ship (see Figure 6.1a). Therefore, any change in stern dimensions
should result in a change in bow null effect acoustic shadow zone formation and/or
shape.
6.3 Definition of design requirements
The limited verification of the modeled bow null effect in Chapter 2 by the
observations in Chapter 3 led to the conclusion that the presence of bow null effect
shadow zones located directly at the surface, ahead of oncoming ships, likely presented
the most significant impediment to acoustic detection and localization of oncoming ships
by North Atlantic right whales. In order to increase the opportunity for North Atlantic
right whale detection and localization of oncoming ships, the results from Chapters 2 and
3 formed the design requirements for the prototype of an acoustic method to reduce North
Atlantic right whale ship strike mortality developed and tested in Chapter 4.
Design requirements derived from the results of Chapters 2 and 3 included:
1) reducing and/or eliminating the presence of bow null effect acoustic shadow
zones for a variety of ship types;

104
2) creating a testable prototype that would be transferable to multiple test ships of
varying hull design;
3) creating a testable prototype that would not result in lasting changes or damages
to test ship hulls, and;
4) creating a testable prototype that would have power independent of the test ship.
As the single factor likely most responsible for formation of observed bow null
effect acoustic shadow zones was the propagation barrier provided by each ship’s keel, I
designed a prototype of a bow-mounted dual speaker array to eliminate that propagation
barrier. I developed an attachment platform that enabled prototype testing to include
broadcasting the test signal at a variety of depths and angles, closely modeling variation
in test ship hulls without requiring permanent attachment to or modification of test ships.
Finally I used a generator to standardize the speaker array power source, reducing
potential variations in prototype signal intensity
Initial field-testing of this prototype eliminated an increase in broadband SLs
from the bow to 15 degrees for all five ships tested, increasing the opportunity for North
Atlantic right whales to detect oncoming ships. Future prototype modification should
include increasing speaker size and developing an acoustic array employing constructive
interference to maximize source signal intensity at frequencies below 500 Hz. These
modifications will result in an increase in low frequency signal intensity and
directionality at the bow aspect of oncoming ships. These improvements will make the
bow the loudest aspect of an oncoming ship, increasing the opportunity for North Atlantic
right whale to localize oncoming ships. Maximizing the opportunity for successful
105
detection and localization of oncoming ships could result in an increase in successful
ship avoidance by most baleen whales, although here my motivation is to specifically
decrease annual rates of North Atlantic right whale ship strike mortality.
6.4 Interfacing the developed solution with current policy structure
Before applying any solution to negative anthropogenic impacts on a protected
species and its protected habitats, current and evolving policy framework must be taken
into account. Thus, Chapter 5 reviews existing U.S. North Atlantic right whale ship
strike mortality reduction policy in the context of the Endangered Species Act of 1973,
the more restrictive of the two protective acts applying to this population. As an
extension of that review, Chapter 5 also suggests room for improvement in future North
Atlantic right whale ship strike mortality reduction policy, defining a difference in
protection levels for seasonal residence habitat areas and migration habitat areas. Chapter
5 concludes that while North Atlantic right whale seasonal residence critical habitat use is
well understood, a lack of understanding regarding North Atlantic right whale migration
habitat use has resulted in persistent ship strike mortality levels above the recommended
potential biological removal (PBR) rates defined by regulatory agencies.
Current understanding of North Atlantic right whale migration habitat use is
constrained by the expense required to obtain non-biased spatial habitat use assessments
from aerial surveys, and the by limiting nature of data obtained from less expensive
passive acoustic monitoring. While the prototype developed in Chapter 4 may not have a
place in current U.S. North Atlantic right whale ship strike reduction policy, new
technology may prove useful in reducing and/or eliminating North Atlantic right whale

106
ship strike mortality in migration habitat regions where traditional habitat use surveys are
cost prohibitive. Thus, future development of the prototype developed in Chapter 4
should be conducted in partnership with wildlife managers in the U.S. and/or Canada.
In partnership with wildlife managers in the U.S. and/or Canada, future in situ
research should be conducted to observe North Atlantic right whale reactions to close
ship encounters before testing the prototype developed in Chapter 4 on individual whales.
Further study will help researchers define which acoustic stimuli North Atlantic right
whales react to, what observed North Atlantic right whale critical ratios are, and whether
North Atlantic right whales engaged in different behaviors react differently to close ship
encounters, creating additional prototype modification requirements.
As it is imperative not to endanger individuals, future research on North Atlantic
right whale behavior during close ship encounters should utilize a combination of
existing long-term passive acoustic monitoring systems, existing long-term
environmental monitoring buoys, existing ship Automatic Identification Systems, mariner
accounts, and existing aerial survey observations inside shipping lanes to observe a large
number of opportunistic North Atlantic right whale/ship encounters. Combining
information from these sources should develop a clearer definition of the in situ acoustic
environment of North Atlantic right whale/ship close encounters, the distances at which
North Atlantic right whales react to close ship encounters, the intensity at which North
Atlantic right whales react to close ship encounters, the locations and orientations of
individual North Atlantic right whales relative to oncoming ships (subsurface, surface,
107
etc.), the behaviors of individual North Atlantic right whales (feeding, transiting,
logging, engaged in SAG, etc.) prior to the close ship encounters, and the reactions of
North Atlantic right whales to oncoming ships.
Scientific take authorization permits could then be obtained to test the modified
prototype developed in Chapter 4 on a similar non-endangered baleen whale species,
North Atlantic minke whales (Balaenoptera acutorostrata), a species that likely has
similar acoustic sensitivity. If prototype testing results in statistically significant minke
whale avoidance behavior, additional scientific take authorization permits should be
obtained to test the modified prototype on finback (Balaenoptera physalus), humpback
(Megaptera novaenagliae), sei (Balaenoptera borealis) and eventually North Atlantic
right whales. The reaction of all whales tested should be taken into account before any
attempt is made to utilize this device as a North Atlantic right whale ship strike morality
reduction method.
6.5 Thesis Conclusions
Thus, the following conclusions can be drawn from the results presented in this
thesis:
1. Bow null effect acoustic shadow zones exist for all ship types that I modeled and
observed in the Gulf of Maine, although an exhaustive review of this phenomenon
across all ship types operating in this area is beyond the scope of this thesis. As
bow null effect acoustic shadow zones exist at the surface and ahead of transiting
108
ships, these shadow zones likely reduce the opportunity for North Atlantic right
whales to accurately detect and/or localize oncoming ships, contributing to
observed high levels of North Atlantic right whale ship strike mortality.
2. Bow null effect acoustic shadow zones may be reduced by modifying ship length
to draft ratios. Increasing length to draft ratios show a positive relationship to
increasing broadband source levels from the bow to 15 degrees, indicating a
change in ship hull design may result in a reduction in North Atlantic right whale
ship strike mortality.
3. Bow null effect acoustic shadow zones can be eliminated via the use of hull-
mounted dual speaker prototype, increasing the opportunity for North Atlantic
right whales to detect oncoming ships.
4. Widespread use of a bow-mounted speaker array prototype to reduce North
Atlantic right whale ship strike mortality is likely not a viable solution in all
United States waters as a result of current U.S. ship strike mortality reduction
policy under the restrictions imposed on wildlife managers by the Endangered
Species Act of 1973.
5. Limited use of a modified bow-mounted speaker array prototype to reduce North
Atlantic right whale ship strike mortality may be a viable short-term solution for
permitted research ships, military ships, and/or federal ships transiting outside
identified North Atlantic right whale critical habitat areas.
6. Utilizing the a modified version of the bow-mounted speaker array prototype for
additional ships transiting areas where North Atlantic right whale ship strike
mortality is known to occur, but also where North Atlantic right whale habitat use

109
is uncertain, may help reduce North Atlantic right whale ship strike mortality until
a ship strike mortality reduction method less likely to impact North Atlantic right
whale behavior is identified.
110
REFERENCES
Abbitt, R.J., & Scott, J.M. (2001). Examining differences between recovered and
declining endangered species. Conservation Biology, 15(5), 1274-1284.
Allen, J.K., Peterson, M.L., Sharrard, G.V., Wright, D.L., & Todd, S.K. (2012). Radiated
noise from commercial ships in the Gulf of Maine: implications for whale/vessel
collisions. Journal of the Acoustical Society of America, 132(3), EL229-EL235.
Andrén, H. (1994). Effects of habitat fragmentation on birds and mammals in landscapes
with different proportions of suitable habitat: a review. Oikos, 71(3), 355-366.
Arveson, P.T., & Vendittis, D.J. (2000). Radiated noise characteristics of a modern cargo
ship. Journal of the Acoustical Society of America, 107(1), 118-129.
Asaro, M.J. (2012). Geospatial analysis of management areas implemented for protection
of the North Atlantic right whale along the northern Atlantic coast of the United
States. Marine Policy, 36, 915-921.
Baumgartner, M.F., & Mate, B.R. (2005). Summer and fall habitat of North Atlantic right
whales (Eubalaena glacialis) inferred from satellite telemetry. Canadian Journal of
Fisheries and Aquatic Science, 62, 527-543
Bearzi, M. (2012). Cetaceans and MPAs should go hand in hand: a case study in Santa
Monica Bay, California. Ocean & Coastal Management, 60, 56-59.
Best, P.B., Branadao, A., & Butterworth, D.S. (2001). Demographic parameters of
southern right whales off South Africa. Journal of Cetacean Research and
Management, Special Issue 2, 161-169.
Bettridge, S., & Silber, G.K. (2008). Update on the United States’ actions to reduce the
threat of ship collisions with large whales. Prepared for the International Whaling
Commission’s Working Group on Ship Strikes and Presented at the International
Whaling Commission’s Conservation Committee 2008, Santiago, Chile, June 16,
2008. IWC/60/6612.
Bettridge ,S., & Silber, G.K. (2009). Update on the United States’ actions to reduce the
threat of ship collisions with large whales. International Whaling Commission 61st
Annual Meeting, Maderia, Portugal, June 2009, IWC/61/CC14; Agenda Item 4.
Bowlin, J.B., Speitsberger, J.L., Duda, T.F., & Freitag, L.F. (1992). Ocean Acoustical
Ray-Tracing Software RAY. Woods Hole Oceanographic Institute Technical
Report, WHOI-93-10.

111
Boyd, C., Brooks, T.M., Butchart, S.H.M., Edgar, G.J., da Fonseca, G.A.B., Hawkins, F.,
Hoffman, M., Sechrest, W., Stuart, S.N., & Van Dijk, P.P. (2008). Spatial scale and
the conservation of threatened species. Conservation Letters, 1, 37-43.
British Broadcasting Company. (2010). “Whale of a tale for couple yachting off Cape
Town,” British Broadcasting Company News published July 26. Retrieved from
http://www.bbc.co.uk/news/world-africa-10712323
Brown, M.W., & Marx, M.K. (2000). Surveillance, monitoring and management of North
Atlantic right whales, Eubalaena glacialis, in Cape Cod Bay, Massachusetts:
January to mid-May 2000. Division of Marine Fisheries, Commonwealth of
Massachusetts, Final Report.
Brown, M.W., Fenton, D., Smedbol, K., Merriman, C., Robichaud-Leblanc, K., &
Conway, J.D. (2009). Recovery strategy for the North Atlantic right whale
(Eubalaena glacialis) in Atlantic Canadian waters. Species at Risk Act Recovery
Strategy Series, Fisheries and Oceans Canada.
Browning, C.L., Rolland, R.M., & Kraus, S.D. (2010). Estimated calf and perinatal
mortality in western North Atlantic right whales (Eubalaena glacialis). Marine
Mammal Science, 6(4), 278-291.
Byington, R., Brown, E., Bruneel, T., & Perkins, G. (2011). U.S. Water Transportation
Statistical Snapshot. Office of Policy and Plans, Office of Congressional and Public
Affairs, Maritime Administration, U.S. Department of Transportation. Retrieved
from
http://www.marad.dot.gov/documents/US_Water_Transportation_Statistical_snapsh
ot.pdf
Carrillo, M., & Ritter, F. (2010). Increasing numbers of ship strikes in the Canary Islands:
proposals for immediate action to reduce risk of ship-whale collisions. Journal of
Cetacean Research & Management, 11(2), 131-138.
Caswell, H., Brault, S., & Fujiwara, M. (1999). Declining survival probability threatens
the North Atlantic right whale. Proceedings of the National Academy of Science
U.S.A., 96, 3308-3313.
Committee on Taxonomy. (2012). List of marine mammal species and subspecies.
Society for Marine Mammalogy, Retrieved from www.marinemammalscience.org
Czech, B., & Krausman, P.R. (2001). The Endangered Species Act: history, conservation
biology, and public policy. Baltimore: John Hopkins University Press.

112
Dalsoren, S.B., Eide, M.S., Myhre, G., Endresen, O., Isaksen, I.S., & Fuglestvedt, J.S.
(2010). Impacts of the large increase in international shipping traffic 2000-2007 on
tropospheric ozone and methane. Environmental Science & Technology, 44, 2482-
2489.
De Stephanis, R., & Urquiola, E. (2006). Collisions between ships and cetaceans in
Spain. Presented to the International Whaling Consortium Scientific Committee, St.
Kitts and Nevis, West Indies, SC/58/BC5. Retrieved from the Office of the Journal of
Cetacean Research & Management.
Dolin, E.J. (2007). Leviathan. New York: W.W. Norton & Company.
Douglas, A.B., Calambokidis, J., Rafferty, S., Jeffries, S.J., Lambourn, D.M., & Norman,
S.A. (2008). Incidence of ship strike of large whales in Washington State. Journal of
the Marine Biological Association U.K., 88, 1121-1132.
Elvin, S.S, & Taggart, C.T. (2008). Right whales and vessels in Canadian waters. Marine
Policy, 32, 379-386.
Endangered Species Act. (1973, amended 2002). United States.
Fahrig, L. (2002). Effect of habitat fragmentation on the extinction threshold: a synthesis.
Ecological Applications, 12(2), 346-353.
Firestone, J., Lyons, S.B., Wang, C., & Corbett, J.J. (2008). Statistical modeling of North
Atlantic right whale migration along the mid-Atlantic region of the eastern seaboard
of the United States. Biological Conservation, 141, 221-232.
Firestone, J. (2009). Policy consideration and measures to reduce the likelihood of vessel
collisions with great whales. Boston College Environmental Affairs Law Review, 36,
389-400.
Flagg, C.N. (1987). Hydrographic structure and variability. In Backus, R.M. (Ed.):
George’s Bank. (pp. 108-124). Boston: Massachusetts Institute of Technology
Press.
Francois, R.E., & Garrison, G.R. (1982). Sound absorption based on ocean
measurements. Part II: Boric acid contribution and equation for total absorption.
Journal of the Acoustical Society of America, 72, 1879-1890.
Frasier, T.R., McLeod, B.A., Gillet, R.M., Brown, M.W., & White, B.N. (2007). Right
whales past and present as revealed by their genes. In Kraus, S.D., & Rolland, R.M.
(Eds.), The Urban Whale. (pp.200-231). Cambridge: Harvard University Press.

113
Fujiwara, M.,& Caswell, H. (2001). Demography of the endangered North Atlantic right
whale. Nature, 414, 537-541.
Garbriele, C., Neilson, J., Jensen, A., & Straley, J. (2011). Summary of reported whale-
ship collisions in Alaskan waters. Presented at the 19th Biennial Conference on the
Biology of Marine Mammals.
Gaskin, D.E. (1991). An update on the status of the right whale, Eubalaena glacialis, in
Canada. Canadian Field Naturalist, 105, 198-205.
Garrison, L.P. (2007). The big picture: modeling right whales in space and time. In
Kraus, S.D., & Rolland, R.M. (Eds.), The Urban Whale. (pp.460-487). Cambridge:
Harvard University Press.
Gerstein, E.R., & Blue, J.E. (2005). The acoustical causes of collisions between marine
mammals and ships. In Medwin, H. (Ed.), Sounds in the Sea. (pp. 430-444). New
York: Cambridge University Press.
Glass, A.H., Cole, T.V.N., & Garron, M. (2010). Mortality and serious injury
determinations for baleen whale stocks along the United States and Canadian eastern
seaboards, 2004-2008. NOAA Technical Memorandum, NMFS-NE-214.
Gulf of Maine Ocean Observation System, 2008. “Gulf Of Maine Ocean Observation
System Historical Buoy Database”. Retreived from http://www.gomoos.org/gnd/
Haar, L., & Cox, R. (1996). Port of Boston Economic Development Plan. Massachusetts
Port Authority.
Hamilton, P.K., Knowlton, A.R., & Marx, M.K. (2007). Right whales tell their own
stories: the photo-identification catalog. In Kraus, S.D., & Rolland, R.M. (eds.) The
Urban Whale. Cambridge, MA: Harvard University Press. 75-104.
Hamilton, P.K., Kenney, R.D., & Cole, T.V.N. (2009). Right whale sightings in unusual
places. Right Whale News, 17(1), 9-10.
Harwood, J. (2001). Marine mammals and their environment in the twenty-first century.
Journal of Mammalogy, 82(3), 630-640.
Hatch, L., Clark, C., Merrick, R., Van Parijs, S., Ponirakis, D., Schwehr, K., Thompson,
M., & Wiley, D. (2008). Characterizing the relative contributions of large vessels to
total ocean noise fields: a cast study using the Gerry E. Studds Stellwagen Bank
National Marine Sanctuary. Environmental Management, 42, 735-752.

114
Heitmeyer, R.M., Wales, S.C., & Pflug, L.A. (2003). Shipping noise predictions:
capabilities and limitations. Marine Technology Society Journal, 37(4), 54-65.
Henry, A.G., Cole, T.V.N., Garron, M., & Hall, L. (2011). Mortality and serious injury
determinations for baleen whale stocks along the Gulf of Mexico, United States and
Canadian eastern seaboards, 2005-2009. US Department of Commerce, Northeast
Fisheries Science Center Reference Document 11-18.
Henry, A.G., Cole, T.V.N., Garron, M., Hall, L., Ledwell, W., & Reid, A. (2012).
Mortality and serious injury determinations for baleen whale stocks along the Gulf
of Mexico, United States east coast and Atlantic Canadian provinces, 2006-2010. US
Department of Commerce, Northeast Fisheries Science Center Reference Document
12-11.
Hildebrand, J.A. (2009). Anthropogenic and natural sources of ambient noise in the
ocean. Marine Ecology Progress Series, 395, 5-20.
Hildreth, R. (2008). Place-based ocean management: emerging U.S. law and practice.
Ocean & Coastal Management, 51, 659-670.
Hinch, P.R., & De Santo, E.M. (2011). Factors to consider in evaluating the management
and conservation effectiveness of a whale sanctuary to protect and conserve the
North Atlantic right whale (Eubalaena glacialis). Marine Policy, 35, 163-180.
International Convention for the Regulation of Whaling [ICRW], with Schedule of
Whaling Regulations. (1946) 62 Stat. 1716, 161 UNTS 72.
International Maritime Organization [IMO]. (1969). International Convention on
Tonnage Measurement of Ships. IMO-713 E, London.
IMO. (2007). Work Programme of the Committee and Subsidiary Bodies –Measures for
minimizing the risks of collisions with cetaceans. Marine Environment Protection
Committee, MEPC 57/18/2.
IMO. (2009). Report of the Marine Protection Committee. Marine Environment
Protection Committee, MEPC 59/24.
International Whaling Consortium [IWC]. (2008). Third progress report to the
Conservation Committee of the Ship Strike Working Group. IWC Conservation
Committee , IWC/60/CC3.
Jacobsen, K., Marx, M., & Oien, N. (2004). Two-way trans-Atlantic migration of a North
Atlantic right whale (Eubalaena glacialis). Marine Mammal Science, 2, 1-13.

115
Jensen, A.S., & Silber, G.K. (2003). Large Whale Shipstrike Database. U.S. Department
of Commerce, NOAA Technical Memorandum, NMFS-OPR-25.
Kamino, K. (2013). Diversified material designs in biological underwater adhesives. In
Thomopoulos, S., Birman, V., & Genin, G.M. (Eds.): Structural Interfaces and
Attachments in Biology. (pp. 175-200). New York: Springer Science & Business
Media.
Kenney, R.D., Mayo, C.A., & Winn, H.E. (2001). Migration and foraging strategies at
varying spatial scales in western North Atlantic right whales: a review of
hypotheses. Journal of Cetacean Research and Management, Special Issue 2, 251-
260.
Kenney, R.D. (2007). Right whales and climate change: facing the prospect of a
greenhouse future. In Kraus, S.D., & Rolland, R.M. (Eds.): The Urban Whale.(pp.
436-459). Cambridge: Harvard University Press.
Knowlton, A., Ring, J., & Russell, B. (2002). Right whale sightings and survey effort in
the mid-Atlantic region: migratory corridor, time frame, and proximity to port
entrances. A Report Submitted to the National Marine Fisheries Service Ship Strike
Working Group. Retrieved from
www.nero.noaa.gov/shipstrike/ssr/midatlanticreportrFINAL.pdf.
Kraus, S.D., Crone, M.J., & Knowlton, A.R. (1988). The North Atlantic right whale. In
Chandler, W.J. (Ed.): Audubon Wildlife Report 1988/89. (pp.685-698). New York:
Academic Press.
Kraus, S.D., Hamilton, P.K., Kenney, R.D., & Slay, C.K. (2001). Reproductive
parameters of the North Atlantic right whale. Journal of Cetacean Research and
Management, Special Issue 2, 231-236.
Kraus, S.D., Brown, M., Caswell, H., Clark, C., Fujiwara, M., Hamilton, P., Kenney, R.,
Knowlton, A., Landry, S., Mayo, C., McLellan, W., Moore, M., Nowacek, D., Pabst,
D., Read, A., & Rolland, R. (2005). North Atlantic right whales in crisis. Science,
309, 561-562.
Kraus, S.D., & Rolland, R.M. (2007). Right whales in the urban ocean. In Kraus, S.D., &
Rolland, R.M. (Eds.), The Urban Whale. (pp. 1-38). Cambridge: Harvard University
Press.
Lagueux, K.M., Zani, M.A., Knowlton, A.R., & Kraus, S.D. (2011). Response by vessel
operators to protection measures for right whales (Eubalaena glacialis) in the
southeast U.S. calving ground. Endangered Species Research, 14, 69-77.

116
Laist, D.W., Knowlton, A.R., Mead, J.G., Collet, A.S., & Podesta, M. (2001). Collisions
between ships and whales. Marine Mammal Science, 17(1), 35-75.
Mackenzie, K.V. (1981). Nine term equations for sound speed in the ocean. Journal of
the Acoustical Society of America, 70, 807-812.
Mahaffey, C. A. (2006). Qualitative GIS predictive modeling of ship strike in the Gulf of
Maine. Unpublished Masters, College of the Atlantic, Bar Harbor.
Marine Mammal Protection Act. (1972, amended 2004; 2007) United States.
Martin Associates. (2009). Port of Jacksonville Total Economic Impacts. Jacksonville
Port Authority. Retrieved from http://www.jaxport.com/about-
jaxport/overview/economic-impacts
Massachusetts Port Authority. (2012). Cruiseport Boston shatters passenger records in
2012. Retrieved from http://www.massport.com/news-
room/News/CruiseportBostonShatters.aspx
Mate, B.R., Nieukirk, S.L., & Kraus, S.D. (1997). Satellite-monitored movements of the
northern right whale. Journal of Wildlife Management, 61(4), 1393-1405.
Mate, B.R., Mesecar, R., & Lagerquist, B. (2007). The evolution of satellite-monitored
radio tags for large whales: one’s laboratory experience. Deep-Sea Research II, 54,
224-247.
Mayo, C.A, & Marx, M. (1990). Surface foraging behavior of the North American right
whale, Eubalaena glacialis, and associated zooplankton characteristics. Canadian
Journal of Zoology, 68, 2214-2220.
McKenna, M.F., Katz, S.L., Condit, C., & Walbridge, S. (2012). Response of commercial
ships to a voluntary speed reduction measure: are voluntary strategies adequate for
mitigating ship-strike risk? Coastal Management, 40, 634-650.
McKenna, M.F., Ross, D., Wiggens, S.M., & Hildebrand, J.A. (2012). Underwater
radiated noise from modern commercial ships. Journal of the Acoustical Society of
America, 131(1), 92-103.
McLellan, W.A., Meagher, E., Torres, L. Lovewell, G., Harper, C., Irish, K., Pike, B., &
Pabst, A.D. (2004). Winter right whale sightings from aerial surveys of coastal
waters of the U.S. Mid-Atlantic. 15th
Biennial Conference on the Biology of Marine
Mammals, Greensboro, North Carolina.
Medwin, H. (1975). Speed of sound in water: a simple equation for realistic parameters.
Journal of the Acoustical Society of America, 58(6), 1318-1319.

117
Medwin, H. (2005). Sounds in the Sea. New York: Cambridge University Press.
Merrick, R.L. (2005). Seasonal management areas to reduce ship strikes of northern right
whales in the Gulf of Maine. Northeast Fisheries Science Center Reference
Document, 05-19.
Moore, J.C., & Clark, E. (1963). Discovery of right whales in the Gulf of Mexico.
Science, 141(3577), 269.
Moore, M.J., Knowlton, A.R., Kraus, S.D., McLellan, W., & Bonde, R.K. (2005).
Morphometry, gross morphology, and available histopathobiology in Northwest
Atlantic right whale (Eubalaena glacialis) mortalities (1970-2002). Journal of
Cetacean Research & Management, 6, 199-214.
Moore, M.J., McLellan, W.A., Daoust, P.Y., Bonde, R.K., & Knowlton, A.R. (2007).
Right whale mortality: a message from the dead to the living. In Kraus, S.D., &
Rolland, R.M. (Eds.), The Urban Whale. (pp.358-379). Cambridge: Harvard
University Press..
Moore, M.J. (2009). Current issues facing North Atlantic right whales and stakeholders.
Boston College Environmental Affairs Law Review, 36(2), 309-317.
National Marine Fisheries Service [NMFS]. (1991). Final recovery plan for the northern
right whale Eubalaena glacialis. U.S. Department of Commerce, National Oceanic
and Atmospheric Administration, National Marine Fisheries Service, Office of
Protected Resources.
NMFS. (2005). Recovery plan for the North Atlantic right whale (Eubalaena glacialis).
National Marine Fisheries Service, Office of Protected Resources.
NMFS. (2006). Review of the status of North Atlantic right whales in the North Atlantic
and North Pacific Oceans. U.S. Department of Commerce NOAA Technical
Memorandum. Retrieved from
http://www.nmfs.noaa.gov/pr/pdfs/statusreviews/rightwhale2006.pdf.
NMFS. (2012). North Atlantic right whale (Eubalaena glacialis) 5-year review: summary
and evaluation. U.S. Department of Commerce NOAA Technical Memorandum.
National Oceanic and Atmospheric Administration [NOAA]. (1994). Designated Critical
Habitat; Northern Right whale. Federal Register, 59(28793). Retrieved from
http://www.nmfs.noaa.gov/pr/pdfs/fr/fr59-28805.pdf.30p.

118
NOAA. (1995). North Atlantic right whale stock assessment report. Marine Mammal
Stock Assessment Reports 1995; National Marine Fisheries Service. Retrieved from
http://www.nmfs.noaa.gov/prot res/PR2/Stock Assessment Program/sars.html
NOAA. (2000). Advanced Notice of Proposed Rulemaking for North Atlantic Right
whale Protection. Federal Register, 65(2), 270-272.
NOAA. (2002). Finding for a petition to revise critical habitat for Northern right whales.
Federal Register, 67(223), 69708-10.
NOAA. (2003). Finding for a petition to revise critical habitat for Northern right whales.
Federal Register, 68(167), 51758-63.
NOAA. (2004). Regulations governing the approach to North Atlantic right whales.
Federal Register, 69(229), 69536-37.
NOAA. (2005). Petition to initiate emergency rulemaking to prevent the extinction of the
North Atlantic right whale; final determination. Federal Register, 70(188), 56884-5.
NOAA. (2006). Revision of critical habitat for the Northern right whale in the Pacific
Ocean. Federal Register, 71(129), 38277-97.
NOAA. (2006). Proposed endangered status for North Atlantic right whales. Federal
Register, 71(248), 77704-16.
NOAA. (2008). Endangered fish and wildlife; Final Rule to implement speed restrictions
to reduce the threat of ship collisions with North Atlantic right whales. Federal
Register, 73(198), 60173-91.
NOAA. (2010). Designating critical habitat for the endangered North Atlantic right
whale. Federal Register, 73(193), 61690-91.
NOAA. (2011). North Atlantic right whale stock assessment report. Marine mammal
stock assessment reports 2011; National Marine Fisheries Service. Retrieved from
http://www.nmfs.noaa.gov/prot res/PR2/Stock Assessment Program/sars.html
NOAA. (2012). North Atlantic right whale stock assessment report. Marine mammal
stock assessment reports 2012; National Marine Fisheries Service. Retrieved from
http://www.nmfs.noaa.gov/prot res/PR2/Stock Assessment Program/sars.html
NOAA. (2013). Reducing Ship Strike to North Atlantic Right whales. Office of Protected
Resources. Retrieved from http://www.nmfs.noaa.gov/pr/shipstrike/

119
Nelson, M., Garron, M., Merrick, R.L., Pace, R.M.III, & Cole, T.V.N. (2007). Mortality
and serious injury determinations for baleen whale stocks along the United States
eastern seaboard and adjacent Canadian maritimes, 2001-2005. Northeast Fisheries
Science Center Reference Document 07-05.
Nichols, O.C., & Kite-Powell, H. (2005). Analysis of risk to North Atlantic right whales
(Eubalaena glacialis) from shipping traffic in Cape Cod Bay. Final Report
Submitted to NOAA Fisheries Northeast Fisheries Science Center, NOAA Award No.
Na03NMF4720489.
Norton, M., & Karczub, D. 2003. Fundamentals of noise and vibration analysis for
engineers. (2nd
ed.). New York: Cambridge University Press.
Nowacek, D.P., Johnson, M.P., & Tyack, P.L. (2004). North Atlantic right whales
(Eubalaena glacialis) ignore ships but respond to alerting stimuli. Proceedings of the
Royal Society of London B, 271, 227-231.
Pace, R. (2011). Frequency of whale and vessel collisions on the US eastern seaboard:
ten years prior and two years post ship strike rule. Northeast Fisheries Science
Center Reference Document 11-15.
Panigada, S., Pesante, G., Zanardelli, M., Capoulade, F., Gannier, A., & Weinrich M.
(2006). Mediterranean fin whales at risk from fatal ship strikes. Marine Pollution
Bulletin, 52, 1287-1298.
Parks, S.E. (2003). Acoustic communication in the North Atlantic right whale
(Eubalaena glacialis). Ph.D. Thesis, Massachusetts Institute of Technology and
Woods Hole Oceanographic Institute.
Parks, S.E., Johnson, M., Nowacek, D., & Tyack, P.L. (2011). Individual right whales
call louder in increased environmental noise. Biology Letters, 7, 33-35.
Parks, S.E., Warren, J.D., Stamieszkin, K., Mayo, C.A., & Wiley, D. (2012). Dangerous
dining: foraging of North Atlantic right whales increases risk of vessel collisions.
Biology Letters, 8, 57-60.
Reeves, R.R., Breiwick, J.M., & Mitchell, E. (1992). Pre-exploitation abundance of right
whales off the eastern United States. Northeast Fisheries Science Center Reference
Document 92-05.
Reeves, R.R., Rolland, R., & Clapham, P. (2001). Report of the workshop on the causes
of reproductive failure in North Atlantic right whales: new avenues of research.
Northeast Fisheries Science Center Reference Document 01-16.

120
Reeves, R.R., Read, A.J., Lowry, L., Katona, S.K., Boness, D.J. (2006). Report of the
North Atlantic right whale program review. Prepared for the Marine Mammal
Commission 2007, Woods Hole, Massachusetts.
Reeves, R.R., Smith, T.D., & Josephson, E.A. (2007). Near-annihilation of a species:
right whaling in the North Atlantic. In Kraus, S.D., & Rolland, R.M. (Eds.), The
Urban Whale. (pp.39-74). Cambridge: Harvard University Press.
Richardson, J., Greene, C.R., Malme, C.I., & Thomson, D.H. (1995). Marine Mammals
and Noise. San Diego: Academic Press.
Ritter, F. (2010). Quantification of ferry traffic in the Canary Islands (Spain) and its
implications for collisions with cetaceans. Journal of Cetacean Research &
Management, 11(2), 139-146.
Rolland, R.M., Hunt. K.E., Doucette, G.J., Rickard, L.G., & Wasser, S.K. (2007). The
inner whale: hormones, biotoxins and parasites. In Kraus, S.D., & Rolland, R.M.
(Eds.), The Urban Whale. (pp.232-272). Cambridge: Harvard University Press.
Ross, D. (1976). Mechanics of underwater noise. New York: Pergamon Press.
Roworth, E., & Signell, R. (2002). “Gulf of Maine 15 arc second grid,” in Construction
of Digital Bathymetry for the Gulf of Maine. Coastal and Marine Geology Program,
U.S. Geological Survey, Open File Report 98-801. Retrieved from
http://pubs.usgs.gov/of/1998/of98-801/bathy/data.htm
Schick, R.S., Halpin, P.N., Read, A.J., Slay, C.K., Kraus, S.D., Mate, B.R., Baumgartner,
M.F., Roberts, J.J., Best, B.D., Good, C.P., Loarie, S.R., & Clark, J.S. (2009).
Striking the right balance in right whale conservation. Canadian Journal of Fisheries
and Aquatic Science, 66, 1399-1403.
Scott, J.M., Goble, D.D., & Davis, F.W. (2006). Introduction. In Goble, D.D., Scott, J.M.,
& Davis, F.W. (Eds.), The Endangered Species Act at Thirty. (Vol. 1, pp. 3-15).
Washington: Island Press.
Scott, J.M., Goble, D.D., Svancara, L.K., & Pidgorna, A. (2006). By the numbers. In
Goble, D.D., Scott, J.M., & Davis, F.W. (Eds.), The Endangered Species Act at
Thirty. (Vol. 1, pp. 16-35). Washington: Island Press.
Silber, G.K., Bettridge, S., & Cottingham, D. (2009). Report of a workshop to identify
and assess technologies to reduce ship strikes of large whales. Department of
Commerce, NOAA Technical Memorandum, NMFS-OPR-42.

121
Silber, G.K., & Bettridge, S. (2010). Vessel operations in right whale protection areas in
2009. U.S. Department of Commerce, NOAA Technical Memorandum, NMFS-OPR-
44.
Silber, G.K., Vanderlaan, A.S.M., Arceredillo, A.T., Johnson, L., Taggart, C.T., Brown,
M.W., Bettridge, S., & Sagarminaga, R. (2012). The role of the International
Maritime Organization in reducing vessel threat to whales: process, options, action
and effectiveness. Marine Policy, 36, 1221-1233.
Suckling, K., & Taylor, M. (2006). Critical habitat and recovery. In Goble, D.D., Scott,
J.M., & Davis, F.W. (Eds.), The Endangered Species Act at Thirty. (Vol. 1, pp. 75-89).
Washington: Island Press.
Terhune, J., & Verboom, W. (1999). Right whales and ship noise. Marine Mammal
Science, 15, 256-258.
Todd, S.K., Allen, J.K., Mahaffey, C.M., Damon, J., Hamilton, P., & Kenney, R.D.
(2009). An Acoustic Mysticete Shipstrike Mortality Risk Assessment for the Gulf of
Maine. In Proceedings of the 5th
International Conference on Bio-Acoustics
(Volume 5, pp. 280-287).
Trotter, B. (2011). CAT ferry operator drops lease for MDI terminal. Bangor Daily News
published March 19.
Trevorrow, M.D., Vasiliev, B., & Vagle, S. (2008). Directionality and maneuvering
effects on a surface ship underwater acoustic signature. Journal of the Acoustical
Society of America, 124(2), 767-778.
United States Geological Survey [USGS]. (2004). “USGS East Coast Sediment Texture
Database,” USGS Coastal and Maine Geology Program, Woods Hole Science
Center, Woods Hole, MA. Retrieved from http://pubs.usgs.gov/of/2000/of00-
358/text/chapter2.htm
Urick, R.J. (1983). Principles of Underwater Sound. Los Altos: Peninsula Publishing.
Van Der Hoop, J.M., Moore, M.J., Barco, S.G., Cole, T.V.N., Daoust, P.Y., Henry, A.G.,
McAlpine, D.F., McLellan, W.M., Wimmer, T., & Solow, A.R. (2013). Assessment
of management to mitigate anthropogenic effects on large whales. Conservation
Biology, 27(1): 121-133.
Vanderlaan, A.S.M., & Taggart, C.T. (2007). Vessel collision with whales: the
probability of lethal injury based on vessel speed. Marine Mammal Science, 231(1),
144-156.
122
Vanderlaan, A.S.M., Corbett, J.J., Green, S.L., Callahan, J.A., Wang, C., Kenney, R.D.,
Taggart, C.T., & Firestone, J. (2009). Probability and mitigation of vessel encounters
with North Atlantic right whales. Endangered Species Research, 6, 273-285.
Van Waerebeek, K., Baker, A.N., Felix, F., Gedamke, J. Iniguez, M., Sanino, G.P.,
Secchi, E., Sutaria, D., Van Helden, A., & Wang, Y. (2007). Vessel collisions with
small cetaceans worldwide and with large whales in the Southern Hemisphere, an
initial assessment. Latin American Journal of Aquatic Mammals, 6(1), 43-69.
Waldick, R.C., Kraus, S., Brown, M., & White, B.N. (2002). Evaluating the effects of
historic bottleneck events: an assessment of microsatellite variability in the
endangered North Atlantic right whale. Molecular Ecology, 11, 2241-2249.
Wallace, R.L. (2003). Social influences on conservation: lessons from U.S. recovery
programs for marine mammals. Conservation Biology, 17(1), 104-155.
Ward-Geiger, L.I., Silber, G.K., Baumstark, R.D., & Pulfer, T.L. (2005). Characterization
of ship traffic in right whale critical habitat. Coastal Management, 33, 263-278.
Waring, G.T., Josephson, E., Maze-Foley, K., & Rosel, P.E. (2011). U.S. Atlantic and
Gulf of Mexico marine mammal stock assessments 2010. NOAA Technical
Memorandum, NMFS NE 219.
Wartzok, D., & Ketten, D. (1999). Marine Mammal Sensory Systems. In Reynolds, J.E.,
& Rommel, S.A. (Eds.), Biology of Marine Mammals. (pp. 117-175). Washington:
Smithsonian Institution Press.
Wiley, D.N., Thompson, M., Pace, R.M. III, & Levenson, J. (2011). Modeling speed
restrictions to mitigate lethal collisions between ships and whales in the Stellwagen
Bank National Marine Sanctuary, U.S.A. Biological Conservation, 144, 2377-2381.
Williams, R., & O’Hara, P. (2010). Modeling ship strike risk to fin, humpback and killer
whales in British Columbia, Canada. Journal of Cetacean Research & Management,
11(1), 1-8.
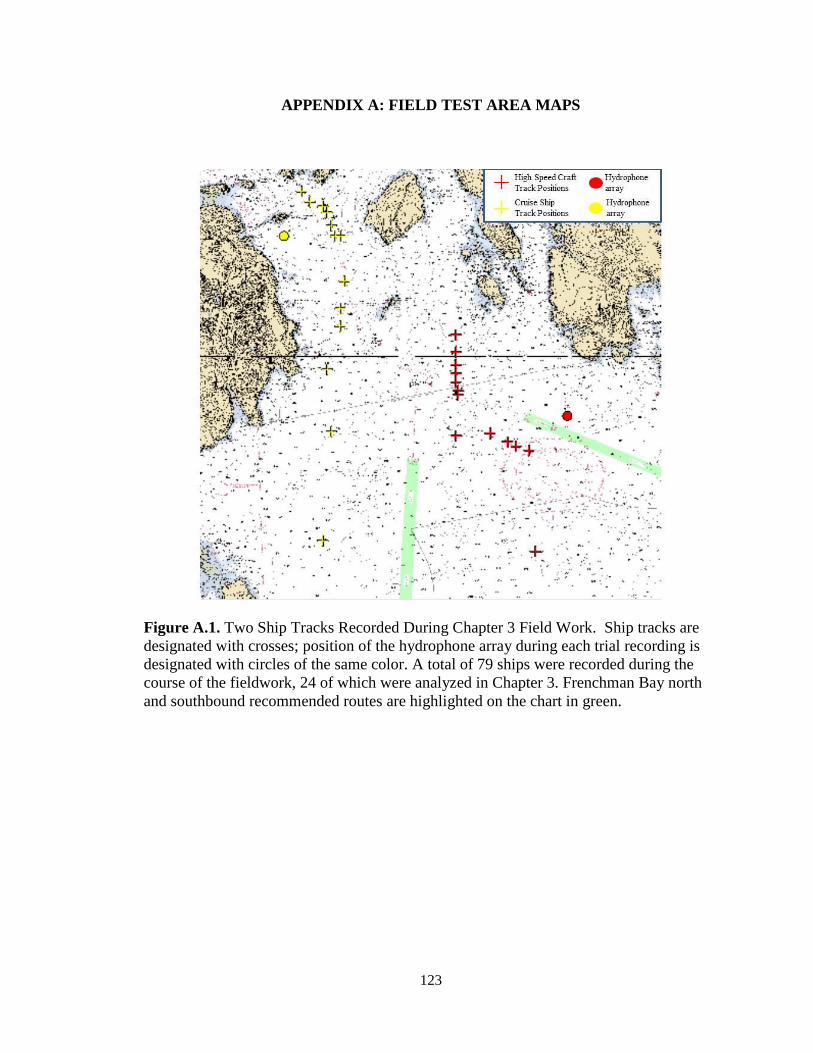
123
APPENDIX A: FIELD TEST AREA MAPS
Figure A.1. Two Ship Tracks Recorded During Chapter 3 Field Work. Ship tracks are
designated with crosses; position of the hydrophone array during each trial recording is
designated with circles of the same color. A total of 79 ships were recorded during the
course of the fieldwork, 24 of which were analyzed in Chapter 3. Frenchman Bay north
and southbound recommended routes are highlighted on the chart in green.
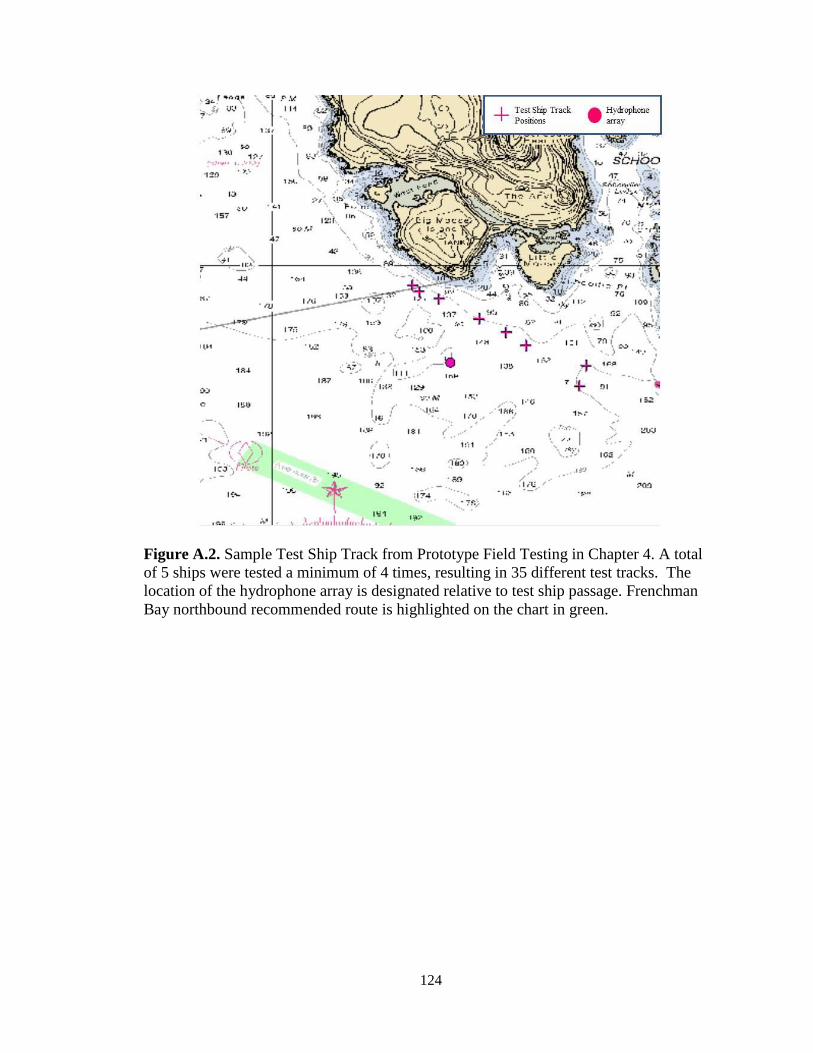
124
Figure A.2. Sample Test Ship Track from Prototype Field Testing in Chapter 4. A total
of 5 ships were tested a minimum of 4 times, resulting in 35 different test tracks. The
location of the hydrophone array is designated relative to test ship passage. Frenchman
Bay northbound recommended route is highlighted on the chart in green.
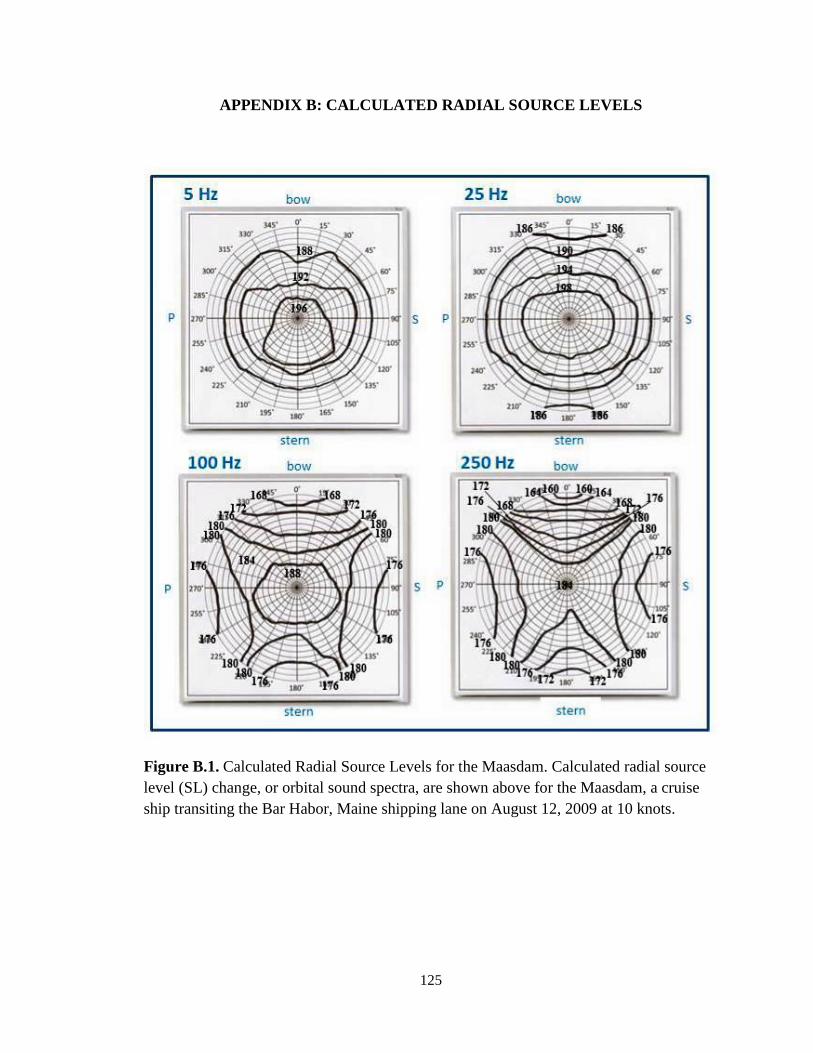
125
APPENDIX B: CALCULATED RADIAL SOURCE LEVELS
Figure B.1. Calculated Radial Source Levels for the Maasdam. Calculated radial source
level (SL) change, or orbital sound spectra, are shown above for the Maasdam, a cruise
ship transiting the Bar Habor, Maine shipping lane on August 12, 2009 at 10 knots.

126
The Maasdam was the only ship that passed the vertical hydrophone array on both
the starboard and port sides at approximately the same speed during this study. Both
passages were done within an hour, indicating environmental changes in Maasdam
acoustic signature propagation were relatively low. Calculated radial SLs shown above
are for 4 frequencies from 5 Hz – 250 Hz across a 50 m equidistant spherical plane at
hydrophone depth 5 m. The ship acoustic source is located in the center of the spherical
plane, and black rings indicate different calculated SLs at different recorded distances
and angles.
Although the calculated radial SL change shown in the figure above was only
calculated for a single ship (n=1), it demonstrates the sensory gradient a North Atlantic
right whale may encounter as a result of the presence of the recorded bow null effect
acoustic shadow zones in Chapter 3, better characterizing the acoustic field during close
whale/ship interactions.
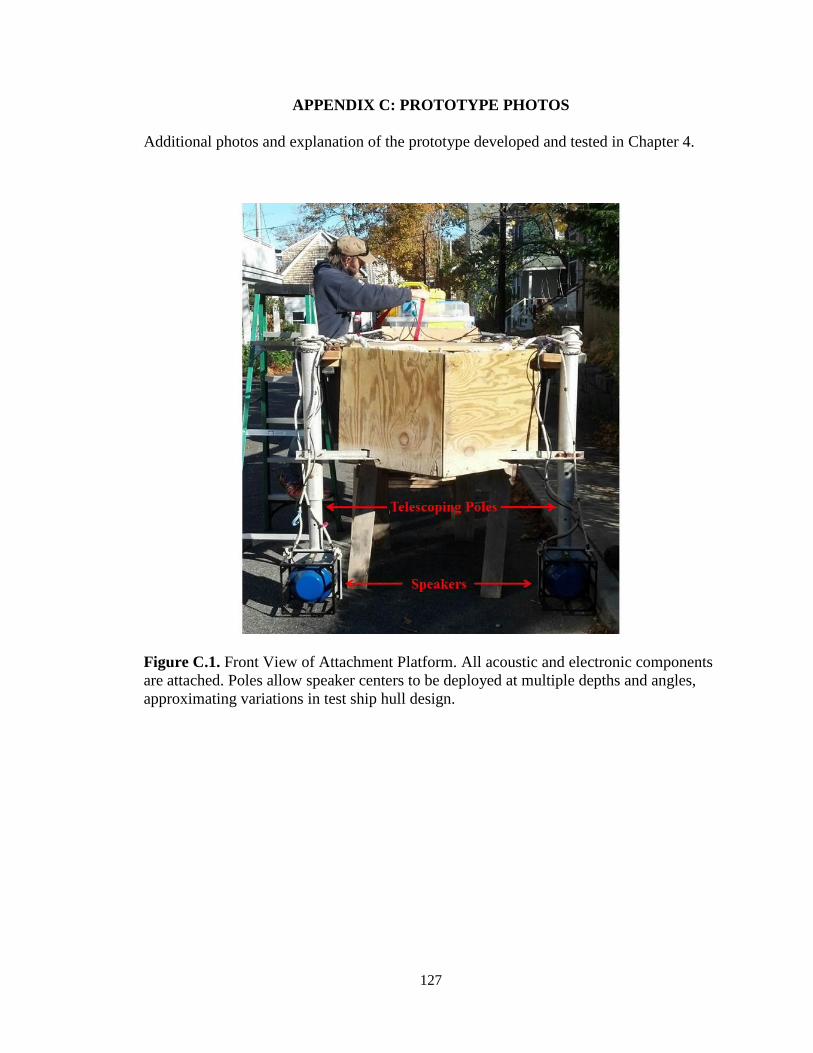
127
APPENDIX C: PROTOTYPE PHOTOS
Additional photos and explanation of the prototype developed and tested in Chapter 4.
Figure C.1. Front View of Attachment Platform. All acoustic and electronic components
are attached. Poles allow speaker centers to be deployed at multiple depths and angles,
approximating variations in test ship hull design.

128
Figure C.3. Extended Side View of Attachment Platform. All acoustic and electronic
components are attached.
Figure C.2. Labeled Side View of Attachment Platform. All acoustic and
electronic components are attached.

129
Figure C.4. Top View of Attachment Platform. All acoustic and electronic components are
attached.

130
Figure C.5. Close-Up of Platform Extensions. Platform extensions are padded and
adjustable to the width of each test ship’s bow. An additional notch is cut into the back
of the platform, beneath the carpet padding.
Figure C.6. Attachment Platform Deployed with Speakers Attached. Platform
extensions, generator, and electronics complex not yet attached.
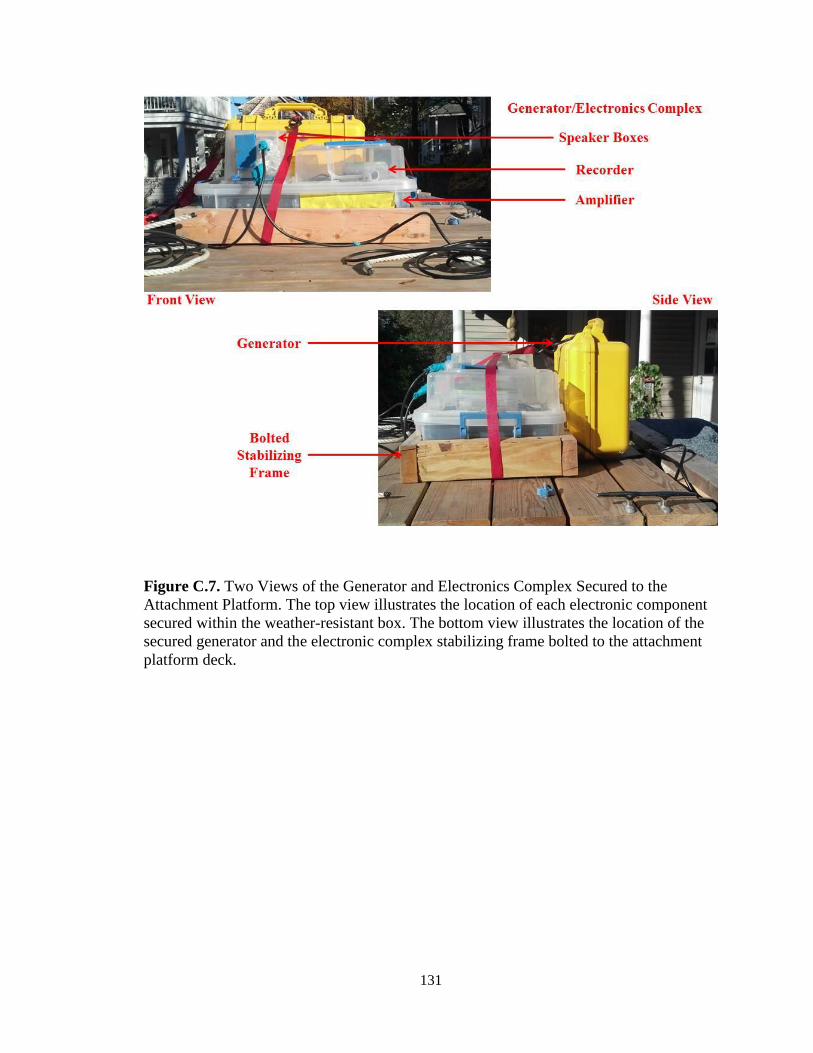
131
Figure C.7. Two Views of the Generator and Electronics Complex Secured to the
Attachment Platform. The top view illustrates the location of each electronic component
secured within the weather-resistant box. The bottom view illustrates the location of the
secured generator and the electronic complex stabilizing frame bolted to the attachment
platform deck.

132
Figure C.8. Prototype Being Attached to Test Ship Frenchman Bay. Stabilizing lines are
highlighted. Note that this test ship does not feature rub rails. As a result, the attachment
platform tracks at an additional 0.6 meters depth compared to deployments on test ships
that feature rub rails. This difference in speaker depth was accounted for during
prototype testing.
133
BIOGRAPHY OF THE AUTHOR
Kaitlyn Allen Mullen was born in Richmond, Virginia on June 14, 1980. She was
raised in Hanover County, Virginia and graduated from Patrick Henry High School in
1998. She attended Belmont University in Nashville, Tennessee and graduated in 1998
with a Bachelor’s degree in Music Business and Marketing. After touring as a
singer/songwriter she moved to Maine to continue her education. Kaitlyn earned a second
Bachelor’s degree in Marine Science at the University of Maine in 2006. She entered the
interdisciplinary Ocean Engineering graduate program at The University of Maine in the
fall of 2006. While a graduate student at the University of Maine, Kaitlyn also worked as
a naturalist for the Bar Harbor Whale Watch Company and New Horizon Cruises,
worked as a Marine Mammal Observer in the Gulf of Mexico, worked as a research
associate with Allied Whale, and participated in marine mammal field work in the Gulf
of Maine and the Cape Canaveral National Wildlife Refuge. As a result of her
experiences, Kaitlyn earned her 100-ton master’s license in March 2010. She will likely
continue working as a captain and naturalist after receiving her degree. Kaitlyn is a
candidate for the Doctor of Philosophy degree, Interdisciplinary in Ocean Engineering
from The University of Maine in December 2013.