developing an adaptive model of thermal comfort and preference
TRANSCRIPT

i
Developing an Adaptive Model of Thermal Comfort and Preference
FINAL REPORT
ASHRAE RP- 884
March 1997
Richard de DearÀ, Gail BragerÁ, Donna CooperÀ
À Macquarie Research Ltd., Macquarie University, Sydney, NSW 2109 AUSTRALIA
Á Center for Environmental Design Research, University of California,
Berkeley, CA 94720 USA
“Results of Cooperative Research between the American Society of Heating, Refrigerating
and Air Conditioning Engineers, Inc., and Macquarie Research, Ltd.”

ii
iii
i
TABLE OF CONTENTS iii
ACKNOWLEDGMENTS vii
EXECUTIVE SUMMARY ix
CHAPTER 1 - INTRODUCTION & BACKGROUND 1
1.1. Introduction 1
1.2. Defining the adaptive process 3 1.2.1. The dialectic of contemporary thermal comfort theory 3 1.2.2. The “adaptive” hypothesis 4
1.3. A conceptual model of adaptation -- feedback loops 6 1.3.1. Behavioral feedback - adjustment 8 1.3.2. Physiological feedback -- acclimatization 10 1.3.3. Psychological feedback -- habituation and expectation 12
1.4. Literature review 13 1.4.1. Climate chamber evidence for adaptation to climate 13 1.4.2. Field evidence for adaptation 15
1.4.2.1. The earlier field evidence for adaptation 16 1.4.2.2. Analysis of neutral temperatures using recent field experiments 18 1.4.2.3. Evidence for behavioral adaptation - personal/environmental adjustment 22 1.4.2.4. Evidence for psychological adaptation - expectation and context 23
1.5. Implications for RP-884 26 1.5.1. Lessons from static heat balance models 26 1.5.2. Time scales of thermal adaptation 29
1.6. Aims 31
CHAPTER 2 - METHODS 33
2.1. Overview of the RP-884 approach 33
2.2. Establishing the database for RP-884 36 2.2.1. Sourcing the raw data 36 2.2.2. Ratings of raw data submitted to RP-884 40
2.3. Raw data standardisation 41 2.3.1. Creation of a standard data template 41 2.3.2. Consistent mean radiant temperatures within the database. 42 2.3.3. Consistent comfort index calculations within the database 42 2.3.4. Predicted draft risk index (PD) 43 2.3.5. Clothing insulation in the ASHRAE RP-884 database 44
2.3.5.1. Discrepancies between field estimation methods for clo. 45 2.3.5.2. The chair insulation effect 49
2.4. Developing an index for perceived thermal control 49

iv
2.5. Thermal acceptability issues within the RP-884 database 51 2.5.1. Developing a proxy variable for thermal acceptability based on thermal
sensation votes. 51 2.5.2. Rating buildings in terms of their compliance with ASHRAE Standard 55
acceptable indoor climate guidelines 52
2.6. Outdoor meteorological/climatological data for the data base 52 2.6.1. Appending outdoor weather observations to each row of data 52 2.6.2. Climate classification applied to RP-884 raw data 53
2.7. Subdivision of the standardized field experiments 54
2.8. The meta-analysis 54 2.8.1. The unit of analysis for the RP-884 meta-analysis 54 2.8.2. Meta-file’s structure and coding conventions 55 2.8.3. General assumptions within the statistical meta-analysis 55 2.8.4. Statistical treatments on the various subjective thermal ratings 56 2.8.5. Preferred temperatures 59
2.9. The RP-884 database in the public domain and disseminated via the world wide web 60
2.10. Summary of the methods used in RP-884 64
CHAPTER 3 - BASIC RESULTS 67
3.1. Interactions with indoor climate 67 3.1.1. Thermal sensation 67
3.1.1.1. Dependence of thermal sensation on indoor operative temperature 68 3.1.1.2. Dependence of thermal sensation on indoor ET 69 3.1.1.3. Dependence of thermal sensation on PMV 70 3.1.1.4. Dependence of thermal sensation on indoor SET 71
3.1.2. Thermal neutrality 72 3.1.2.1. Neutral operative temperatures (neut_top) 72 3.1.2.2. Neutral effective temperatures (neut_et) 74 3.1.2.3. Neutral predicted mean votes (neut_pmv) 74 3.1.2.4. Predicted neutralities with the PMV heat balance model 75 3.1.2.5. Neutral standard effective temperatures (neut_set) 77
3.1.3. Thermal acceptability and indoor climate 78 3.1.3.1. Relationship between direct and inferred thermal acceptability 78 3.1.3.2. Directly determined thermal acceptability 80 3.1.3.3. Thermal acceptability inferred from thermal sensation 83 3.1.3.4. Thermal sensitivity and the range of thermally acceptable temperatures. 84
3.1.4. Thermal preferences and indoor climate 89 3.1.5. Comparisons between neutral and preferred temperatures indoors. 91 3.1.6. Behavioural adjustments to indoor climate 93
3.1.6.1. Thermal insulation adjustments indoors 94 3.1.6.2. Metabolic rate adjustments indoors 97 3.1.6.3. Air speed adjustments indoors 99
v
3.2. Interactions with outdoor weather and climate 102 3.2.1. Thermal neutrality and outdoor climate 102
3.2.1.1. Seasonal comparisons 103 3.2.1.2. Dependence of observed neutrality on outdoor climate 104 3.2.1.3. Analysis of predicted neutralities with respect to mean outdoor temperature 106
3.2.2. Thermal acceptability and outdoor climate 108 3.2.3. Thermal preference and outdoor climate 110 3.2.4. Behavioral responses to outdoor climate 113
3.2.4.1. Indoor clothing and outdoor climate 114 3.2.4.2. Metabolic rate indoors related to outdoor climate 115 3.2.4.3. Indoor air speeds in relation to outdoor climate 116
3.3. Influence of building characteristics on thermal comfort 118 3.3.1. HVAC versus natural ventilation 118
3.3.1.1. Thermal sensation and sensitivity in HVAC versus naturally ventilated buildings 119
3.3.1.2. Thermal acceptability in HVAC versus naturally ventilated buildings 121 3.3.1.3. Thermal preferences in HVAC versus naturally ventilated buildings. 122
3.3.2. Personal environmental control 124 3.3.3. Building occupancy types - offices, residential and industrial 127
3.4. Summary of basic results 130 3.4.1. Summary of thermal sensation, acceptability and preference 131 3.4.2. Summary of thermal sensitivity and behavioral thermoregulation 133 3.4.3. Summary of the effects of outdoor climate on thermal perception indoors 134 3.4.4. Summary of the effects of contextual factors and perceived control 135
CHAPTER 4 - TOWARDS ADAPTIVE MODELS 139
4.1. The semantics of thermal comfort 139
4.2. Comparison of RP-884 models with earlier adaptive model publications 141
4.3. Comparison of RP-884 models with the PMV “static model” 145 4.3.1. Comparisons within the centrally conditioned building sample 146 4.3.2. Comparisons within the naturally ventilated building sample 150
4.4. Adaptive models for acceptable ranges of indoor temperatures 152
CHAPTER 5 - VARIABLE TEMPERATURE STANDARDS 155
5.1. A variable temperature standard for application in buildings with centrally controlled HVAC 155
5.1.1. Purpose 155 5.1.2. Scope 156 5.1.3. Definitions 156 5.1.4. Conditions for an acceptable thermal environment. 161
5.1.4.1. Analytic PMV method 161 5.1.4.2. Adaptive PMV method 161 5.1.4.3. Prescriptive method 163
5.2. A variable temperature standard for application in naturaly ventilated buildings 165
vi
5.2.1. Purpose 165 5.2.2. Scope 165 5.2.3. Definitions 166 5.2.4. Conditions for an acceptable thermal environment. 168
BIBLIOGRAPHY 171
APPENDIX A - THERMAL SENSATION AND NEUTRALITY FOR EACH BUILDING IN THE RP-884 DATABASE 185
APPENDIX B - PREFERRED TEMPERATURE FOR EACH BUILDING IN THE RP-884 DATABASE 227
APPENDIX C - SUMMARY OF THE ORIGINAL FIELD EXPERIMENTS COMPRISING THE ASHRAE RP-884 DATABASE 235
C.1. Project Title - ASHRAE TC 2.1 sponsored RP-702 236
C.2. Project Title - Thermal comfort studies in modern industrial buildings. 239
C.3. Project Title - Doctoral dissertation. From comfort to kilowatts: An integrated assessment of electricity conservation in Thailand’s commercial sector. 242
C.4. Project Title - The CSAA, Antioch (1995) component of the Advanced Customer Technology Test (ACT2) project. 245
C.5. Project Title - Higher PMV causes higher energy consumption in air- conditioned buildings: a case study in Jakarta, Indonesia. 248
C.6. Project Title - Montreal ASHRAE RP-821. 250
C.7. Project Title - Richard de Dear’s PhD research project in Australia. 253
C.8. Project Title - A field study of thermal comfort using questionnaire software. 256
C.9. Project Title - “Thermal comfort in Pakistan.” 258
C.10. Project Title - Comfort criteria for passively cooled buildings. a PASCOOL task. 262
C.11. Project Title - Developing indoor temperatures for naturally ventilated buildings. 264
C.12. Project Title - Mixed mode climate control: some hands-on experience. 267
C.13. Project Title - ASHRAE sponsored RP-462. San Francisco area. 269
C.14. Project Title - A field investigation of thermal comfort environmental satisfaction and perceived control levels in UK office buildings, University of Liverpool. 272
C.15. Project Title - Thermal comfort in the humid tropics: field experiments in air conditioned and naturally ventilated buildings in Singapore. 275
C.16. Project Title - The Steelcase building. Grand Rapids Michigan, US 277
C.17. Project Title - Sunset building: a study of occupant thermal comfort in support of PG&E’s Advanced Customer Technology Test (ACT2) for maximum energy efficiency 279
C.18. Project Title - The Verifone building, a component of the Advanced Customer Technology Test (ACT2) Project. 282
APPENDIX D - CLIMATE CLASSIFICATION 285
APPENDIX E - CODEBOOK FOR RAW DATA IN RP-884 DATABASE 287
vii
APPENDIX F - CODEBOOK FOR THE RP-884 META-ANALYSIS 291
APPENDIX G - AULICIEMS’ ADAPTIVE MODEL DATABASE 295
ACKNOWLEDGMENTS
The successful completion of this project depended very heavily on the willingness of field
researchers to make available their raw data for re-analysis and incorporation into the RP-
884 database. In particular, we would like to thank the following contributors:
Dr. Jill Brown, formerly of University of Wales, Cardiff; Dr. John Busch Jr. Lawrence
Berkeley Labs., California; Prof. Cris Benton, CEDR, University of California at Berkeley;
Dr. Tri Karyono, Agency for the Assessment and Application of Technology (BPPT),
Jakarta, Indonesia (formerly of the Department of Architecture, University of Sheffield, UK);
Dr. Giovanna Donnini, formerly of Auger, Donnini and Nguyen Inc, Montreal, Canada; Dr.
Guy Newsham, Institute for Research in Construction, National Research Council of
Canada, Ottawa; Fergus Nicol, School of Architecture, Oxford-Brookes University, UK.;
Iftikhar Raja, School of Architecture, Oxford-Brookes University, UK; Prof. Nick Baker, The
Martin Centre for Architecture and Urban Studies, University of Cambridge, UK; David
Rowe, Dept. of Architectural and Design Science, University of Sydney, Australia; Dr Ruth
Williams, The Building Services Research and Information Association, UK (formerly
Liverpool University, UK); Fred Bauman, CEDR, University of California at Berkeley.
RP-884 also depended on weather and climate data resources. Such data was required for
the relevant sites and periods covered by field experiments within the database. Apart from
resources available on the WWW and various CD-ROM publications, the following
organisations provided data. The Australian Bureau of Meteorology’s National Climate
Centre supplied meteorological data for the Melbourne, Brisbane and Darwin field
experiments. The Oxford University Radcliffe Observatory supplied meteorological
observations for some of the UK experiments. Macquarie University’s Meteorological Site
supplied observations for the Sydney field data. The US National Climate Data Center
(NCDC) supplied meteorological data for the Californian experiments. Meteorological

viii
observations for Grand Rapids were supplied by the Michigan State Climatologist.
Bangkok meteorological data were supplied by the Royal Thai Meteorological Department.
Special thanks are also due to Andris Auliciems of the University of Queensland, Fergus
Nicol of Oxford-Brookes University and Michael Humphreys of Oxford University for their
pioneering work in the area of adaptive models and also for their encouragement at various
stages during the ASHRAE RP-884 project.
ix
EXECUTIVE SUMMARY
One of the more contentious theoretical issues in the applied research area of thermal
comfort has been the dialectic between “adaptive” and “static” models. Apart from having
disparate methodological bases (the former laboratory-experimental, the latter field-based),
the two approaches have yielded starkly differing prescriptions for how the indoor climate of
buildings should be managed. These prescriptions carry implications for the types of
permissible building designs, the means by which their thermal environments are controlled,
and the amounts of energy they consume in the production of habitable indoor climates.
Static models have led to indoor climate standards that have been universally applied
across all building types, are characterised by minimal recognition of outdoor climatic
context, and are contributing to an increased reliance on mechanical cooling. In contrast,
proponents of adaptive models have advocated variable indoor temperature standards that
more fully exercise the adaptive capabilities of building occupants. This approach
potentially leads to more responsive environmental control algorithms, enhanced levels of
occupant comfort, reduced energy consumption, and the encouragement of climatically
responsive building design.
Despite these apparent differences, our review of the research literature emerging from both
approaches indicated that this seemingly irreconcilable split was primarily the result of
narrow definitions of the term “thermal adaptation”, and that there were opportunities to
bridge some of the gap between the hypotheses. We suggest that human thermal
adaptation is comprised of three distinct yet interrelated processes - behavioral,
physiological, and psychological. The adoption of this tripartite definition goes some way
towards reconciling the static and adaptive approaches and the indoor climate standards
derived from them.
This project’s principal objective was the proposal of a variable temperature standard based
on the adaptive approach. Where it differs from earlier attempts is in the quality control
applied throughout its adaptive modelling method. About 21,000 sets of raw thermal
comfort data from 160 buildings were collected from most of the thermal comfort field
research groups around the world who are currently active. Data selection criteria
x
emphasized precision of indoor climatic instruments, while data assimilation involved a
variety of questionnaire standardization processes. For example, each one of the over
21,000 building subjects’ clothing thermal insulation estimates was transformed into an
equivalent clo value using consistent procedures specified in ASHRAE Standard 55-1992.
The thermal effects of chairs for seated subjects was also included. For each set of raw
data, outdoor meteorological and climatological data were appended to the RP-884
database. All indoor and outdoor thermal indices were recalculated using a standard
software package (WinComf©) recently commissioned by ASHRAE’s TC 2.1. Since a
significant component of this project’s effort was expended in the assembly of the database,
and since that database has relevance to thermal comfort research problems extending well
beyond the scope of RP-884, we have chosen to place this valuable data resource in the
public domain (World Wide Web) where it can be used by the international thermal comfort
research community.
After statistically analysing the raw data collected in each of the RP-884 database’s 160
buildings, we conducted a meta-analysis of human subjective response to indoor climate
and how it interacted with indoor architectural, contextual and outdoor meteorological
factors. The main subjective response variables were thermal neutrality (derived from
thermal sensation votes) and preferred temperature. Eighty and 90% thermal acceptability
criteria for general thermal comfort were estimated for each building as the range of
operative temperatures falling between mean thermal sensations of ±0.85 and ±0.5
respectively. The list of independent variables in the meta-analysis included the following
indoor climatic indices: operative temperature, effective temperature, PMV/PPD and
standard effective temperature. Outdoor climate was operationalized as an independent
variable in our meta-analysis as the mean of daily minimum and maximum outdoor effective
temperatures prevailing during each building’s survey period. The most important contextual
factor in our meta-analysis was a classification of buildings as having either central HVAC or
being naturally ventilated. This distinction was a unique feature of the ASHRAE RP-884
project, and produced some of the most significant results.
The meta-analysis clearly indicated that the definition and prescription for thermal
acceptability contained in ASHRAE Standard 55-92 bore little resemblance or relationship
to the levels actually expressed by occupants within the building sample. Thermal sensation

xi
and thermal preference on the other hand, demonstrated statistically significant dependence
on indoor thermal indices prevailing at the time of the questionnaire (these included
operative, effective and standard effective temperatures, or PMV/PPD). Thermal neutrality,
defined as the operative temperature most closely corresponding with a mean thermal
sensation vote of zero (“neutral”) showed an adaptive relationship with mean indoor
temperatures - warm buildings had warm neutralities and vice versa. However, this adaptive
relationship was stronger in naturally ventilated buildings than in buildings with centralized
HVAC systems. Similar adaptive relationships were established for neutrality and
preference with outdoor climate, and again, the strength of the relationship was greater in
the sample of naturally ventilated buildings. These observations support the notion that
building occupants’ thermal ideals are influenced by their thermal experiences both indoors
and outdoors.
Preferred temperature for a particular building did not necessarily coincide with thermal
neutrality, and this semantic discrepancy was most evident in HVAC buildings where
preference was depressed below neutrality in warm climates and elevated above neutrality
in cold climates (i.e, people preferred to feel cooler than neutral in warm climates, and
warmer than neutral in cold climates). This finding suggests that much of what has been
regarded as climatic adaptation by previous proponents of the adaptive model was in fact a
consequence of defining thermal optima in terms of neutrality instead of preference.
Clothing insulation worn by building occupants demonstrated a dependence on both mean
indoor and outdoor temperatures. Thermal insulation levels worn indoors decreased as
indoor and outdoor temperatures increased, while mean indoor air speed demonstrated a
positive dependence on prevailing temperature levels. The close agreement between PMV
model predictions of optimum indoor temperature and those actually observed within HVAC
buildings suggests that the type of thermal adaptation found in such buildings was of the
behavioral type, mainly driven by adjustments to clothing and indoor air speed. In contrast,
the range of optimum indoor temperatures observed in naturally ventilated buildings was
about twice as large as that predicted by the PMV model, suggesting that physiological
(acclimatisation) and psychological (shifting expectations) adaptive processes were
superimposed on the behavioral adaptations of clothing and air speed adjustment in the
naturally ventilated context.

xii
Based on these adaptive relationships between indoor comfort and outdoor climate, the RP-
884 project concluded with a pair of variable temperature standards. One standard was
designed for use in HVAC buildings where occupants had little or no adaptive opportunity,
while the other was designed for naturally ventilated buildings where occupants had access
to operable windows and other adaptive opportunities. The HVAC standard was based on
three alternative methods; a) the analytic PMV method for use whenever accurate estimates
for all the heat-balance model’s inputs were feasible; b) the modified “adaptive PMV”
method for use whenever an accurate estimate of mean outdoor effective temperature was
possible (defined as the arithmetic average of 6am and 3pm outdoor effective
temperatures), and c) the prescriptive method for use whenever the first two approaches
were not feasible (presented as summer and winter comfort zones on the psychrometric
chart). Acceptable ranges of operative temperature were applied symmetrically above and
below predicted optimum operative temperatures. The average winter prescription for 90%
general thermal acceptability (excluding local discomforts) was given as 22.5°C ± 1.2 K
while the summer prescription was given as 23.5°C ± 1.2 K.
The variable temperature standard for use in naturally ventilated buildings was given as an
adaptive linear regression model based on outdoor weather and climate:
optimum indoor temperature = 18.9 + 0.255 * (outdoor mean ET*)
Acceptable temperature ranges around the optimum in naturally ventilated buildings were
specified as ±3.5 for 80% general acceptability and ±2.5 for 90% general acceptability.
The RP-884 project leads to the conclusion that the PMV model represents a useful adjunct
to comfort standards intended for use exclusively within HVAC buildings where occupants
have little or no opportunity to adapt themselves, nor their immediate occupied zone.
However, application of this same model in naturally ventilated settings leads to significant
errors since it overlooks an important adaptive response in the form of variable thermal
expectations of building occupants in such buildings. In naturally ventilated settings we
recommend the application of an adaptive model that predicts optimum indoor temperature
from a knowledge of the building’s meteorologic or climatic setting.

xiii

xiv

xv

ASHRAE RP-884 Final Report
Introduction & Background page MRL Australia 1
CHAPTER 1 - INTRODUCTION & BACKGROUND
1.1. Introduction
The way we design, construct, and operate buildings has profound implications for the
quality of both the natural and built environments. All too often today’s buildings require
massive resource inputs, create bleak or potentially unhealthy indoor environments,
pollute both their local and global environments through increased greenhouse
emissions, as well as contributing to the destruction of natural habitats (Barnett and
Browning 1995). The energy required to heat and cool our buildings, and the very way
we define the “comfortable” thermal conditions we are trying to maintain, play significant
roles in this environmental impact. The use of energy for heating, ventilating and air-
conditioning (HVAC) of the indoor environment is already the largest sector in energy
consumption in most of the developed world (Griffiths et al 1988). As well we seeing a
significant increase in HVAC energy use in developing and newly industrialized
countries as well (Ang 1986, Abro 1994). This is particularly relevant to the rapidly
developing tropical regions of the Asia-Pacific region, where traditional lifestyles in
naturally ventilated buildings are giving way to an increased reliance on mechanical
cooling. This in turn is changing both the way we design buildings and building
occupants’ expectations and behavioral patterns related to air conditioning (Lovins
1992).
It is commonly estimated that persons in economically developed countries spend at
least 80% of their time indoors. This suggests that the quality of the indoor environment
can have a significant impact on comfort, health, and overall sense of well-being. In an
effort to maintain the quality of the indoor environment, we mechanically condition our
buildings to provide constant, uniform, “comfortable” environments. The current
standards that define what those “comfortable” conditions should be were conducted
primarily with university students and in mid-latitude climate regions (ASHRAE 1992,
ISO 1994). Other than allowing for only a slight seasonal shift in the comfort zone based
on clothing adjustments, it is often suggested that the standards are universally
applicable across all building types, climates, and populations (Parsons 1994 and

ASHRAE RP-884 Final Report
Introduction & Background page MRL Australia 2
discussion). A strict reliance on laboratory-based comfort standards also ignores
important cultural and social differences in the need or desire for air conditioning. A
special issue of Energy and Buildings (Kempton and Lutzenhiser 1992) focused on
these non-thermal issues, with a variety of papers examining how individuals and
cultures vary in their perceived need for and expectations of air conditioning.
But perhaps the single biggest issue in this debate remains the applicability of
standards in buildings which aren’t air conditioned at all. For example, when recently
asked by a union official whether or not Standard 55 (ASHRAE 1992) was applicable to
un-air-conditioned premises, ASHRAE’s Technical Committee (TC 2.1) responsible for
the standard openly declared that their comfort charts were intended for both HVAC and
naturally ventilated premises. Many researchers, however, challenge this assumption of
universal applicability, arguing that it ignores important contextual differences that can
attenuate responses to a given set of thermal conditions. While the “comfort zone” might
be viewed by the engineering community as a design goal for a deterministic HVAC
control system, its relevance to naturally ventilated buildings where conditions are
inherently much more variable is questionable (Forwood 1995). This was also
acknowledged by Givoni (1992), who revised his already notable work on the building
bioclimatic chart. He expanded the boundaries of the comfort zone based on the
expected indoor temperatures achievable with different passive design strategies,
applying a “common sense” notion that people living in unconditioned buildings become
accustomed to, and grow to accept higher temperature or humidities. Strict and literal
interpretation of the static “comfort zone” precludes application to anything other than
full-blown HVAC designs across the world’s moderate to extreme climate zones.
An alternative to traditional comfort theory - termed the “adaptive model” of comfort -
embraces the notion that people play an instrumental role in creating their own thermal
preferences. This is achieved either through the way they interact with the environment,
or modify their own behavior, or because contextual factors and past thermal history
change their expectations and thermal preferences. Interest and research into this
“adaptive” theory of thermal comfort first began in the mid-70’s in response to the oil-
shocks, and has recently regained momentum due to increasing concerns over human
impact on global climatic environment. There are numerous benefits to be gained from
ASHRAE RP-884 Final Report
Introduction & Background page MRL Australia 3
an improved understanding of the influence of adaptation on thermal comfort in the built
environment. These include improved predictive models and standards, more
sophisticated and responsive environmental control algorithms, increased opportunities
for personal control, enhanced levels of thermal comfort and acceptability among
occupants, reduced energy consumption, and the encouragement of climatically
responsive and environmentally responsible building design.
This research project, “ASHRAE RP-884 - Developing an Adaptive Model of Thermal
Comfort and Preference”, is premised on the development and analysis of a quality-
controlled, cumulative database compiled from previous thermal comfort field
experiments worldwide. The aim is to use this database to refine our conceptual
understanding of adaptive mechanisms, to develop an empirical model of the adaptive
process, and to propose a variable temperature standard to supplement the current
ASHRAE Standard 55 (1992).
1.2. Defining the adaptive process
1.2.1. The dialectic of contemporary thermal comfort theory
In contemporary thermal comfort research, there is a perceived irreconcilable split into
“static” and “adaptive” schools of thought (Auliciems 1989; Nicol 1993). In the “static”
camp are ASHRAE’s Standard 55 --Thermal Environmental Conditions for Human
Occupancy (ASHRAE 1992) and the ISO Standard 7730 (ISO 1994). The static model
essentially views the person as a passive recipient of thermal stimuli. It is premised on
the assumption that the effects of a given thermal environment are mediated exclusively
by the physics of heat and mass exchanges at the surface of the body, while the
maintenance of a constant internal body temperature necessitates some physiological
responses. It is generally assumed in the static school of thought that thermal
sensations (hot-warm-cool-cold) are proportional to the magnitude of these
physiological responses, as measured by mean skin temperature and latent heat loss or
wettedness due to sweating (Benzinger 1979). The deterministic logic underpinning
heat balance comfort models such as PMV, ET* and SET* is:
physics ⇒ physiology ⇒ subjective discomfort
ASHRAE RP-884 Final Report
Introduction & Background page MRL Australia 4
These models are based on extensive and rigorous laboratory experiments, and yield
fairly consistent, reproducible results in climate chambers. However, researchers are
increasingly exploring the extent to which we can directly apply these laboratory-derived
models, without modification, to the task of predicting subjective responses to thermal
conditions in real buildings, where the interactions between the occupants and indoor
climate are exceedingly complex. Adherents to the adaptive school of thought regard
the simplistic cause-and-effect approach embodied in the static models as inadequate
to describe thermal perception in the real world. As such the static hypothesis has
come to be regarded as a “single temperature” model of thermal comfort (Humphreys
1981, 1994a, Nicol 1993: Auliciems 1989). But a more conciliatory interpretation of the
heat balance model depicts it as partially adaptive, since it does include the impact of
thermal variables and clothing which can be adjusted by the occupant.
1.2.2. The “adaptive” hypothesis
With the static heat-balance models representing one side, on the other side of this
dialectic is the “adaptive” school of thought in which factors beyond the fundamental
physics and physiology all interact with thermal perception. These factors can include
demographics (gender, age, economic status), context (building design, building
function, season, climate, semantics, social conditioning), and cognition (attitude,
preference, and expectations) (McIntyre 1982, Baker 1993, Baker and Standeven 1994,
Oseland 1994a,b, Griffiths et al 1988). These factors have been demonstrated time
and again to be irrelevant to the comfort responses of subjects in the contrived setting of
the climate chamber (Fanger 1972b, de Dear et al 1991a). However, there remains a
lingering suspicion in the minds of adaptive modellers and practitioners alike that such
considerations cannot be dismissed so easily in the context of real buildings.
The generic term “adaptation” might broadly be interpreted as the gradual diminution of
the organism’s response to repeated environmental stimulation. As used in RP-884,
adaptation subsumes all physiological mechanisms of acclimatization, plus all
behavioral and psychological processes which building occupants undergo in order to
improve the “fit” of the indoor climate to their personal or collective requirements. Within
ASHRAE RP-884 Final Report
Introduction & Background page MRL Australia 5
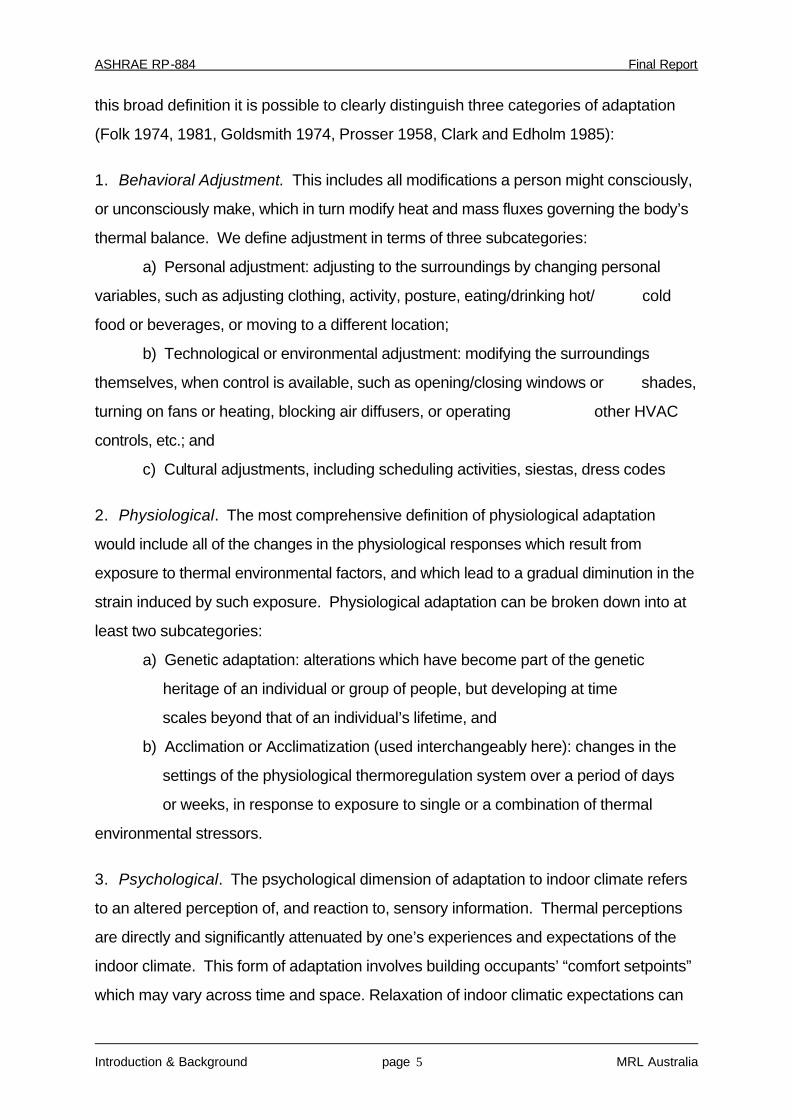
this broad definition it is possible to clearly distinguish three categories of adaptation
(Folk 1974, 1981, Goldsmith 1974, Prosser 1958, Clark and Edholm 1985):
1. Behavioral Adjustment. This includes all modifications a person might consciously,
or unconsciously make, which in turn modify heat and mass fluxes governing the body’s
thermal balance. We define adjustment in terms of three subcategories:
a) Personal adjustment: adjusting to the surroundings by changing personal
variables, such as adjusting clothing, activity, posture, eating/drinking hot/ cold
food or beverages, or moving to a different location;
b) Technological or environmental adjustment: modifying the surroundings
themselves, when control is available, such as opening/closing windows or shades,
turning on fans or heating, blocking air diffusers, or operating other HVAC
controls, etc.; and
c) Cultural adjustments, including scheduling activities, siestas, dress codes
2. Physiological. The most comprehensive definition of physiological adaptation
would include all of the changes in the physiological responses which result from
exposure to thermal environmental factors, and which lead to a gradual diminution in the
strain induced by such exposure. Physiological adaptation can be broken down into at
least two subcategories:
a) Genetic adaptation: alterations which have become part of the genetic
heritage of an individual or group of people, but developing at time
scales beyond that of an individual’s lifetime, and
b) Acclimation or Acclimatization (used interchangeably here): changes in the
settings of the physiological thermoregulation system over a period of days
or weeks, in response to exposure to single or a combination of thermal
environmental stressors.
3. Psychological. The psychological dimension of adaptation to indoor climate refers
to an altered perception of, and reaction to, sensory information. Thermal perceptions
are directly and significantly attenuated by one’s experiences and expectations of the
indoor climate. This form of adaptation involves building occupants’ “comfort setpoints”
which may vary across time and space. Relaxation of indoor climatic expectations can

ASHRAE RP-884 Final Report
Introduction & Background page MRL Australia 6
be likened to the notion of habituation in psychophysics -- repeated or chronic exposure
to an environmental stressor leading to a diminution of the evoked sensation’s intensity
(Glaser 1966, Frisancho 1981).
habituationpsychological adaptation -
changing expectations
adjustmentbehavioral/technologicalchanges to heat-balance
Adaptation toIndoor Climate
acclimatizationlong-term physiological
adaptation to climate
Figure 1.1: The three components of adaptation to indoor climate
1.3. A conceptual model of adaptation -- feedback loops
An important premise of the adaptive model is that the building occupant is no longer
simply a passive recipient of the thermal environment as given, as in the case of a
climate chamber experimental subject, but instead is an active agent interacting with all
levels of the person-environment system via feedback loops. We continue to
emphasize, however, our opinion that this perspective complements rather than
contradicts the “static” heat-balance view as outlined above. The heat-balance model
does partially account for adaptation by using as inputs those parameters affected by
adjustment and environmental interventions, but it explicitly rules out any notions of
physiological and psychological adaptation.
In contrast, the adaptive model draws upon a phenomenological perspective that
emphasizes how people interact with and change their environment, and accounts for
the ways in which a person’s past experience, future plans, and intentions influence
one’s perception (Canter 1983, Wohlwill 1974, Helson 1964, Veitch and Arkkelin 1995,
Kaplan and Kaplan 1982). The adaptive hypothesis indicates that one’s satisfaction
with an indoor climate is achieved by a correct matching between the actual thermal

ASHRAE RP-884 Final Report
Introduction & Background page MRL Australia 7
environmental conditions prevailing at that point in time and space, and one’s thermal
expectations of what the indoor climate should be like. Thermal expectations result from
a confluence of current and past thermal experiences, cultural and technical practices
(Auliciems 1981, 1989, de Dear 1993, Nicol 1993). These relationships have been
described in Figure 1.2, a schematic diagram developed by Auliciems (1981, 1989)
showing that a given set of indoor climatic conditions can elicit varying levels of comfort
and satisfaction from building occupants, depending on culture or climatic and
HVAC/architectural expectations.
Figure 1.2: The "adaptive model" of thermal perception (after Auliciems, 1981)
By logical extension, the adaptive hypothesis also implies that the temperatures people
expect indoors for comfort and satisfaction will move in the direction of the average
conditions encountered in their day-to-day life, both indoors and out. So, in the systems
schematic in Figure 1.2, outdoor climate acts as a negative feedback which attracts the
thermal perceptual sub-system’s set point, thereby damping load error
ASHRAE RP-884 Final Report
Introduction & Background page MRL Australia 8
(dissatisfaction/discomfort) within the human behavioral thermoregulatory system. The
net result is that adapted building occupants may be perfectly comfortable at
temperatures beyond those recommended in standards such as ASHRAE 55 (1992)
and ISO 7730 (1984, 1994).
We believe that the development of an adaptive predictive model of thermal comfort
should combine features of both the static and adaptive theories, and that these various
feedback loops should be described in terms of how they affect the more traditional
linear relationships. As set out in the heat balance models
(physics ⇒ physiology ⇒ subjective discomfort)
1.3.1. Behavioral feedback - adjustment
Behavioral adjustment of the body’s heat-balance probably offers the greatest
opportunity for people to play an active role in maintaining their own comfort. The extent
to which building occupants can, or do, behaviorally interact with their indoor climate
depends a great deal on contextual factors. This is very important in both the
development and application of an adaptive model, and deserves further elaboration.
Context can be described in terms of adaptive opportunity, compared to the constraints
or restrictions on thermoregulatory degrees of freedom (Nicol and Humphreys 1972).
That is, “adaptive opportunity” refers to whether or not buildings afford their occupants
scope for adaptive interventions (Baker and Standeven 1994). This may result from:
a) an attribute of the building itself (e.g. are windows operable? how far are
occupants placed away from such windows? is the floor plan individual office
cells or open-plan bureau landschaft?),
b) characteristics of the active, or energy consuming, climate services inside
the structure (e.g. centralized HVAC services, or decentralized task
conditioning controls at each workstation?), or
c) the organizational and social conditions prevailing within the building (e.g. is
there a strict or casual dress code? are employees bound to a single
workstation for the entire working day?).
ASHRAE RP-884 Final Report
Introduction & Background page MRL Australia 9
The flip-side of adaptive opportunity (i.e, the lack of...), is the analysis of constraints to
thermal control. These constraints may be gathered under five main headings (Nicol
and Humphreys 1972, Humphreys 1994a):
a) Constraints due to climate. Buildings in harsh or extreme climates might
present a more exclusive barrier to the elements than buildings in milder
climate, affording their occupants fewer adaptive opportunities.
b) Economic constraints. The costs of thermal environmental control, both
initial and recurrent, often exceed the resources of many countries.
c) Constraints due to social custom or regulation. To what extent can an
individual change his/her clothing? Are clothing patterns determined by
climate, fashion or religion? To what extent do the various requirements put
on us by other people, government energy guidelines, greenhouse gas
emission quotas or targets limit our freedom to behaviorally thermoregulate?
d) Constraints due to task or occupation. Often the requirements of a particular
job override those of thermal comfort, when there are formal dress codes of
fixed work locations.
e) Constraints due to design. This refers to design of the building or HVAC
system, availability of task-conditioning or personal environmental controls,
design quality of awnings, climatic suitability of window placement and size.
The concept of adaptive opportunity helps to differentiate those buildings in which a
deterministic relationship between the thermal environment and human response is
applicable, and those in which an adaptive feedback loop is fully operational. Adaptive
opportunity can be thought of as a continuum. At one extreme is the climate chamber in
which subjects are instructed what to wear and what activities they are to perform while
an external agent, the researcher, determines the temperature, humidity and air flow
regime they are to experience for the duration of the experiment. At the other extreme
we find the single-occupant room in which clothing and activity patterns are discretionary
ASHRAE RP-884 Final Report
Introduction & Background page MRL Australia 10
and environmental controls cover the full range of possibilities from operable windows
through to task-ambient air conditioning.
The ultimate efficacy of any form of adaptive control must be measured in terms of
occupant satisfaction and ideally should be evaluated in terms of available control
(adaptive opportunity) vs. exercised control (actual physical control that takes place) vs.
perceived control (Paciuk 1989, 1990). But regardless of whether it is placebo or real
control, there seems little dispute in the literature that the issue of personal and
environmental control is central to thermal acceptability, and therefore should be a factor
examined in the RP-884 data analysis.
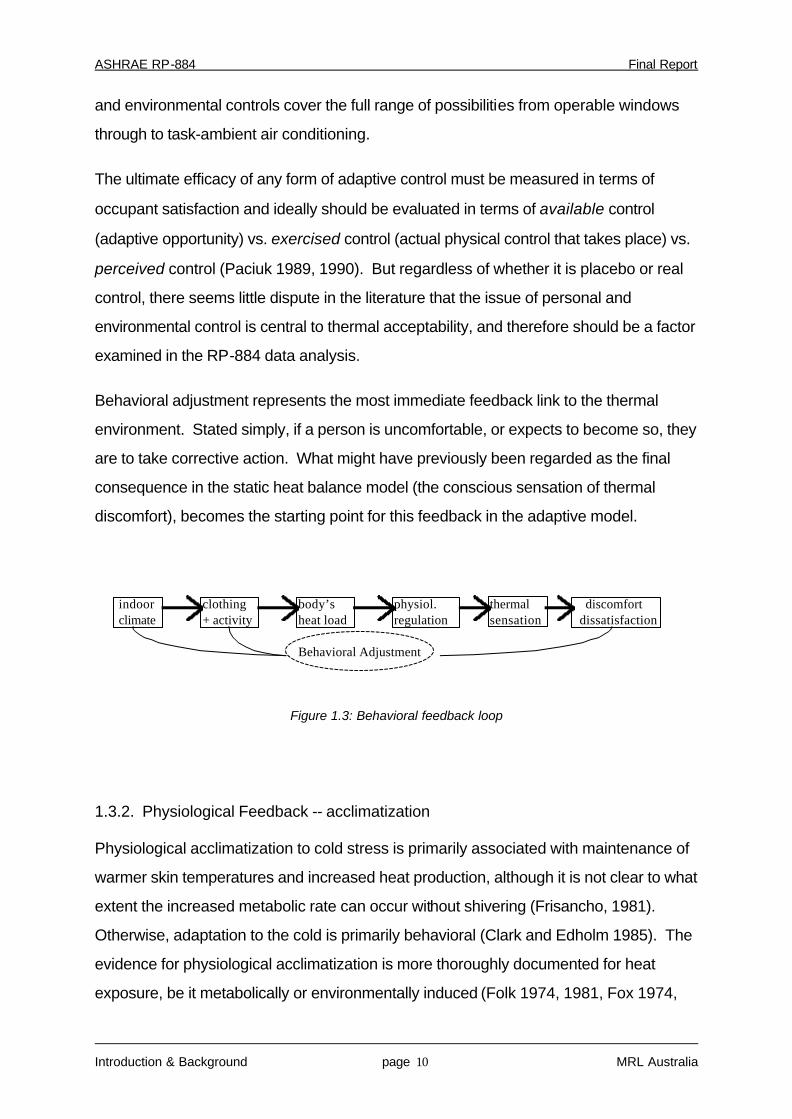
Behavioral adjustment represents the most immediate feedback link to the thermal
environment. Stated simply, if a person is uncomfortable, or expects to become so, they
are to take corrective action. What might have previously been regarded as the final
consequence in the static heat balance model (the conscious sensation of thermal
discomfort), becomes the starting point for this feedback in the adaptive model.
indoor clothing body’s physiol. thermal discomfort climate + activity heat load regulation sensation dissatisfaction Behavioral Adjustment
Figure 1.3: Behavioral feedback loop
1.3.2. Physiological Feedback -- acclimatization
Physiological acclimatization to cold stress is primarily associated with maintenance of
warmer skin temperatures and increased heat production, although it is not clear to what
extent the increased metabolic rate can occur without shivering (Frisancho, 1981).
Otherwise, adaptation to the cold is primarily behavioral (Clark and Edholm 1985). The
evidence for physiological acclimatization is more thoroughly documented for heat
exposure, be it metabolically or environmentally induced (Folk 1974, 1981, Fox 1974,
ASHRAE RP-884 Final Report
Introduction & Background page MRL Australia 11
Bruce 1960, Berglund and McNall 1973, Givoni and Goldman 1973). The primary
physiological response to prolonged heat stress induced by a regime of work in heat is
an increased sweating capacity for a given heat load. Other changes related to
thermoregulatory sweating include a fall in the setpoint body temperature at which
sweating begins, triggering the onset of sweating earlier. A heat acclimatized person
also achieves a better distribution of sweat over their skin compared to an
unacclimatized person under the same heat load. Faced with comparable levels of heat
challenge, the heat acclimatized person also demonstrates a variety of cardiovascular
responses such as reduced heart rate, an increased blood volume and peripheral blood
flow (Fox 1974, Bean and Eichna 1943, Hardy 1961, Wyndham 1970). Acclimatization
to heat takes place mainly in the first week of exposure, while a longer period is required
for cold acclimatization or for resting or sedentary activity (Bruce 1960).
This picture of acclimatization can be regarded as most appropriate to hot-dry climate
zones. The pattern in hot-humid climates, however, differs significantly (Gonzalez et al
1974, Goldman et al 1965). In particular, the elevated capacity for sweating observed in
hot-dry situations seems to be less important in the humid condition due to the reduced
evaporative potential of the environment. Thus, while sweat secretion in the humid
acclimatized subject is initiated at a core temperature lower than that for the
unacclimatized subject, the shortfall in body heat dissipation in the humid condition
appears to be taken up by increased dry heat losses from the skin which result from an
increased peripheral blood flow and skin temperature.
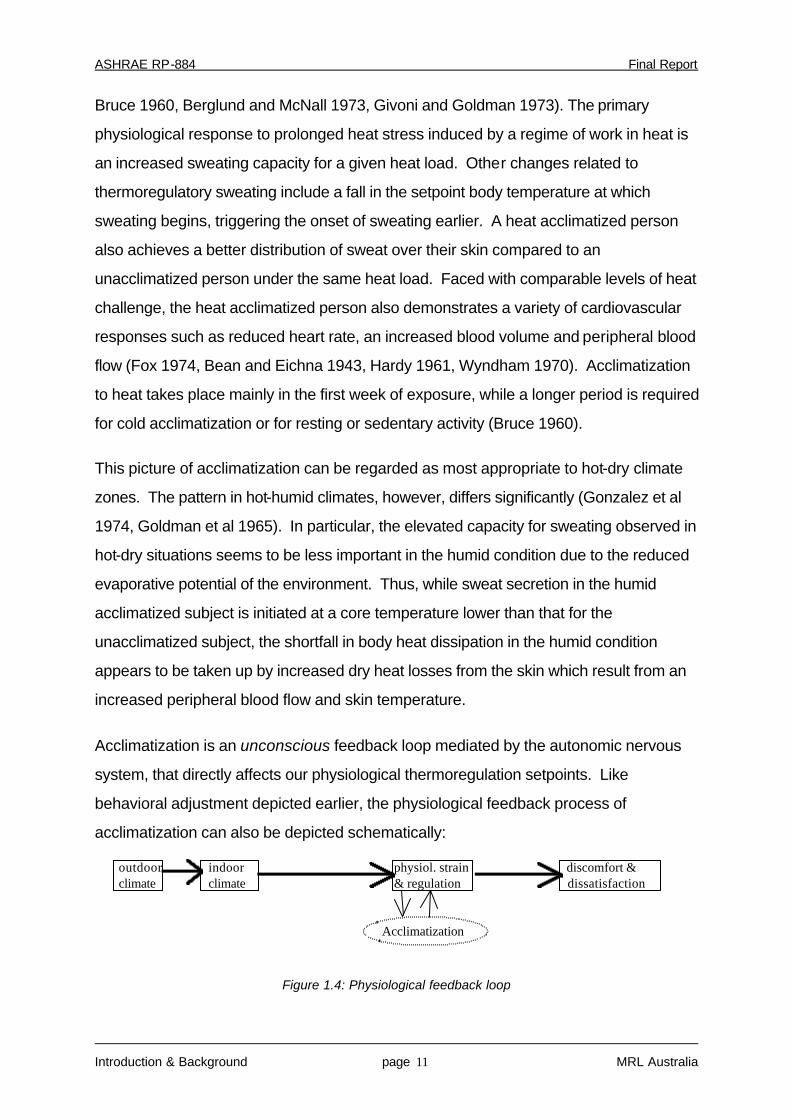
Acclimatization is an unconscious feedback loop mediated by the autonomic nervous
system, that directly affects our physiological thermoregulation setpoints. Like
behavioral adjustment depicted earlier, the physiological feedback process of
acclimatization can also be depicted schematically:
outdoor indoor physiol. strain discomfort & climate climate & regulation dissatisfaction Acclimatization
Figure 1.4: Physiological feedback loop
ASHRAE RP-884 Final Report
Introduction & Background page MRL Australia 12
1.3.3 Psychological feedback -- habituation and expectation
Psychological adaptation encompasses the effects of cognitive and cultural variables,
and describes the extent to which habituation and expectation alter thermal perceptions.
This concept has been most clearly elaborated under the banner “adaptation-level
theory” (A-LT). A-LT introduces the notion of optimal levels of stimulation, or adaptation
levels, along with a view of environmental stress resulting from excessive deviations
from such optimal levels. These optimal adaptation levels result from past exposure,
and act as benchmarks for environmental evaluations (Wohlwill 1974, Helson 1964).
Studies of the general nature of perception and its relationship to environmental stimuli,
memory and cognition, and contextual factors such as building type or season, can also
offer insights into understanding thermal comfort in buildings (de Dear et al 1991c,
Helson 1971, Ittelson 1973, Auliciems 1981, Russell and Ward 1982).
The role of expectation in thermal comfort research was acknowledged in the earlier
work of McIntyre (1980), who stated that “a person’s reaction to a temperature which is
less than perfect will depend very much on his expectations, personality, and what else
he is doing at the time.” Although the least studied of the three adaptive mechanisms,
psychological adaptation might actually play the most significant role in explaining the
differences between observed and predicted thermal responses. This applies
particularly in light of different environmental contexts such as the laboratory vs. home vs.
office, or when comparing responses in air-conditioned vs. naturally-ventilated buildings
(Fishman and Pimbert 1982, Heijs and Stringer 1988, Bush 1990, de Dear et al 1991c,
Rowe et al 1995, Oseland 1995,).
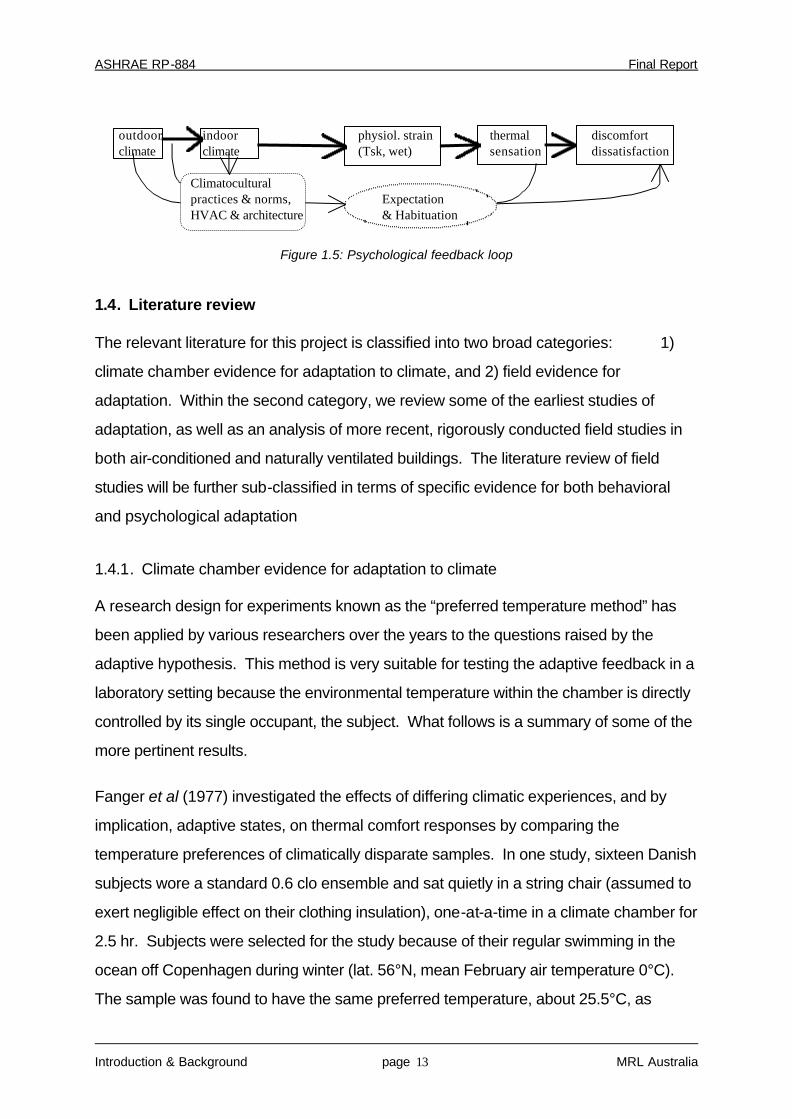
In terms of a feedback loop that can be incorporated into our conceptual model of
adaptation, expectation and habituation are influences by one’s current thermal
experience or one’s longer history of experiences with both the indoor and outdoor
climate. This in turn directly affects our thermal sensation and cognitive assessments of
thermal acceptability as described in Figure 1.5.
ASHRAE RP-884 Final Report
Introduction & Background page MRL Australia 13
outdoor indoor physiol. strain thermal discomfort climate climate (Tsk, wet) sensation dissatisfaction Climatocultural practices & norms, Expectation HVAC & architecture & Habituation
Figure 1.5: Psychological feedback loop
1.4. Literature review
The relevant literature for this project is classified into two broad categories: 1)
climate chamber evidence for adaptation to climate, and 2) field evidence for
adaptation. Within the second category, we review some of the earliest studies of
adaptation, as well as an analysis of more recent, rigorously conducted field studies in
both air-conditioned and naturally ventilated buildings. The literature review of field
studies will be further sub-classified in terms of specific evidence for both behavioral
and psychological adaptation
1.4.1. Climate chamber evidence for adaptation to climate
A research design for experiments known as the “preferred temperature method” has
been applied by various researchers over the years to the questions raised by the
adaptive hypothesis. This method is very suitable for testing the adaptive feedback in a
laboratory setting because the environmental temperature within the chamber is directly
controlled by its single occupant, the subject. What follows is a summary of some of the
more pertinent results.
Fanger et al (1977) investigated the effects of differing climatic experiences, and by
implication, adaptive states, on thermal comfort responses by comparing the
temperature preferences of climatically disparate samples. In one study, sixteen Danish
subjects wore a standard 0.6 clo ensemble and sat quietly in a string chair (assumed to
exert negligible effect on their clothing insulation), one-at-a-time in a climate chamber for
2.5 hr. Subjects were selected for the study because of their regular swimming in the
ocean off Copenhagen during winter (lat. 56°N, mean February air temperature 0°C).
The sample was found to have the same preferred temperature, about 25.5°C, as

ASHRAE RP-884 Final Report
Introduction & Background page MRL Australia 14
regular Danish college students (not winter swimmers) under the same experimental
conditions (Fanger and Langkilde 1975). Another Danish sample with cold exposures
consisted of 16 meat-packers from a refrigerated storeroom (Fanger et al 1977). They
too had the same preferred temperatures as the winter swimmers and college students.
If cold exposure fails to influence temperature preference, the next question is whether or
not heat exposure has an effect. As noted earlier, physiologists have a clearer picture of
heat, as opposed to cold, acclimatization, and much of that work refers specifically to
heat stress conditions of the type induced by a regime of work in heat. Very little
research has been done into the effects of acclimatization on thermal discomfort in the
moderate heat stress range. In one such study, Fanger (1972a) recruited a sample of
16 long-term inhabitants of the tropics shortly after their arrival in Copenhagen. The
same procedure as described above was followed, and the result, again, was that
temperature preferences were not significantly different.
Acknowledging the limited “shelf-life” of physiological heat acclimatization, de Dear et al
(1991b) replicated Fanger’s tropical experiment on location in Singapore (lat. 1°N)
using a sample of 32 college students. Attention to detail in the replication went as far
as borrowing the standard 0.6 clo KSU uniforms from Fanger's Danish laboratory, and a
chair similar to the Danish string chair was also used. Again, temperature preferences
turned out not to be significantly different from those of Fanger's benchmark Danish
subjects ~ circa 25.5°C (de Dear et al 1991b).
Gonzalez (1979) studied the role of natural heat acclimatization (humid) during a five day
heat wave in New Haven Connecticut during which day-time temperature maxima
ranged between 32°C to 37°C and 88% to 90% rh. Twenty young male subjects
participated. For lightly exercising subjects (116 W m-2), there was a discernible
increase in preferred temperature (as assessed by a rating scale) after the heat wave
(Gonzalez 1979). However, there were no statistically significant differences in thermal
comfort or acceptability responses of resting subjects between the before-and-after
heat wave tests.
The only significant departure from this picture of overall consistency in chamber
research results has been a recent, but as yet unpublished, PhD thesis from the
ASHRAE RP-884 Final Report
Introduction & Background page MRL Australia 15
University of London (Abdulshukor, 1993). Three results from that study have been cited
by Humphreys (1994a):
• Chinese subjects in a Malaysian climate chamber preferred a temperature of
28.0°C,
• Malay subjects in a Malaysian climate chamber preferred an even warmer
temperature at 28.7°C, while
• Malay subjects in a London climate chamber study preferred only 25.7°C.
A clear implication of these results is that the hot and humid climatic context of the Malay
peninsular was responsible for a three degree elevation of temperature preferences.
These Malaysian climate chamber results are perplexing insofar as the same ethnic
groups (Chinese and Malays) with exactly the same thermal histories and experiences
(Singapore lies at the tip of the Malay peninsula) were represented in the de Dear et al.
(1991b) chamber study. Using exactly the same clothing, metabolic rate and
experimental protocol as used in Fanger’s Danish studies, the temperature preferences
in Singapore’s climate chamber were three degrees cooler than these unpublished
Malaysian results.
In conclusion, on the basis of the majority of experimental evidence published to date,
subjective discomfort and thermal acceptability under conditions most typically
encountered in residences and office buildings, by resting or lightly active building
occupants, appear to be unaffected by the physiological processes of acclimatization.
1.4.2. Field evidence for adaptation
While chamber studies have the advantage of testing under carefully controlled
conditions, field studies are best used for assessing the potential impacts of behavioral
or psychological adaptations as they occur in realistic settings. If people feel thermally
comfortable in conditions that fall outside of the ASHRAE comfort zone, it seems likely
that adaptation has played a role. While the majority of published field studies collected
the necessary data to determine whether people are comfortable when conditions are in
or out of the comfort zone, only a subset of the data contains sufficient detail to
disentangle the causal mechanisms behind those responses. In other words, exactly
what kind of adaptation was taking place?

ASHRAE RP-884 Final Report
Introduction & Background page MRL Australia 16
1.4.2.1. The earlier field evidence for adaptation
Subjective assessments of thermal comfort typically use the rating scale method
(McIntyre 1978), where comfort is operationalized as a vote coinciding with the central
category of a thermal sensation, or comfort scale (“neutral”, or “comfortable”). The
ambient temperature found by statistical analysis to most frequently coincide with this
central rating is referred to as the sample's "neutrality" and is denoted here as Tn. The
typical cross-sectional field study consists of a questionnaire with rating scales
administered to building occupants while simultaneously recording indoor climatic
variables. The most important of which is air temperature. The simplest of these
studies are based on single-point measurements of temperature, and possible humidity.
Numerous such studies have been published over the years, and Humphreys' (1975)
review of 36 examples from various countries around the world uncovered a strong
statistical dependence of thermal neutralities (Tn) on the mean levels of air or globe
temperature (Ti) recorded within the buildings:
Tn = 2.56 + 0.83 Ti (r=+0.96) eq.1.1
It was noted that building occupants were able to find comfort, assumed to be a vote on
the central category of rating scales, in indoor temperatures spanning more than 13 K.
Humphreys (1975) attributed this to the adaptive processes, concluding that "... the
range of recent experience is better regarded as one of the factors which will contribute
to the acceptability of the environment to which the respondent is exposed."
Reasoning that indoor temperatures are dependent on outdoor temperatures to varying
extents, Auliciems suggested that there might be a statistical relationship between
indoor thermal neutralities and outdoor climate as well (Auliciems 1969).
Parameterizing “outdoor climate” as mean monthly temperature (i.e. average of the
average daily minima and average daily maximum for the month in question),
Humphreys (1978) followed up Auliciems’ suggestion and found convincing evidence for
adaptation to outdoor climate, as depicted in Figure 1.6. The influence of external
climate on indoor neutralities is particularly evident in the results from the so called "free
running" buildings which had neither centralized heating nor cooling plant (naturally

ASHRAE RP-884 Final Report
Introduction & Background page MRL Australia 17
ventilated). In such buildings, the following linear regression model accounted for 94%
of the variance in neutralities:
Tn = 11.9 + 0.534 Tm (r=+0.97) eq.1.2
Climate controlled (centralized HVAC) buildings, on the other hand, had a less
pronounced but still highly significant correlation with outdoor mean monthly temperature
(Tm), but with a curve rather than a straight line achieving the best fit:
Tn = 23.9+.295(Tm-22) * exp(-((Tm-22)/(24*√2))2) (r=+0.72) eq.1.3
Auliciems (1981) subsequently revised Humphreys’ regression database by deleting
incompatible field studies, such as those based on asymmetric rating scales or children
as subjects, and adding more recent studies that had been published after Humphreys’
(1976) paper. These revisions brought the database up to 53 separate field studies
from various climatic zones in Australia, Asia, the Americas and Europe. After
collapsing free running and climate controlled buildings together, the resulting equation
was:
Tn = 0.48 Ti + 0.14 Tm + 9.22 (r=0.95) eq.1.4
where r is the multiple correlation coefficient. Even though the regression coefficients
may be unstable in such a model due to intercorrelation between the two independent
variables, equation 1.4 represents a widely cited statistical expression for the adaptive
hypothesis of human thermal perception.
While the statistical association between neutralities and prevailing outdoor climate
appears quite strong and convincing in Figure 1.6, the actual causal mechanism is left
in doubt by such “black box” adaptive models. Apart from thermal habituation and
acclimatization, there are several other plausible hypotheses, including the possibility
that some unmeasured variables in the human body's heat balance were compensating
for environmental temperature. For example, adjustments such as reduced clothing,
metabolic and humidity levels may combine with higher air velocities in the warm climate
studies (to the right-hand side of Figure 1.6) to cause subjects to experience thermal
neutrality at considerably higher indoor temperatures than would otherwise have been

ASHRAE RP-884 Final Report
Introduction & Background page MRL Australia 18
the case. Therefore, to more rigorously test the physiological and psychological bases
of the adaptive hypothesis, these behavioral alternatives need to be eliminated, or at
least accounted for. More recent field studies and experiments have done just that, by
collecting simultaneous measurements of all of the input variables to Fanger’s PMV
model (ISO, 1994). Such studies allow a closer look at the causal mechanisms driving
thermal adaptation indoors.
FIGURE 1.6: The statistical dependence of indoor thermal neutralities on climate
(after Humphreys, 1976)
1.4.2.2. Analysis of neutral temperatures using recent field experiments
de Dear’s Ph.D. thesis, entitled “Perceptual and Adaptational Bases for the
Management of Indoor Climate - A Study of Warm Climates” (1985) and subsequent
ASHRAE Transactions paper (de Dear and Auliciems, 1985) reported on six thermal
comfort experiments in office buildings scattered across various Australian climatic
zones, ranging from equatorial (Darwin) through sub-tropical (Brisbane) to mid-latitude
14
16
18
20
22
24
26
28
30
32
-6 -1 4 9 14 19 24 29 34mean monthly outdoor temperature (C)
ind
oo
r n
eutr
ality
(C
)
climate controlled buildings
free running buildings
ASHRAE RP-884 Final Report
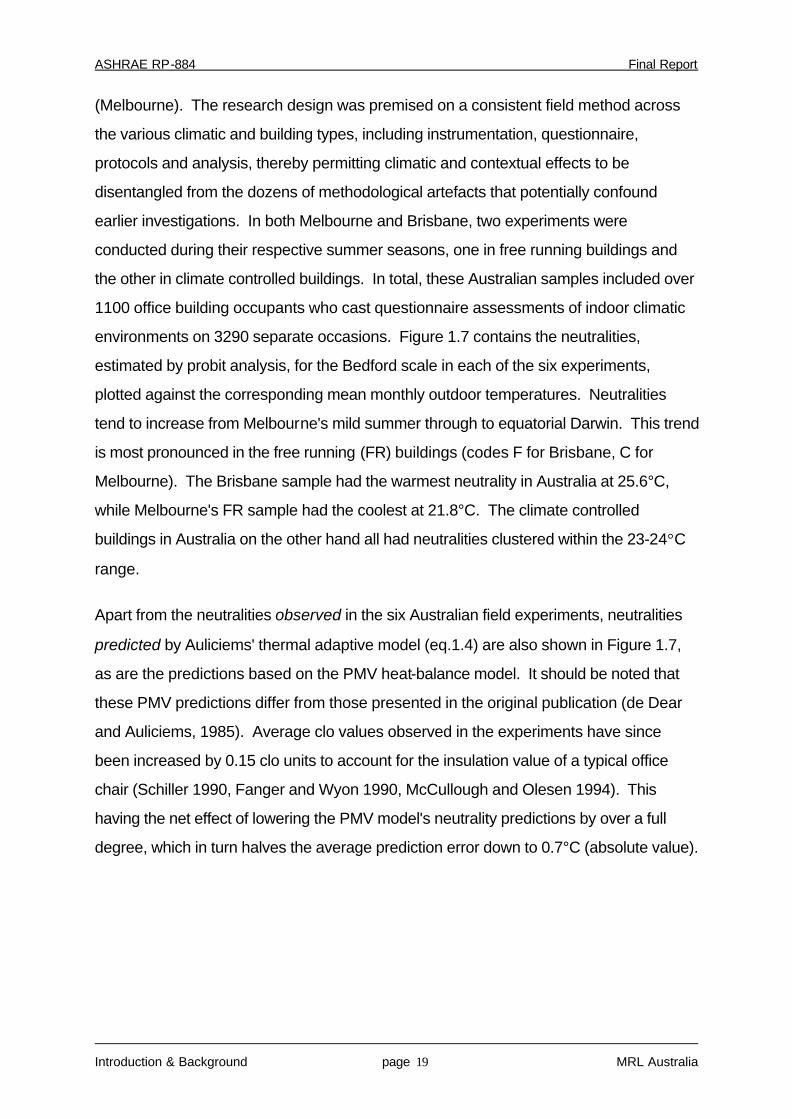
Introduction & Background page MRL Australia 19
(Melbourne). The research design was premised on a consistent field method across
the various climatic and building types, including instrumentation, questionnaire,
protocols and analysis, thereby permitting climatic and contextual effects to be
disentangled from the dozens of methodological artefacts that potentially confound
earlier investigations. In both Melbourne and Brisbane, two experiments were
conducted during their respective summer seasons, one in free running buildings and
the other in climate controlled buildings. In total, these Australian samples included over
1100 office building occupants who cast questionnaire assessments of indoor climatic
environments on 3290 separate occasions. Figure 1.7 contains the neutralities,
estimated by probit analysis, for the Bedford scale in each of the six experiments,
plotted against the corresponding mean monthly outdoor temperatures. Neutralities
tend to increase from Melbourne's mild summer through to equatorial Darwin. This trend
is most pronounced in the free running (FR) buildings (codes F for Brisbane, C for
Melbourne). The Brisbane sample had the warmest neutrality in Australia at 25.6°C,
while Melbourne's FR sample had the coolest at 21.8°C. The climate controlled
buildings in Australia on the other hand all had neutralities clustered within the 23-24°C
range.
Apart from the neutralities observed in the six Australian field experiments, neutralities
predicted by Auliciems' thermal adaptive model (eq.1.4) are also shown in Figure 1.7,
as are the predictions based on the PMV heat-balance model. It should be noted that
these PMV predictions differ from those presented in the original publication (de Dear
and Auliciems, 1985). Average clo values observed in the experiments have since
been increased by 0.15 clo units to account for the insulation value of a typical office
chair (Schiller 1990, Fanger and Wyon 1990, McCullough and Olesen 1994). This
having the net effect of lowering the PMV model's neutrality predictions by over a full
degree, which in turn halves the average prediction error down to 0.7°C (absolute value).
ASHRAE RP-884 Final Report
Introduction & Background page MRL Australia 20
18
20
22
24
26
28
30
-8 -6 -4 -2 0 2 4 6 8 10 12 14 16 18 20 22 24 26 28 30 32
mean outdoor temperature (oC)
ind
oo
r n
eutr
ality
(oC
)
Observedneutrality
Adaptivemodel
Static PMVmodelP
A O
B
M
C
DE
F
G N
H
I
J
K LClimate-controlled
Free-running
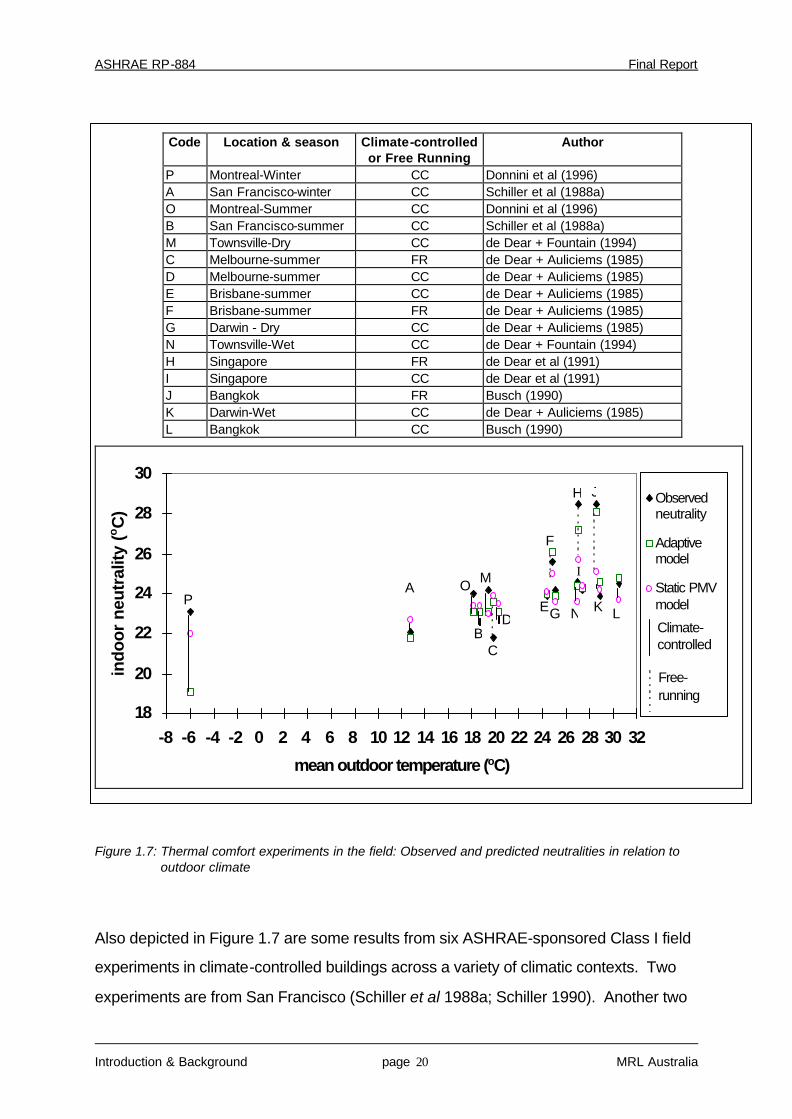
Figure 1.7: Thermal comfort experiments in the field: Observed and predicted neutralities in relation to outdoor climate
Also depicted in Figure 1.7 are some results from six ASHRAE-sponsored Class I field
experiments in climate-controlled buildings across a variety of climatic contexts. Two
experiments are from San Francisco (Schiller et al 1988a; Schiller 1990). Another two
Code Location & season Climate-controlled or Free Running
Author
P Montreal-Winter CC Donnini et al (1996) A San Francisco-winter CC Schiller et al (1988a) O Montreal-Summer CC Donnini et al (1996) B San Francisco-summer CC Schiller et al (1988a) M Townsville-Dry CC de Dear + Fountain (1994) C Melbourne-summer FR de Dear + Auliciems (1985) D Melbourne-summer CC de Dear + Auliciems (1985) E Brisbane-summer CC de Dear + Auliciems (1985) F Brisbane-summer FR de Dear + Auliciems (1985) G Darwin - Dry CC de Dear + Auliciems (1985) N Townsville-Wet CC de Dear + Fountain (1994) H Singapore FR de Dear et al (1991) I Singapore CC de Dear et al (1991) J Bangkok FR Busch (1990) K Darwin-Wet CC de Dear + Auliciems (1985) L Bangkok CC Busch (1990)

ASHRAE RP-884 Final Report
Introduction & Background page MRL Australia 21
are from tropical Townsville (de Dear and Fountain 1994), and another pair from
Montreal (Donnini et al, 1996).
Plotted along with the San Francisco observed neutralities are some predictions from
Auliciems' (1983) adaptive model as well as Fanger's PMV (heat balance) model, after
the effect of chair insulation (0.15 clo) has been added to Schiller et al's published
clothing insulation estimates. Clearly in both seasons, the adaptive model comes very
close to observation, but so too does the static heat balance model. This general
pattern of consistency between neutralities observed in air-conditioned buildings and
PMV predictions also extends to the more recent ASHRAE-sponsored studies in office
buildings located in a hot-humid climate (de Dear and Fountain 1994) and cold climate
(Donnini et al, 1996).
Busch's (1990) field experiments in office buildings in tropical Bangkok have also been
included in Figure 1.7. Both climate controlled (air-conditioned) and free running
buildings were studied, so a diverse range of thermal environments was covered by the
sample size of 1146. For the climate controlled buildings, neutrality was established at
24.5°C (code L in Figure 1.7), within a degree of the PMV prediction based on Busch's
mean clo value of 0.56 plus some chair insulation (0.15 clo). In Bangkok's free running
buildings, Busch observed a neutrality of 28.5°C (code J in Figure 1.7), which appears
to be over three degrees (K) warmer than predicted by Fanger's PMV. Auliciems'
(1983) adaptive model, on the other hand, came within half a degree of the observed
result. Busch suggested that the lighter clothing and higher local wind explain most of
the disparity between observed thermal neutralities in the naturally ventilated and air-
conditioned buildings, implying that behavioral adjustments were playing a strong
adaptive role. But there are clearly other factors at play, as well. Noting that clothing
and air velocity are used as input parameters to the heat balance models, the fact that
PMV still underestimates neutrality suggests that occupants were influenced by other
modes of adaptation unaccounted for by the heat balance inputs. In particular, PMV’s
underestimation of thermal neutrality more significantly in the free running building
sample than in the climate controlled building sample suggests that context and
adaptive opportunity can influence expectations and thermal response to the indoor
environment.
ASHRAE RP-884 Final Report
Introduction & Background page MRL Australia 22
Another example of this is found in a more recent field experiment, in which de Dear et
al (1991c) examined climate controlled office buildings and free running residential
apartment blocks in equatorial Singapore. As seen in Figure 1.7 (code I), the observed
neutrality of 24.2°C in the air conditioned buildings was accurately predicted by both the
adaptive and heat balance models after 0.15 clo chair insulation was added to clothing
estimates. But as with Busch's Bangkok experiment, the 28.5°C neutrality observed in
Singapore's naturally ventilated apartment buildings (code H) was most closely
approximated by the adaptive model with a prediction of 27.2°C.
1.4.2.3. Evidence for behavioral adaptation - personal/environmental adjustment
There have been a few studies that examined direct evidence of exercised control, or
adjustment. One of the earlier studies that looked closely at clothing patterns was by
Fishman and Pimbert (1982), who studied 26 subjects in a UK office building for an
entire year. The estimated clo values of the Watson House sample had a strong linear
dependence on outdoor weather and season, especially in the case of women subjects,
with a regression gradient of -0.02 clo units per degree of outdoor mean weekly
temperature. This supports the hypothesis that the statistical dependence of indoor
neutrality on outdoor climate may, in part, be due to behavioral adjustments that directly
affect the heat balance, rather than acclimatization or habituation.
This hypothesis is also supported by the work of Humphreys (1994b) and Nicol et al
(1994), in which a study of naturally ventilated buildings in North West Pakistan
concluded that the office workers were comfortable across a wide range of seasonal
temperatures (neutralities varying between 15.7°C in winter, and 26.4°C in summer).
They also concluded that 1~B of the seasonal changes in comfort temperature could
be attributed to the flexibility in the traditional Pakistani clothing worn.
Personal behavioral adjustments over time were looked at in an exploratory study by
Nicol and Raja (1996) in the UK. They found that clothing changes were more strongly
dependent on the succession of outdoor temperatures that occurred prior to the
measurement, compared to the instantaneous or daily mean outdoor temperature, or the
instantaneous indoor temperature. This suggests the importance of time-series
measurements in future field studies designed to evaluate the effect of behavioral

ASHRAE RP-884 Final Report
Introduction & Background page MRL Australia 23
adaptation on thermal comfort. Posture is another example of behavioral adaptation,
and they found a correlation with temperature such that posture would change to
increase the effective body surface area available for dry and latent heat exchange as it
got warmer.
In addition to adjusting to the environment, one can directly manipulate the environment
itself. Baker and Standeven (1994) used hourly questionnaires to ask whether subjects
had made adjustments to their clothing or to furniture, doors, windows, shades, fans or
any other part of the building to improve their comfort. Results indicated extensive
occupant-environment interaction - for 23 subjects in 7 buildings, over a total of 864
hours - there were a total of 273 adjustments to controls or other environmental aspects
of the room, and 62 adjustments to clothing.
The extent to which adjustments actually improve thermal comfort is as important as the
frequency with which they’re made. Benton and Brager (1994) conducted a field
experiment of thermal comfort in a centrally-conditioned office building in California,
before and after energy-efficiency retrofit measures were installed. Adaptive opportunity
was addressed by a series of questions on the availability, use, and effectiveness of
coping mechanisms that either altered the physical environment or personal variables.
While modification mechanisms were infrequently cited, when exercised, they
consistently received high ratings for effectiveness. Behavioral mechanisms received
the highest number of citations, and clothing adjustments in particular were given a
relatively high effectiveness rating.
1.4.2.4. Evidence for psychological adaptation - expectation and context
While there is limited field data providing direct evidence for the effects of psychological
adaptation on thermal comfort, the previous analysis of Figure 1.7 suggests that it can
be implied through comparing comfort responses in different contexts. Paciuk (1990)
provided a more direct analysis of the distinction between available control (adaptive
opportunity), exercised control (behavioral adjustment) and perceived control (related to
the psychological dimension and expectation). She found that, in addition to the
traditional list of thermal inputs to the heat balance models, perceived degree of control
was one of the strongest predictors of thermal comfort in office buildings, and had a
ASHRAE RP-884 Final Report
Introduction & Background page MRL Australia 24
significant impact in shaping both thermal comfort and satisfaction. This finding was
also supported by the work of Williams (1995), in her study in office buildings in the
Northwest of England. The subjects in this study expressed higher levels of satisfaction
when they perceived themselves to have more control over their environment.
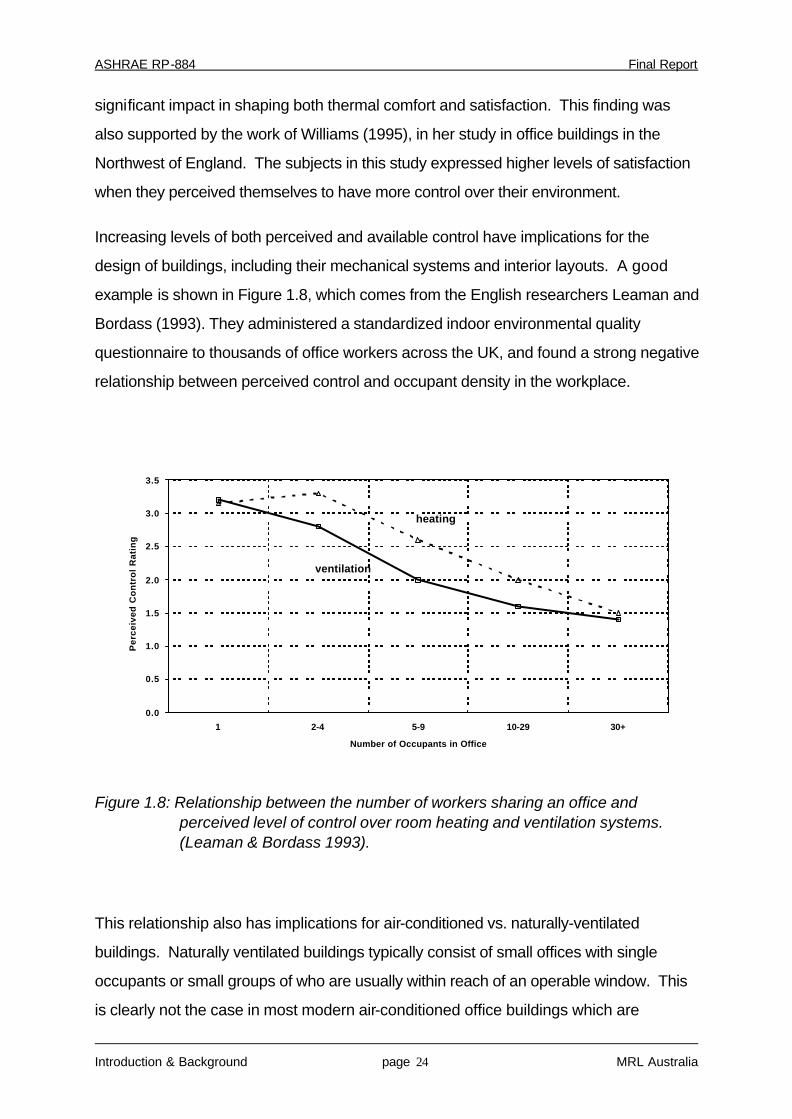
Increasing levels of both perceived and available control have implications for the
design of buildings, including their mechanical systems and interior layouts. A good
example is shown in Figure 1.8, which comes from the English researchers Leaman and
Bordass (1993). They administered a standardized indoor environmental quality
questionnaire to thousands of office workers across the UK, and found a strong negative
relationship between perceived control and occupant density in the workplace.
0.0
0.5
1.0
1.5
2.0
2.5
3.0
3.5
1 2-4 5-9 10-29 30+
Number of Occupants in Office
Per
ceiv
ed C
on
tro
l R
atin
g
ventilation
heating
Figure 1.8: Relationship between the number of workers sharing an office and perceived level of control over room heating and ventilation systems. (Leaman & Bordass 1993).
This relationship also has implications for air-conditioned vs. naturally-ventilated
buildings. Naturally ventilated buildings typically consist of small offices with single
occupants or small groups of who are usually within reach of an operable window. This
is clearly not the case in most modern air-conditioned office buildings which are

ASHRAE RP-884 Final Report
Introduction & Background page MRL Australia 25
characterized by deep-space or open-plan floor layouts with dozens if not hundreds of
employees being required to share the same space. The effects of this may be evident
in Figure 1.7, where the naturally ventilated buildings had thermal neutralities
significantly different from the predictions of heat-balance (static) models such as PMV.
These same buildings probably had occupants who perceived a higher degree of
personal environmental control by comparison to their counterparts in centrally air-
conditioned office buildings. The poor predictive capabilities of PMV in naturally
ventilated buildings suggests that adaptive processes other than behavioral adjustment
(which would be accounted for in the heat balance models) must be occurring.
Expectation seems the most likely explanation, since expectation has all but been
eliminated by the climate-chamber method of comfort research. Within the adaptive
hypothesis, such buildings would be expected by their occupants to provide variable
indoor temperatures, and therefore be judged less critically than centrally air-conditioned
buildings. The RP-884 data analysis will pay careful attention to the distinction between
thermal perception in air-conditioned vs. naturally ventilated buildings.
Although naturally ventilated buildings might generally offer a higher level of adaptive
opportunity than air-conditioned buildings, they could still differ in the actual degree of
occupant control they offer. Rowe (1995a) looked at studies in 1) air conditioned
buildings, 2) naturally ventilated buildings, and 3) naturally ventilated buildings with
supplementary on-demand cooling and heating equipment. He found a significantly
higher level of satisfaction in the naturally ventilated buildings with additional
supplementary control. This led to the conclusion that people have a wider tolerance of
variations in indoor thermal conditions if they can exert some control over them, and that
a considerably higher level of satisfaction will be reached if occupants have means of
controlling the upper and lower temperature limits. In Fishman and Pimberts’ (1982)
year-long study in a UK office building, seven of the 26 subjects worked in air-
conditioned areas. The rest were in naturally ventilated offices. While the sample size
was not large, there was still a difference in the thermal responses of these two groups
as temperatures rose above 24°C. People in the air-conditioned offices began voting
much higher on the thermal sensation scale than their colleagues in the naturally

ASHRAE RP-884 Final Report
Introduction & Background page MRL Australia 26
ventilated work areas, suggesting that they were less tolerant of higher temperatures
and expected homogeneity in their thermal environment.
Several other researchers support this hypothesis regarding occupant expectations and
their effects on thermal perception. In a study conducted by Black and Milroy (1966) in
both air-conditioned and non-air-conditioned office buildings in London, occupants in
the air-conditioned buildings expressed more complaints about temperature
fluctuations, even though the free running building experienced much greater variability.
The occupants were basing their evaluations on the benchmark of their own
preconceptions of what air-conditioning should achieve, rather than on what it actually
provided. In effect, this suggests that increasing levels of sophistication in
environmental control systems and building services are on a treadmill of attempting to
satisfy ever-increasing occupant expectations (de Dear and Auliciems 1986). Another
study by Rohles et al (1977) found that Michigan subjects were more tolerant of high
indoor summer temperatures (32°C ET*) than Texan subjects. Since other heat balance
variables such as clothing or activity could not account for the difference, it was
speculated that the Texans took summer air-conditioning for granted and came to
expect or even demand cool temperatures, therefore becoming more critical of warmer
indoor conditions than their northern counterparts.
1.5. Implications for RP-884
1.5.1. Lessons from static heat balance models
We believe that the split between “adaptive” and “static” heat balance models, or
schools of thought, is not as irreconcilable as the protagonists have suggested. As
mentioned previously, the terms "static” and “constancy" have given rise to a mistaken
idea that models such as PMV and 2-node, plus the thermal comfort standards based
on them, prescribe a single, constant temperature for thermal comfort the world over.
But the PMV and 2-node models do, in fact, predict comfort temperatures moving in the
direction of prevailing outdoor climate -- as seen in the offset of winter and summer
comfort zones in the last few revisions to ASHRAE’s Standard 55. So the static model
of comfort is in reality an “adaptive” model in its own right -- the fundamental distinction
between the static and adaptive models is their underlying basis or postulated cause for
ASHRAE RP-884 Final Report
Introduction & Background page MRL Australia 27
the shift in comfort temperatures. The former permits only behavioral adjustments
(personal/technological) to heat balance variables such as clothing or air velocity,
whereas the original adaptive models were premised on changing physiological (i.e.
acclimatization) and psychological (i.e. expectations/habituation) setpoints. While this
may seem to be a fine distinction, failure to appreciate it has, in the opinion of the
authors, been responsible for unnecessary controversy between the two sides of this
debate. An important contribution of the RP-884 adaptive model will be to go beyond
the “black-box” approaches of the earlier adaptive models, so that we can better
understanding the underlying processes of adaptive comfort.
Understanding the challenges of applying laboratory-based static models in the field can
provide guidance on issues to consider when developing a new adaptive model that
combines the best of both static and adaptive theories of thermal comfort. One place to
start is to learn from some of the explanations that have been offered for the
discrepancies between predicted and observed thermal sensations in real buildings:
1. Estimating insulation of clothing garments or ensembles. Brager et al. (1994) have
demonstrated the significance of the clothing insulation estimation method on the
actual clo value obtained. The ensemble insulation value differs by as much as 20%
depending on whether one uses the tables and algorithms in the older or newer
versions of ASHRAE Standard 55 (1981, 1992), or ISO 7730 (1994). It will therefore
be important that rigorous statistical correction factors are used to create consistent
ensemble clo values across the RP-884 database.
2. Accounting for the chair insulation. The tendency for PMV to overestimate thermal
neutralities has been reported in several field studies (Schiller 1990), prompting
Fanger and Wyon (1990) to suggest that the method of estimating clothing insulation
might be systematically flawed by omission of the thermal effect that chairs have on
their occupants. McCullough and Olesen (1994) responded by examining the effects
of upholstered office furniture on the total thermal insulation of a heated manikin, and
found that a typical office chair adds approximately 0.15 clo to the value that one gets
by simple addition of individual garment values, as described in ASHRAE Standard
55-92 (ASHRAE 1992) or ISO-7730 (ISO 1994). Even if the original researchers
ASHRAE RP-884 Final Report
Introduction & Background page MRL Australia 28
supplying raw data to the RP-884 database omitted the effect of chair insulation, it
will be included as part of the RP-884 analysis.
3. Non-uniformities of physical measurements. If field studies take spot-
measurements of general ambient thermal parameters that are separated from the
occupant’s location in space and/or time, then they might not be representative of
what the occupant is actually experiencing at all (Baker 1993). This becomes
particularly important in rooms with transient or spatially non-uniform thermal
conditions, which are more likely to be the case in passive, or naturally ventilated
buildings, or any situations where workers have high levels of personal or
environmental control available to them. An analysis of adaptive comfort would best
be served by using data taken close to the occupant’s location, and at the same time
as the thermal questionnaire. This will be carefully considered when selecting data
for inclusion in the RP-884 database.
4. Behavioral adjustments and perceived control. People adapt to the environment by
adjusting their clothing or activity, modifying their posture or moving to another part of
the room, opening/closing windows, operating fans or other environmental controls.
But why would this cause a discrepancy between the observed and predicted
conditions? In theory, static heat balance models account for clothing, activity, and
thermal environmental parameters, and should therefore, be able to factor the
consequences of the behavioral adjustments into their equations. Probably the most
likely impact of thermal adjustments is the perception of control -- psychologists are
quick to point out that adverse or noxious stimuli are less irritating if the subject
perceives she/he has control over them (Paciuk 1990, Veitch and Arkkelin 1995,
Kaplan and Kaplan 1982). Issues of behavioral adjustment and perceived control will
be given a high priority in the RP-884 analysis, as this represents a potentially
significant feedback loop between discomfort and purposive behavioral
thermoregulation.
5. Thermal sensation, preference, and acceptability. Existing thermal comfort
standards provide guidelines for “thermal acceptability”, while the static heat balance
models on which they’re based only predict “thermal sensation”. As a result, the
ASHRAE RP-884 Final Report
Introduction & Background page MRL Australia 29
traditional approach has been to indirectly associate specific thermal sensations with
“acceptability”, and to assume that thermal “preference” is synonymous with thermal
“neutrality”. RP-884 will strive to include field experiments in its database that directly
asked about sensation, acceptability and preference, so these assumptions can be
tested.
1.5.2. Time scales of thermal adaptation
Since each class of adaptive response depends on repeated exposure to a given
regime of thermal conditions, the questions of duration of exposure and lag in response
seem relevant to adjustment, acclimatization and habituation adaptive processes. A
review of the literature in this area will reveal, in part, which mechanisms are likely to
play the most significant role in thermal response to the indoor environment and,
therefore, which should receive the greatest attention in the RP-884 analysis.
The significance of the temporal dimension of thermal adaptation is realized when one
considers applications of adaptive models to control algorithms for HVAC systems.
Auliciems was the first to propose such an adaptive algorithm (Auliciems 1986) which
he referred to as a thermobile (as opposed to a thermostat). It was premised on the
adaptive model described in equation 1.4. The question of how long the averaging
period for the algorithm’s temperature inputs should be was left open but, as an initial
guess, Auliciems proposed that the running means, one for both indoor and outdoor
temperatures, should comprise hourly observations across the preceding fortnight.
More recently, Humphreys and Nicol (1995) proposed a similar adaptive algorithm for
UK office temperatures. The gist of his proposed guideline is that a weighted, running
mean of the preceding week’s outdoor temperature is combined with current outdoor
temperature in a ratio of 3:7, thereby reflecting the overriding importance of today’s
weather on clothing decisions and behavior. Humphreys proposed that this outdoor
temperature index be used to specify the target indoor temperature.
Adjustment. Thermal adjustment and behavioral adaptation operate across several
time scales. Cutaneous thermoreceptors provide almost instantaneous neural
information about sudden changes in the thermal environment. For example, as
experienced, when crossing the indoor/outdoor threshold, thus enabling clothing

ASHRAE RP-884 Final Report
Introduction & Background page MRL Australia 30
adjustments and other behavioral adaptations to be effected well in advance of any
significant alteration in the body’s heat balance. As for other behavioral adaptations,
very little research has been published on adaptive time lags. A notable exception is a
study by Humphreys (1979) on clothing adjustments at the seasonal and synoptic
weather time-scales. He was able to statistically relate clothing insulation levels on any
given day to an exponentially weighted moving average of outdoor temperatures on the
days leading up to, and including, the day in question. It was suggested that the half-life
for daytime clothing regulation was of the order of 20 hours.
Acclimatization. The literature on acclimatization reviewed earlier indicates that the
physiological adaptations to heat exposure begin on the first day of exposure and
progress rapidly to full development by the third or fourth day, providing the heat
exposures are sufficiently severe to elevate core temperatures (Bean and Eichna, 1943;
Fox, 1974). This has been achieved experimentally with daily work-in-heat regimes or
hyperthermic suits. Passive exposures to heat in the course of normal day-to-day
acclimatization cannot be expected to induce acclimatization responses as quickly nor
as thoroughly, although Wyndham (1970) reports that passive exposures to the normal
course of the seasons in South Africa induced definite signs of at least partial
acclimatization. The time-scales of interest for office workers, therefore, may be of the
order of weeks to months.
Habituation and expectations. Unfortunately this literature review was unable to find
reference to any research on the time-scales of psychological adaptive responses,
probably for the simple reason that no researchers have previously attempted to
disentangle psychological from other thermal adaptive processes. However, anecdotal
evidence suggest that building occupants become accustomed to levels of warmth
prevailing within buildings on time scales of weeks to months. These scales translate
into synoptic and seasonal processes operating in the outdoor atmospheric
environment.
To summarize, the adaptive processes are operating on time scales ranging from
seasonal, through synoptic to diurnal. Critics of the adaptive approach at various
symposia or seminars have repeatedly asked the question: “... how long must your

ASHRAE RP-884 Final Report
Introduction & Background page MRL Australia 31
people suffer in sub-optimal indoor climates before they become adapted?” Ignoring
the emotive language in this question, we feel its answer, if there is one, depends on
which of the adaptive processes is being relied upon. The consensus within what little
has been written on the temporal dimension of adaptation is that meteorological
conditions on the day in question, and to a lesser extent, the preceding week or two,
exert an overriding influence on thermal adaptation in general, and clothing
thermoregulation in particular. This has important implications for future field
experimental protocols. While traditional research designs tend to look at responses at
a given moment, experiments that intend to evaluate adaptive mechanisms need to take
measurements over extended periods of time. Available evidence reviewed in this
paper indicates that, in climate chamber experiments at least, the slower physiological
adaptive process of acclimatization appears not to be relevant to this question of
thermal neutrality and its fluctuations from day-to-day, week-to-week and season-to-
season. As a result, the RP-884 data analysis and model development will focus more
heavily on the adaptive mechanisms of adjustment, and habituation/expectation. This
also suggests the need for field experiments in which data were rigorously obtained,
including accurate measurements of air movement
1.6. Aims
The specific objectives of RP-884 can now be listed:
1. Elaborate and define adaptive processes in the context of indoor climatic
perception.
2. Develop an internally consistent and quality controlled database of thermal comfort
field experimental data from a variety of buildings and climates across the world. To
then make this database as widely available to other thermal comfort researchers
as possible.
3. Examine the semantics of thermal sensation, acceptability and preference scales
within the context of an adaptive model of thermal comfort.
4. Develop statistical models of thermal comfort based explicitly on the various
processes of adaptation, including adjustment, acclimatization and habituation.

ASHRAE RP-884 Final Report
Introduction & Background page MRL Australia 32
5. Explore the influence of contextual and non-thermal factors on thermal perception
indoors. This investigation will include (but not be restricted to) season, building
purpose (residential, office) and climatic setting, on thermal perception. This will
inevitably include comparisons with the thermal comfort predictions of heat-balance
models such as PMV/PPD.
6. Proposing a variable temperature standard that, in time, might eventually
supplement and/or modify ASHRAE Standard 55.

ASHRAE RP-884 Final Report
Methods page MRL Australia 36
2.2. Establishing the database for RP-884
The RP-884 database is the project’s fundamental research resource. This section
describes where the raw data came from, how they were quality controlled, and what
processes of data assimilation were developed to ensure internal consistency within the
database.
2.2.1. Sourcing the raw data
The literature review in Chapter 1 uncovered numerous thermal field studies and
experiments. Combined with the authors’ and ASHRAE TC 2.1’s knowledge of
researchers currently or recently active in this area, we compiled a mailing list. An initial
fax was broadcast to dozens of researchers around the world requesting information
about field methods and soliciting contributions to the database (see Figure 2.3a and
Figure 2.3b). On the basis of the returns to that questionnaire, a list of the contributors
and their field methods was collated. Figure 2.2 depicts the geographic locations of the
contributors to the RP-884 database. Data came from four continents and a broad
spectrum of climatic zones.
Figure 2.2: Geographic origins of the raw data contributions to RP-884 world database of thermal comfort field research

ASHRAE RP-884 Final Report
Methods page MRL Australia 37
Table 2.1: Sources of raw data for the RP-884 world database of thermal comfort Researcher File
No. Experiment Location Building
Type Research Design
Sample Size
No. of Blgds
Jill Brown (U of Wales - UK) 1 South Wales, UK (summer) HVAC cross-sectional 80 4
Jill Brown (U of Wales - UK) 2 South Wales, UK (winter) HVAC cross-sectional 38 4
John Busch (LBL) 3 Bangkok, Thailand (Hot season) HVAC cross-sectional 776 2
John Busch (LBL) 4 Bangkok, Thailand (Hot season) NV cross-sectional 392 3
Benton + Brager (ACT2) 5 Antioch, California (winter) HVAC longitudinal 111 1
Tri Karyono (Sheffield, UK) 6 Jakarta, Indonesia (summer) HVAC cross-sectional 458 5
Tri Karyono (Sheffield, UK) 7 Jakarta, Indonesia (summer) NV cross-sectional 97 1
Tri Karyono (Sheffield, UK) 8 Jakarta, Indonesia (summer) Mixed cross-sectional 41 1
Donnini ASHRAE RP-821 9 Montreal, Canada (summer) HVAC cross-sectional 443 12
Donnini ASHRAE RP-821 10 Montreal, Canada (winter) HVAC cross-sectional 426 11
de Dear (PhD data) 11 Brisbane, Australia (summer) HVAC cross-sectional 564 5
de Dear (PhD data) 12 Brisbane, Australia (summer) NV cross-sectional 611 5
de Dear (PhD data) 13 Darwin, Australia (dry season) HVAC cross-sectional 493 8
de Dear (PhD data) 14 Darwin, Australia (Wet season) HVAC cross-sectional 555 7
de Dear (PhD data) 15 Melbourne, Australia (summer) HVAC cross-sectional 512 4
de Dear (PhD data) 16 Melbourne, Australia (summer) NV cross-sectional 555 3
Guy Newsham (Canada NRC) 17 Ottawa, Canada (winter) HVAC longitudinal 1859 4
Nicol, Fergus (Oxford-Brooks U) 18 Karachi, Pakistan (summer) NV longitudinal 190 1
Nicol, Fergus (Oxford-Brooks U) 19 Karachi, Pakistan (winter) NV longitudinal 470 1
Nicol, Fergus (Oxford-Brooks U) 20 Multan, Pakistan (summer) NV longitudinal 437 1
Nicol, Fergus (Oxford-Brooks U) 21 Peshawar, Pakistan (summer) NV longitudinal 556 1
Nicol, Fergus (Oxford-Brooks U) 22 Peshawar, Pakistan (winter) NV longitudinal 513 1
Nicol, Fergus (Oxford-Brooks U) 23 Quetta, Pakistan (summer) NV longitudinal 492 1
Nicol, Fergus (Oxford-Brooks U) 24 Quetta, Pakistan (winter) NV longitudinal 425 1
Nicol, Fergus (Oxford-Brooks U) 25 Saidu, Pakistan (summer) NV longitudinal 568 1
Nicol, Fergus (Oxford-Brooks U) 26 Saidu, Pakistan (winter) NV longitudinal 548 1
Nick Baker, Cambridge UK 27 Athens, Greece (summer) NV longitudinal 1626 6
Raja, Ifitkhar (Oxford-Brooks U) 28 Oxford, UK (summer) NV longitudinal 877 3
David Rowe (U Sydney) 29 Sydney, Australia (summer) mixed longitudinal 137 1
David Rowe (U Sydney) 30 Sydney, Australia (winter) mixed longitudinal 170 1
Dav id Rowe (U Sydney) 31 Sydney, Australia (winter) HVAC cross-sectional 83 1
Gail Brager ASHRAE RP462 32 Bay Area, California (summer) HVAC mixed 673 7
Gail Brager ASHRAE RP462 33 Bay Area, California (summer) NV mixed 360 3
Gail Brager ASHRAE RP462 34 Bay Area, California (winter) HVAC mixed 923 7
Gail Brager ASHRAE RP462 35 Bay Area, California (winter) NV mixed 393 3
de Dear & Fountain 702-RP 36 Townsville, Australia (Dry season) HVAC cross-sectional 628 12
de Dear & Fountain 702-RP 37 Townsville, Australia (Wet season) HVAC cross-sectional 606 11
Ruth Williams (BSRIA - UK) 38 Merseyside, UK (summer) NV cross-Sectional 167 3
Ruth Williams (BSRIA - UK) 39 Merseyside, UK (winter) NV cross-Sectional 209 5
Ruth Williams (BSRIA - UK) 40 Merseyside, UK (winter) Mixed cross-Sectional 121 1
de Dear, Foo and Leow 41 Singapore (summer) HVAC cross-sectional 333 1
de Dear, Foo and Leow 42 Singapore (summer) NV cross-sectional 583 1
Bauman et al (Steelcase) 43 Grand Rapids, Michigan (winter) HVAC mixed 85 1
Benton + Brager (ACT2) 44 San Ramon, CA (summer) HVAC longitudinal 96 1
Benton + Brager (ACT2) 45 San Ramon, CA (winter) HVAC longitudinal 285 2
Benton + Brager (ACT2) 46 Auburn, CA (winter) HVAC longitudinal 128 1
TOTAL 20693
TOTAL 160

ASHRAE RP-884 Final Report
Methods page MRL Australia 38
Figure 2.3a: The RP-884 thermal comfort research methods questionnaire sent to active field researchers around the world

ASHRAE RP-884 Final Report
Methods page MRL Australia 39
Figure 2.3b: The RP-884 thermal comfort research methods questionnaire sent to active field researchers around the world

ASHRAE RP-884 Final Report
Methods page MRL Australia 40
2.2.2. Ratings of raw data submitted to RP-884
Field data were classified according to the standard of instrumentation and procedures
used for indoor climatic measurements. Three broad classes of thermal comfort field
investigation were defined as follows:
• Class III: Field studies based on simple measurements of indoor temperature and
possibly humidity. One level of measurement above the floor. Possibly asynchronous
and non-contiguous physical (temperature etc.) and subjective (questionnaire)
measurements. The field studies used to derive the previously published adaptive
models (Humphreys, 1976, 1978, 1981; Auliciems, 1981) were all Class III.
• Class II: Field experiments in which all indoor physical environmental variables (ta,
tr, v, rh, Icl, met) necessary for the calculation of SET* and PMV/PPD indices were
collected at the same time and place as the thermal questionnaires were
administered. Measurements may not have been made at the three heights above
floor level as specified in ASHRAE (1992) and ISO (1994) standards (0.1, 0.6 and
1.2m). Humidity measurements were taken by aspirated psychrometer or solid state
hygrometer sensors. Air speeds were measured by hot wire (or sphere) probes with
thresholds above 0.1 ms-1, directional sensing elements and time constants larger
than that necessary for turbulence intensity, Tu, assessments.
• Class I: Field experiments in which all sensors and procedures were in 100%
compliance with the specifications set out in ASHRAE Standard 55 (1992) and ISO
7730 (1984). In particular, all of the shortcomings identified in Class II investigations
were absent from Class I field experiments. Three heights of measurement with
laboratory-grade instrumentation including omnidirectional anemometry capable of
turbulence intensity assessments. The three ASHRAE-sponsored field experiments
in the San Francisco Bay Area (RP-462), Townsville (RP-702) and Montreal (RP-
921) are examples of Class 1 investigations.
Also listed in Appendix C is a comprehensive summary of each field project adopted in
the ASHRAE RP-884 database. Information listed includes: original researchers’
names, class of data (I, II or III); publications; field location, climate and season;
description of sample buildings; indoor climatic instruments; questionnaire details, and

ASHRAE RP-884 Final Report
Methods page MRL Australia 41
outdoor meteorological/climatological data sources. In addition there is a detailed
section explaining the RP-884 standardization steps and procedures that were applied
to each project’s raw data before they were assimilated into the cumulative database.
2.3. Raw data standardisation
Individual researchers each have their own detailed methods, but thankfully these
idiosyncrasies are largely transparent to the readers of their final research publications.
However, in an exercise involving the assembly of a database from raw data, the
emphasis must be on standardization. In the present case this has not been easy since
the decision to assemble a database occurred after the original data were collected
(except in the case of the ASHRAE field RPs). This section describes some of the
more important steps in this process of data assimilation.
2.3.1. Creation of a standard data template
A standard template of variables was developed, based on previous ASHRAE-funded
research projects, particularly RP-702 (hot-humid), RP-462 (Mediterranean) and RP-
821 (cold climate). This template was applied to each and every row of data in the RP-
8884 database (n~21,000). The standard template consisting of units of measurement,
codenames and coding conventions is presented in Appendix E. The template is
broken down into the following groups of variables:
• Basic Identifiers such as building code, subject information and date.
• Thermal Questionnaire comprising sensation, acceptability and preference scales,
as well as activity, metabolic rates, clothing and chair insulation.
• Indoor Climate Physical Observations of air temperature, globe temperature, air
velocity and turbulence at three heights, plus dewpoint, rh and plane radiant
asymmetry temperature.
• Calculated Indices, including averaged single height measurements of air
temperature, mean radiant temperature, air velocity; operative temperature,
turbulence intensity, vapour pressure and relative humidity; new effective temperature,
new standard effective temperature, TSENS, DISC, predicted mean
vote, predicted percentage dissatisfied and draft risk at three heights and maximum.

ASHRAE RP-884 Final Report
Methods page MRL Australia 47
Male Clothing Estimate from RP - 462 data
ASH55-92 = 1.1979 * McIntyre2 + 0.219 * McIntyre
R2 = 0.9166
0.0
0.5
1.0
1.5
2.0
2.5
0.0 0.5 1.0 1.5 2.0 2.5
McIntyre (Sprauge and Munson) CLO
AS
HR
AE
55
- 92
CLO
Female Clothing Estimates from RP - 462 data
ASH55-92 = 1.0921 * McIntyre
R2 = 0.7851
0.0
0.5
1.0
1.5
2.0
2.5
0.0 0.5 1.0 1.5 2.0 2.5
McIntyre (Sprauge and Munson) 1980 CLO
AS
HR
AE
55
- 92
CLO
Figure 2.5: Relationships between Sprague & Munson (McIntyre 1980) and ASHRAE 55-92 clo estimates in the RP-462 field experiment
Figure 2.5 depicts the regression models fitted to the relationship between the Sprague
and Munson clo method (reported in McIntyre, 1980) and the ASHRAE 55-92 method.
The curvilinear relationship for male subjects was best approximated by a 2nd order
polynomial regression model which managed to account for 92% of the variance in
Standard 55-92 estimates (r=0.96). The female subjects in RP-462 had their ASHRAE
55-92 clothing ensemble insulation estimates were systematically larger than the
Sprague and Munson estimates by a factor of 9.2% and the linear relationship between
the two estimation methods had a correlation coefficient of r=0.89.
Male Clothing Estimates from RP-462 data
ASH55-92 = 0.3839 * ISO-842 + 0.6579 * ISO-84R2 = 0.9518
0.0
0.5
1.0
1.5
2.0
2.5
0.0 0.5 1.0 1.5 2.0 2.5
ISO 7730 1984 CLO
AS
HR
AE
55
- 92
CLO
Female Clothing estimates from RP-462 data
ASH55-92 = 1.057 * ISO-84R2 = 0.8476
0.0
0.5
1.0
1.5
2.0
2.5
0.0 0.5 1.0 1.5 2.0 2.5
ISO 7730 (1984) clo
AS
RA
E 5
5-92
clo
Figure 2.6: Relationships between ISO 7730 (ISO, 1984) and ASHRAE 55-92 clo estimates in the RP-462 field experiment
Figure 2.6 depicts the relationships between RP-462 clothing ensembles insulation
estimates using the ISO 7730 (1984) and ASHRAE 55-92 methods. The male subjects’

ASHRAE RP-884 Final Report
Methods page MRL Australia 48
clothing was described by a second order polynomial regression which explained
95.2% of the variance (r=0.98). The female subjects’ model was a simple linear
regression with the ASHRAE 55-92 estimates being, on average, 5.7% higher than the
ISO 7730 (1984) estimates, and the relationship accounting for 84.8% of variance
(r=0.92).
Male Clothing Estimate from RP - 462 data
ASH55-92 = 0.3954 * ISO-942 + 0.6954 * ISO-94
R2 = 0.9448
0.0
0.5
1.0
1.5
2.0
2.5
0.0 0.5 1.0 1.5 2.0 2.5
ISO 7730 -1994 CLO
AS
HR
AE
55-
92 C
LO
Female Clothing Estimates from RP-462 data
ASH55-92 = 1.0049 * ISO-94
R2 = 0.8814
0.0
0.5
1.0
1.5
2.0
2.5
0.0 0.5 1.0 1.5 2.0 2.5
ISO 7730 - 1994 CLO
AS
HR
AE
55-
92 C
LO
Figure 2.7: Relationships between ISO 7730 (ISO, 1994) and ASHRAE 55-92 clo estimates in the RP-462 field experiment
Figure 2.7 above depicts the regression relationships between RP-462 clothing
ensemble insulations values estimated by the ISO-7730 2nd edition (1994) and
ASHRAE 55-92 methods. The male subjects’ clo estimates were approximated again
with a second order polynomial which accounted for 94.5% of the variance (r=0.97).
The females’ regression model was a simple linear one (r=0.94) with the ASHRAE 55-
92 clo estimates being about half a percent higher than the ISO 7730 (1994)
counterparts.
Unlike the RP-462 raw data files, the remainder of the raw data contributions to
ASHRAE RP-884’s database contained only total ensemble insulation estimates,
therefore ruling out any systematic garment-by-garment conversions and trends of the
type performed for RP-462 above. However, a preliminary questionnaire sent to each of
the RP-884 database contributors enquired about their method of clo estimation (see
Figure 2.3a and Figure 2.3b). Where the method used was pre-ASHRAE Standard 55-
1992, the original researchers’ clo estimates in their raw data file were simply scaled up
or down to equivalent Standard 55-92 levels using the conversion factors (regression
models) described above in Figures 2.4 through 2.7.

ASHRAE RP-884 Final Report
Methods page MRL Australia 49
2.3.5.2. The chair insulation effect
The preliminary questionnaire on field methods sent to all database contributors (Figure
2.3a and Figure 2.3b) also enquired into whether or not the incremental insulation effect
of furniture was included in their clo estimates. If omitted from the original estimates, an
additional 0.15 clo was added, after the regression correction to clothing insulation had
been performed (McCullough and Olesen, 1994; de Dear, 1994). While it is recognised
that all chairs, stools, sofas, and any other horizontal surface which might have acted as
a chair at the time of questionnaire for the 21,000 subjects in the RP-884 database may
not have provided exactly 0.15 clo insulation at the time of interview, we feel inclusion of
this “best estimate” is preferable to omitting the effects of chairs altogether.
2.4. Developing an index for perceived thermal control
Adaptive opportunity and perceived control figured prominently throughout the literature
review in Chapter 1, but unfortunately, only a handful of original field experiments
supplied to the RP-884 database actually recorded these data in their survey buildings.
Therefore the development of a method for estimating this parameter across all
buildings within the RP-884 database was given a high priority. This section describes
the assumptions and steps we made to achieve this goal.
• Step 1: Find a data base possessing both a global perceived control item (PCC) in
the original questionnaire as well as individual items on specific adaptive
opportunities (PCEC1 through PCEC7). The ASHRAE-sponsored RP-702 (hot-
humid Townsville) and RP-821 (Cold climate Montreal) fulfilled these requirements.
• Step 2: Classification of the adaptive opportunities (PCEC variables) according to
their relevance to season (See Table 2.2). For example, access to windows was not
regarded as a relevant thermal control during winter months, whereas access to
thermostats was deemed relevant all year round.

ASHRAE RP-884 Final Report
Methods page MRL Australia 50
Table 2.2: Thermal adaptive opportunities classified according to their relevance to perceived control in summer and winter seasons
PCEC variables Can You Control Season
PCEC1 windows summer
PCEC2 external doors summer
PCEC3 internal doors summer/winter
PCEC4 thermostats summer/winter
PCEC5 curtains/blinds summer/winter
PCEC6 local heaters winter
PCEC7 local fans summer
• Step 3: For the summer index, we found all cases in the database that had control
over operable windows ( PCEC1= 1) but none of the other adaptive opportunities
(PCEC2 through PCEC7). We then found the average of the overall perceived
control variable (PCC) for this subset of the database with control over windows.
Similar perceived control averages for each of the other adaptive opportunities
(PCEC variables) were obtained
• Step 4: For each of the 21, 000 subjects in the RP-884 database, we summed the
relevant perceived control scores (Step 3) for all adaptive opportunities they had at
their disposal. The aggregate score resulting from this step was entered in the
database as PCC_AG.
We can see from Table 2.3 that, in both summer and winter, the most efficacious
adaptive opportunity is “thermostats,” with “internal doors,” “curtains/blinds,” “external
doors,” “local heaters” and “local fans” all rating approximately equal for their designated
season. In summer, windows also contribute significantly to building occupants’
perceived control.

ASHRAE RP-884 Final Report
Methods page MRL Australia 51
Table 2.3: Thermal adaptive opportunities scored according to their influence on perceived thermal control in summer and winter
PCEC variables Can You Control PCC score in
Summer season
PCC score in Winter
Season
PCEC1 windows 1.6
PCEC2 external doors 1.3
PCEC3 internal doors 1.3 1.3
PCEC4 thermostats 1.8 2.0
PCEC5 curtains/blinds 1.3 1.4
PCEC6 local heaters 1.3
PCEC7 local fans 1.5
2.5. Thermal acceptability issues within the RP-884 database
2.5.1 Developing a proxy variable for thermal acceptability based on thermal sensation
votes.
The thermal comfort standards such as ASHRAE’s Standard 55 and ISO 7730 are
couched in terms of maintaining certain levels of thermal acceptability within a
building. Unfortunately specific questionnaire items on thermal acceptability such as this
(TSA):
“Is this environment thermally acceptable to you at this point in time?”
were available in only a small subset of buildings in the RP-884 database, but a proxy
could be inferred from thermal sensation votes (ASH), which were recorded in all
studies. It has generally been assumed that a thermal sensation vote within the central
three categories of the ASHRAE scale is acceptable. Translating to the real-number
version (as opposed to the integer only version) of the scale, this criterion for
acceptability was defined as a thermal sensation vote falling in the interval -
1.5<ASH<+1.5. Applying this criterion to the RP-884 database, we simply tallied the
number of subjects within each building registering an acceptable thermal sensation
vote, and expressed it as a percentage of the total sample size for that particular
building (designated as fprxysat in the RP-884 codebook, Appendix E). The resulting

ASHRAE RP-884 Final Report
Methods page MRL Australia 52
percentages can be treated in the meta-analysis as a thermal acceptability rating for the
building in question.
2.5.2. Rating buildings in terms of their compliance with ASHRAE Standard 55
acceptable indoor climate guidelines
If we are prepared to ignore the upper and lower humidity boundaries of the summer
and winter comfort zones depicted in ASHRAE Standard 55-92 (which may be justified
in view of the ongoing debate as to what they should actually be -- see Berglund, 1995),
it was a relatively simple task to assess each RP-884 database building’s percentage
of indoor climate measurements falling within either the summer or winter ASHRAE
comfort zone (ASH55_92). This also depends on which season the building was
surveyed in. It was done for buildings assessed during the cooling season (summer),
with:
23°C <= indoor ET* <= 26°C
and for the heating season (winter), with:
20°C <= indoor ET* <=23.5°C
The resulting percentages for each building can be regarded in the RP-884 meta-
analysis as an index of the compliance with the ASHRAE Standard 55 thermal
acceptability prescriptions.
2.6. Outdoor meteorological/climatological data for the data base
Obviously outdoor weather and climate represent key components of any conceivable
adaptive model of thermal comfort since outdoor climate partly drives acclimatization,
behavioral and psychological adaptive responses.
2.6.1. Appending outdoor weather observations to each row of data
For those studies supplied to the RP-884 database without weather data, the first
priority was to obtain meteorological data (weather data recorded on exactly the same
dates as the indoor observations). If that was not possible, then climatological data
were used (i.e. data from published sources covering long-term statistical averages for
the months in question). The outdoor atmospheric parameters collected for the RP-884
database consisted of daily outdoor air temperature and coincident relative humidity at

ASHRAE RP-884 Final Report
Methods page MRL Australia 53
6:00 am and 3:00 pm. These times were selected because they represent typical times
of occurrence of daily minimum and maximum temperature. The times also typically
correspond with daily maximum and minimum relative humidity.
Various national weather and climate data resources searched and used included:
• The US National Climatic Data Center (NCDC) which currently maintains an on-line
US climatic data archive on the World Wide Web (INTERNET) from which it is
possible to download data via the Hyper-Text Transfer Protocol (HTTP).
• Commercially available CD ROMS such as the International Station Meteorological
and Climate Summary (ISMCS, 1992) proved most useful in filling some of the gaps
in the RP-884 meteorological/climatological data base.
• Published Climatological data resources such as in academic journal Weather were
used to obtain maximum and minimum temperatures (with relative humidity supplied
by ISMCS) for many of the UK field experiments.
• In two cases, meteorological data were supplied gratis by weather stations on
university campuses. These were the Radcliffe Observatory at Oxford University, UK,
and the Physical Geography Met Site at Macquarie University in Sydney Australia.
• For those investigations in which the actual outdoor meteorological data were either
unavailable from previously listed sources, or at the wrong temporal resolution, it was
necessary approach the relevant State or National Climatologists (weather bureaux)
for raw data. This was done for the Australian field experiments in Brisbane, Darwin
and Melbourne, for all the Californian field experiments, and the Steelcase project in
Michigan.
2.6.2. Climate classification applied to RP-884 raw data
A relatively simple and descriptive climate classification developed for the Macquarie
University undergraduate teaching program in climatology was applied to the RP-884
database. A map of the classification can be seen in Appendix D.

ASHRAE RP-884 Final Report
Methods page MRL Australia 54
2.7. Subdivision of the standardized field experiments
Once the field experiments supplied by original researchers had been quality controlled
and standardized into the RP-884 database template, they were broken down
according to season (summer/winter) and building type (centrally controlled HVAC
buildings, naturally ventilated buildings NV, and mixed-mode buildings). Here the
distinction between centrally-controlled HVAC buildings and naturally ventilated
buildings is that in central HVAC buildings individual occupants have little or no control
over their imediate thermal environment, while occupants in naturally ventilated buildings
at least have control over operable windows. See Table 2.1 and the “sample buildings”
sections for of each project summary in Appendix C.
2.8. The meta-analysis
By aggregating the statistical unit of analysis up from the individual subject to whole
buildings, the RP-884 was able to reduce the 21,000 cases in the database to 160
buildings. This section describes how the aggregation was performed and how the
resulting meta-file was used as the basis for developing adaptive models.
2.8.1. The unit of analysis for the RP-884 meta-analysis
Earlier attempts at defining adaptive models (Humphreys and Auliciems) typically
aggregated data up to the unit of an entire field study, which often incorporated many
different buildings. Therefore the early adaptive models may have glossed over
considerable variety in contextual factors affecting subjective responses. While each
record within the RP-884 database was structured as one individual subject’s thermal
questionnaire, indoor climatic physical measurements, thermal index values and outdoor
meteorological observations, the most appropriate unit of analysis for the statistical
modelling part of the project is the single building. This level of aggregation masks
some of the inherent noise involved in a single subject’s thermal comfort assessment,
while still providing sufficient data points for statistical modelling purposes.
Furthermore, several important parameters such as neutrality and preferred temperature
can only be sensibly derived from a group’s response. Data analysis at the level of

ASHRAE RP-884 Final Report
Methods page MRL Australia 55
buildings rather than individuals also ensured a modicum of consistency across several
contextual factors relevant to thermal adaptive processes, including :
• type of HVAC system,
• degree of personal environmental control,
• job satisfaction and other managerial factors that might impinge upon thermal
comfort,
• temporal variability of internal temperatures in the days/weeks preceding the thermal
comfort experiment,
• mean levels of outdoor meteorological factors and their variability in the days/weeks
preceding the comfort experiment.
In total there are 160 individual buildings in the RP-884 database.
2.8.2. Meta-file’s structure and coding conventions
The meta-file included country, city, and season in which the field experiment was
conducted. Data quality and intensity of measurement were also recorded, as was
building type (HVAC, NV, mixed-mode). Following these descriptors are means and
standard deviations of questionnaire responses (e.g. ASHRAE sensation votes and
thermal environmental measurements plus derived indices). In addition there are the
derived products such as the building’s observed thermal neutrality, preferred
temperature and thermal acceptability rating. The full listing of variables in the meta-file
and their coding conventions can be found in Appendix F.
2.8.3. General assumptions within the statistical meta-analysis
• For the purpose of statistical analysis in RP-884, field experiments with longitudinal
research design (few subjects, sampled many times) were assumed to have
independence between subjects. That is, longitudinal studies were treated the same
way as cross-sectional research designs during the meta-analysis. We also
accepted that all other statistical assumptions of linearity, normality and equality-of-
variance applied across the data base.

ASHRAE RP-884 Final Report
Methods page MRL Australia 56
• For all statistical modelling conducted on the meta-file, each building “data point” was
weighted according to the number of human subjects it represented (i.e. sample size
within the building). The purpose of using a weighting factor was to minimise the
impact of outlying data points that were based on relatively small number of
observations.
• Statistical products such as building neutrality or preferred temperature were
appended as new variables in the meta file. However, if the statistical model or test
in question failed to reach statistical significance at the p=0.05 level of or better, the
building registered a missing value code for that particular variable in the meta file.
• Test statistics based on small sample sizes were interpreted with care or eliminated
(i.e. coded as “missing values”) due to their wide confidence interval estimates.
2.8.4. Statistical treatments on the various subjective thermal ratings
There are some common features in the methods used in thermal comfort field work,
particularly in relation to their assessmetns of subjective warmth within buildings. The
most common approach has been the rating scale method in which comfort is
operationalized as a vote of "neutral" or "comfortable" on scales such as those
depicted in Table 2.4. Shading has been used in the table to indicate the commonly
assumed mapping between rating scales and other thermal assessments. That is,
“neutral” is generally assumed within the comfort research community to be synonymous
with “comfortable”, “acceptable,” and “preferred.”
Despite the apparent semantic differences between the ASHRAE scale of thermal
sensation and the Bedford comfort scale, these two scales have been found to behave
more-or-less the same in most practical situations (McIntyre, 1978a; de Dear, 1985).
This encouraged direct comparisons in this project between studies using either scale.
But recent analyses of questionnaire studies in which acceptability, preference and
thermal sensation were recorded simultaneously reveal that the optimum temperature
based on thermal sensation votes does not correspond exactly with that derived from
thermal preference or acceptability (Brager, 1994). Therefore thermal acceptability and
preference were analyzed separately wherever possible.

ASHRAE RP-884 Final Report
Methods page MRL Australia 57
Table 2.4: Common rating scales used in comfort research in the field
ASHRAE scale Bedford scale Acceptability Preference (McIntyre)3 hot much too warm2 warm too warm unacceptable want cooler1 slightly warm comfortably warm0 neutral comfortable acceptable no change
-1 slightly cool comfortably cool-2 cool too cool unacceptable want warmer-3 cold much too cool
The ambient temperature found by statistical analysis to most frequently coincide with
the central, usually “neutral” or “comfortable,” rating in a thermal comfort study is referred
to as that sample's "neutrality". Neutrality was calculated in the meta-analysis by the
following steps:
• Binning a particular building’s observations into half-degree (K) increments, and
working with the bins’ mean response, say thermal sensation vote, instead of
individual subjects’ thermal votes.
• Fitting a linear regression model between thermal sensations and whatever the x-axis
thermal index may be (TOP, ET, SET, PMV). The regression models weighted each
point according to the number of observations within each x-axis bin. The regression
models had the general form:
mean thermal sensation = a + b * (bin index value)
The following statistical details of each building’s four regression models (TOP, ET,
PMV, SET) were extracted for the meta-analysis:
• gradient (b) of each regression model, a measure of thermal sensitivity,
• the neutrality of the model, i.e. solution of the linear equation for a mean thermal
sensation value of zero, or “neutral,”
• the range of index values corresponding with 80% “acceptable” thermal sensations,
i.e. the distance between solutions of the linear equation corresponding with mean

ASHRAE RP-884 Final Report
Methods page MRL Australia 58
thermal sensations of -0.85 (close to the mean vote of “slightly cool”) and +0.85
(close to “slightly warm”),
• The range of index values corresponding with 90% “acceptable” thermal sensations
between solutions of the linear equation corresponding with mean thermal sensations
of -0.5 and +0.5.
These boundaries were selected on the assumption that the normal distribution of
thermal sensations recorded within each building resembled that of Fanger’s PPD
function (1970). So a mean vote of ±0.85 was assumed to correspond with 80%
general acceptability (20% dissatisfaction, excluding local discomfort), ie. 80% of votes
falling inside the central three categories. A mean vote of ±0.5 was assumed to
correspond with 90% general acceptability (10% dissatisfaction).
Apart from statistically deriving observed neutralities for each building with the
procedures above, the meta-file also contains predicted neutralities for each building on
the basis of heat-balance models. The model used for this purpose was Fanger’s
(1970) PMV index, and it was applied to the problem in the following way:
• Each building’s mean values for each of the five PMV variables (TOP, RH, VEL,
INSUL, MET) were input to the WinComf© software (Fountain and Huizenga, 1996).
• The PMV model was solved iteratively by adjusting TOP (ta with tr linked) until the
PMV output field equalled zero. The final operative temperature corresponding with
PMV=0 is, by definition, predicted neutrality (PREDNEUT) for that particular building.
• One additional variable named DELTNEUT was derived from the PMV model -- the
difference between observed and predicted neutralities (NEUT_TOP and
PREDNEUT respectively). PREDNEUT was subtracted from NEUT_TOP, so that if
a particular buildings occupants were neutral in temperatures warmer than expected
by the PMV model, their DELT_NEUT was positive in sign.
2.8.5. Preferred temperatures
Preferred temperature was assessed directly (MCI) in a subset of the buildings in the
RP-884 database. The typical questionnaire item was of the type:

ASHRAE RP-884 Final Report
Methods page MRL Australia 59
“At this point in time, would you prefer to feel warmer, cooler, or no change?”
These categorical data require different statistical treatments to that applied to linear
ASH scale of thermal sensation. In particular, probit analysis (Finney, 1971; Ballantyne
et al, 1977) is applicable rather than linear regression. However, probit requires binary
responses, whereas the questionnaire item described here has three possible answers.
The solution was to split the “no change” responses 50:50 into the remaining two
categories. Statistical software was applied to the task of tallying the number of
observations with MCI=1 (“want cooler”), and MCI=3 (“want warmer”) for each half-
degree temperature bin. Separate probit models were fitted to each of the “want
warmer” and “want cooler” percentages with the SAS probit procedure. Our operational
definition for the preferred temperature (or other index) within a particular building is that
value of the independent variable (e.g. operative temperature) corresponding to the
intersection of the “want cooler” and “want warmer” probit models. The fitted probit
models and preferred temperatures are depicted in separate graphs in Appendix B for
each building in which the MCI questionnaire item was available. Only those models in
which the probit models achieved statistical significance at the p=0.05 level or better
had their preferred temperatures registered in the RP-884 meta-file.
The RP-884 work statement specified separate analyses of thermal comfort (assumed
to equal sensation) and preference. Part of the logic underpinning this distinction is
known as the “semantic artefact hypothesis” which suggests that the preferred
temperature in cold climates may in fact be described as “slightly warm,” whereas
residents of hot climates may use words like “slightly cool” to describe their preferred
thermal state. While the actual temperatures preferred in both climatic extremes may in
fact be identical (assuming similar clothing, air speed, metabolism etc), the semantics
may differ to such an extent that the neutrality derived from thermal sensation scales in
the manner described above could shift up in warm climates and down in cold climates.
The RP-884 meta-file offers an opportunity to examine the semantic artefact in some
detail, since there were 55 buildings in which both thermal sensations (ASH) and
thermal preferences (MCI) were assessed. To this end, a new variable was defined in
meta-analysis:

ASHRAE RP-884 Final Report
Methods page MRL Australia 60
semantic discrepancy = neutrality minus preferred temperature (°C)
discrep = neut_top - preftemp (°C)
2.9. The RP-884 database in the public domain and disseminated via the World
Wide Web
The ASHRAE RP-884 project has its own homepage on the World Wide Web at the
following URL:
http://atmos.es.mq.edu.au/~rdedear/ashrae_rp884_home.html
The homepage, depicted in Figure 2.9, serves the purpose of introducing the RP-884
project, in particular the main team members on the project as well as the overall
concept of “adaptive models” in the context of thermal comfort research (Fig. 2.10).
The website also describes the background to the RP-884 database, linking to a flow
chart outlining the processes of data acquisition, quality control, standardization and
assimilation (Figure 2.1 is hyper-linked in the homepage). The structure of the database
and a copy of the codebook (Appendix E) are covered in another hyperlink to the
homepage. Most importantly, the comfort research community is given access to the
entire RP-884 database by means of an FTP server presented as a clickable “data
downloader” on the RP-884 website (see Figure 2.11). The table enables a total of 46
separate data files, each in a variety of formats, to be downloaded from the RP-884 host
machine in Sydney to any PC, Mac or UNIX machine elsewhere in the world, as long as
it is connected to the internet. Several data formats are available in an effort to facilitate
cross-platform transfers, but the most heavily used format is MS Excel® V.5
spreadsheets for use within the MS Windows ® 3.X or Windows 95 operating
environments. These data files have been “zipped” into compact, self-extracting
archives with *.exe filenames. The user will need to execute (run) the *.exe file after
it has been transferred and it will automatically inflate back to the native Excel® 5 format,
ready for use on the user’s machine with an *.XLS filename. The forenames of the 46
files within the “data downloader” correspond to the file numbers listed in Table 2.1
earlier in this chapter.

ASHRAE RP-884 Final Report
Methods page MRL Australia 61
Figure 2.9: The homepage for RP-884 on the World Wide Web http://atmos.es.mq.edu.au/~rdedear/ashrae_rp884_home.html

ASHRAE RP-884 Final Report
Methods page MRL Australia 62
Figure 2.10: One of the pages linked to the ASHRAE RP-884 homepage

ASHRAE RP-884 Final Report
Methods page MRL Australia 63
Figure 2.11: The entire RP-884 database (46 data files) is accessible to anyone who is interested via
this “data downloader. The device is a “clickable form” interface and can be found on the RP-884 project’s website.

ASHRAE RP-884 Final Report
Methods page MRL Australia 64
2.10. Summary of the methods used in RP-884
This chapter has described the RP-884 approach to developing adaptive models of
thermal comfort and preference. Underpinning the method has been the creation of a
large database of thermal comfort field research observations. The raw data for this
database were assembled from a wide variety of climatic, geographic and architectural
contexts, and at last count, the database had in excess of 21,000 rows of raw data. The
database is made available to the thermal comfort R&D community via a homepage on
the World Wide Web.
The raw data supplied to the RP-884 database included basic characteristics of the
building in which each subject was interviewed, demographic descriptors, the subject’s
thermal sensation, preference and acceptability votes at the time of the indoor climate’s
physical measurements (ta, tr, rh, v, Tu, clo, met). In view of the significance of clothing
in terms of behavioural thermal adjustments and also various thermal index calculations,
particular care was taken to ensure clothing and furniture insulation values were derived
from, or converted to, a consistent estimation method throughout the entire RP-884
database -- the ASHRAE Standard 55-92 method was selected as the benchmark for
this purpose.
Once raw data had been standardized, cleaned and assimilated into the database,
thermal indices such as ET*, SET, PMV, PPD, PD were calculated using a standard
software tool (ASHRAE RP-781). In addition, outdoor meteorological and
climatological observations were appended to each set of data in the database to
enable an examination of the role played by outdoor atmospheric environmental factors
in thermal adaptation.
The meta-analysis for RP-884 was conducted on this large database by aggregating
observations up to the level of individual buildings, of which there were 160 in total.
Statistical results were derived at this level of aggregation, including the building’s
thermal neutrality, preferred temperature, thermal acceptability rating, mean indoor

ASHRAE RP-884 Final Report
Methods page MRL Australia 65
thermal index values, as well as mean outdoor climatic indices at the time of the
building’s survey.
The next chapter (3) describes the basic results of this meta-analysis. These then
provide the foundation upon which adaptive models of thermal comfort will be built in
Chapter 4.

ASHRAE RP-884 Final Report
Methods page MRL Australia 66