developing an architecture to integrate safety, mobility
TRANSCRIPT

Developing an Architecture to Integrate Safety, Mobility, and Traffic DataFinal ReportJune 2021
Sponsored byIowa Department of Transportation(InTrans Project 18-676)

About InTrans and CTREThe mission of the Institute for Transportation (InTrans) and Center for Transportation Research and Education (CTRE) at Iowa State University is to develop and implement innovative methods, materials, and technologies for improving transportation efficiency, safety, reliability, and sustainability while improving the learning environment of students, faculty, and staff in transportation-related fields.
Iowa State University Nondiscrimination Statement Iowa State University does not discriminate on the basis of race, color, age, ethnicity, religion, national origin, pregnancy, sexual orientation, gender identity, genetic information, sex, marital status, disability, or status as a US veteran. Inquiries regarding nondiscrimination policies may be directed to the Office of Equal Opportunity, 3410 Beardshear Hall, 515 Morrill Road, Ames, Iowa 50011, telephone: 515-294-7612, hotline: 515-294-1222, email: [email protected].
Disclaimer NoticeThe contents of this report reflect the views of the authors, who are responsible for the facts and the accuracy of the information presented herein. The opinions, findings and conclusions expressed in this publication are those of the authors and not necessarily those of the sponsors.
The sponsors assume no liability for the contents or use of the information contained in this document. This report does not constitute a standard, specification, or regulation.
The sponsors do not endorse products or manufacturers. Trademarks or manufacturers’ names appear in this report only because they are considered essential to the objective of the document.
Iowa DOT Statements Federal and state laws prohibit employment and/or public accommodation discrimination on the basis of age, color, creed, disability, gender identity, national origin, pregnancy, race, religion, sex, sexual orientation or veteran’s status. If you believe you have been discriminated against, please contact the Iowa Civil Rights Commission at 800-457-4416 or the Iowa Department of Transportation affirmative action officer. If you need accommodations because of a disability to access the Iowa Department of Transportation’s services, contact the agency’s affirmative action officer at 800-262-0003.
The preparation of this report was financed in part through funds provided by the Iowa Department of Transportation through its “Second Revised Agreement for the Management of Research Conducted by Iowa State University for the Iowa Department of Transportation” and its amendments.
The opinions, findings, and conclusions expressed in this publication are those of the authors and not necessarily those of the Iowa Department of Transportation.

Technical Report Documentation Page
1. Report No. 2. Government Accession No. 3. Recipient’s Catalog No.
InTrans Project 18-676
4. Title and Subtitle 5. Report Date
Developing an Architecture to Integrate Safety, Mobility, and Traffic Data June 2021
6. Performing Organization Code
7. Author(s) 8. Performing Organization Report No.
Skylar Knickerbocker (orcid.org/0000-0002-0202-5872), Sudesh Bhagat
(orcid.org/0000-0001-8172-2037), Zach Hans (orcid.org/0000-0003-0649-
9124), and Anuj Sharma (orcid.org/0000-0001-5929-5120)
InTrans Project 18-676
9. Performing Organization Name and Address 10. Work Unit No. (TRAIS)
Center for Transportation Research and Education
Iowa State University
2711 South Loop Drive, Suite 4700
Ames, IA 50010-8664
11. Contract or Grant No.
12. Sponsoring Organization Name and Address 13. Type of Report and Period Covered
Iowa Department of Transportation
800 Lincoln Way
Ames, IA 50010
Final Report
14. Sponsoring Agency Code
TSF-000-0(446)--92-00
15. Supplementary Notes
Visit https://intrans.iastate.edu/ for color pdfs of this and other research reports.
16. Abstract
The Iowa Department of Transportation (DOT) consumes data from multiple streams that are stored to assist in better decision-
making. Despite access to unprecedented amounts of data, decision-makers are often restricted in their ability to explore multiple
data sets. This research demonstrated a simple proof-of-concept architecture that addresses some of the constraints on decision-
makers but also opens up additional data sets for the Iowa DOT or other researchers to explore without the additional time and
effort needed to integrate the data. Users can spend additional time analyzing the data rather than interpreting and processing the
raw data. Three data sets used for this demonstration include crash, INRIX probe, and weather data for the past five years.
The data integration methodology developed for both the weather and probe data is a multistep process with intermediate outputs
created along the way that are needed for later steps in the integration. Seven outputs were created that are all related back to the
crash data. The research team considered any potential output that may be beneficial for future integration efforts and outputted
those as separate tables for future use. The primary outputs of the integration process are the weather and probe data at the time of
the crash, which allow for the data to be joined directly with the crash data similar to other attributes collected or derived within
the crash data. For advanced analysis, a Python script was also developed that allows the probe and weather data to be extracted
for a configurable amount of time before and after each crash.
The Iowa DOT views this project as an initial effort to develop a system that enhances crash data reports by integrating additional
data sources. The ultimate goal is to have a system that allows any pertinent data sets to be readily available when evaluating
crashes and to be utilized within any safety and mobility decision-making. The work in this study has established a foundation to
simplify the efforts to integrate additional data sources by associating the crash data to the Iowa DOT’s linear referencing system
(LRS).
17. Key Words 18. Distribution Statement
crash analysis—crash safety tool—data integration—probe data—roadway
asset management system—traffic safety—weather data
No restrictions.
19. Security Classification (of this
report)
20. Security Classification (of this
page)
21. No. of Pages 22. Price
Unclassified. Unclassified. 53 NA
Form DOT F 1700.7 (8-72) Reproduction of completed page authorized


DEVELOPING AN ARCHITECTURE TO
INTEGRATE SAFETY, MOBILITY, AND TRAFFIC
DATA
Final Report
June 2021
Principal Investigator
Skylar Knickerbocker, Research Engineer
Center for Transportation Research and Education, Iowa State University
Research Assistant
Sudesh Bhagat
Authors
Skylar Knickerbocker, Sudesh Bhagat, Zach Hans, and Anuj Sharma
Sponsored by
Iowa Department of Transportation
Preparation of this report was financed in part
through funds provided by the Iowa Department of Transportation
through its Research Management Agreement with the
Institute for Transportation
(InTrans Project 18-676)
A report from
Institute for Transportation
Iowa State University
2711 South Loop Drive, Suite 4700
Ames, IA 50010-8664
Phone: 515-294-8103 / Fax: 515-294-0467
https://intrans.iastate.edu/


v
TABLE OF CONTENTS
ACKNOWLEDGMENTS ............................................................................................................ vii
EXECUTIVE SUMMARY ........................................................................................................... ix
Purpose and Background ................................................................................................... ix Findings.............................................................................................................................. ix Conclusions ........................................................................................................................ xi
INTRODUCTION ...........................................................................................................................1
Objectives ............................................................................................................................2
LITERATURE REVIEW ................................................................................................................3
Weather and Traffic Data Integration Efforts ......................................................................3 Benefits of Integrating Additional Weather Data ................................................................4
Benefits of Integrating Traffic Data .....................................................................................4 Summary ..............................................................................................................................5
DATA SOURCES ...........................................................................................................................7
Crash Data ............................................................................................................................7 Weather Data .......................................................................................................................7
Probe Data ............................................................................................................................8 RAMS Data ..........................................................................................................................9
DATA INTEGRATION METHODOLOGY ................................................................................10
Date Integration Outputs ....................................................................................................10
Data Integration Process ....................................................................................................14
FINDINGS .....................................................................................................................................28
SUMMARY AND CONCLUSIONS ............................................................................................37
REFERENCES ..............................................................................................................................41

vi
LIST OF FIGURES
Figure 1. Grid resolution for an area around Ames .........................................................................8
Figure 2. Overview of the outputs of the data integration process ................................................10
Figure 3. Weather grid and crash data points ................................................................................16 Figure 4. Issues with crashes located on single centerline.............................................................20 Figure 5. Identifying routes within 70 m of crash .........................................................................21 Figure 6. Final output of the RAMS route ranking process ...........................................................25
Figure 7. Data integration of safety tool ........................................................................................28
Figure 8. Example of crash data in safety tool...............................................................................29 Figure 9. Example of tooltip and selecting data in safety tool .......................................................30 Figure 10. Precipitation types for crashes coded by officers as snow related ...............................31 Figure 11. Comparison of road and air temperature reported for each crash ................................31 Figure 12. Wind direction compared to road bearing summary ....................................................32
Figure 13. Summary of slowdown time for secondary crashes .....................................................33 Figure 14. Crash speeds ranges as compared to the speed limit ....................................................34 Figure 15. Weather data before and after a single crash ................................................................35 Figure 16. Probe data before and after the crash ...........................................................................36
LIST OF TABLES
Table 1. Different traffic operations related data sources ................................................................1 Table 2. Coded values for ptype field ............................................................................................12
Table 3. Iowa LRS network route identifier structure ...................................................................21
Table 4. Cardinal direction domains ..............................................................................................22 Table 5. LaneDir domains..............................................................................................................23 Table 6. InitDir domains ................................................................................................................23 Table 7. Output of crash, vehicle, and route data for ranking .......................................................24 Table 8. Example of removing records after initial ranking ..........................................................24
Table 9. XD segment version data ranges .....................................................................................26

vii
ACKNOWLEDGMENTS
The authors would like to thank the Iowa Department of Transportation (DOT) for sponsoring
this research. The team acknowledges the contributions made by Iowa DOT Traffic and Safety
Bureau and Traffic Operations Bureau staff, including Willy Sorenson, Sinclair Stolle, Angela
Poole, Adam Shell, Tim Simodynes, and numerous other staff members.


ix
EXECUTIVE SUMMARY
Purpose and Background
The Iowa Department of Transportation (DOT) consumes data from multiple streams that are
stored to assist in better decision-making. Despite access to unprecedented amounts of data,
decision-makers are often restricted in their ability to explore multiple data sets. In general, pre-
canned reports are serially produced from individual sources of data and circulated to decision-
makers without providing a comprehensive picture of the issue. Under the present setup, a simple
query, such as how many crashes occur during congested conditions, cannot be answered easily
and requires a dedicated research project. There are three main reasons for the inability of
decision-makers to easily query mobility and safety trends, which are as follows:
• Current data architecture restricts queries across data sources.
• Data manipulation is not distributed and hence takes a significant amount of time for even a
simple aggregate query, such as average snowfall per county for a given year.
• Lack of easy to visualize or natural-language based querying tool. It requires an expert to
create complex programs to answer these simple questions, thus restricting decision-makers
to answering a few critical questions rather than having an ability to query the whole
database
This research demonstrated a simple proof-of-concept architecture that addresses some of the
constraints on decision-makers but also opens up additional data sets for the Iowa DOT or other
researchers to explore without the additional time and effort needed to integrate the data. Users
can spend additional time analyzing the data rather than interpreting and processing the raw data.
Three data sets were used for this demonstration that include crash, INRIX probe, and weather
data for the past five years. The weather data utilized expands current capabilities beyond the
existing research by using a grid across the entire state, allowing weather estimates statewide
rather than the localized area surrounding a weather station. The demonstration architecture
includes the following benefits over the existing system:
• Data from multiple sources are saved in a format that leads to extended ability to query
across these data sources. Thus, queries, such as how many crashes occurred during snow
and congested conditions, should be easy to perform.
• High-performance computing systems are used to store and manipulate the data, and hence
the data processing time will be significantly reduced.
• The data set is available for visual queries. Decision-makers can visually filter and explore
the data using a dashboard developed for the project.
Findings
The size of the weather and probe data can potentially exceed 20 TB in size over the five-year
period analyzed for this project. The weather data consists of 61,395,552 records a day, while the
probe data can reach over 72,000,000 records a day. With the size of data available, it is critical

x
to develop systems that can automate the process of integrating and extracting the appropriate
data. By implementing the processes described in this report, data can be made available to a
larger user group that may not have the ability to extract the data themselves or do not regularly
use the data to understand the nuances that must be considered when integrating the data.
The data integration methodology developed for both the weather and probe data is a multistep
process with intermediate outputs created along the way that are needed for later steps in the
integration. Seven outputs were created that are all related back to the crash data. The research
team considered any potential output that may be beneficial for future integration efforts and
outputted those as separate tables for future use. The primary outputs of the integration process
are the weather and probe data at the time of the crash, which allow for the data to be joined
directly with the crash data similar to other attributes collected or derived within the crash data.
For advanced analysis, a Python script was also developed that allows the probe and weather
data to be extracted for a configurable amount of time before and after each crash.
Crash and Weather Data Integration Process
The process of integrating crash and weather data focused on reporting weather conditions based
on radar, weather models, and weather networks that can better estimate the conditions at the
time of the crash. The weather data also introduced quantitative variables that can be utilized as
compared to the existing qualitative variables in the crash data. The weather data provided a
simple integration using a 0.01 decimal degree grid across the state to associate with each crash.
Additional effort was needed to develop a storage and extraction system that allowed for fast and
cost-effective querying. To achieve this, the size of the data was reduced through multiple
methods: the data were partitioned to allow for better grouping of the data, and a big data
querying service was utilized in Amazon Athena.
Crash and Probe Data Integration Process
Crash data are further limited in the ability to report traffic conditions at the time of a crash as
compared to the weather data. Only a handful of fields are available in the crash data, which
allow reporting traffic impacts with no single field directly reporting the traffic conditions. Probe
data allow for expanded access to speed data that can be utilized with crash data to understand
the speed at the time of a crash.
The crash and probe data integration required additional consideration as compared to the
weather data due to the nature of how crashes occur on roadways and how probe data contains
data for both directions of travel. In addition to these challenges, additional consideration was
given to creating an integration method that can be utilized for other future integration. Instead of
a simple spatial analysis identifying the nearest probe data segment to the crash, the crash and
probe data segments were both related to the linear referencing system (LRS) for integration.
This will simplify the process for integrating the crash data with other data related to the Iowa
DOT Roadway Asset Management System (RAMS) in the future.

xi
Crash Safety Tool
After developing the integration engine, a prototype online safety and operations evaluation tool
was developed to explore the interactions between the crash, weather, and probe data. Methods
of analyzing the data were explored to show the potential benefits of using the integration
engine, but it is expected that future research efforts will be utilized to further explore and
understand these relationships.
The online safety tool was developed similar to other safety data visualization at the Institute for
Transportation (InTrans). The tool was developed in Tableau, which allows users to explore the
data interactively by selecting charts and filtering the data to understand relationships between
the various attributes. In total, 16 pages were created as part of the dashboard that includes
commonly utilized attributes from the crash, weather, and probe data. The data utilized in the
dashboard included the weather integration output and probe data integration output described in
the previous section. The before/after crash outputs were also evaluated as part of a separate tool.
Conclusions
The current research literature shows that there is value in using weather and traffic data within
safety analysis due to the impact these factors have on crashes. However, most literature shows
that researchers often had to aggregate data sets, used a variety of different integration processes,
and likely spent a considerable amount of time integrating the data. The architecture in this
report identified the various data sets needed to support crash, weather, and traffic analysis and
then developed a process to extract the data. The considerable size of the data required
developing a pipeline that allowed the data to be stored cost-effectively while also reducing the
time to query the data sets. The created outputs from these processes assign the attributes for the
related weather and probe data to each crash, which can then be treated like all other crash data
within Iowa.
The Iowa DOT views this project as an initial effort to develop a system that enhances crash data
reports by integrating additional data sources. The ultimate goal is to have a system that allows
any pertinent data sets to be readily available when evaluating crashes and to be utilized within
any safety and mobility decision-making. The work in this study has established a foundation to
simplify the efforts to integrate additional data sources by associating the crash data to the Iowa
DOT’s LRS.
Additional data sets that can be used to enhance the crash data or used in future research based
on input from the Iowa DOT and other relevant stakeholders include the following:
• Advanced Traffic Management System
• Snowplow automatic vehicle location (AVL)
• Winter road conditions
• Traffic and road weather snapshot and videos
• Pavement condition data

xii
• Intersections
• Work zones
Future enhancements can be made to the architecture developed in this project to allow for
additional summary statistics to be created for each crash as well as the ability to extract
additional data for nearby road segments or weather grids. The summary statistics can include
information such as the amount of precipitation for a defined amount of time before the crash,
whether speeds were trending up or down before the crash, and whether speeds were impacted
after the crash. The summary statistics can provide additional attributes but would require
additional workflows to extract and summarize these data for other users. Limitations also exist
within the architecture for understanding the impacts on traffic upstream and downstream of the
crash. The current process can be modified to support extracting additional probe data for nearby
segments. Finally, the weather data provided by the Iowa Environmental Mesonet also includes
weather forecasts every six hours based on the same grid and attributes. The forecast data have
not been explored fully and may have benefits in some applications.
Overall, the proof-of-concept architecture that was developed provides an initial step in
integrating crash, weather, and traffic data for more widespread use within Iowa. It is expected
that the integration of data will continue to expand in Iowa, opening up the use of additional data
for more users.
1
INTRODUCTION
The Iowa Department of Transportation (DOT) consumes data from multiple streams that are
stored to assist in better decision-making. The ideal scenario would be to have all of the data
easily integrated so that users have all the information at their fingertips to make decisions that
can improve safety or mobility. However, this is often not the case due to the storage of data in
silos across an agency. The effort is compounded by the size and availability of different data
sources. Most users do not have the time or resources to dig through the amounts of data that are
available to find the relevant information that is needed.
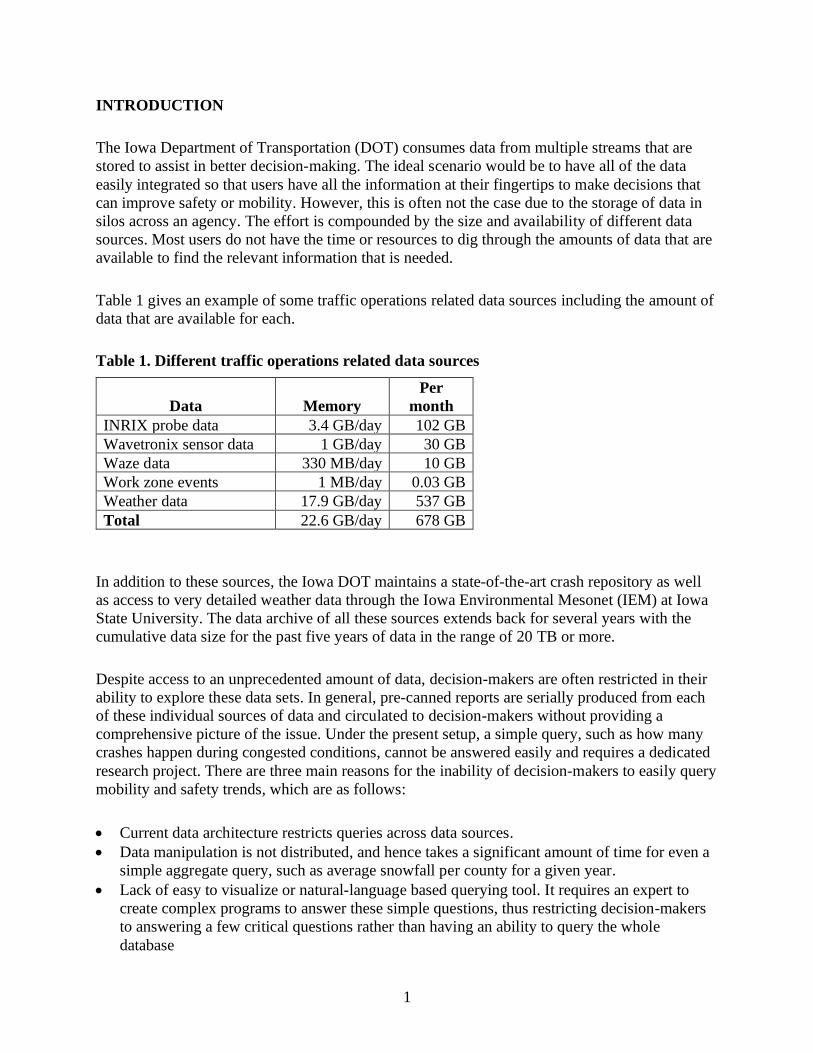
Table 1 gives an example of some traffic operations related data sources including the amount of
data that are available for each.
Table 1. Different traffic operations related data sources
Data Memory
Per
month
INRIX probe data 3.4 GB/day 102 GB
Wavetronix sensor data 1 GB/day 30 GB
Waze data 330 MB/day 10 GB
Work zone events 1 MB/day 0.03 GB
Weather data 17.9 GB/day 537 GB
Total 22.6 GB/day 678 GB
In addition to these sources, the Iowa DOT maintains a state-of-the-art crash repository as well
as access to very detailed weather data through the Iowa Environmental Mesonet (IEM) at Iowa
State University. The data archive of all these sources extends back for several years with the
cumulative data size for the past five years of data in the range of 20 TB or more.
Despite access to an unprecedented amount of data, decision-makers are often restricted in their
ability to explore these data sets. In general, pre-canned reports are serially produced from each
of these individual sources of data and circulated to decision-makers without providing a
comprehensive picture of the issue. Under the present setup, a simple query, such as how many
crashes happen during congested conditions, cannot be answered easily and requires a dedicated
research project. There are three main reasons for the inability of decision-makers to easily query
mobility and safety trends, which are as follows:
• Current data architecture restricts queries across data sources.
• Data manipulation is not distributed, and hence takes a significant amount of time for even a
simple aggregate query, such as average snowfall per county for a given year.
• Lack of easy to visualize or natural-language based querying tool. It requires an expert to
create complex programs to answer these simple questions, thus restricting decision-makers
to answering a few critical questions rather than having an ability to query the whole
database

2
This research demonstrates a simple proof-of-concept architecture that addresses some of the
constraints on decision-makers but also opens up additional data sets for the Iowa DOT or other
researchers to explore without the additional time and effort it takes to integrate the data. Users
can spend additional time analyzing the data rather than interpreting and processing the raw data.
Three data sets were used for this demonstration that include crash, INRIX probe, and weather
data for the past five years. The demonstration architecture includes the following benefits over
the existing system:
• Data from multiple sources are saved in a format that leads to an extended ability to query
across these data sources. Thus, queries, such as how many crashes occurred during snow
and congested conditions, should be easy to perform.
• High-performance computing systems are used to store and manipulate the data, and hence
the data processing time will be significantly reduced.
• The data set is available for visual queries. Decision-makers can visually filter and explore
the data using a dashboard developed for the project.
Objectives
This project focused on enhancing the available crash data by developing a proof-of-concept
architecture to integrate mobility and weather data. Processes were developed that allow for easy
integration of weather and probe data with crash information that can support the determination
of what role weather and traffic play in vehicle crashes. The processes allow for weather
conditions at the time of the crash to be reported including quantitative variables, such as the
amount of precipitation, road temperatures, and rainfall rates. Traffic conditions at the time of
the crash are also available including the speed along the roadway, the speed in the opposite
direction of travel, and the historical average speed at the crash location. For advanced analysis,
the processes are customizable, which allows users to dynamically enter durations before and
after the crash to extract the relevant probe and weather data. To support future efforts, the
project team also integrated crash data with the Iowa DOT’s linear referencing system (LRS).
This additional work allows for easier integration of data sets across the Iowa DOT using a
common network for associating data sets. This research is expected to serve as the foundation
for integrating additional data sets with historical crash data and a concept that can be
implemented for additional data sets.
Once the architecture was developed, possible uses of the data were explored, including
calculating the amount of precipitation on the roadway directly before the crash, the traffic
conditions leading up to the crash, and estimating the impacts the crash had on traffic. A basic
analysis was also completed to compare the existing weather data reported from the crash report
to the additional detailed information in the weather data.

3
LITERATURE REVIEW
Crash data are typically self-contained and don’t incorporate data from other sources natively. In
Iowa, crash data are limited to the information reported by law enforcement officers in crash
reports as well as some roadway information based on how the crash is geo-located, including
speed limit, system type, and rural/urban. Additional enhancements can be made to crash data to
incorporate other data sources. Multiple research efforts have shown the value of integrating
additional data sets including weather and probe data, which are described in this chapter.
However, integrating the data presents multiple challenges and barriers that many agencies and
researchers face. Das et al. (2021) stated, “Key challenges include simplified models are
preferred for ease of interpretation and usability, access to quality data of the type and quantity
needed for a robust study is expensive, and sufficient analytical expertise for both the analyst and
user may not be present.” Efforts are needed within an agency to improve data integration
processes to reduce the cost of using quality data and allow users to focus on the analytical
expertise needed for more robust analysis. Without these improved efforts, Das et al. (2021)
described how simplified data can produce fundamentally flawed model predictions because
critically important variables are omitted or only partially captured. This can lead to decisions
with good intentions but based on insufficient information.
Weather and Traffic Data Integration Efforts
Various other research efforts have integrated weather and traffic data to support safety related
research. Malin et al. (2019) integrated weather data with crash data in Finland. The research
team purchased weather data that included variables, such as road surface temperature, wind
direction, and road weather code. The weather reported was based on weather stations near each
of the crashes.
In Kansas, Tobin et al. (2021) also related crash data to Automated Surface Observing System
(ASOS) and Automated Weather Observing System (AWOS) stations but were limited by the
number of counties with sites providing the precipitation type data needed for the study. The
team found105 counties in Kansas had precipitation type crashes identified but only 42 counties
had an ASOS/AWOS station, with varying levels of accuracy.
In Florida, AWOS data were evaluated to provide real-time visibility by Ahmed et al. (2014).
The weather station data reported hourly were identified as a good predictor to assess safety on a
highway but was limited to 5 nautical miles from the station. Chung et al. (2018) expanded on
this effort to assess the viability of using Quality Controlled Climatological Data (QCLCD) by
relating fatality crashes to weather stations within 20 mi nationwide. The study validated the
reliability of the weather data for up to 20 mi from the station. Fatal crashes were the focus of the
analysis, with 75% of crashes occurring within 20 mi of a weather station.

4
Cheng et al. (2017) utilized weather data for evaluating motorcycle crashes using Weather
Underground, which obtains data from a variety of weather stations including personal weather
stations. The data provided daily summaries of the weather data but were limited to a single city.
One suggestion from Theofilatos and Yannis (2014) about the gaps in weather and safety
research was a recommendation on using interpolation methods with weather data for evaluating
quantitative weather parameters, which can reduce the need to associate crashes with a specific
sensor.
Benefits of Integrating Additional Weather Data
The research shows there are potential benefits to integrating additional weather data outside of
what are reported in the crash data. Weather data have the ability to provide quantitative
variables as well as more descriptive attributes about the weather conditions. In a majority of the
research, individual weather stations were the typical method of identifying weather related data
to supplement crash data. The limitation of this approach is the influence area of the station in
representing the weather conditions at the location of the crash.
Additionally, based on the research, it appears that the data for a single sensor are typically
associated to a crash based on proximity. In locations equidistant from two sensors, there does
not appear to be any consideration of interpolating between the sensors or analyzing which
station most likely represents the weather conditions at the crash location. Research efforts to
integrate weather data and crash data were either developed or completed as part of individual
projects, meaning they were not derived based on an existing system for extracting the data.
Because of this, most of the research was limited to feasibility studies and/or assessments or
were only completed for a subset of the data due to the limited availability of weather stations.
The final limitation with the existing research is based on the granularity of weather data. All
research efforts utilized hourly or greater aggregations of weather data. Localized or quick-
moving weather events may not be captured accurately based on hourly or daily level
summaries. Crashes directly before a winter storm or a heavy rainfall event may be aggregated
with data that are summarized over an hour or day and that do not capture the actual conditions
at the time of the crash.
This research project attempts to address some of the limitations uncovered in previous research
by extracting weather data for all crashes based on weather data sources, reducing the effort to
obtain the weather data by aggregating data from various sources and providing five-minute
aggregates of the data.
Benefits of Integrating Traffic Data
Using traffic data, such as probe data, to get operating speeds at the time of a crash is limited,
and to date most research evaluating speed has used point detectors or other data collection
methods. The increased availability of probe data has allowed for additional usage of these data

5
into safety analysis, which in turn allows for more widespread analysis due to the greater
coverage probe data provides in comparison to traditional data collection methods.
Ederer et al. (2020) used network conflation to relate data together based on a common network.
A traffic message channel (TMC) network was used as the base network, with roadway features
and crashes assigned to a given TMC segment. This was completed for a 72 mi stretch of
roadway. The conflation process included validating the data based on route names. The crash
data would be assigned a TMC if it was within 100 ft of the corridor and was verified as
occurring on the route. This process is fairly comprehensive but provides limited future
integration, as it is defined based on a network that may change over time instead of relating to a
state DOT network, which has greater control over managing network-level changes.
Dutta and Fontaine (2019) discussed the difficulty in matching crash data with traffic data and
evaluated the relationship various traffic data sources and aggregation levels have on crashes.
The study found that using probe data increased the rural model performance by 10% and the
urban model by 20%. Although the results are lower than using a continuous count station, the
increased availability of probe data can be utilized on a larger scale for future efforts. Dutta and
Fontaine (2020) also integrated probe vehicle data into their crash analysis and found that their
model accuracy improved when speed attributes were added. Both efforts by Dutta and Fontaine
utilized hourly and 15 minute speed aggregations for developing the crash models.
Hans et al. (2018) incorporated both traffic speed and weather data when evaluating winter
weather crashes. The study investigated the potential use of other data sets, such as camera
images and probe data, when evaluating winter weather events. When evaluating the probe data,
each crash was associated with a TMC segment based on the crash timestamp. The 1 minute
speed data were then extracted 60 minutes before and after the crash. The probe data were only
utilized for evaluating crashes due to the large variations in speed and speed patterns. The data
presented opportunities for future efforts evaluating traffic conditions. Road weather information
system (RWIS) and Cooperative Observer Program (COOP) stations were used by associating
each site to a crash based on proximity or based on reference post. The daily and annual snowfall
data were utilized in developing safety performance functions based on reference posts.
Summary
Opportunities exist to utilize weather and probe traffic data to understand the impacts on crashes.
Data for both sources have utilized aggregated methods for analysis or made assumptions when
extracting data or relating to other data sources. Most efforts to date have spent a significant
portion of the research on developing integration methods with slight differences depending on
the type of data sources and the availability of data.
This research project has developed a proof-of-concept data architecture that allows for easier
extraction of both weather and probe data in Iowa. The architecture will support future research
and analysis by providing a uniform method of associating crash data to other sources and
providing methods of extracting additional data sources. As part of the integration outputs,
attributes from both the weather and probe data are assigned to each crash that can be treated like

6
all other data within the Iowa crash database. This allows for novice users or basic analysis to
utilize weather and probe data with no additional effort.
Additional processes will be established that allow for easy extraction of additional data before
and after the crash that can be utilized in more advanced analysis. This effort focuses on the
integration process and creating the pipelines to extract the data but will show some potential use
cases of the data. It is expected that future research will utilize the data output and process to
improve weather, traffic, and crash related efforts moving forward.

7
DATA SOURCES
This chapter provides an overview of the data sources identified and used for integration. The
data sources focus on the ability to provide actual conditions of the traffic and weather at the
time of the crash. The data sets include the following:
• Iowa DOT crash data
• Weather data provided by the IEM
• INRIX probe data
• Iowa DOT Roadway Asset Management System (RAMS)
This project focused on all crashes statewide and provided any additional traffic or weather data
that were available. Only crashes after 2015 were considered, due to the changes in reporting on
the crash form in 2015. For the weather and crash integration, data were available for all crashes
based on the availability of the data from the IEM. For the probe data and crash integration, the
probe data from INRIX was only available on a subset of roadways—all primary roadways plus
some additional roadways—so not all crashes had traffic information available.
Crash Data
The Iowa DOT crash database was provided by the Traffic and Safety Bureau and includes all
crashes reported on public roadways resulting in an injury or minimum property damage of at
least $1,500. The crash data includes multiple levels of information including crash-level
information, vehicle-level information, and person-level information. For this effort, only crash-
and vehicle-level information were used for integration. The crash data primarily uses data
inputted in the crash report but also include derived data elements.
The way crash locations are geocoded can present challenges when integrating with other data
sources. Crashes are geocoded in Iowa using an Incident Location Tool (ILT) within the Traffic
and Criminal Software (TraCS) used by law enforcement agencies. The current ILT utilizes the
Geographic Information Management System (GIMS) network, which represents all roadways in
Iowa as a single centerline and not directional. Before 2017, GIMS was the primary asset
management system in Iowa. Starting in 2017, the Iowa DOT moved to the RAMS, which allows
for divided roadways but has not been fully implemented as part of the TraCS. Beginning in
2021, some law enforcement agencies have begun using the ILT that utilizes RAMS. This
difference in geocoding presents challenges for users wanting to use RAMS as the integration
methodology because only a small subset of the data is available.
Weather Data
The Iowa DOT and the Institute for Transportation (InTrans) worked with the IEM, a group that
collects and archives weather from cooperating members with weather observing networks, to
create an archive of weather data that can be used for transportation related research. Throughout
the literature review, researchers have used weather station data but were limited in interpolating

8
data between sensors or easily identifying the station representing a given location. As part of the
coordination with the IEM, a grid across the entire state of Iowa was created and a process was
developed to archive the weather data for each grid every five minutes. The grid across the state
is represented as simple rectangles with a resolution of 0.01 decimal degrees in both directions.
Figure 1 shows a map of the grid in the Ames area, where each black square represents a grid
where weather data are reported.
Figure 1. Grid resolution for an area around Ames
The weather data archived every five minutes comes from a variety of sources including the
National Weather Service (NWS), the National Oceanic and Atmospheric Administration’s
(NOAA’s) Multi-Radar/Multi-Sensor System (MRMS), the Federal Aviation Administration
(FAA) weather stations, the Iowa DOT RWISs, the NWS COOP, and the Iowa State University
Soil Moisture Network. The source of each data element is described in the actual weather output
in the Data Integration Methodology chapter of this report.
The weather data are delivered as zipped JavaScript Object Notation (JSON) formatted files and
uploaded to a file server. The extracted size of the data averages 17.9 GB per day and contains
61,395,552 records. Because of the size of the data, the weather data are difficult to work with
and processes are needed to extract the relevant information.
Probe Data
The Iowa DOT currently procures probe data through INRIX. Probe data uses crowdsourced
probe vehicles to estimate the vehicle speeds along a given section of roadway. This service
provides traffic speed data every minute along a subset of the roadways in Iowa, including all
primary roadways. The segmentation currently used by INRIX is XD Segmentation, which
attempts to create roughly 1 mi long segments across the state. The segmentation is based on
logical breaks in facilities where changes in traffic conditions may exist, including interchanges

9
or major at-grade intersections. The XD segmentation is proprietary but provides greater
resolution than TMC segments. For each minute, INRIX provides the current speed, the
historical average speed, a free-flow speed, travel time, and data confidence scores for each
segment across the state. These data are archived and available for integration with other data
sources for analysis or performance reporting.
RAMS Data
Integrating data across the Iowa DOT and other agencies typically utilize an LRS. An LRS
allows for data to be integrated based on a common network without any additional spatial
analysis. The Iowa DOT LRS is part of the RAMS in Iowa and includes additional roadway
features, such as the number of lanes, speed limit, and annual average daily traffic (AADT). In
Iowa, the LRS is commonly referred to as RAMS. The RAMS network was utilized in this effort
to integrate the crash and probe data but will also allow for additional integration in the future
with minimal effort.
The LRS provides complete information for all roadways in Iowa and is managed through a
Geographic Information System (GIS) interface. Coordinates can be passed to the LRS through a
representational state transfer (REST) service that conflates the data to the network and returns a
RouteID and Measure for all routes within a defined distance. The RouteID and Measure values
are fundamental to locating the data spatially as well as integrating across data sources. RouteID
represents the route the location is on, and Measure represents the distance along the route. The
RouteID and Measure values obtained by conflating can be used through a database function to
relate other spatial data without the computational expense for similar GIS related tasks.
One challenge when working with RAMS is that all routes are included in the network, but asset
information is only associated with the most dominant route along the roadway. For example, if
two interstates are signed along the same stretch of roadway, both routes will be present along
the roadway but only one of the routes will be the dominant route that contains the asset
information. When integrating data, route dominance must be factored into the assignment
priority to ensure data can be integrated with other data sources.

10
DATA INTEGRATION METHODOLOGY
With the size of data available from both the probe and weather data, it is critical to develop
systems that can automate the process of integrating and extracting the appropriate data. By
implementing the processes described in this report, data can be made available to a larger user
group that may not have the ability to extract the data themselves or regularly use the data to
understand the nuances that must be considered when integrating the data. The outputs of the
process ensure consistent integration across various research and other efforts within the Iowa
DOT. This chapter describes the process used to integrate the data, which can serve as a proof-
of-concept on data integration efforts within the Iowa DOT on a system wide basis and an
example for future data integration with crash data.
This chapter is divided into two parts. The first part describes the outputs created as part of the
data integration. Each of the outputs is described in detail including a description of all fields
included in the outputs. The second part of this chapter describes in detail the process used to
integrate the crash, weather, and probe data.
Date Integration Outputs
The data integration methodology for both the weather and probe data is a multistep process with
intermediate outputs created along the way that are needed for later steps in the integration.
Some intermediate outputs have value outside of the integration process described in this report
and are archived to support other integration efforts in the future. Figure 2 provides a high-level
overview of the seven outputs created and how each of those are related back to the crash data.
Figure 2. Overview of the outputs of the data integration process
Crash Data
Weather Integration
Output
Actual Weather Output
Actual Weather Before/After
Crash
RAMS Integration
Output
Probe Data Integration
Output
Probe Data Output
Probe Data Before/After
Crash

11
The weather and crash data provide three outputs. The first output creates an integration layer
between the unique identifiers for the crash data with the unique identifiers for the weather data.
This integration layer is then used when extracting the weather data to create the actual weather
output, which includes the weather at the time of the crash, and the actual weather before/after
crash, which includes the weather for a configurable amount of time before and after the crash.
The RAMS integration output in Figure 2 is an example of an intermediate output that does not
specifically relate to either the crash or probe data. The output provides the RouteID and
Measure value for each crash along the LRS network and will be beneficial for any future efforts
that utilize the LRS for integration without the need of re-conflating the crash data to the LRS.
Any other intermediate outputs that could have use in the future were retained and described
within this section.
Weather Integration Output
The weather integration output identifies the relationship between the crash data and the weather
grid developed by the IEM. Each of the 0.01 decimal degree rectangles in the weather grid are
assigned a unique identifier named gid. The gid is then associated to the unique CRASH_KEY
identifier in the crash data. The output of this process represents a one-to-one relationship
between the unique identifiers. The following fields are included in the output:
• CRASH_KEY – The unique identifier to relate back to the crash data.
• gid – The unique identifier for the weather data based on a simple rectangular grid of the
state of Iowa. Each grid rectangle has a resolution of 0.01 degrees in both directions.
• DateTime – The timestamp reported for the crash.
Actual Weather Output
The actual weather output extracts the weather data at the time of the crash. This output uses the
weather integration output to pull the weather data for the given gid at the time of the crash. The
weather data are available every five minutes, so the crash time is rounded to the nearest five-
minute time period for extraction. The following describes the fields provided in the weather
data from the IEM and associated to each crash:
• CRASH_KEY – The unique identifier to relate back to the crash data.
• gid – The unique identifier for the weather data based on a simple rectangular grid of the
state of Iowa. Each grid rectangle has a resolution of 0.01 degrees in both directions.
• wawa – These are watches, warnings, and advisories issued by the NWS. These alerts do not
cover all alert types issued by the NWS, just those that contain a special coding called Valid
Time Event Code (VTEC).
• ptype – This field is directly generated from the NOAA MRMS project. The integer codes in
Table 2 present the state of precipitation being estimated by radar and model algorithms.

12
Table 2. Coded values for ptype field
Code Value
-3 no coverage
0 no precipitation
1 warm stratiform rain
2 warm stratiform rain
3 snow
4 snow
5 reserved for future use
6 convective rain
7 rain mixed with hail
8 reserved for future use
9 flag no longer used
10 cold stratiform rain
91 tropical/stratiform rain mix
96 tropical/convective rain mix
• tmpc – Two meter above ground level air temperature. This value would be over a typical
landscape for the location and not necessarily concrete, except in very urban areas. Units are
Celsius.
• dwpc – Two meter above ground level dew point temperature. As with tmpc, the same
landscape assumptions apply. Units are Celsius.
• smps – Ten meter above ground level wind speed. This speed does not include gusts but is
some average over a couple of minute period. Units are meters per second.
• drct – Wind direction, where the wind is blowing from, at 10 m above ground level. Units
are degrees from North.
• vsby – Horizontal visibility from automated sensors. Units are kilometers.
• roadtmpc – Pavement surface temperature derived from available RWIS reports. These
reports include both bridge and approach deck temperatures. Units are Celsius.
• srad - Photoactive global solar radiation, sometimes called shortwave down. Units are watts
per meter squared.
• snwd – Snowfall depth analyzed once per day at approximately 7 a.m. local time. If the
reported snowfall depth was zero at 7 a.m., and it started snowing at noon, this field would
still be zero until it updated the next day at 7 a.m. Units are millimeters.
• pcpn – Five minute precipitation accumulation ending at the time of analysis. This is liquid
equivalent. Snow and sleet are melted to derive this value. Units are millimeters
accumulation over those five minutes.
• cst-time – The timestamp of the weather data reported in local Central Time for easier
integration with other data sets.

13
Actual Weather Before/After Crash Output
For some analysis, additional weather data before and after the crash event are needed. This can
be used to understand the weather impacts leading up to the crash or for better refining the
weather at the time of the crash, since the reported crash time is an estimate.
A separate process was developed for more advanced analysis that allows for users to enter the
amount of time before or after the crash and return the weather data during that time period. The
output fields from this process are the same as the actual weather output but result in a one-to-
many relationship with the crash data. The number of records returned will depend on the
amount of time before and after the crash requested by the user. All five-minute time periods
within the defined time before and after the crash will be returned. The cst-time field can be
compared with the crash timestamp to determine the amount of time before or after the crash the
weather data represents.
RAMS Integration Output
The RAMS integration output identifies the relationship between the crash data and the Iowa
DOT LRS, referred to as RAMS. By relating the crash data to the LRS, multiple other data
sources can be integrated with the crash data in the future based on a simple linear overlay. The
output of this process represents a one-to-one relationship with each crash given a RouteID and
Measure for the dominant route it is comparable with. It is expected that future crashes will have
the RouteID and Measure collected as part of the crash reports once the RAMS-based ILT is
fully implemented. The following fields are included in this output:
• CRASH_KEY – The unique identifier to relate back to the crash data
• RouteID –The route identifier for the Iowa DOT’s LRS
• Measure –The measure along the route for the given route in the Iowa DOT’s LRS
Probe Data Integration Output
The probe data integration output identifies the relationship between the crash data and probe
data. The probe data XD segments are related to the Iowa DOT’s LRS, which can be used in
coordination with the RAMS integration output to perform a linear overlay. The linear overlay
compares RouteID and Measure values within both data sets to determine where overlaps occur.
The overlay results in each crash key unique identifier being associated with unique identifiers
for the INRIX XD segments. The output of this process represents a one-to-many relationship as
both directions of travel in the probe data can be present along the roadway. The following fields
are included in this output:
• CRASH_KEY – The unique identifier to relate back to the crash data
• XDSegID – The unique identifier for the INRIX probe data segment
• DateTime – The timestamp reported for the crash

14
Probe Data Output
This output uses the probe data integration output to pull the probe data for the given XDSegID
at the time of the crash. The probe data are archived every minute with the speed, historical
speed, average speed, etc. The output of this process is a one-to-many relationship because probe
data contains traffic data for both directions of travel. Because of the nature of crashes, both
directions of travel may be impacted and can be valuable for analysis. The following describes
the fields provided by INRIX and associated to each crash:
• CRASH_KEY – The unique identifier to relate back to the crash data.
• XDSegID – The unique identifier for the INRIX probe data segment.
• cvalue – The confidence value of the data from 0–100 when the data reported is real-time
(conf = 30).
• segmentclosed – Indicator if the road is reported as closed.
• conf – The score of the data to determine the source of the speed data. A score of 30
indicates real-time data, a score of 20 indicates the historical average speed, and a score of 10
indicates the reference speed.
• speed – The current speed along the roadway reported in miles per hour.
• average – The historical average speed for the given section of roadway based on the time of
day reported in miles per hour.
• ref_speed – The traffic speed under free-flow conditions in miles per hour.
• travelTime – The travel time along the segment in minutes.
• cst-time – The timestamp of the weather data reported in local Central Time for easier
integration with other data sets.
Probe Data Before/After Crash Output
Similar to the weather data before/after crash output, some advanced analysis may require
additional probe data to understand the traffic conditions before and/or after the crash or to
quantify the impacts the crash had on other motorists.
An additional process was developed that allows users to define the amount of time before
and/or after the crash, which then returns the probe data during that specified time. The output
fields from this process are the same as the probe data output. The probe data already contains a
one-to-many relationship with the crash data due to the multiple directions available in the probe
data, but additional outputs are created for each minute defined by the user when extracting the
data. The cst-time field can be compared with the crash timestamp to determine the amount of
time before or after the crash the probe data represents.
Data Integration Process
Integrating data can be a challenge due to the assumptions and limitations of each data source.
The challenges can be related to how the data are geo-located, the spatial coverage of the data, or
how the data are collected/derived. All of these must be considered when integrating data to

15
ensure that the data are correctly related for analysis. This section describes the integration effort
related to crash, weather, and probe data so that meaningful information is created that can
support weather and traffic related safety analysis. Two separate processes were created for data
integration including a process to integrate crash and weather data as well as a process to
integrate crash and probe data.
Crash and Weather Data Integration Process
The weather data reported within the crash data are limited to only a handful of fields that
describe in simple definitions the weather conditions, the road surface conditions, and any
environmental contributing circumstances. Each of these are limited in what information can be
provided, which in turn limits the amount of details differentiating a minor weather event from a
major weather event. These details as well as various other weather impacts can be utilized to
improve safety related models and analysis to capture potential contributing conditions to
crashes. In addition, the reports are subjective based on the law enforcement officer submitting
the form or what was relayed to the officer by the driver(s) involved in the crash.
The process of integrating crash and weather data focuses on reporting weather conditions based
on radar, weather models, and weather networks that can better estimate the conditions at the
time of the crash. The data also introduces quantitative variables that can be utilized as compared
to the existing qualitative variables in the crash data. The crash and weather data integration are
divided into four steps—which include the three weather related outputs described in the
previous section—and are described in this section.
Step 1: Combine Crash Data with Weather Shapefile
The initial step of integrating crash and weather data is a simple spatial relationship between any
crash point contained within the weather grid provided by the IEM. The output of the process
assigns a gid, the unique identifier for each weather grid, to each CRASH_KEY, which is the
unique identifier for each crash. Figure 3 shows an example of the crash data, represented as
points on the map, and the weather grid, which is represented by the black squares across the
map.

16
Figure 3. Weather grid and crash data points
Each of the crash points is assigned the gid that they fall within. The process creates a one-to-one
relationship between crash data and weather grid, with the exception of any crashes that are not
geo-located. The output of this process was described previously as the weather integration
output. This output is used in later steps in the process to extract the weather data but may have
other uses for future integration including extracting forecasted weather data or identifying
weather surrounding the crash based on the relationships within the weather grid. This process
was repeated for all crash data from 2015 through 2020.
Step 2: Extract Weather JSON Files
As described in the data description, the size of the weather data averages 17.9 GB per day and
generates 61,395,552 records per day. The weather data would extrapolate to around 6.5 TB per
year or 39 TB for the entire analysis period from 2015 through 2020. The data are initially stored
as zipped JSON files that cannot be queried for data extraction. To support the data integration
architecture, a process was established to extract these data on a daily basis back to 2015. As part
of this extraction, multiple factors were considered to increase the speed of queries including
reducing the size of the data, partitioning the data appropriately, and providing a query service to
work with the data that minimizes cost.
Two methods were used to decrease the size of the data. The first involved decreasing the
amount of records in the data sets by removing any grids that did not have an Iowa public
roadway within the grid. This removed any grids that were located in the middle of farmland,
lakes/rivers, or in surrounding states due to overlaps in Nebraska and Illinois. Multiple methods
were evaluated to remove grids, but the research team chose to keep only the grids with public
roadways so that the data could be used for any future efforts incorporating weather data related
to transportation research. By eliminating these grids, the size of the data was reduced to 10.1
GB per day. The second method of reducing the size of the data involved converting the data to a

17
Parquet format. Parquet is an open-source file format used within the Hadoop ecosystem and
designed to efficiently reduce storage size. After changing the file format, the size of data was
further reduced to 0.35 GB per day.
Reducing the size of the data has the value of increasing query speed, but additional partitioning
of the data can further reduce the time to query the data while also reducing cost. Partitioning
involves dividing the data into smaller components but grouping similar data together based on
common queries from users. This increases the query speed because all of the data does not need
to be scanned with each query. Instead, only the relevant partitions are scanned and queried,
reducing the time needed to return results. For the weather data, the data were partitioned by
month, day, and hour.
Finally, a query service was utilized that allows for fast and interactive queries of big data sets,
such as the weather data. To perform the queries, Amazon Athena was used, which is a
serverless query service that allows for SQL queries to extract data stored on Amazon S3. This
allowed the weather data to be stored similar to other traffic operations related data and allow for
easier querying of the data to identify weather at the time of a crash.
When working with cloud-based services, such as Amazon Athena, cost must be considered
throughout the process. The first cost that must be considered relates to the size of the data. By
reducing the amount of data stored and converting the data to the Parquet format, the amount of
data stored was reduced and allows for a longer duration of data to be retained. Most cloud
services charge based on the amount of data scanned for a given query as well. If the entire
database must be scanned for every query, then additional cost will be incurred. By partitioning
the data, Athena can be used to query only the relevant partitions, reducing the amount of data
scanned, which in turn reduces the total cost of each query.
When extracting the data from the JSON files, the original data from the IEM remains intact, but
additional fields are added for the three partitions as well as an additional field that converts the
coordinated universal time (UTC) timestamp to local Central Time to allow easier integration
with other data sources. All partitions of the weather data are also based on local Central Time.
Step 3: Join Weather and Crash Data at Time of Crash Files
With a relationship between the crash and weather grid established in Step 1 and the weather
data stored in a format that allows for querying of the database, a process was developed that
extracts the weather reported through the IEM grid analysis for the five-minute time period in
which the crash occurred. A simple Python script was used to query both the crash data and
weather data in Athena and then join the weather data to the crash data. Initial testing to optimize
the process was completed using PySpark and could be used in future efforts with larger data
sets.
The crash data are reported for the specific minute the crash occurred, while the weather data are
reported every five minutes. In most situations, the crash timestamp is an estimate of when the

18
crash occurred, and it was rounded to the nearest five-minute time period to extract the
corresponding weather data.
Once the join is complete, the actual weather output is created, which extracts all of the weather
data reported by the IEM for the corresponding crash key. This output is similar to other z-tables
as part of the crash data in Iowa and can be joined directly with the crash-level data for analysis.
The join is a one-to-one relationship, meaning the data can be used similar to all other available
fields in the crash data.
Step 4: Extract Additional Weather Data Before and After the Crash
Some users may require additional weather data before and/or after a crash. An additional
process was established that allows users to dynamically enter the number of minutes before or
after the crash to return additional weather data for analysis. For example, a user may want to
request weather data 30 minutes before a crash and 15 minutes after a crash. The users can enter
these values into the Python script and the corresponding 45 minutes of weather data will be
returned for each crash. The process uses the actual time of the crash instead of the timestamp
that was rounded to the nearest five-minute time period. The output corresponds to the actual
weather before/after crash output described previously.
Crash and Probe Data Integration Process
Crash data are limited in the ability to report the traffic conditions at the time of the crash. Iowa
only recently added a secondary crash field in 2018. Any additional traffic related information is
only a subset of a larger category, such as roadway contributing conditions. This means that it is
up to the law enforcement officers inputting the data to select the primary roadway contributing
condition, which includes other options, such as work zones, debris, and disabled vehicles.
Because of this, any actual impacts to traffic are not easily identifiable within the crash data.
Even with the given fields, the magnitude of the impact traffic had on the crash or the impact the
crash had on traffic is not conveyed in the crash report. There is no ability to identify whether the
traffic conditions at the time were recurring based on historical data or some other non-recurring
slowdown. The process of integrating crash and probe data focuses on reporting traffic
conditions based on readily available probe data in Iowa for all primary roadways in Iowa as
well as some additional major roadways. Similar to the weather data, the probe data reported
provides quantitative variables as compared to the limited qualitative variables in the crash data.
The crash and probe integration requires additional consideration as compared to the weather
data due to the nature of how crashes occur on roadways and how probe data contains data for
both directions of travel. In addition to these challenges, additional consideration was given to
creating an integration method that can be utilized for other future integration. Instead of a
simple spatial analysis identifying the nearest probe data segment to the crash, the crash and
probe data segments were both related to the LRS for integration. This will simplify the process
for integrating the crash data with other data related to RAMS in the future. The following steps

19
describe the process used to integrate the crash and probe data, which include the four RAMS
and probe data related outputs described in the previous section.
Step 1: Integrate Crash Data with the RAMS
Similar to most DOTs, the Iowa DOT utilizes an LRS, which allows the agency to manage assets
but also easily integrate data sources based on a common referencing system. To relate data to
the LRS, RAMS provides a REST service query using ESRI Roads and Highways where
coordinates can be entered, which then returns route identifiers and measure values within a
given distance. As described previously, the LRS was chosen for the integration method for
crash and INRIX data primarily to ease the integration with other data sets that are also related to
the LRS in the future. In addition to future integration, the LRS also provides some additional
control when relating the crash data and INRIX segmentation that are not possible with a simple
spatial join.
The Iowa DOT currently has a process established to relate the INRIX XD segments using
RAMS, which provides a RouteID, FromMeasure, and ToMeasure for each XD segment. The
details of the process are not discussed in this report but involve using multiple points along an
XD segment to determine the correct route in the LRS with which the segment should be
associated. The crash reporting system in Iowa is currently moving toward locating crashes
based on RAMS, which would provide a RouteID and Measure value for each crash. Any
historical crash data, though, are based on the previous GIMS road network, which contains a
single centerline for divided roadways. This step in the integration takes the historical crash data
and provides RouteID and Measure values for all crashes from 2015 through 2020. This same
process can be used for any future crashes until RAMS is fully integrated in the crash reporting
system for all crashes.
Conflating points to a network presents additional challenges compared to linear features. For
linear features, the line can be broken up into multiple points, and the most common route the
points are associated with can be selected. This is not possible for points, which can be related to
a line in any direction. Because of this, multiple other factors must be considered. There are two
primary challenges to overcome when relating the crashes to the LRS network. The first involves
associating crashes to the LRS/RAMS network when the crash data are located on a single
centerline. Figure 4 shows an example, where the blue pin represents a crash and the pink and
purple lines represent the RAMS network with which the data are being associated.

20
Figure 4. Issues with crashes located on single centerline
In this situation, the crash is actually on the main divided roadway, but if using only the nearest
roadway, it would be incorrectly associated with the local cross street. With crashes representing
only a single point, additional information is needed to ensure that the crash is associated to the
correct route. A ranking process is described in this section that identifies all potential routes
within a distance of the crash and then compares data within the crash data to roadway asset
information to identify the most likely route on which the crash occurred.
The second challenge involves the nature of crashes not being related to a single direction of
travel. This occurs on divided roadways but is also common at intersections. The LRS network is
directional, so a crash could be related to multiple RouteIDs, but doing this can cause data
management issues since users expect a single record for crashes. In the same example shown in
Figure 4, the crash could involve a vehicle crossing the median and striking a vehicle from the
opposing direction of travel. A case could be made to either represent the crash on the RouteID
for both directions of travel or to relate it to only a single RouteID. The research team ultimately
decided to identify the most likely RouteID and assign each crash to a single RouteID. A
secondary process could be used to identify whether the opposite direction RouteID would need
to be extracted or, when an intersection database is available, associate the crash to each
approach for the intersection.
To begin the association of the crash data to the LRS, the first process involves querying all of
the potential routes surrounding the crash. The ESRI Roads and Highways REST service query
was used to provide the coordinates for each crash and then return all of the routes that are
present within 70 m. An example of the returned points along a route are shown as the orange
pins in Figure 5, where the crash location is represented by the blue pin.

21
Figure 5. Identifying routes within 70 m of crash
The results returned also include any concurrent routes within the LRS. Concurrent routes occur
when there are two signed routes along the same roadway.
Within the Iowa DOT’s system, route dominance is used when concurrent routes exist as well as
when only a single centerline is used on undivided roadways. Route dominance is important
because data in the RAMS are only related to the most dominant route at a given location. The
crash data does not rely on the route dominance and could have been related to a non-dominant
route. Because of this, each concurrent route in the initial query is retained in case the crash
includes information about a less dominant route. The dominant route information is needed for
all routes associated to the crash to identify the attributes, such as the speed limit. To do this,
each of the coordinates for all routes associated with a crash are then processed again through the
ESRI Roads and Highways REST service but using a tolerance of 0 m to find all concurrent
routes at the given location. A route dominance function was then used to identify the most
dominant route at the given location based on the RouteID structure depicted in Table 3.
Table 3. Iowa LRS network route identifier structure
Field name
Route-
Description
Geo-
Identifier Sys-Code Route-No Direction Ramp
Field size 1 4 1 4 1 4
Field description S – State
C – County
M – Municipal
P – Parks
I – Institution
FIPS Code
County No
Municipal
Code
Parks No
Institution
No
1 – Interstate
2 – US
3 – Iowa
4 – Local
Actual No
Sequential
Sequential
Sequential
Sequential
N
S
E
W
Example route identifiers
M058741265N M 0587 4 1265 N -
S001920018E5155 S 0019 2 0018 E 5155

22
With all of the associated routes and the corresponding dominant route for each, the data needed
from both the crash and routes can be extracted for the ranking process. After exploring the
relationships between the crash and routes, the research team determined that the primary fields
that can assist in matching the crashes to a route include the following: direction, speed limit,
route number, route system, and whether the roadway was a ramp. For the routes, the speed limit
can be extracted by performing an overlay using the dominant route and measure value with the
speed limit layer in RAMS. The resulting output returns the speed limit along the route.
Additional attributes are also coded based on the structure of the RouteID in Table 3 and include
the following:
• RouteRamp – Indicator given if the route is a ramp, based on whether characters 12–15 are
used in the RouteID
• RouteDirection – The direction of the route based on the 11th character in the RouteID
• RouteSystem – The system type of the route based on the 6th character in the RouteID
• RouteNumber – The route number of the route based on characters 7–10 in the RouteID
The second challenge mentioned previously described issues with crashes involving vehicles
traveling in multiple directions. The crash data contains multiple recorded directions including
the Cardinal, LaneDir, and InitDir, which all represent different information. The Cardinal
direction, for which the domains are shown in Table 4, is a derived field based on the direction of
all of the vehicle(s) involved in the crash.
Table 4. Cardinal direction domains
Code Value
1 Northbound (NB)
2 Eastbound (EB)
3 Southbound (SB)
4 Westbound (WB)
5 Both North and South
6 Both East and West
7 Ramp
8 No Travel Direction Consistent with Route
9 Unknown - Not Indicated - Unlocated
The field is intended to provide a high-level summary of the crashes but does have situations
where no travel direction is reported. The Cardinal field also has the added benefit of providing
the ability to identify if the roadway is a ramp. Because of the potential for the Cardinal direction
not reporting a direction, the LaneDir is used, which is based on the road that the location tool
associates the crash, with the domains for this field shown in Table 5.

23
Table 5. LaneDir domains
Code Value
1 NB/EB
2 SB/WB
4 Contains both strings
77 Not reported
This field again can potentially cause issues if a direction is not reported, so the InitDir can be
used, which is a vehicle-level attribute and provides the direction of travel for each vehicle in the
crash. The available domains for the InitDir are shown in Table 6.
Table 6. InitDir domains
Code Value
1 North
2 East
3 South
4 West
99 Unknown
77 Not reported
At this point in the process, each crash is associated to all routes within 70 m, and the attributes
needed from the LRS routes have been obtained for ranking. Because the InitDir can provide
information about the travel direction of vehicles involved in the crash, it is needed as part of the
ranking process to identify the correct route. The InitDir is only available at the vehicle level, so
the crash data must be joined to the vehicle-level data based on the CRASH_KEY, which is the
unique identifier for each crash. In addition, the speed limit data for the crash is also only
available in the vehicle-level information and can be extracted by joining the vehicle-level data
to the crash data. Joining the vehicle-level data replicates all of the routes and crash data for each
vehicle involved in the crash.
An example of this is shown in Table 7, where the first four records show the output after the
crash data are related to the routes. Since the crash involved two vehicles, the total number of
records increased to eight with each vehicle being related to each of the routes associated with
the crash.

24
Table 7. Output of crash, vehicle, and route data for ranking
All eight of these records are ranked to determine the most appropriate route associated with the
crash. Table 7 also displays all of the fields used for the ranking from the crash, vehicle, and
route data.
With all of the attributes and records identified, the ranking process to identify the correct route
to each crash can be completed. A two-stage ranking process was implemented, where all
records are ranked based on an initial set of variables. The top-ranked records are retained and
then ranked again based on additional variables. The initial ranking involved adding points to a
records rank if attributes in the crash data are equal to attributes in the route data. The following
logic was implemented for the initial ranking:
• Add 1 to the rank if the Route SpeedLimit is equal to the SpeedLimit in the crash data
• Add 0.5 to the rank if the Route Direction equals a value in the Cardinal direction from the
crash data
• Add 0.5 to the rank if the Route Ramp is true and the Cardinal direction in the crash data are
equal to 7 (ramp)
• Add 0.25 if the Route Direction equals the LaneDir in the crash data
• Add 0.25 if the Route Direction equals the InitDir in the vehicle data
Each route for a given crash has a rank score after the initial ranking process from 0 to 2.5. For
each crash, the crash and route combination that have the highest scores are retained for the
secondary ranking. An example of this is shown in Table 8, where eight records were ranked for
a given crash.
Table 8. Example of removing records after initial ranking
Four of the records resulted in a rank of 1, while the four other records had a rank of 1.5. In this
situation, only the four records with a rank of 1.5 were retained and analyzed for the secondary
CRASH_KEY SYSTEM ROUTE CARDINAL RAMP LaneDir UNITKEY SpeedLimit InitDir RouteID Measure
Dominant
RouteID
Dominant
Measure
Route
SpeedLimit
Route
Ramp
Route
Direction
Route
System
Route
Number
20201166723 2 69 5 2 77 20201166723001 45 3 M018747460E -2.734E-08 S001920069N 99.172929 55 No E 4 7460
20201166723 2 69 5 2 77 20201166723001 45 3 S001920069S 128.18899 S001920069N 99.172929 55 No S 2 69
20201166723 2 69 5 2 77 20201166723001 45 3 S001920069N 99.172929 S001920069N 99.172929 55 No N 2 69
20201166723 2 69 5 2 77 20201166723001 45 3 C007748340E 0.7584567 C00748340E 0.7584567 55 No E 4 8340
20201166723 2 69 5 2 77 20201166723002 45 1 M018747460E -2.734E-08 S001920069N 99.172929 55 No E 4 7460
20201166723 2 69 5 2 77 20201166723002 45 1 S001920069S 128.18899 S001920069N 99.172929 55 No S 2 69
20201166723 2 69 5 2 77 20201166723002 45 1 S001920069N 99.172929 S001920069N 99.172929 55 No N 2 69
20201166723 2 69 5 2 77 20201166723002 45 1 C007748340E 0.7584567 C00748340E 0.7584567 55 No E 4 8340
Route DataCrash Data Vehicle Data
CRASH_KEY ROUTE CARDINAL RAMP LaneDir UNITKEY SpeedLimit InitDir RouteID
Route
SpeedLimit
Route
Ramp
Route
Direction
Speed
Check
Cardinal
Check
LaneDir
Check
InitDir
Check Rank
20201173227 235 7 77 20201173227001 35 4 M826043150S 35 No S 1 0 0 0 1
20201173227 235 7 77 20201173227001 35 4 S001910235W5450 45 Yes W 0 1 0 0.5 1.5
20201173227 235 7 77 20201173227001 35 4 S001910235W5465 45 Yes W 0 1 0 0.5 1.5
20201173227 235 7 77 20201173227001 35 4 M826043150N 35 No N 1 0 0 0 1
20201173227 235 7 77 20201173227002 35 4 M826043150S 35 No S 1 0 0 0 1
20201173227 235 7 77 20201173227002 35 4 S001910235W5450 45 Yes W 0 1 0 0.5 1.5
20201173227 235 7 77 20201173227002 35 4 S001910235W5465 45 Yes W 0 1 0 0.5 1.5
20201173227 235 7 77 20201173227002 35 4 M826043150N 35 No N 1 0 0 0 1
Route DataCrash Data Vehicle Data Ranking

25
ranking process. The records without the highest ranking scores are struck through in the table to
show which ones were removed.
The secondary ranking process introduces the system type and route number into the ranking.
These were used in the secondary ranking because the direction and speed limit resulted in more
refined results that better identified the potential routes. Introducing the system type in the initial
ranking can result in some routes having significant matches but outranked solely based on the
system defined in the crash data. Additionally, the route number and names are not consistent
between the crash data and RAMS network. Using these fields still provides value in selecting
the final routes, which used the ranking process as follows:
• Add 1 to the rank if the RouteSystem is equal to the System in the crash data
• Add 1 to the rank if the RouteNumber is equal to the Route in the crash data
Once the secondary ranking is completed, the top ranked crash and route combination is selected.
If multiple crash and route combinations have equal ranking, then the route closest to the crash is
selected. This final result represents the RAMS integration output, described in the previous
section, which contains a one-to-one relationship between the crash data and RAMS. Each crash
is assigned a RouteID and Measure value. This output allows for integration with the INRIX
data, but the additional effort conducted in this step also allows for supporting other integration
efforts in the future.
Figure 6 visually shows the final output of the ranking process. The blue pin on the left side of
the figure represents the originally given crash location. Three potential routes were identified,
shown as the orange and red pins, and included in the ranking process. The ranking process was
able to accurately determine that the crash was not related to the cross street, which is closer to
the original crash location, and correctly assigned it to the divided roadway in the correct
direction of travel, shown as the left red pin.
Figure 6. Final output of the RAMS route ranking process

26
Step 2: Integrate Crash Data and Probe Data
With the crash data and INRIX XD segments both related to RAMS, a simple linear overlay can
be completed that associates each crash to any segment along the given section of roadway. This
is completed by using the RouteID and Measure values associated to each data set.
The effort is complicated due to the fact that INRIX XD segments can change twice a year as the
network is updated and modified. To accommodate this, a database was created that combines all
of the various INRIX XD segmentation versions into a single database. The database can then be
filtered based on the XD Segment version to see the corresponding XD segments and RAMS
information for each segment. Table 9 provides the time frames for which each XD segmentation
version is valid based on the data stored at InTrans. This is used in coordination with the date of
the crash to determine the appropriate INRIX segment data available.
Table 9. XD segment version data ranges
XD segment
version Start date End date
17.1 1/1/2016 12/31/2016
16.1 1/1/2017 3/31/2017
17.1 4/1/2017 4/24/2018
18.1 4/25/2018 12/2/2018
18.2 12/3/2018 4/15/2019
19.1 4/16/2019 10/7/2019
19.2 10/8/2019 4/1/2020
20.1 4/2/2020 9/28/2020
20.2 9/29/2020 3/29/2021
The RAMS integration output from Step 1 has a RouteID and Measure associated to each crash,
while the conflated INRIX XD segment data from the Iowa DOT contains a RouteID,
FromMeasure, and ToMeasure for each XD segment. Because the XD segments are linear
features, the FromMeasure indicates the measure values at the start of the segment, and the
ToMeasure identifies the measure values at the end of the segment. A linear overlay compares
the RouteIDs for each data set and then joins the crash data and XD segments if the crash
measure value falls between the from and to measures of the XD segment. In addition to the
linear overlay, the crash data are joined to Table 9 based on the crash date falling between the
start and end dates of the XD segmentation version. This version number will then be used as
part of the linear overlay to select only the XD segment that was valid at the time of the crash.
The resulting output is the probe data integration output.
Because the probe data provides data for both directions of travel along the roadway, the process
creates a one-to-many relationship, where each crash can have multiple XD segments associated
with it. This relationship only applies to a subset of the crashes, as INRIX data are only available
on primary roadways as well as some additional major roadways. Any crash without a

27
segmentation identified is excluded in the output. INRIX data were archived starting in 2016, so
the process was conducted for only the crash data from 2016 through 2020.
Step 3: Join Probe and Crash Data at Time of Crash Files
With a relationship between the crash data and INRIX XD segments identified in Step 2, a
process can be established that extracts the probe data stored in Athena similar to the weather
data. The INRIX data extraction has been refined over the years at InTrans and has been well-
implemented, including partitioning for other related projects in Iowa.
The process extracts the probe data speed and other related measures for the specific minute
reported for the crash time. Inaccuracies may exist in the crash report time but latencies also
exist with the probe data. The extracted probe data provides the best estimate of speed at the time
of the crash based on these assumptions and further detailed analysis may be needed to evaluate
speed before and after a crash.
Once the join is complete, the probe data output is created, which extracts all of the probe data
for the segments associated with each crash key. This output is similar to other z-tables as part of
the crash data in Iowa and can be joined directly with the crash-level data for analysis. These
data should be treated similar to vehicle- or person-level data, because a one-to-many
relationship may exist.
Step 4: Extract Additional Probe Data Before and After the Crash
Similar to the weather data, some users may require additional probe data before and/or after a
crash. This can be used to analyze the traffic conditions leading up to the crash and/or estimate
the overall impact the crash had on traffic conditions.
An additional process was established that allows users to dynamically enter the number of
minutes before and/or after the crash to return additional probe data for analysis. For example, a
user may want to request probe data 20 minutes before a crash and 10 minutes after a crash. The
users can enter these values into the Python script, and the corresponding 30 minutes of probe
data are returned for each crash. This is the probe data before/after crash output for which the
corresponding fields were described previously.

28
FINDINGS
After developing the integration engine, a prototype online safety and operations evaluation tool
was developed to explore the interactions between the crash, weather, and probe data. Methods
of analyzing the data were explored to show the potential benefits of using the integration, but it
is expected that future research will further explore and understand these relationships. This
chapter highlights the online safety tool developed, including some initial comparisons of the
data as well as lower levels of analyses conducted using the weather and probe data.
The online safety tool was developed similar to other safety data visualization at InTrans. The
tool was created in Tableau, which allows users to explore data interactively by selecting charts
and filtering the data to understand the relationships between the various attributes. In total, 16
pages were created as part of the tool that includes commonly utilized attributes from the crash,
weather, and probe data.
The data utilized in the tool include the weather integration output and the probe data integration
output described in the previous chapter. The before/after crash outputs were used in a separate
tool described later in this chapter. Figure 7 provides an overview of the joins used within the
safety tool.
Figure 7. Data integration of safety tool
The crash level data provided by the Iowa DOT is the primary source, with all additional data
sets relating back to this table based on the CRASH_KEY. The vehicle-level and TIM tables are
also provided by the Iowa DOT and include vehicle-level information and traffic incident
management (TIM) data, respectively. Both of these tables utilize a left join in case any vehicle
and TIM data are missing for a given crash. The probe data integration output uses a left join as
well as indicated by the left circle being completely shaded. This is due to the probe data only
being available for a subset of the roadways, and the left join retains any crash without probe
data. The weather data integration utilizes only an inner join due to the one-to-one relationship
that exists between the weather and crash.

29
The first seven pages of the tool focus on the crash, vehicle, and TIM attributes provided by the
Iowa DOT. These attributes are what would commonly be available to the Iowa DOT for any
safety related analysis. The most commonly used attributes were included in the tool including,
but not limited to, the crash severity, time, major cause, driver age, road type, and road
classification. Figure 8 shows an example of the vehicle- and driver-level data available on one
of the pages in the crash tool.
Figure 8. Example of crash data in safety tool
The next five pages in the safety tool focus on displaying the speed data based on the probe data
integration output. The visualization focuses on summarizing the speeds at the time of the crash,
the free-flow speed, historical speed, and the confidence score of the data. In addition to the data
available from the output, calculated fields were developed utilizing both the probe and crash
data. For example, with multiple potential speeds associated with the crash, the direction field
was utilized to identify whether the speed was in the direction of the crash, the opposite direction
of travel of the crash, or an unknown direction. This could provide value in determining if
impacts to speed in the opposite direction may have contributed to the crash or if the impacts
were limited to a single direction. The historical and free-flow speeds were also used to identify
whether a slowdown existed at the time of the crash and whether the slowdown was recurring or
non-recurring as a potential indicator of secondary crashes.

30
The final four pages in the safety tool display the weather data integration output for comparison
with the crash data. The pages displayed attributes, such as the temperature, the amount of
precipitation, wind speed, and weather advisories. Similar to the probe data, additional calculated
fields were explored including comparing the wind direction to the road bearing and calculating
the difference in road and air temperature.
As mentioned previously, the safety tool provides an interactive method for exploring and
understanding relationships between attributes. When hovering over any chart, a tooltip is
shown, which provides addition details as shown in Figure 9.
Figure 9. Example of tooltip and selecting data in safety tool
The details can include charts, trends, or summary statistics that may be insightful for the user.
Each chart can also be used as a filter to update all of the data throughout the tool. For example,
users can go to the crash severity chart and select fatal crashes, which will in turn update every
page in the crash tool to only include fatal crashes.
An initial step when exploring the weather data involved comparing the attributes given by the
law enforcement officer to the weather station data. Figure 10 shows the precipitation types from
the weather station sensors for the crashes that had snow listed as the weather condition at the
time of the crash.

31
Figure 10. Precipitation types for crashes coded by officers as snow related
Of those crashes, 36.9% had no precipitation based on the station data. Severe winds were also
selected as the crash weather type and showed a significant shift in the wind speeds. For all
crashes, 6.6% of the crashes reported wind speeds over 20 mph compared to 66.8% when severe
wind coded crashes were selected. Similar findings are available with fog, smoke, smog reported
crashes, with 39.1% of the crashes having 0 mi of visibility, while all crashes only had 1% of
crashes with zero visibility. In all of these situations, quantitative variables are available to
further distinguish between these weather impacts outside of the qualitative variables the crash
data provides.
As mentioned previously, the weather attributes also provide the ability to create calculated
variables for analysis. With both road temperature and air temperature reported for each crash,
comparisons can be made to determine if the road temperature is lower than the air temperature.
Figure 11 shows this comparison, with each point representing a single crash.
Figure 11. Comparison of road and air temperature reported for each crash

32
Most crashes follow a similar trend, but a subset of crashes appear to be outliers with
significantly lower road temperatures as compared to the air temperature. Outliers such as these
can be further explored to understand the causes and impacts on safety.
In addition to the severity of wind, the direction of the wind in comparison to the road bearing is
also important, especially for freight. The wind direction reported in the weather data was
compared to the bearing of the roadway to determine if the wind was perpendicular to the road,
which has the potential to cause truck rollover crashes. Figure 12 shows the summary of this
comparison with values closer to 0 indicating a head wind, values around 90 indicating a cross
wind, and values close to 180 indicating a tail wind.
Figure 12. Wind direction compared to road bearing summary
From the summary, about 19% of crashes involve a cross wind between 80 and 100 degrees.
This analysis can be further refined with additional exploration to determine the impacts for
different vehicle types as well as the wind speed.
Due to the lack of traffic conditions in the crash data, comparisons between the crash and probe
data were limited. Although not a direct comparison, a calculated value using the probe data to
determine if a slowdown occurred at the time of the crash was used to compare to the field
identifying secondary crashes in the crash database. To calculate this field, the speed, free-flow
speed, and historical speed were used to identify a slowdown but also label the slowdown as
either recurring or non-recurring. A common method used to identify slowdowns or bottlenecks
is to use 60% of the free-flow speed. If the speed at the time of the crash was less than 60% of
the free-flow speed, then the crash was labeled as having a slowdown at the time of the crash. To
determine if the slowdown was recurring, the historical speed was used, which accounts for
typical speeds along the segment at the given time of day. If the speed was less than the

33
historical speed minus 5 mph, then the crash was labeled as non-recurring. Any speed greater
than the historical speed minus 5 mph would indicate a recurring slowdown. Overall, 6.2% of the
crashes with INRIX data occurred during non-recurring slowdowns, while 0.4% occurred during
recurring slowdowns. Figure 13 shows the results when only secondary crashes are selected.
Figure 13. Summary of slowdown time for secondary crashes
The results show no crashes identified as a recurring slowdown, but only 17.4% of the crashes
having a slowdown. On the other hand, when selecting only the crashes identified as non-
recurring slowdowns, the number of secondary crashes increases from 1.6% to 4.8% as
compared to all crashes.
The speed and crash data can also be used to compare the speeds at the time of the crash to the
speed limit of the roadway. To do this, the probe data speed was subtracted from the speed limit.
The result of this output will show values less than 0 if the speed was lower than the posted
speed limit or values greater than 0 if the speed was greater than the posted speed limit. This
does not indicate the speed of the actual vehicle but the approximate speed of vehicles along the
roadway. Figure 14 shows this comparison broken down by the posted speed limit, with a box-
and-whisker plot displaying the range in speed differences.

34
Figure 14. Crash speeds ranges as compared to the speed limit
The data show that roadways with a speed limit greater than 55 mph have median speeds
comparable to the speed limit as indicated by the box plot median value near the zero speed
difference from the speed limit value. For these speed limit values, a number of outliers are
shown with speeds less than the speed limit. The speed limits from 30 to 50 mph show lower
median speeds, as indicated by the shift in the box plot to the left of zero. These speed limits
show additional outliers to the right, though, indicating higher probe data speed in comparison to
the speed limit for those crashes. Providing quantitative measures of speed offers additional
information that can be used when evaluating crashes or developing safety models.

35
The safety tool can be used to further explore the relationships between crash, weather, and
probe data but is limited to the weather and probe data at the time of the crash. The final step in
both the probe and weather data processes was to develop a script that allowed for a configurable
amount of data before and after the crash to be extracted. A sample of the data was extracted to
validate the process outputs but also shows potential uses of the data in more advanced analysis.
The weather data contains multiple quantitative variables that can be evaluated before and after
the crash. Four of the fields reported in the weather data are shown for a single crash in Figure
15.
Figure 15. Weather data before and after a single crash
To allow for consistent visualizations when comparing the data, the timestamp of the crash was
replaced with the time in minutes from the crash. In the example, weather data were extracted 30
minutes before the crash and 15 minutes after the crash. The red vertical line represents the
reported time of the crash with a value of 0 minutes. The values to the left of the red line indicate
measures before the crash and values to the right of the red line indicate measures after the crash.
With these data, there are very few changes in road temperature, wind speed, and wind direction
leading up to or after the crash. The precipitation accumulation showed that 1.6 mm of
precipitation was accumulated in the 30 minutes prior to the crash and an additional 0.9 mm in
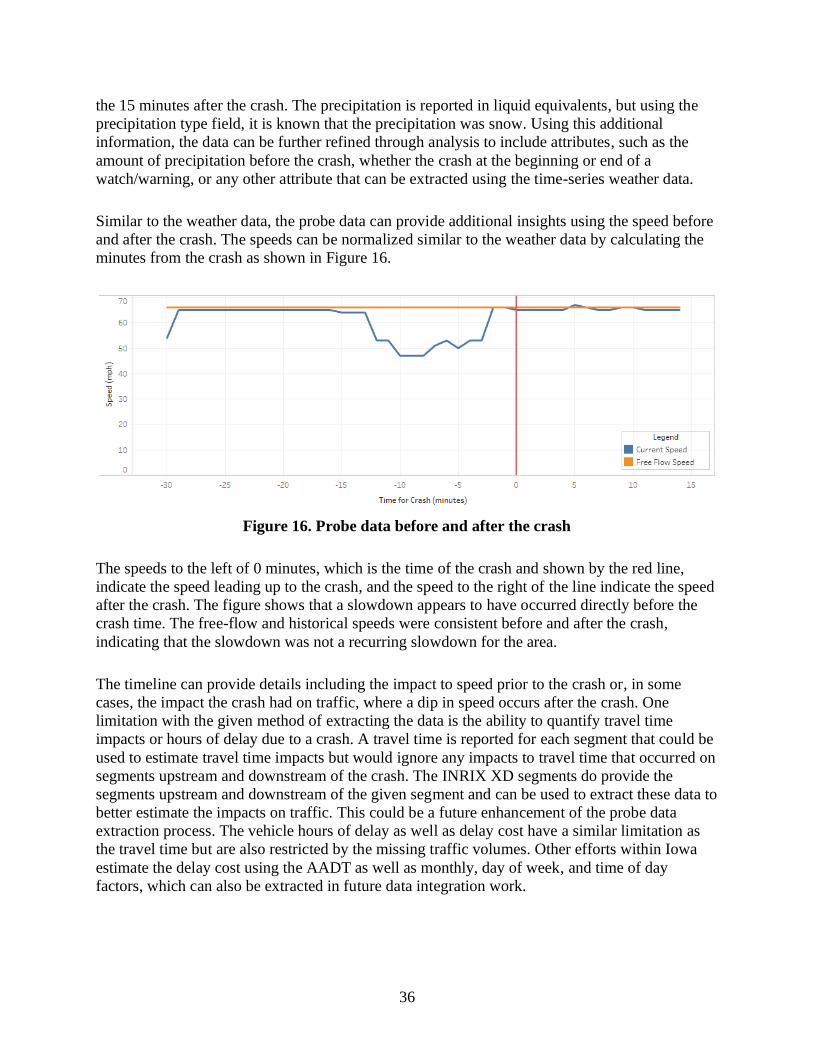
36
the 15 minutes after the crash. The precipitation is reported in liquid equivalents, but using the
precipitation type field, it is known that the precipitation was snow. Using this additional
information, the data can be further refined through analysis to include attributes, such as the
amount of precipitation before the crash, whether the crash at the beginning or end of a
watch/warning, or any other attribute that can be extracted using the time-series weather data.
Similar to the weather data, the probe data can provide additional insights using the speed before
and after the crash. The speeds can be normalized similar to the weather data by calculating the
minutes from the crash as shown in Figure 16.
Figure 16. Probe data before and after the crash
The speeds to the left of 0 minutes, which is the time of the crash and shown by the red line,
indicate the speed leading up to the crash, and the speed to the right of the line indicate the speed
after the crash. The figure shows that a slowdown appears to have occurred directly before the
crash time. The free-flow and historical speeds were consistent before and after the crash,
indicating that the slowdown was not a recurring slowdown for the area.
The timeline can provide details including the impact to speed prior to the crash or, in some
cases, the impact the crash had on traffic, where a dip in speed occurs after the crash. One
limitation with the given method of extracting the data is the ability to quantify travel time
impacts or hours of delay due to a crash. A travel time is reported for each segment that could be
used to estimate travel time impacts but would ignore any impacts to travel time that occurred on
segments upstream and downstream of the crash. The INRIX XD segments do provide the
segments upstream and downstream of the given segment and can be used to extract these data to
better estimate the impacts on traffic. This could be a future enhancement of the probe data
extraction process. The vehicle hours of delay as well as delay cost have a similar limitation as
the travel time but are also restricted by the missing traffic volumes. Other efforts within Iowa
estimate the delay cost using the AADT as well as monthly, day of week, and time of day
factors, which can also be extracted in future data integration work.

37
SUMMARY AND CONCLUSIONS
Decision-makers today have access to vast amounts of information but are often restricted in the
ability to explore relationships between the data. Relationships between data sources are often
nonexistent or involve complex processes limiting who can use the information. Simple
integrations or questions often require a dedicated research project that ultimately does not
support the ongoing use of the data moving forward. This project demonstrated a simple proof-
of-concept architecture that addresses some of the constraints on decision-makers but also opens
up additional data sets for the Iowa DOT or other researchers to explore without the additional
time and effort it takes to integrate the data.
The current research literature shows that there is value in using weather and traffic data within
safety analysis due to the impact these factors have on crashes. However, most literature showed
that researchers often needed to aggregate data sets, used a variety of different integration
processes, and likely spent a considerable amount of time integrating the data. The architecture
in this report identified the various data sets needed to support crash, weather, and traffic
analysis and then developed a process to extract the data. The considerable size of the data
required developing a pipeline that allows the data to be stored cost-effectively while also
reducing the time to query the data sets. The created outputs from these processes assign the
attributes for the related weather and probe data to each crash, which can be treated like all other
crash data within Iowa. This allows novice users with some experience with the crash data to
complete analysis using both weather and probe data. The architecture was also designed to
support future advanced analysis by developing simple scripts that can be used to dynamically
extract the weather or probe data before and after a defined set of crashes. It is expected that
future research will utilize these data outputs and processes to improve weather, traffic, and crash
related efforts moving forward.
The Iowa DOT views this project as an initial effort to develop a system that enhances crash data
reports by integrating additional data sources. The ultimate goal will be to have a system that has
all available data sets readily available when evaluating crashes and that can be utilized within
any safety and mobility decision-making. The work in this study has established a foundation to
simplify the efforts to integrate additional data sources by associating the crash data to the Iowa
DOT’s LRS. Additional data sets that can be used to enhance the crash data or used in future
research, identified through coordination with the Iowa DOT and other relevant stakeholders,
include the following:
• Advanced Traffic Management System data – These data include additional real-time
attributes collected through the traffic management center that can supplement information
within the crash report. The integration would also support the Iowa DOT’s claim
management efforts by providing additional events captured in the ATMS.
• Snowplow automatic vehicle location (AVL) data – The Iowa DOT maintains a fleet of
snowplows that are equipped with Global Positioning System (GPS) devices as well as
additional sensors to report the location of the snowplow, the plowing status, and the
type/amount of material applied to the roadway. The information is reported every about 10

38
seconds and can be integrated through the LRS.
• Winter road conditions – The Iowa DOT reports winter road conditions based on input from
its maintenance supervisors and other DOT staff. The ability to also include winter road
conditions could further support winter weather safety research by providing the estimated
road conditions, which are not available within the weather data. Currently, the Iowa DOT
winter road conditions are maintained independently of other databases but may ultimately
be associated to the LRS.
• Traffic and road weather snapshot and videos – The Iowa DOT has a network of traffic
cameras and road weather cameras that record videos for a defined period of time and
download snapshots every five minutes. Associating camera imagery with crashes can allow
the Iowa DOT to further understand the conditions before, during, and after the crash using
the snapshots or video.
• Pavement condition data – There has been an interest in understanding the pavement
conditions at crash locations in addition to the surface type inputted in the crash reports. The
data are already associated with RAMS, which allows easy integration with data sets, such as
rutting, friction, and other surface conditions that may impact safety.
• Intersections – The Iowa DOT is currently working on integrating an intersection database
into RAMS, which will allow associating crashes to intersections in order to obtain additional
attributes about the intersection. This will also allow for additional intersections to be
identified, where the crashes may not be coded as intersection related but are in close
proximity to an intersection.
• Work zones – The Iowa DOT has various efforts related to improving the collection and
accuracy of work zone data in Iowa including the use of smart arrow boards, a work zone
lane closure system, and the Work Zone Data Exchange. The goal of these systems is to have
verified work zone data that can be made available to the public but also archived for use in
safety and mobility related efforts. Throughout these discussions, most efforts will utilize
RAMS at some level to integrate the data.
For a majority of the data set integration efforts, the RAMS integration developed as part of this
project will allow for streamlined integration with other data sets. A simple linear overlay can be
used to create the relationship between the data or to extract the relevant information. This will
become more common as additional systems and data sets are integrated with the RAMS and
have a common network to associate data. The Iowa DOT expects to continue to develop
additional data integration processes to ensure that data from various data sources are easily
assessable for any user for analysis.
Related to the architecture that has been developed, future enhancements can be made to allow
for additional summary statistics to be created for each crash as well as the ability to extract
additional data for nearby road segments or weather grids. The summary statistics can include

39
information such as the amount of precipitation a defined amount of time before the crash,
whether speeds were trending up or down before the crash, and whether speeds were impacted
after the crash. The summary statistics can provide additional attributes but would require
additional workflows to extract and summarize these data for other users.
As described in the Findings chapter, a limitation to determining the impact a crash had on the
public is the lack of knowledge of the traffic impacts upstream and downstream of the crash. The
ability to collect this information is available through the current INRIX XD segmentations, but
additional enhancements would be needed to extract this information for each crash. A similar
process could be developed to extract weather data surrounding a crash. The weather data
provided by the IEM also includes weather forecasts every six hours based on the same grid and
the same attributes. The forecast data have not been explored fully and may have benefits in
some applications.
Overall, the proof-of-concept architecture developed provides an initial step in integrating crash,
weather, and traffic data for more widespread use within Iowa. It is expected that the integration
of data will continue to expand in Iowa, opening up the use of additional data for more users.


41
REFERENCES
Ahmed, M., M. Abdel-Aty, J. Lee, and R. Yu. 2014. Real-Time Assessment of Fog-Related
Crashes Using Airport Weather Data: A Feasibility Analysis. Accident Analysis and
Prevention, Vol. 72, pp. 309–317.
Cheng, W., G. S. Gill, T. Sakrani, M. Dasu, and J. Zhou. 2017. Predicting Motorcycle Crash
Injury Severity Using Weather Data and Alternative Baysian Multivariate Crash
Frequency Models. Accident Analysis and Prevention, Vol. 108, pp. 172–180.
Chung, W., M. Abdel-Aty, and J. Lee. 2018. Spatial Analysis of the Effective Coverage of Land-
Based Weather Stations for Traffic Crashes. Applied Geography, Vol. 90, pp. 17–27.
Das, S., S. R. Geedipally, and K. Kitzpatrick. 2021. Inclusion of Speed and Weather Measures in
Safety Performance Functions for Rural Roadways. International Association of Traffic
and Safety Science (IATSS) Research, Vol. 45, No. 1, pp. 60–69.
Dutta, N. and M. D. Fontaine. 2019. Improving Freeway Segment Crash Prediction Models by
Including Disaggregate Speed Data from Different Sources. Accident Analysis and
Prevention, Vol. 132, 105253.
———. 2020. Improving Freeway Crash Prediction Models Using Disaggregate Flow State
Information. Virginia Transportation Research Council, Charlottesville, VA.
Ederer, D. J., M. O. Rodgers, M. P. Hunter, and K. E. Watkins. 2020. Case Study using Probe
Vehicle Speeds to Assess Roadway Safety in Georgia. Transportation Research Record:
Journal of the Transportation Research Board, Vol. 2674, No. 11, pp. 554–562.
Hans, Z., N. Hawkins, P. Savolainen, and E. Rista. 2018. Operational Data to Assess Mobility
and Crash Experience during Winter Conditions. Center for Weather Impacts on
Mobility and Safety, Institute for Transportation, Iowa State University, Ames, IA.
https://intrans.iastate.edu/app/uploads/2018/12/operational_data_in_winter_conditions_w
_cvr.pdf.
Malin, F., I. Norros, and S. Innamaa. 2019. Accident Risk of Road and Weather Conditions on
Different Road Types. Accident Analysis and Prevention, Vol. 122, pp. 181–188.
Theofilatos, A. and G. Yannis. 2014. A Review of the Effect of Traffic and Weather
Characteristics on Road Safety. Accident Analysis and Prevention, Vol. 72, pp. 244–256.
Tobin, D. M., M. R. Kumjian, and A. W. Black. 2021. Effects of Precipitation Type on Crash
Relative Risk Estimates in Kansas. Accident Analysis and Prevention, Vol. 151, 105946.


THE INSTITUTE FOR TRANSPORTATION IS THE FOCAL POINT FOR TRANSPORTATION AT IOWA STATE UNIVERSITY.
InTrans centers and programs perform transportation research and provide technology transfer services for government agencies and private companies;
InTrans contributes to Iowa State University and the College of Engineering’s educational programs for transportation students and provides K–12 outreach; and
InTrans conducts local, regional, and national transportation services and continuing education programs.
Visit InTrans.iastate.edu for color pdfs of this and other research reports.