developing an evidence base and related product policy
TRANSCRIPT

1
1 9 J u n e , 2 0 1 3
M. Cordella, E. Garbarino, R. Kaps, O. Wolf
Kick off meeting (27th
June
2013) – Working document
Developing an evidence base and related product policy measures for "Taps and Showers"

ii
European Commission
Joint Research Centre
Institute for Prospective Technological Studies (IPTS)
Contact information
Mauro Cordella, Elena Garbarino, Renata Kaps, Oliver Wolf
Address: Joint Research Centre, Edificio EXPO, Calle Inca Garcilaso 3, E-41092 Sevilla, Spain
E-mail: [email protected]
Tel.: +34 954 480 578
http://susproc.jrc.ec.europa.eu/taps_and_showers/index.html
http://ipts.jrc.ec.europa.eu/
This publication is a Technical Report by the Joint Research Centre of the European Commission.
Legal Notice
Neither the European Commission nor any person acting on behalf of the Commission
is responsible for the use which might be made of this publication.
Europe Direct is a service to help you find answers to your questions about the European Union
Freephone number (*): 00 800 6 7 8 9 10 11
(*) Certain mobile telephone operators do not allow access to 00 800 numbers or these calls may be billed.
A great deal of additional information on the European Union is available on the Internet.
It can be accessed through the Europa server http://europa.eu/.
© European Union, 2013
Reproduction is authorised provided the source is acknowledged.

i
CONTENTS INTRO .................................................................................................................................................... 1
BACKGROUND ....................................................................................................................................... 1
OBJECTIVES AND STRUCTURE OF THIS REPORT ...................................................................................... 2
1 SCOPE ............................................................................................................................................ 5
1.1 Preliminary screening ................................................................................................................. 5
1.2 Product classification and definition .......................................................................................... 6
1.2.1 Classifications and definitions used for European trade statistics ................................... 7
1.2.2 Classifications and definitions according to international standards ............................... 7
1.2.3 Classifications and definitions according to existing labelling categories ........................ 8
1.2.4 Other classifications and definitions ................................................................................ 8
1.2.5 Proposed definitions ...................................................................................................... 10
1.2.6 Feedback from the 1st
Questionnaire to stakeholders ................................................... 10
1.3 Measurement methods and standards .................................................................................... 12
1.3.1 Standards at International and European Community level .......................................... 12
1.3.2 Standards at Member State level ................................................................................... 14
1.3.3 Third Country Standards. ................................................................................................ 14
1.3.4 Feedback from the 1st
Questionnaire to stakeholders ................................................... 15
1.4 Legislation, voluntary agreements and labels .......................................................................... 17
1.4.1 Legislation, voluntary agreements and labels at European Community level ............... 17
1.4.2 Legislation, voluntary agreements and labels at Member State level ........................... 19
1.4.3 Third Country legislation ................................................................................................ 19
1.4.4 Feedback from the 1st
Questionnaire to stakeholders ................................................... 19
1.5 Potential barriers to producers due to standards and legislation ............................................ 21
1.5.1 Feedback from the 1st
Questionnaire to stakeholders ................................................... 21
1.6 Next steps to complete the discussion on scope...................................................................... 22
2 MARKET ANALYSIS ....................................................................................................................... 23
2.1 Generic economic data ............................................................................................................. 23
2.1.1 Introduction .................................................................................................................... 23
2.1.2 EU production ................................................................................................................. 24
2.1.3 EU trade .......................................................................................................................... 25
2.1.3.1 Total value of EU Trade .......................................................................................... 25
2.1.3.2 Intra-EU Trade and Extra-EU Trade ........................................................................ 26
2.1.4 EU sales and trade .......................................................................................................... 26
2.1.5 Feedback from the 1st
Questionnaire to stakeholders ................................................... 27
2.2 Market and stock data .............................................................................................................. 28
2.2.1 Installed base (“stock”) and penetration rate ................................................................ 28
2.2.2 Annual sales growth rate ................................................................................................ 30
2.3 Market trends ........................................................................................................................... 31
2.3.1 Background information on market trend ..................................................................... 31
2.3.2 Trends for Taps and Showers ......................................................................................... 32
2.4 Consumer expenditure base data ............................................................................................ 33
2.4.1 Average EU consumer prices .......................................................................................... 33
2.4.2 Installation, repair and maintenance costs .................................................................... 34

ii
2.4.3 Disposal Tariffs ............................................................................................................... 35
2.4.4 Gas and Electricity Prices ................................................................................................ 35
2.4.5 Water Prices ................................................................................................................... 36
2.4.6 Interest and Inflation Rates ............................................................................................ 36
2.4.7 Feedback from the 1st
Questionnaire to stakeholders ................................................... 36
2.5 Next steps to complete the discussion on the Market ............................................................. 37
3 USERS AND SYSTEM ASPECTS ..................................................................................................... 39
3.1 Water consumption and user behaviour .................................................................................. 39
3.1.1 Water consumption in Europe ....................................................................................... 39
3.1.1.1 Domestic water consumption ................................................................................ 39
3.1.1.2 Water consumption in non-domestic building ....................................................... 43
3.1.2 User behaviours .............................................................................................................. 44
3.1.2.1 Usage Patterns - Taps ............................................................................................. 45
3.1.2.2 Usage Patterns – Showers ...................................................................................... 45
3.1.2.3 Calculation of total water use for taps and showers in domestic applications ...... 47
3.1.2.4 Calculation of total water use for taps and showers in non-domestic applications48
3.1.2.5 Calculation of hot water use ................................................................................... 48
3.1.3 Feedback from the 1st
Questionnaire to stakeholders ................................................... 49
3.2 Product use, maintenance and End-of-Life .............................................................................. 53
3.2.1 Product use & stock life .................................................................................................. 53
3.2.2 Repair and Maintenance Trends .................................................................................... 53
3.2.3 Collection, recycling and disposal ................................................................................... 53
3.3 Local infra-structure: water supply and wastewater treatment .............................................. 54
3.3.1 Feedback from the 1st
Questionnaire to stakeholders ................................................... 54
3.4 System aspects related to the use phase: affected energy system(s) ...................................... 56
3.4.1 Affected energy systems ................................................................................................ 56
3.4.2 Calculation of the energy consumption associated with water heating ........................ 56
3.4.3 Feedback from the 1st
Questionnaire to stakeholders ................................................... 57
3.5 Next steps to complete the discussion on Users and systems aspects .................................... 59
4 ANALYSIS OF TECHNOLOGIES....................................................................................................... 61
4.1 Introduction .............................................................................................................................. 61
4.2 Technical product description .................................................................................................. 61
4.2.1 Taps ................................................................................................................................ 61
4.2.1.1 Traditional spindle taps .......................................................................................... 61
4.2.1.2 Ceramic Disc Tap..................................................................................................... 63
4.2.2 Shower systems .............................................................................................................. 64
4.3 Technology, trends and examples of products ......................................................................... 66
4.3.1 Aerators .......................................................................................................................... 66
4.3.2 Flow Regulator ................................................................................................................ 67
4.3.3 Ecobuttons...................................................................................................................... 69
4.3.4 Taps with water brakes .................................................................................................. 70
4.3.5 Hot water limiters ........................................................................................................... 71
4.3.6 Energy saving taps .......................................................................................................... 72
4.3.7 Showerhead design ........................................................................................................ 72
4.3.8 Sensor Taps..................................................................................................................... 74
4.3.9 Automatic shut-off taps (Push taps) ............................................................................... 76

iii
4.3.10 Technology penetration, design cycles, barriers and opportunities .............................. 77
4.3.11 Feedback from the 1st
Questionnaire to stakeholders ................................................... 79
4.4 Production, distribution, use and end-of-life ........................................................................... 84
4.4.1 Production ...................................................................................................................... 84
4.4.1.1 Bill-of-Materials of example products .................................................................... 84
4.4.2 Product distribution ....................................................................................................... 85
4.4.3 Use, technical product life and time-to-failure of critical parts ..................................... 85
4.4.3.1 Feedback from the 1st
Questionnaire to stakeholders ........................................... 86
4.4.4 End-of-life practices ........................................................................................................ 87
4.4.4.1 Feedback from the 1st
Questionnaire to stakeholders ........................................... 87
4.5 Conclusive recommendations for technologies ...................................................................... 88
4.6 Next steps to complete discussion on technologies ................................................................. 88
5 ENVIRONMENT AND ECONOMICS OF DESIGN OPTIONS .............................................................. 90
5.1 Identification of base cases and design options and summary of preliminary base of evidence90
5.1.1 Selection of case studies ................................................................................................ 90
5.1.2 Preliminary base of evidence ......................................................................................... 91
5.1.3 Feedback from the 1st
Questionnaire to stakeholders ................................................... 94
5.2 Next steps to complete the environmental and economic analysis ......................................... 94
CONCLUSIONS ..................................................................................................................................... 96
SUPPORTING INFORMATION TO THE WORKING DOCUMENT
ANNEX I: SUPPORTING INFORMATION FOR SCOPE
ANNEX II: MARKET ANALYSIS
ANNEX III: ECOREPORT RESULTS FOR TAPS
First questionnaire for stakeholders is available at:
http://susproc.jrc.ec.europa.eu/taps_and_showers/docs/Questionnaire_SPP.doc


1
INTRO
Background
The Directive 2009/125/EC on Ecodesign1 establishes a framework for EU Ecodesign requirements for energy-related products with a significant potential for reduction of energy consumption. The implementation of such requirements would contribute to reach the target of saving 20% of primary energy by 2020 as identified in the Commission's Communications on Energy 20202 and on the Energy Efficiency Plan 20113.
Ecodesing measures may be reinforced also through the Directive 2010/30/EU4 on the indication by labelling and standard product information of the consumption of energy and other resources by energy-related products.
Following the publication of the Working plan for the Ecodesign Directive (2012-2014)5 the European Commission has launched in April 2013 a preparatory study on the product group taps and showers. According to the Study on Amended Ecodesign Working Plan under the Ecodesign Directive6, this product group presents significant energy savings potential (estimated as 885 PJ/year in 2030), which is achievable by using already-existing and economically-accessible technologies (payback period equal to 1 to 20 months, while the product's lifetime is measured in years).
The preparatory study on taps and showers is being developed by the European Commission's Joint Research Centre (JRC) following the Commission’s Methodology for the Evaluation of Energy related Products (MEErP)7:
Task 1 – Scope
Task 2 – Markets
Task 3 – Users
Task 4 – Technologies
Task 5 – Environment and Economics
Task 6 – Design options
Task 7 –Scenarios
The research will be based on available scientific information and data, will adopt a life-cycle thinking approach and will engage stakeholder experts in order to discuss on key issues and to develop wide consensus. A set of information of interest has been already collected for the development of EU Ecolabel and Green Public Procurement (GPP) criteria for sanitary tapware8. Background information will be revised, updated and integrated to reflect the current state of play and to align with the MEErP methodology.
As final result, JRC will produce a comprehensive techno-economic and environmental assessment for this product group. This will provide policy makers with an evidence basis for assessing whether
1 http://eur-lex.europa.eu/LexUriServ/LexUriServ.do?uri=OJ:L:2009:285:0010:0035:en:PDF
2 http://eur-lex.europa.eu/LexUriServ/LexUriServ.do?uri=COM:2010:0639:FIN:EN:PDF
3 http://eur-lex.europa.eu/LexUriServ/LexUriServ.do?uri=COM:2011:0109:FIN:EN:PDF
4 http://eur-lex.europa.eu/LexUriServ/LexUriServ.do?uri=OJ:L:2010:153:0001:0012:en:PDF
5 http://ec.europa.eu/enterprise/policies/sustainable-business/documents/eco-design/working-plan/
6 http://www.ecodesign-wp2.eu/downloads/FINAL%20REPORT%20Task%203%2016-12-2011.pdf
7 http://ec.europa.eu/enterprise/policies/sustainable-business/ecodesign/methodology/index_en.htm
8 http://susproc.jrc.ec.europa.eu/ecotapware/stakeholders.html

2
and how implementing a favourable mix of policy instruments in addition to EU Ecolabel and GPP with which to save water and to decrease related energy consumption across the EU27.
A Technical Working Group (TWG) has been created in order to support JRC along the study. This Technical Working Group is composed of experts from Member States, industry, NGOs and academia who have voluntarily requested for being registered as stakeholders of the study through the project website9. The TWG will contribute to the study with data, information and written feedback to questionnaires and working documents. Interaction with stakeholders will be enhanced also through three meetings organised by JRC:
First "Kick off" meeting (27th June 2013, Barcelona);
1st Technical Working Group (expected in October/November 2013);
2nd Technical Working Group (expected in March 2014).
Objectives and structure of this report
The preparatory study on taps and showers will build on existing knowledge as far as possible. However, additional and complementary investigation is required to achieve the goals of the study. With this respect, the objective of this report is to:
Summarise the background information so far gathered for taps and showers, mainly obtained from the analysis performed in order to address the development of EU Ecolabel and Green Public Procurement (GPP) criteria for this product group.
Identify areas which need to be revised, updated and integrated to reflect the current state of play and to align with the MEErP methodology.
This document is prepared to serve as input for the first "Kick off" meeting (27th June 2013, Barcelona). Experts not able to participate in this meeting are welcome to provide written comments at [email protected].
The report is structured in the following chapters:
Chapter 1 - Scope, defining the products and presenting relevant standards and legislation;
Chapter 2 - Markets, focusing on the economic and market analysis of taps and showers at the EU27 level;
Chapter 3 – Users and system aspects, describing user behaviour, key aspects influencing such practices and system aspects related to water supply and wastewater collection and treatment and demand of energy in affected systems;
Chapter 4 - Technologies, analysing products from a technical point of view with a special focus on design, technology and innovation;
Chapter 5 - Environmental and economic assessment of design options, providing a preliminary picture of the impacts associated with this product group.
Stakeholders are asked to carefully study the information presented in the individual chapters and to point out potential modifications and additions they deem necessary.
The steps needed to complete the study according to MEErP are presented at the end of each chapter. These also inform stakeholders where key decisions must be taken and where a gap of
9 http://susproc.jrc.ec.europa.eu/taps_and_showers/contactus.cfm

3
information must be filled with their support. Once the necessary data has been collected, this background document will be enlarged to address all sections prescribed in MEErP, including:
a revised environmental and economic assessment of base-cases, best available technologies and best not available technologies (Environment and Economics);
an analysis of the improvement potential for this product group (Design options);
an impact and sensitivity analysis (Scenarios Policy).
A first questionnaire to stakeholders has been sent in May 2013 to collect preliminary information for the study. A box is highlighted in each chapter to summarize the feedback received. Feedbacks received from the stakeholders before 14th June 2013 has been reported in this document. All feedback delivered afterwards will be presented during the kick off meeting and included in the background report.
Stakeholders are invited to comment on the material contained in this report in order to validate, revise and integrate the information presented. Additional questionnaires will also be sent in the coming weeks to fill any gaps of information needed to complete the study.


5
1 SCOPE
The objective of this chapter is to define the scope of the study in terms of definitions, classification, standards and legislation of relevance for taps and showers.
The rationale behind the choice of taps and showers is first presented. Following this, conventional classification systems used for this product group are analysed, and definitions for this product group are proposed. Product classifications and definitions of interest can include: those used in European trade statistics (Eurostat) and in labelling (e.g. the EU Ecolabel), those provided in international standards, those based on functionality aspects or related to affected energy system(s).
An overview of product standards and measurement methods is then provided. The main focus is on test protocols for primary/secondary performance parameters, resource use (e.g. water, energy) and emissions, as well as other issues like safety or hygiene. It is also investigated if any product-specific test procedures could potentially pose barriers for Ecodesign measures.
Finally, existing legislation of relevance for taps and showers is reviewed. This includes product policy instruments and measures, either mandatory or voluntary, at EU, Member States and third country level.
1.1 Preliminary screening New product groups considered of relevance for the Ecodesign Directive have been identified in the Commission Staff Working document on the Establishment of the Working Plan 2012-2014 under the Ecodesign Directive10. Among the product groups under consideration, water-related products (WrP) are evaluated as one the suitable for inclusion in the Ecodesign framework. Energy consumption can be directly associated to the use of such products (e.g. the consumption of electricity in taps due to the control of the water flow with sensors) or can be related to demand of energy in other interconnected systems (e.g. water supply, water heating, wastewater collection and treatment).
WrP can include a great variety of products, classified based on type and/or sector of application (e.g. agricultural, industrial, domestic urban and non-domestic urban). A preliminary screening performed by JRC11 presents an extensive analysis of different products and the estimation of the related water and energy consumptions and of the improvement potential at the EU27 level. The analysis mainly aimed at identifying products that have high water use, that have high water (and energy) savings potential, and that are not yet included in mandatory legislation (e.g. Ecodesign Directive and Industrial Emissions Directive12, previously known as Integrated Pollution Prevention and Control Directive). A lot of useful information are reported which can be used for calculating a rough estimation of water and energy consumption. The analysis highlights also the need of improving data quality and precision in order to obtain more refined figures. However, to the knowledge of the authors of the present report, this is so far the most comprehensive study comparing different WrP and allowing the identification of water-using products that might be considered under the Ecodesign Directive.
Greatest water uses have been found in agricultural WuP (e.g. sprinklers) and in urban WuP (e.g. toilets, taps, showers, bathtubs). Industrial water demand for cooling and boilers is also significant but only aggregated values are provided.
10 http://ec.europa.eu/enterprise/policies/sustainable-business/documents/eco-design/working-plan/ 11 http://susproc.jrc.ec.europa.eu/ecotapware/docs/Scoping%20document_WuP_100217.pdf 12 http://eur-lex.europa.eu/LexUriServ/LexUriServ.do?uri=OJ:L:2010:334:0017:0119:EN:PDF

6
Apart from agriculture and industrial applications, the highest water saving potential is associated to urban water consumption (including domestic/non-domestic), and there to sanitary tapware in bathrooms, i.e. taps and showers. Washing machines also present a significant saving potential, but this product group is already covered by the Ecodesing Directive.
Considered that taps and showers present the highest energy saving potential, these have been identified as the most suitable candidates to be included in the Ecodesign Workplan. In an additional study carried-out by VHK13 it has been estimated that the energy savings potential for taps and showers is 885 PJ/year in 2030, which is the highest among the products included in the priority list of the Working plan for the Ecodesign Directive (2012-2014).
The initial scope of this preparatory study covers taps and showers used to derive water for personal hygiene, cleaning, cooking and drinking in urban applications (both domestic and non-domestic). Non-domestic urban applications include premises such as restaurants, shops, hotels, schools, sport centres, hospitals, office and public buildings.
An insight on taps and showers is presented in the following sections and chapters of the present report.
1.2 Product classification and definition Taps and showers are a subgroup of plumbing fixtures consisting of several types of products which differ for functionality and/or design. The following non-exhaustive list gives an impression about the complexity of taps and showers:
Single-lever, single-outlet taps
Double-lever, single-outlet taps (thermostatic mixing valves)
Double-outlet taps (mechanical mixers)
Single taps and mixer taps
Mechanical mixers
Thermostatic mixing valves
Taps, showers and showerheads with flow rate regulators
Taps with aerators
Taps and showers with high flow barriers
Push-button taps and showers
Taps with control sensors or other automatic devices
Taps and showers with temperature regulators (e.g. thermostat)
Taps and showers with hot-barriers
Shower hoses and sink hoses for sanitary tapware;
Shower outlets for sanitary tapware;
Waste fittings.
Conventional classification systems used for taps and showers have been analysed in order to define and to describe the product group as more technically and coherently as possible. Product classifications and definitions of interest include: those used in European trade statistics, those 13 http://www.ecodesign-wp2.eu/downloads/FINAL%20REPORT%20Task%203%2016-12-2011.pdf

7
provided in international standards, those used in labelling schemes, those based on functionality aspects or related to affected energy system(s).
1.2.1 Classifications and definitions used for European trade statistics PRODCOM
The PRODCOM database14 contains statistics on the production of manufactured goods. Categories of relevance for taps and showers are reported in Table A1.1 of Annex I. A clear definition of the product based on PRODCOM is not possible. Water taps are included in category 28.14.12, which is differentiated into mixing valves (28.14.12.33) and other taps or valves (28.14.12.35). However, these categories contain also other types of valves used in different applications, e.g. for water cisterns. Showers might be included in 25.99.11.31, 25.99.11.35 and 25.99.11.37 (all related to sanitary ware and parts of sanitary ware) or in 22.23.12.90 (similar sanitary ware).
NACE
The Statistical Classification of Economic Activities in the European Community (NACE)15 shows a more aggregated structure compared to PRODCOM (see Table A1.1 of Annex I). All types of taps and valves are included in category 28.14, which group together sanitary, industrial and heating taps and valves. Similarly to what found in PRODCOM, showers might be included in categories 25.99 (fabricated metal products) and 22.23 (manufacture of plastic ware).
Combined Nomenclature
The disaggregation of the Combined Nomenclature (CN)16 is similar to PRODCOM (see Table A1.1 of Annex I). As in PRODCOM, mixing valves and other valves are differentiated (in categories 8481 80 11 and 8481 80 19, respectively) but no information is reported about the use of the product (sanitary, industry, heating). CN also disaggregates based on the materials used, while reference to showers is not explicit.
1.2.2 Classifications and definitions according to international standards An overview of existing classifications and definitions according to international standards is shown in table A1.2 of Annex I. Based on this, basic definitions can be proposed for taps and showers.
According to BS 6100-717, a tap may be defined as a “small diameter manually operated valve from which water is drawn”.
According to EN 1112:200818 and EN 13904:200319N 1112:2008 a shower may be defined as a ”fixed overhead shower outlet which directs water onto the user from above” or a “moveable hand held shower outlet which is connected to the sanitary tapware via a shower hose […] and can be hung directly on the tapware or on the wall with the aid of an appropriate support”. This would include both showerheads and shower headsets.
14 http://epp.eurostat.ec.europa.eu/portal/page/portal/prodcom/introduction 15 http://epp.eurostat.ec.europa.eu/portal/page/portal/nace_rev2/introduction 16 http://ec.europa.eu/taxation_customs/customs/customs_duties/tariff_aspects/combined_nomenclature/ 17 BS 6100-7:2008. Building and civil engineering. Vocabulary. Services. British Standards Institution, London 2008
18 EN 1112:2008. Sanitary tapware – Shower outlets for sanitary tapware for water supply systems of type 1 and type 2 – General technical specification.
European Committee for Standardization, Brussels 2008
19 EN 13904:2003. Low resistance shower outlets for sanitary tapware. European Committee for Standardization, Brussels 2003

8
1.2.3 Classifications and definitions according to existing labelling categories
Definitions for taps and showers have been discussed during the recent development of EU Ecolabel and GPP criteria for sanitary tapware20,21:
"tap" means a directly or indirectly, mechanically and/or automatically operated valve from which water is drawn;
"shower" means a combination of showerhead and interrelated control valves and/or devices.
"showerhead" means
a) a fixed overhead or side shower outlet, body jet shower outlet or similar device which may be adjustable, and which directs water from a supply system onto the user; or
b) a moveable hand held shower outlet which is connected to a tap with a shower hose and can be hung directly on the tap or on the wall with the aid of an appropriate support.
Definitions and classifications can also be found in other labelling schemes and water efficiency rating systems in place in the EU27 and worldwide. An overview of these is given in Table A1.3 of Annex I.
1.2.4 Other classifications and definitions Taps
Two different types of taps used in households can be distinguished: pillar taps and mixer taps22:
Pillar taps are considered devices that allow the user to control the flow rate but not to regulate temperature directly.
Mixer taps allow the user to regulate the temperature. Hot and cold water is mixed before to reach the outlet. Usually, the temperature can be set at any level between the maximum hot-water temperature and the cold-water temperature.
Subgroups of mixer taps can be defined depending on the number of mounting holes that are used to fix the tap to the sanitary fixture or wall:
Single-hole mixer taps (or mono-bloc mixer taps) need only one mounting hole. Commonly, these are single-lever mixer taps, however, also double-lever single-hole taps exist.
Two-hole and three-hole mixer taps need more than one mounting hole. In general, these are double-lever taps and always present the outlet separated from the operating controls.
Taps can be classified also based on other features, as shown in Table 1.1. For instance, flow rate can be fixed or variable and the water flow can be manually or automatically stopped after a certain time. Other characteristics include temperature control, installation and additional features reported in Table 1.1.
20 http://www.europarl.europa.eu/RegistreWeb/search/resultDetail.htm?language=EN&reference=COM-AC_DRC(2012)D020994-03&lg=&fragDocu=FULL?epbox 21 http://susproc.jrc.ec.europa.eu/ecotapware/stakeholders.html 22 Market Transformation Programme: BNWAT26: Household tapware – an overview. Market Transformation Programme, DEFRA 2008. Available at:
http://www.mtprog.com/spm/download/document/id/706

9
Table 1.1. Classification of taps based on technical features
Feature Options
Type Pillar / Mixer
Mixer lever Single / Double
Number of holes 1 to 4
Flow rate Fixed / Controllable
Flow stop Manual / Automatic
Temperature Fixed / Controllable
Installation Kitchen sink
Wash basin
Bathtub
Bidet
Outdoor
Additional features Pull-out spray
Swivel-neck
Thermostatic mixing valve
Showers
In general, showers can be composed of fixed showerheads or movable shower handsets. Shower handsets are usually connected to a mixing valve (most often a single lever mixing tap) through a flexible hose. In general, showerheads are more commonly used in public buildings (e.g. swimming pools, gyms).
Other characteristics of showerheads include the handset holder (if applicable) and the type of mixing valve which they are connected to (see Table 1.2).
Table 1.2. Classification of showers based on technical features
Feature Options
Type Fixed (showerhead) / Movable (handset)
Handset holder Fixed / Slide bar
Mixer lever Single / Double
Mixer used also for bathtub tap Yes / Not
Flow stop Manual / Automatic
Temperature Fixed / Controllable
Installation Shower
Bathtub
Outdoor
Additional features Power shower
Massage outlets

10
1.2.5 Proposed definitions The main function of taps and showers is to deliver water that is of a quality that is fit for human consumption and that has a desired temperature.
The initial scope of this preparatory study covers taps and showers used to derive water for personal hygiene, cleaning, cooking and drinking in urban applications (both domestic and non-domestic). Non-domestic urban applications include premises such as restaurants, shops, hotels, schools, sport centres, hospitals, office and public buildings.
For the purpose of this study, the proposed definitions are adapted from those agreed during the recent development of EU Ecolabel and GPP criteria for sanitary tapware:
"tap" means a directly or indirectly, mechanically and/or automatically operated valve from which water is drawn;
"shower" means a combination of showerhead and interrelated control valves and/or devices.
"showerhead" means
a) a fixed overhead or side shower outlet, body jet shower outlet or similar device which may be adjustable, and which directs water from a supply system onto the user; or
b) a moveable hand held shower outlet which is connected to a tap with a shower hose and can be hung directly on the tap or on the wall with the aid of an appropriate support.
So far, the list of products identified as out of the scope of the present study include bathtub taps and non-domestic special purpose taps and showers which need unrestricted water flow to fulfil the intended function (e.g. laboratory safety taps and showers).
Definitions might be refined / revised in the course of the study, depending on the information obtained from the techno-economic analysis.
1.2.6 Feedback from the 1st Questionnaire to stakeholders Definitions (#1)
Definitions generally appear clear and comprehensive.
For showers it has been suggested by some stakeholders to:
Consider “shower system” instead of “shower” and “shower” instead of “showerhead”
Make a difference between mixing valves and thermostatic valves to better identify the right standards
A request of including the following products within the scope of the study has been also received:
Instant hot water dispensers and electric shower heads
Household Food Waste Disposers installed in sinks (http://www.insinkerator.com)
Shower heat exchanger (http://www.ecodrain.ca/)
Examples of niche products provided by stakeholders (#2)
Kettle filling taps or sink filling taps for industrial kitchens
11
Pre-rinse shower unit
Shower panel
Prodcom Classification and CN codes (#3, 4a)
The information presented generally appears comprehensive. Prodcom classification is the only nomenclature used by industry. Former statistics with more detailed categories have been withdrawn because of Anti-Trust problems.
However, it was highlighted that pillar taps are not covered within Prodcom categories, at the moment.
Functions (#5)
The description of the function(s) of taps and showers is considered satisfactory but not exhaustive.
First of all, the term “consumption” should be changed with “use”.
Primary functions for taps could include:
Delivering water without impairing its hygienic and organoleptic quality
Allowing the user to control the amount of water delivered
In addition to the ones above, primary functions for mixing taps could also include:
Allowing the user to control the temperature of water at the outlet.
Primary function(s) for showers could include:
Delivering water without impairing its hygienic and organoleptic quality
Providing an effective and comfortable rinsing performance
The secondary function could be that use of the products should be safe for users and buildings.
Alternative interpretations have been provided:
Delivering water that is of a quality that is fit for human consumption (I) and that has a desired temperature and flow rate (II);
Delivering good hygienic quality water (I) that enable users to save water and to use water for wellness applications (II)
Delivering water at the intended quality in a suitable quantity and fashion to facilitate the desired activity;
Delivering water in a safe (I) and efficient (II) way.
For industrial kitchen taps, the main function could also be to clean dishes or to deliver water to prepare foodstuff or as an ingredient of food.
Summing up, main functions cover aspects related to: quality, flow rate and temperature control, comfort, safety.

12
1.3 Measurement methods and standards This section describes the most relevant tests and standards for taps and showers related to:
Functional performance parameters;
Safety;
Noise;
Any other parameter considered of relevance.
These have been grouped in:
Standards valid at International and European Community level;
Standards valid at Member State level;
Third-Country standards.
1.3.1 Standards at International and European Community level In the European Committee for Standardization (CEN)23 there are three Technical Committees (TC) which deal with sanitary appliances (TC 163), water supply (TC 164) and wastewater treatment (TC 165). Each TC is composed of working groups that are responsible for specific testing issues, as indicated in Annex I in Table A1.3.
16 CEN standards of relevance for taps and showers at the product level have been identified. These are reported in Annex I in Table A1.4. Characteristics for which testing procedures are established include:
Mechanical strength;
Acoustics;
Hydraulic characteristics (e.g. flow rate, spray pattern);
Materials;
Dimensions;
Mechanical endurance;
Leak tightness;
Backflow protection;
Mechanical performance under pressure;
Maintenance issues.
Other European standards deal with product-related issues (e.g. sanitary ware; piping; waste water system; drinking water regulations) however these are not considered here.
One of the most important European Standards for taps is the standards EN 200:200824 that applies to draw-off taps used in toilets, bathrooms and kitchens. This standard allows classifying taps based on certain characteristics (e.g. supply system, type of tap, intended use, mounting method).
In terms of type, a distinction is made between pillar taps bib taps, and (single-hole/multi-hole)
23 https://www.cen.eu/cen/pages/default.aspx 24 EN 200:2008. Sanitary tapware – Single taps and combination taps for water supply systems of type 1 and type 2 – General technical specification. European
Committee for Standardization, Brussels 2008
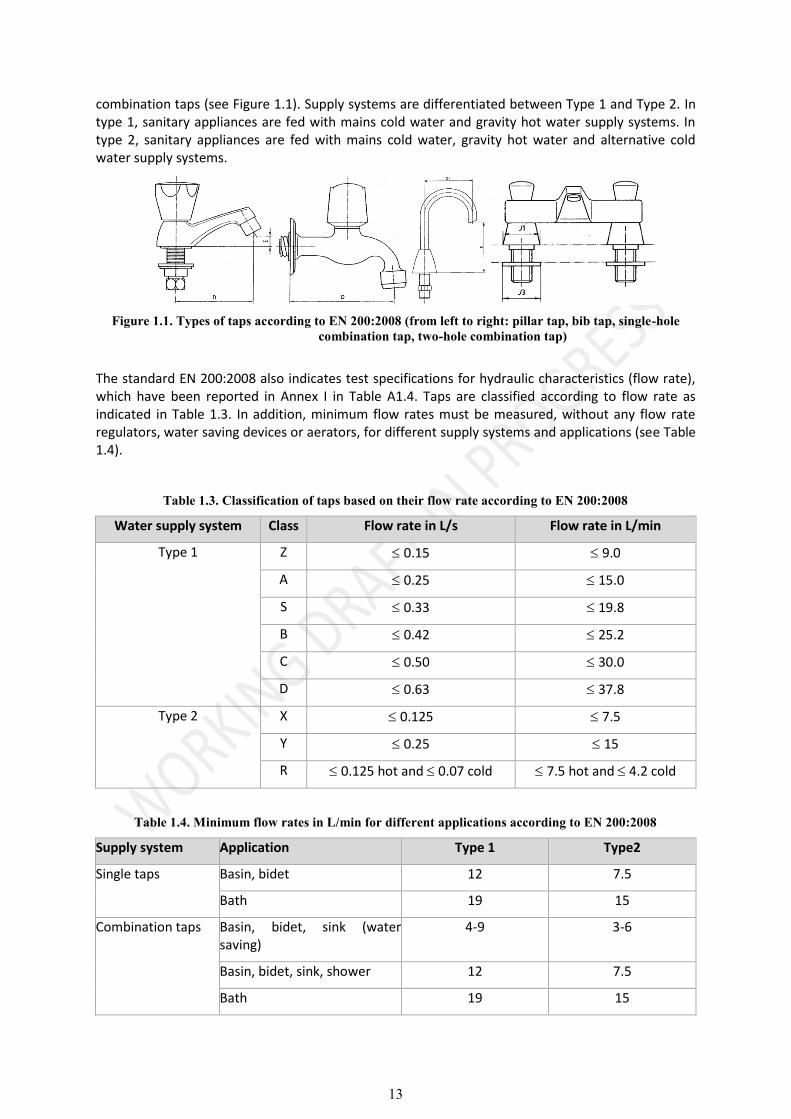
13
combination taps (see Figure 1.1). Supply systems are differentiated between Type 1 and Type 2. In type 1, sanitary appliances are fed with mains cold water and gravity hot water supply systems. In type 2, sanitary appliances are fed with mains cold water, gravity hot water and alternative cold water supply systems.
Figure 1.1. Types of taps according to EN 200:2008 (from left to right: pillar tap, bib tap, single-hole combination tap, two-hole combination tap)
The standard EN 200:2008 also indicates test specifications for hydraulic characteristics (flow rate), which have been reported in Annex I in Table A1.4. Taps are classified according to flow rate as indicated in Table 1.3. In addition, minimum flow rates must be measured, without any flow rate regulators, water saving devices or aerators, for different supply systems and applications (see Table 1.4).
Table 1.3. Classification of taps based on their flow rate according to EN 200:2008
Water supply system Class Flow rate in L/s Flow rate in L/min
Type 1 Z 0.15 9.0
A 0.25 15.0
S 0.33 19.8
B 0.42 25.2
C 0.50 30.0
D 0.63 37.8
Type 2 X 0.125 7.5
Y 0.25 15
R 0.125 hot and 0.07 cold 7.5 hot and 4.2 cold
Table 1.4. Minimum flow rates in L/min for different applications according to EN 200:2008
Supply system Application Type 1 Type2
Single taps Basin, bidet 12 7.5
Bath 19 15
Combination taps Basin, bidet, sink (water saving)
4-9 3-6
Basin, bidet, sink, shower 12 7.5
Bath 19 15
14
1.3.2 Standards at Member State level This section collects information about relevant sources of tests and product standards in different Member States. Summary description of main standards of interest has been reported in Annex I in Table A1.5.
Austria
Considering quality and longevity, the tapware has to conform to the following Austrian standards:
Single-lever mixers have to comply ÖNORM EN 817;
Thermo-mixers have to comply with ÖNORM EN 1111;
Aerators have to comply with ÖNORM EN 246.
Germany
National standards, recommendations and guidelines have been developed in Germany by VDI (Association of German Engineers) and DVGW (German Technical and Scientific Association for Gas and Water).
Sweden
A standard method for determining the energy efficiency of taps is applied in Sweden (SS 820 000:201025). The standard does not prescribe the measurement of technical parameters, like the flow rate, but it describes the efficiency of the tap water device by measuring the time it takes to rinse a dirty test dishcloth. This test is performed at different water temperatures and flow rates and it should represent a “normal and frequent use of tap water”.
United Kingdom
A significant number of British Standards have been identified in addition to EN standards (see Table A1.5 in Annex I). Interestingly, BS 5388:197626 for spray taps also includes testing specifications for the spray form. For showerheads, BS 6340-4:198427 specifies testing procedures for spray form and spray trajectory.
1.3.3 Third Country Standards. This section collects information about the relevant sources of tests and product standards in Third Countries. Summary description of main standards of interest has been reported in Annex I in Table A1.5.
Australia & New Zealand
In Australia and New Zealand, several standards concerning taps and showerheads exist (see Table A1.5 in Annex I). In particular, AS/NZS 6400:250028 specifies the requirements for the Australian Water Efficiency Labelling and Standards (WELS) scheme29.
Honk Kong
AS/NZS 3662:200530 is the test standard used in the Hong Kong's WELS for water flow rates of showerheads.
25 SS 82000:2010. Sanitary tapware - Method for determination of energy efficiency of mechanical basin and sink mixing valves. Swedish Standards Institute, Stockholm
2010
26 BS 5388:1976. Specification for spray taps. British Standards Institution, London 1976
27 BS 6340-4:1984. Shower units – Part 4: Specifications for shower heads and related equipment. British Standards Institution, London 1984
28 AS/NZS 6400:2005. Water efficient products – Rating and labelling. Standards Australia & Standards New Zealand, Sydney/Wellington, 2005
29 http://www.waterrating.gov.au/
15
Singapore
Test standards applied in Singapore are developed internally or are adopted from other countries31:
For taps, either SS 448-3:1998 (that is very similar to EN 200:2008) or BS 5412:1996 (that is replaced by EN 200:2008) apply.
For mixers, N 817:200832 applies.
AS/NZS 3662:200530 is the reference for water flow rates of showerheads..
South Korea
Korean test standards related to taps and showerheads are specified in the Korean eco-label legislation. Only one standard for taps has been found (KS B 2331:2009). Korean standards for showers have not been identified.
Switzerland
In Switzerland, most EN standards apply, too. In addition, the SIA (Swiss society of engineers and architects) has issued guidelines for efficient water use in buildings.
1.3.4 Feedback from the 1st Questionnaire to stakeholders EN and ISO standards (#4b, 6)
Information appears comprehensive even if some recommendations are made:
EN 806-1; -2; -3; -4; -5 on "Specifications for installations inside buildings conveying water for human consumption" should be considered
EN 1717 could be deleted because it does not deal directly with sanitary tapware and cannot be used to classify products
EN 12056-1;-2;-3;-4;-5 on "Gravity drainage systems inside buildings" are standard of potential interest
EN 13618 is a published standard (prEN terminology is obsolete). However it deals with flexible hoses, which can be used as components of taps. Therefore, it is not a standard directly related to the products and it could be deleted
EN 13904 and EN 13905 can be deleted
EN 15091:2007-03 on “Sanitary tapware - Electronic opening and closing sanitary tapware” should be considered
EN 16145:2012 on "Extractable outlets for sink and basin mixers — General technical specification" should be added
EN 16146:2013 on "Extractable shower hoses for sanitary tapware for supply systems type 1 and type 2 — General technical specification" should be added
DIN 1988-100;-200;-300;-8;-500;-600;-7 are other national standards of interest.
Other information of relevance for standards is reported in the following.
30 AS/NZS 3662:2005. Performance of showers for bathing. Standards Australia & Standards New Zealand, Sydney/Wellington, 2005
31 Public Utilities Board: Water Efficiency Labelling Scheme (voluntary & mandatory). PUB. Republic of Singapore. 2009. Available at:
http://www.pub.gov.sg/wels/rating/Documents/WELS_Guidebook.pdf
32 EN 817:2008. Sanitary tapware – Mechanical mixing valves (PN 10). General technical specifications. European Committee for Standardization, Brussels
2008

16
a) Functional performance parameters
As of 2013, no standard allows characterizing the fitness for contact with drinking water
For rinsing effectiveness of showers, there is no standard today at European level. A method is described in ASTM F 2324 but is not very reliable. BS 6340-4 and AUS/NZ 3662 describe methods to assess the distribution of the flow out of the showerhead, but don’t correlate with efficiency. A method is being developed in CEIR for eventual future integration in product standard.
b) Resources use (energy, water and other materials)
Product Category Rules for LCA are detailed in EN 15804, related to the environmental impact of construction products
DIN 1988-300:2012-05 on Codes of pratice for drinking water installations-Part 300: Pipe Sizing
EN 27842:1991-11 on Automatic steam traps; determination of discharge capacity; test methods
Statement of the HKI association (industrial kitchen equipment), available on http://www.hki-online.de/pdf/gk/Klima%20schuetzen%20und%20Kosten%20senken.pdf, on energy saving
c) Water abstraction, impoundment, storage, treatment and distribution of surface water or groundwater:
Information could be asked to EUREAU (at European level), FP2E (France), Water UK, the UK Environment Agency, Ofwat (UK) and water undertakers across Europe.
d) waste production
Information could be asked to Defra and/or WRAP (UK)
e) emission measurement:
Information could be asked to DECC (UK)
f) safety
EN 1287 Sanitary tapware – Low pressure thermostatic mixing valves; general technical specification
EN 15092 Building valves – Inline hot water supply tempering valves – Tests and requirements
g) noise and vibrations
Product standards deal with noise
EN 200: 2008-10 Sanitary tapware – Single taps and combination taps for water supply systems of type 1 and type 2 – General technical specification
EN 1112:2008-06 Sanitary tapware – Shower outlets for sanitary tapware for water supply systems of type 1 and type 2-Gneral technical specification
h) waste-water collection and treatment which subsequently discharge into surface water.
EN 12056 and DIN 1986-30;-100
17
1.4 Legislation, voluntary agreements and labels This section identifies legislation of relevance for sanitary taps and showers. The section is subdivided in three parts:
Legislation, voluntary agreements and labels at the European Community level;
Legislation, voluntary agreements and labels at Member State level;
Third Country Legislation, voluntary agreements and labels.
1.4.1 Legislation, voluntary agreements and labels at European Community level
Ecodesing and Energy labelling
No mandatory legislation or voluntary agreements currently exist at European Community level for taps and showers. However, energy labelling and ecodesign measures exist for other water related products.
The Energy Labelling Directive33 was introduced to allow consumers to choose energy-efficient household appliances. In addition, the consumption of other resources or additional information is included into the label (e.g. water consumption, noise). So far, energy labels are mandatory for water related products as refrigerators, freezers, washing machines, tumble driers, dishwashers, water heaters).
Within the framework of the Ecodesign Directive34, minimum requirements have been set for dishwashers35 and washing machines36.
Ecolabel
The EU Ecolabel scheme was introduced in 1992 by Council Regulation 880/92 to enable consumers to easily identify more environmental friendly products. The scheme was amended in 2010 by the Regulation EC 66/201037.
EU Ecolabel criteria for sanitary tapware (including both taps and showers) have been positively voted in November 201238. Criteria for awarding the EU Ecolabel to sanitary tapware include:
1. Water consumption and related energy saving
2. Materials in contact with drinking water
3. Excluded or limited substances and mixtures
4. Product quality and longevity
5. Packaging
6. User information
7. Information appearing on the EU Ecolabel
33 http://eur-lex.europa.eu/LexUriServ/LexUriServ.do?uri=OJ:L:2010:153:0001:0012:en:PDF 34 http://eur-lex.europa.eu/LexUriServ/LexUriServ.do?uri=OJ:L:2009:285:0010:0035:en:PDF 35 http://www.eceee.org/Eco_design/products/domestic_dishwashers/ 36 http://www.eceee.org/Eco_design/products/domestic_washing_machines/ 37 http://eur-lex.europa.eu/LexUriServ/LexUriServ.do?uri=OJ:L:2010:027:0001:0019:EN:PDF 38 http://www.europarl.europa.eu/RegistreWeb/search/resultDetail.htm?language=EN&reference=COM-AC_DRC(2012)D020994-03&lg=&fragDocu=FULL?epbox
18
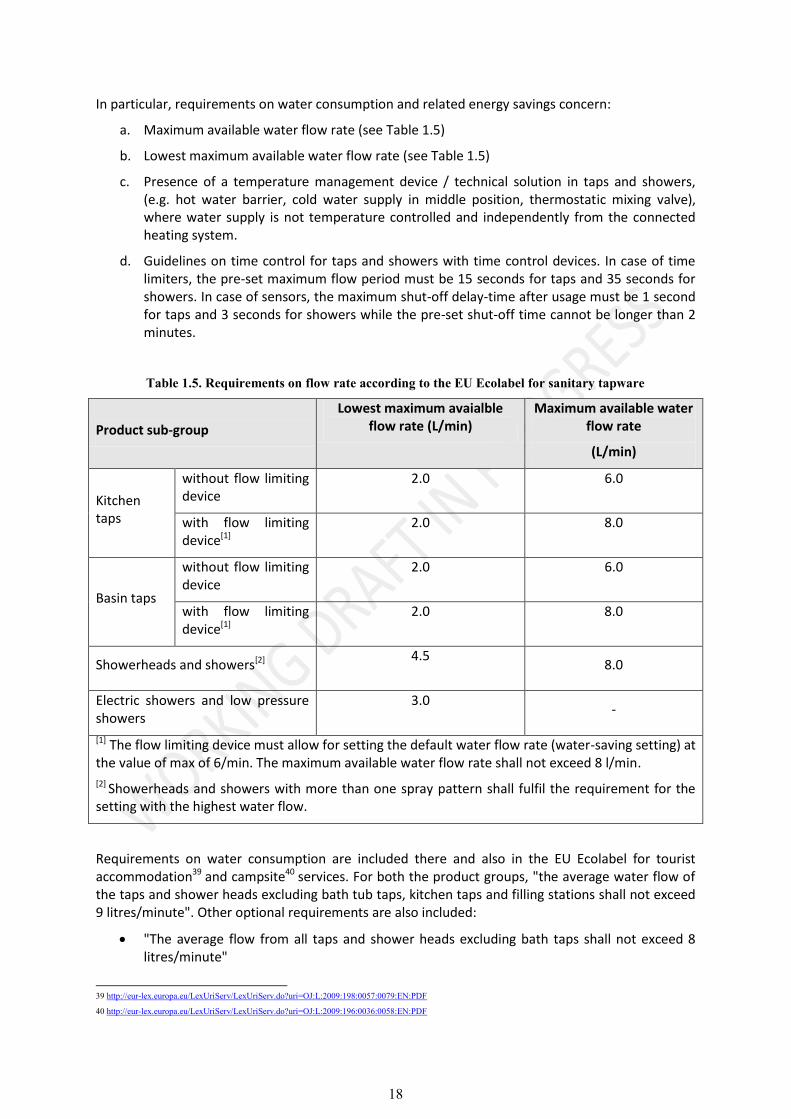
In particular, requirements on water consumption and related energy savings concern:
a. Maximum available water flow rate (see Table 1.5)
b. Lowest maximum available water flow rate (see Table 1.5)
c. Presence of a temperature management device / technical solution in taps and showers, (e.g. hot water barrier, cold water supply in middle position, thermostatic mixing valve), where water supply is not temperature controlled and independently from the connected heating system.
d. Guidelines on time control for taps and showers with time control devices. In case of time limiters, the pre-set maximum flow period must be 15 seconds for taps and 35 seconds for showers. In case of sensors, the maximum shut-off delay-time after usage must be 1 second for taps and 3 seconds for showers while the pre-set shut-off time cannot be longer than 2 minutes.
Table 1.5. Requirements on flow rate according to the EU Ecolabel for sanitary tapware
Product sub-group
Lowest maximum avaialble flow rate (L/min)
Maximum available water flow rate
(L/min)
Kitchen taps
without flow limiting device
2.0 6.0
with flow limiting device[1]
2.0 8.0
Basin taps
without flow limiting device
2.0 6.0
with flow limiting device[1]
2.0 8.0
Showerheads and showers[2] 4.5
8.0
Electric showers and low pressure showers
3.0 -
[1] The flow limiting device must allow for setting the default water flow rate (water-saving setting) at the value of max of 6/min. The maximum available water flow rate shall not exceed 8 l/min.
[2] Showerheads and showers with more than one spray pattern shall fulfil the requirement for the setting with the highest water flow.
Requirements on water consumption are included there and also in the EU Ecolabel for tourist accommodation39 and campsite40 services. For both the product groups, "the average water flow of the taps and shower heads excluding bath tub taps, kitchen taps and filling stations shall not exceed 9 litres/minute". Other optional requirements are also included:
"The average flow from all taps and shower heads excluding bath taps shall not exceed 8 litres/minute"
39 http://eur-lex.europa.eu/LexUriServ/LexUriServ.do?uri=OJ:L:2009:198:0057:0079:EN:PDF 40 http://eur-lex.europa.eu/LexUriServ/LexUriServ.do?uri=OJ:L:2009:196:0036:0058:EN:PDF
19
"At least 95 % of taps shall allow a precise and prompt regulation of the water temperature and of the water flow"
"All showers in staff facilities, outdoor and common areas shall have a timing/proximity device, which interrupts water flow after a defined time or if not in use".
1.4.2 Legislation, voluntary agreements and labels at Member State level Relevant information about legislation, agreements and labels implemented at Member State level is reported in Annex I in Table A1.6. From the comparison between the different Member States it is possible to see that:
Mandatory legislation is generally not in place and when applied this is usually done at regional or municipal level and in accordance with the national building code;
Ecolabel schemes are the most typical form of voluntary legislation for taps and showers, both with respect to the product itself or its use in accommodation services and buildings;
Labelling can be based on pass-fail criteria or on water efficiency rating systems;
Other voluntary measures include codes or guidelines for sustainable buildings.
1.4.3 Third Country legislation Relevant information about legislation, agreements and labels implemented in Third Countries is reported in Annex I in Table A1.7. From the comparison between the different Member States it is possible to see that:
As it is the case in EU Member States, the majority of policy tools applied in Third Countries is represented by voluntary eco-labels. Some of these schemes only address accommodation services, and not specific products.
Mandatory measures exist only in some countries (e.g. Australia, Canada, or Singapore). In general, mandatory requirements are defined via water efficiency labelling schemes, however, also requirements due to building codes exist.
1.4.4 Feedback from the 1st Questionnaire to stakeholders Legislation and product policy instruments (#4c, 4d, 6)
A clear distinction should be made between regulatory instruments (mandatory or voluntary) and labels. Some recommendations on how to revise this section are reported in the following.
Regulatory instruments on products and their applications should consider:
Schemes for the market approval of water using products. Moreover, since these differ from country to country (e.g. Austria – ÖVGW; Belgium – Belaqua; DK – VA approval and the new water drop; “approved for drinking water”; Germany- DVGW approval; Norway – Sintef; Switzerland – SVGW; UK - WRAS approval) an harmonized system would be necessary. Economic burdens of approvals do not depend on the size of companies.
The National Building Code of Finland that covers "water supply and drainage installations for buildings". In particular, Regulation 2.6.3 states that "Water supply system must be concise. Water supply system must be done so that its durability and dependability are secured for the whole planned life expectancy" and Instruction 2.6.3.1 states that "The quality of the water must be taken into consideration when materials for water supply

20
system are selected. Pipe materials, types of joints and nominal sizes of water supply systems are presented in appendix 3. The materials of the components of the pipework, like valves, fittings, pumps, water meters, should be corrosion proof and fit for use of food products. Parts of brass components, which are in contact with water, should be manufactured from dezincification resistant brass. Small amount of dezincification is allowed for water fixtures".
French regulation on energy performance of buildings ("Reglementation Thermique 2012") that includes a calculation method for taps.
Regulations of relevance for products in contact with drinking water such as the German Drinking Water Regulation, that contains a list of applicable materials (§ 17).
The UK Water Technology List and, more in general, the UK Water Regulations. For the UK it has been also reported that the UK building regulations are currently under revision and this may have an influence on water use in new homes.
Information on labelling is considered being comprehensive. However,
Reference to EU Ecolabel and GPP criteria should be made also in Annex I;
The French “Marque NF” should be added. In this scheme, products are tested and ranked according to nominal flow rate and some technical features as flow and temperature management;
WELL is not a national labelling scheme but an European system;
Voluntary environmental labelling for buildings such as LEED(USA), BREEAM (GB), DNGB (Germany) and HQE (France) could be considered. In particular, BREEAM is of relevance also for non-domestic applications;
Labelling schemes should be harmonised.
Other legislation of relevance for different aspects related to the products is reported in the following.
a) Functional performance parameters
National Building Code of Finland
Water Supply (Water Fittings) Regulations in the UK. Most functional aspects are covered by product standards
b) resources use (energy, water and other materials)
National Building Code of Finland
Water Supply (Water Fittings) Regulations in the UK
c) water abstraction, impoundment, storage, treatment and distribution of surface water or groundwater:
Information could be asked to EUREAU (at European level), FP2E (France), Water UK, the UK Environment Agency, Ofwat (UK) and water undertakers across Europe.
d) waste production :
Information could be asked to Defra and/or WRAP (UK)
e) emission measurement:
Information could be asked to DECC (UK)

21
f) safety:
The French regulation asks for the hot water to be delivered below 50°C at the use point
In the UK there are specific safety issues for the delivery of hot water in healthcare premises (e.g. Model NHS engineering Specification D 08). Additionally Scottish and English Building Regulations also cover hot water safety to baths and other appliances
g) noise and vibrations
no indications provided
h) waste-water collection and treatment which subsequently discharge into surface water.
The Building Regulations – Sustainable Drainage Requirements - controls this in the UK.
1.5 Potential barriers to producers due to standards and legislation
1.5.1 Feedback from the 1st Questionnaire to stakeholders Some stakeholders believe that all the elements presented have the potential to cause economic barriers and difficulties to producers. On the opposite, some other stakeholders consider that there are no technical constraints or economic barriers creating difficulties to producers.
More specific comments are reported in the followings:
Approvals are a market-entry barrier for SMEs and they should be harmonized between countries.
The variety of different schemes, labels and associated certifications is a clear problem for manufacturers. This represents both a technical problem, due to sometimes antagonist criteria, and economic problem due to the very high associated costs.
The national requirements for materials accepted in contact with drinking water are different in EU Member States. This creates barriers for trade. The 4MS procedure has not been discussed or accepted at EU level;
New legislation in Denmark – ‘ Godkendt til Drikkevand’ would require specific marking and testing for taps.
The German Drinking Water Regulation (§ 17) and the requirements of the federal environmental agency (UBA) set criteria for the applicability of materials aiming at a higher standard of drinking water quality.
Flow Rate requirements in Finland are different compared to rest of the Europe. This is perceived as a technical barrier that could lead to the creation of extra burdens and costs.
Producers would have difficulties to respect restrictions on the content of hazard substances in materials without applying the same derogations specified in the EU Ecolabel criteria for sanitary tapware.
22
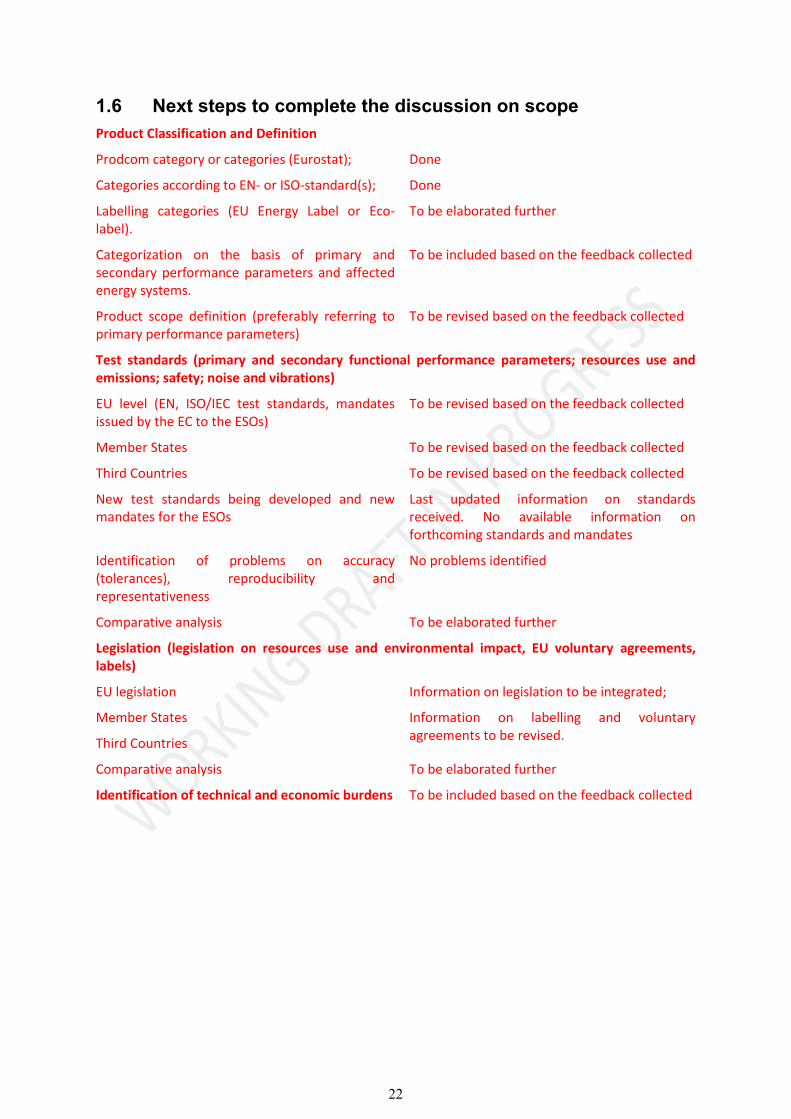
1.6 Next steps to complete the discussion on scope Product Classification and Definition
Prodcom category or categories (Eurostat); Done
Categories according to EN- or ISO-standard(s); Done
Labelling categories (EU Energy Label or Eco-label).
To be elaborated further
Categorization on the basis of primary and secondary performance parameters and affected energy systems.
To be included based on the feedback collected
Product scope definition (preferably referring to primary performance parameters)
To be revised based on the feedback collected
Test standards (primary and secondary functional performance parameters; resources use and emissions; safety; noise and vibrations)
EU level (EN, ISO/IEC test standards, mandates issued by the EC to the ESOs)
To be revised based on the feedback collected
Member States To be revised based on the feedback collected
Third Countries To be revised based on the feedback collected
New test standards being developed and new mandates for the ESOs
Last updated information on standards received. No available information on forthcoming standards and mandates
Identification of problems on accuracy (tolerances), reproducibility and representativeness
No problems identified
Comparative analysis To be elaborated further
Legislation (legislation on resources use and environmental impact, EU voluntary agreements, labels)
EU legislation Information on legislation to be integrated;
Information on labelling and voluntary agreements to be revised.
Member States
Third Countries
Comparative analysis To be elaborated further
Identification of technical and economic burdens To be included based on the feedback collected

23
2 MARKET ANALYSIS
The objective of this chapter is to provide an overview of the market for taps and showers, in particular focusing on:
The quantification of the EU production and trade volume in terms of units;
The quantification of the EU market size in terms of products sold and products already installed (the stock);
The definition of the market and production structure in terms of countries, producers and trends;
The quantification of users' expenditures.
Relevant background information is contained in the documentation supporting the development of EU Ecolabel and GPP criteria for sanitary tapware41. In that project, the evidence base was being gathered in line with the MEEuP tool methodology. In the present preparatory study, this has to be updated according to the MEErP methodology.
2.1 Generic economic data 2.1.1 Introduction This section describes the data derived from official EU statistics regarding taps and showers and aims to estimate the apparent EU consumption of these products based on the formula:
Sales in EU-27 = Production in EU-27 + imports from third countries (to EU-27) – export to third countries (from EU-27)
PRODCOM categorisation can be used for obtaining statistics on the production while information on import and export are provided with the Combined Nomenclature (CN) codes. However, due to some inherent limitations of the EU statistics, a number of assumptions and calculations have to be done.
PRODCOM is a system for the collection and dissemination of statistics on the production of manufacturing goods. For those products that are manufactured within a MS’s territory a MS should report on: (1) the value of production in Euros, (2) the volume sold in thousands of units and (3) the total weight in thousands of kilograms. It should be noted that National Statistical Institutes in each MS are not required to survey businesses with less than 20 employees. Thus it is impossible to know whether all the production has been reported or what percentage of production has been quantified. However in the context of taps and showers, the market is mainly made of large producers and small businesses would more likely involve manufacturers and marketing of high-end products.
Combined Nomenclature (CN) is a system for the collection and dissemination of statistics on EU trade. The system is used by the European Union for statistical and tariff purposes. Data on the value (Euro) of trades (internal and external) as well as on the quantity (kg) traded are reported.
PRODCOM statistics have to be comparable with external trade statistic (CN). For that reason Eurostat publishes on an annual basis a list with the CN codes and the corresponding PRODCOM codes to define the relationship between the two nomenclatures. For each PRODCOM code, one or more CN code corresponds.
The PRODCOM categories and their corresponding CN codes of relevance for taps and showers are fully listed in Annex I, Table A1.1. No product category is specifically focusing on taps and showers.
41 http://susproc.jrc.ec.europa.eu/ecotapware/docs/First%20Interim%20Report%20-%20Updated%20draft%2004%2003%2011.pdf

24
Taps are aggregated together with other items (e.g. industrial valves or valves and taps for other purposes) in two categories. For showers it is difficult to identify clearly which category they are reported in.
Within the development of the EU Ecolabel and GPP criteria for sanitary tapware, it was decided to use the codes reported in Table 2.1, based on discussion with the UK’s Office of National Statistics (ONS) and manufacture associations of taps and showers around Europe.
Table 2.1: Taps and Showers - 2009 CN codes with corresponding PRODCOM codes
Code Description
Prodcom 28.14.12.33 Mixing valves for sinks, wash basins, bidets, water cisterns etc excluding valves for pressure-reducing or oleohydraulic/pneumatic power transmissions, check valves, safety/relief valves
CN 8481 80 11 Mixing valves for sinks, washbasins, bidets, water cisterns, baths and similar fixtures
Prodcom 28.14.12.35 Taps, cocks and valves for sinks, wash basins, bidets, water cisterns etc excluding valves for pressure-reducing/oleohydraulic transmissions, check, safety, relief and mixing valves
CN 8481 80 19 Taps, cocks and valves for sinks, washbasins, bidets, water cisterns, baths and similar fixtures (excl. Mixing valves)
2.1.2 EU production During the development of EU Ecolabel and GPP criteria for sanitary tapware, EU production in 2008 has been evaluated for the two PRODCOM categories identified in section 2.1.1 (28.14.12.33 and 28.14.12.35). Comprehensiveness of these must be checked and data updated.
Background information on production for all Member States is reported in Annex II, Table A.2.1. Data refers to 2008 and is expressed in both thousands kilograms and millions of euro (M€).
In 2008, the EU-27 production was 133,042 thousands kg and 2,722 M€ for the 28.14.12.33 category, and 218,058 thousands kg and 2,400 M€ for the 28.14.12.35 category. In general, it can be seen that:
For code 28.14.12.33, Italy and Germany were by far the largest producers in terms of mass of product followed by Portugal and Spain. Looking at the value of the production in euros, Germany was leading followed by Italy.
For code 28.14.12.35, Italy was again the largest producer followed by France and Spain. However, looking at the value of the production in euros, it appears that Italy was the leader followed by France.
Two key parameters have to be defined in order to convert the the above production data from kg to production units:
1. The average weight of the different product types, and
2. The split/ratio of the different products reported under the two Prodcom codes.
This information can then be used to provide a baseline estimation of the production in terms of product units.

25
Background research of manufacturer’s product catalogues and of other similar sources, performed during the development of the EU Ecolabel and GPP criteria for sanitary tapware, enabled the assessment of the average weight of different product types, as reported in Table 2.2.
Moreover, based on the stock model (see section 2.2.1), it was assumed that, in terms of units, production and consumption of taps and showers is split as follows:
75% taps
25% showers.
It was calculated that approximate production of taps and showers in the EU-27 corresponds to 164,578 and 54,859 thousands, respectively. More detailed background production data across all MS are reported in Annex II, Table A.2.2.
Table 2.2 Average products weight42
Product Average weight
(kg)
Kitchen taps 2.2
Bathroom basin taps 1.8
Average for taps 2.0
Shower heads 0.4
2.1.3 EU trade 2.1.3.1 Total value of EU Trade Eurostat statistics on imports and exports, presenting the sum of EU-27 Intra and Extra Europe trade data for taps and showers, are to be evaluated considering CN codes 8481 80 11 (Mixing valves for sinks, washbasins, bidets, water cisterns, baths and similar fixtures) and 8481 80 19 (Taps, cocks and valves for sinks, washbasins, bidets, water cisterns, baths and similar fixtures - excl. Mixing valves), as shown in Table 2.1.
Background information on the Eurostat statistics on imports and exports (in thousands kg of products and Million € - referred to the year 2008) are reported in Annex II, Table A.2.3. In general, it can be seen that:
For code CN 8481 8011 the largest importers in 2008, both in terms of mass and value, were Germany, France, Italy and the UK. The largest exporters, both in terms of mass and value, were Germany, Italy, Portugal and Bulgaria.
For code CN 8481 8019 the largest importer in terms of mass and value was the UK, followed by Germany, Italy and Spain. The largest exporter in term of mass was Italy, followed by Germany, Spain and the UK. Italy had the greatest export value, followed by Germany, France and Spain.
In order to calculate import and exports in terms of product units, the same assumptions used for converting the production data can be used. Background information derived during the development of EU Ecolabel and GPP criteria for sanitary tapware are reported in Annex II, Tables A.2.4 and A.2.5.
42 http://susproc.jrc.ec.europa.eu/ecotapware/docs/First%20Interim%20Report%20-%20Updated%20draft%2004%2003%2011.pdf
26
It was calculated that:
101,313 thousands of taps and 33,771 thousands of showers are imported into the EU-27
80,468 thousands of taps and 26,823 thousands of showers are exported from the EU-27.
2.1.3.2 Intra-EU Trade and Extra-EU Trade The breakdown of the total value of trade within and outside the EU-27 is summarised in the following paragraph.
Background information gathered during the development of EU Ecolabel and GPP criteria for sanitary tapware on intra Europe and extra Europe import and export values are reported in Annex II. Main findings are reported in the following.
For code CN 8481 8011 (Mixing valves for sinks, washbasins, bidets, water cisterns, baths and similar fixtures)
Italy was the largest producer followed by the UK and Poland. Looking at the value of the production, Italy was again leading but followed by Germany.
The largest importers were Germany, France, Italy and the UK, and it was the same countries that had the largest imports in term of monetary value.
The largest exporters were Germany, Italy, Portugal and Bulgaria. Again the same countries had the largest exports in monetary value.
For code CN 8481 8019 (taps, cocks and valves for sinks, washbasins, bidets, water cisterns, baths and similar fixtures - excl. mixing valves)
Italy is the largest producer followed by Germany and Portugal. However, looking at the value of the production it appears that Germany is the largest producers, followed by Italy.
The largest importer was the UK, followed by (in order) Germany, Italy and Spain. Again the same countres had the largest monetary value.
The largest exporters were topped by Italy, followed (in order) by Germany, Spain and the UK. In term of monetary value, the export were topped by Italy, but followed by Germany, France and Spain.
2.1.4 EU sales and trade Starting from the information gathered, apparent consumption of taps and showers in the EU-27 in terms of product units has been calculated based on the following formula:
EU-27 sales and trade = production in EU-27 + imports to EU-27 – export from EU-27
Results obtained during the development of EU Ecolabel and GPP criteria for sanitary tapware are shown in Annex II, Table A.2.6. In general, it can be observed that Italy was estimated to present the largest apparent consumption of taps (21.6% of the total), followed by Germany (9.7%) and France (8.4%) of the overall apparent consumption. In any case, these figures are to be considered rough estimations for understating the magnitude of the apparent consumption in different Member States.

27
2.1.5 Feedback from the 1st Questionnaire to stakeholders Basic market data for EU-27 or specific Member States (#8)
France
8 millions of units of taps sold for domestic use in 2009
1.85 millions of units of taps sold for non-domestic use in 2009
2.5% growth rate in value in 2012 according to MSI study. Volume in units was however stable.
UK
7 million of taps sold in 2012, sales could decrease by 28%
2.3 million of showers sold in 2012, sales could decrease by 28%
Market composition in terms of companies' turnover and number of employees (#9i)
Company Taps (%) Showers (%)
Showerheads (%)
SME(*) 50%, (trend to 0%)
100% for industrial kitchen taps in Germany
Large 50% (trend to 100%)
Key Players
For industrial kitchen taps in Germany: Echtermann, Knauss, KWC Germany
(*) number of employees < 250 and annual turnover < 50 M€, and/or annual balance sheet < 43 M€
Evidence that market penetration is enhanced for products with good environmental profile or that consumer interest in eco-design, labelling or Green Public Procurement (#10)
The basic parameter for consumer is the possibility to use drinking-quality water in a safe way.
Providing information on the performance of taps and showers is considered very important. This could have a strong impact on the market penetration
The offer of water/energy efficient products is wider and wider. However, it is difficult to demonstrate what are the real water and energy savings achievable and to quantify the actual demand for these types of products
For industrial kitchen taps there is no evidence that customers are interested in energy efficient products

28
2.2 Market and stock data 2.2.1 Installed base (“stock”) and penetration rate This section focuses on estimating the current stocks of products placed into the EU-27 market and installed.
Due to data limitations, during the development of the EU Ecolabel and GPP criteria for sanitary tapware it was not possible to calculate the stock based on sales data. A simple model was developed to estimate stocks for past and future years. Moreover, due to the lack of disaggregated data by types of taps and showers, a number of assumptions were needed.
For the stock within domestic dwellings, the starting point of the model was to know the population and the numbers of households across the EU. Both data sets have been extracted from Eurostat (data referred to 2007). Further information used to develop the model was related to the number of existing buildings which was used to calculate a ratio of houses to apartments. It was calculated that houses represent 60% and apartments 40% of all dwellings for all MS. The number of taps and showerheads installed within each type of dwelling was gathered through stakeholders consultation. The average for the EU-27, reported in Table 2.3, was applied to the model. The stock was calculated by using the number of households across the EU and considering that 60% were house and 40% were apartments. Forecasts for future years were estimated based on average population growth rate calculated from Eurostat population data. This rate was then applied linearly to future years. The same was repeated for the number of households. The ratio of houses to apartments was kept at 60/40 and the average number of taps and showerheads by type of housing was kept the same.
Table 2.3 Average number of taps and showers per 100 apartments and houses43
Apartment House
Average number of taps 450 550
Average number of showers 125 125
For the stock of non-domestic premises, a number of assumptions was made to establish the non-domestic stock. The starting point for the model was to know the number of businesses across the EU27. Based on Eurostat44, more than 99% of businesses are SMEs. Information from 2003 to 2008 was broken down into the categories shown in Table 2.4. Using these figures, a business growth rate was calculated on the past trends, averaged and then used linearly to calculate estimated number of businesses to 2020.
Table 2.4 Categories of Businesses
Number of employees
Micro <10
Small <50
Medium <250
Large 251>
43 http://susproc.jrc.ec.europa.eu/ecotapware/docs/First%20Interim%20Report%20-%20Updated%20draft%2004%2003%2011.pdf 44 Facts and figures about the EU’s SME
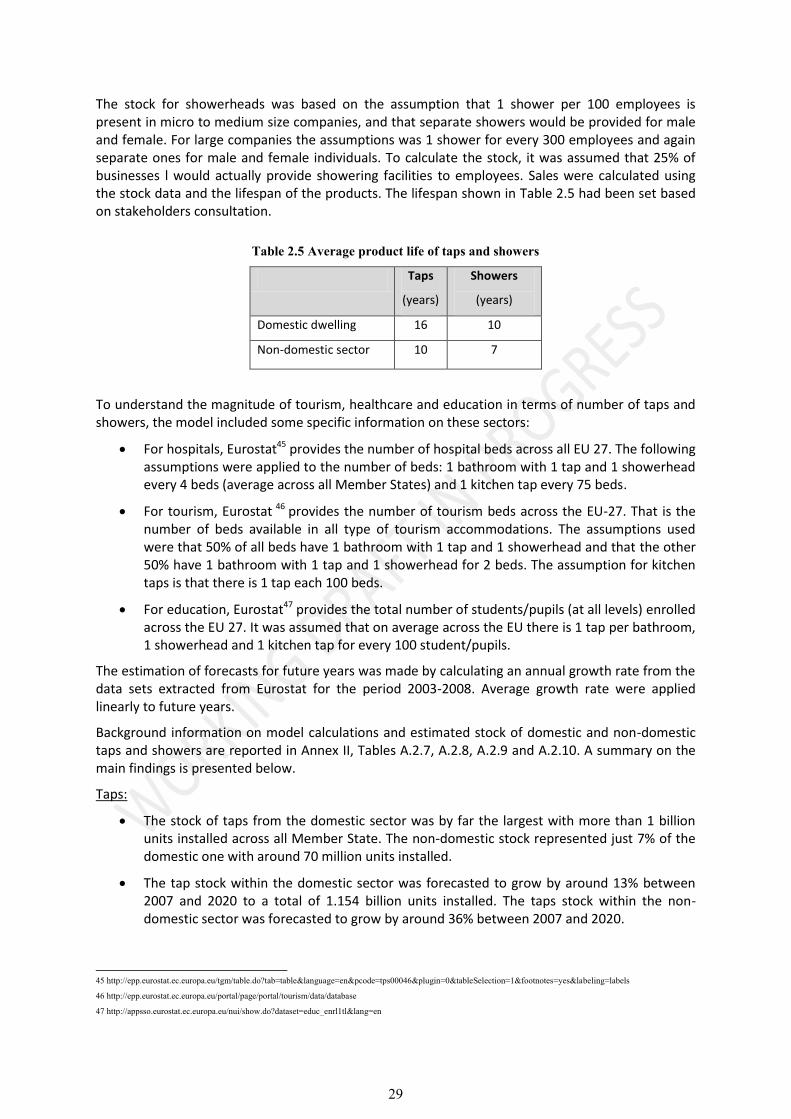
29
The stock for showerheads was based on the assumption that 1 shower per 100 employees is present in micro to medium size companies, and that separate showers would be provided for male and female. For large companies the assumptions was 1 shower for every 300 employees and again separate ones for male and female individuals. To calculate the stock, it was assumed that 25% of businesses l would actually provide showering facilities to employees. Sales were calculated using the stock data and the lifespan of the products. The lifespan shown in Table 2.5 had been set based on stakeholders consultation.
Table 2.5 Average product life of taps and showers
Taps
(years)
Showers
(years)
Domestic dwelling 16 10
Non-domestic sector 10 7
To understand the magnitude of tourism, healthcare and education in terms of number of taps and showers, the model included some specific information on these sectors:
For hospitals, Eurostat45 provides the number of hospital beds across all EU 27. The following assumptions were applied to the number of beds: 1 bathroom with 1 tap and 1 showerhead every 4 beds (average across all Member States) and 1 kitchen tap every 75 beds.
For tourism, Eurostat 46 provides the number of tourism beds across the EU-27. That is the number of beds available in all type of tourism accommodations. The assumptions used were that 50% of all beds have 1 bathroom with 1 tap and 1 showerhead and that the other 50% have 1 bathroom with 1 tap and 1 showerhead for 2 beds. The assumption for kitchen taps is that there is 1 tap each 100 beds.
For education, Eurostat47 provides the total number of students/pupils (at all levels) enrolled across the EU 27. It was assumed that on average across the EU there is 1 tap per bathroom, 1 showerhead and 1 kitchen tap for every 100 student/pupils.
The estimation of forecasts for future years was made by calculating an annual growth rate from the data sets extracted from Eurostat for the period 2003-2008. Average growth rate were applied linearly to future years.
Background information on model calculations and estimated stock of domestic and non-domestic taps and showers are reported in Annex II, Tables A.2.7, A.2.8, A.2.9 and A.2.10. A summary on the main findings is presented below.
Taps:
The stock of taps from the domestic sector was by far the largest with more than 1 billion units installed across all Member State. The non-domestic stock represented just 7% of the domestic one with around 70 million units installed.
The tap stock within the domestic sector was forecasted to grow by around 13% between 2007 and 2020 to a total of 1.154 billion units installed. The taps stock within the non-domestic sector was forecasted to grow by around 36% between 2007 and 2020.
45 http://epp.eurostat.ec.europa.eu/tgm/table.do?tab=table&language=en&pcode=tps00046&plugin=0&tableSelection=1&footnotes=yes&labeling=labels
46 http://epp.eurostat.ec.europa.eu/portal/page/portal/tourism/data/database
47 http://appsso.eurostat.ec.europa.eu/nui/show.do?dataset=educ_enrl1tl&lang=en

30
The MS with the largest stock of taps within the domestic sector in 2007 were Germany (19%), France (13%), the UK (13%), Italy (12%) and Spain (8%).
The MS with the largest stock of taps within the non-domestic sector in 2007 were: Italy (17%), France (14%), Spain (12%), Germany (11%) and the UK (10%).
Showers:
The stock of showers from the domestic sector was by far the largest with more than 248.5 million units installed across all Member State in 2007. The non-domestic stock represented just 11% of the Domestic almost 28 million units installed.
The showers stock within the domestic sector was forecasted to grow by around 13% between 2007 and 2020 to a total of 282.5 million units installed. The taps stock within the non-domestic sector was forecasted to grow by around 33% between 2007 and 2020.
The MS with the largest stock of showers within the domestic sector in 2007 were Germany (19%), France (13%), the UK (13%), Italy (12%) and Spain (8%).
The MS with the largest stock of showers within the non-domestic sector in 2007 were France (18%), Italy (16%), Germany (12%), Spain (11%) and the UK (11%).
The estimations made during the development of the Ecolabel and GPP criteria for sanitary tapware were based on a number of assumptions yet to be revised. Notwithstanding these assumptions, the model outputs suggest that:
Showerheads are mainly found within domestic dwellings rather than non-domestic premises; for every 10 showerheads only one is in a non-domestic premises.
A similar trend is identified for taps, for which one out of 15 taps is approximately installed in a non-domestic building
The sector breakdown in terms of stock arising from domestic dwellings and from the non-domestic sector, the non-domestic sector represents just 7% of the stock of taps and 11% of the showerhead stock.
2.2.2 Annual sales growth rate The model for the estimation of the stock for domestic taps and showers and for non-domestic taps and showers was also used to estimate sales. The calculation was based on the estimated stock and the assumed life span of taps and showers as presented above in Table 2.5. Background information on the estimated sales for domestic taps and showers and for non-domestic taps and showers are reported in Annex II, Tables A.2.11, A.2.12, A.2.13 and A.2.14. A summary on the estimated sales for both domestic and non-domestic taps and showers is presented below.
Taps:
Domestic sales of taps are forecasted to grow from 63.5 million units to more than 72 million in 2020 across the EU. Non domestic sales for taps are forecasted to grow form almost 7 million units in 2007 to more than 9.5 million in 2020, and increase of more than 35% across the EU overall
Member states with the highest sales in the domestic sector for taps in 2007 were Germany (19%), the UK (13%), France (13%), Italy (12%) and Spain (8%)
Member states with the highest sales in the non-domestic sector in 2007 were Italy (17%), Spain (12%), France (14%), Germany (11%) and the UK (9%).

31
Showers:
Within the domestic sector the sales of showers was over 25 million units in 2007, and is forecasted to be almost 28.5 million units in 2020. Non-domestic sales of showers are forecasted to grow from just over 4 million units in 2007 to more than 5.3 million units in 2020 across the EU.
Member States with the highest sales in the domestic sector in 2007 were Germany (19%), the UK (13%), France (13%), Italy (12%) and Spain (8%).
Member States with the highest sales in the non-domestic sector in 2007 were France (19%), Italy (16%), Germany (12%), Spain (11%) and the UK (11%).
2.3 Market trends 2.3.1 Background information on market trend The base for the description of the market trends is represented by the background information gathered during the development of the EU Ecolabel and GPP criteria for sanitary tapware. Scarce information regarding the situation across the EU was collected and the main references were a market research report (AMA 2006) and a work published in the UK (MTP -UK Market Transformation Programme). The proposed analysis is therefore focused on the market in UK and further investigation with an EU-27 perspective would be needed.
In the UK the replacement and refurbishment sector accounted for the largest share of the bath and sanitary ware market, approximately 54% in 2005. New build and commercial markets make up the remaining share of the market as shown in Figure 2.1.
Figure 2.1 UK Bath and Sanitary ware market share by sector 2005 (by value)48
In order to provide some preliminary information on the market trends, the UK bath & sanitary ware market shares for 2005 by Company is provided in Annex II, Table A.2.15. Moreover, the list of the UK key suppliers and importers and the distribution channels for bath and sanitary ware in the UK are also provided in Annex II, Tab. A.2.16 and Tab. A.2.17.
MTP estimated that 67% of all households in the UK are equipped with a shower (or 13.5 million households). Of these, 80% have it installed over the bath. This means that 54% of all household in the UK have a shower over the bath and 13% have a separate shower cubicle.
People living in the UK are using on average 150 litres of water per day for washing, cooking and drinking. Improvements in lifestyle and new technologies within the domestic environment mean
48 Bathroom Market UK 2006, AMA Research Ltd

32
that use of water is 55% higher than 25 years ago, with half of this being used within the bathroom environment (Water Efficient Product Labelling Scheme UK).
MTP49 data suggested that:
Growth in the shower market was expected continuing to drive the increase in the base of showers established. The growth was expected to be 2.5% from 2007 to 2012, then 1% per annum thereafter.
The type of mixer showers was expected to shift towards the power and pressurised type by 2.5-3% per annum from 2007 to 2012 and 1% per annum thereafter. Stakeholders further commented on this trend, adding that while approximately 50% of the shower sales in the UK may be mixer showers, 60% of mixer showers are actually installed onto low pressure systems. Therefore with 50% market share being electric showers and approximately 30% market share being low pressure mixers there are only 20% of the market using high pressure or power systems. It is also worth noting that sales of shower heads are vastly different to that of shower controls. In the UK most shower controls are sold as complete kits with a shower head.
The stakeholders consultation during the Ecolabel and GPP criteria process identified an economic loss of around 25% in market value/volume across the majority of bathroom products. Overall bathroom manufacturers were not particularly optimistic that this loss in the market will be recovered quickly.
A market research report from AMA showed that import of sanitary ware represented 60% of UK market for the period 2005 an 2006. The main imports originated from China, Thailand, Turkey and the Middle East. These countries export mainly products on the cheaper end of the spectrum. These imports have replaced products that were historically imported to the UK from within the EU.
Growth of lower value imports had increased the level of price competition across all sectors of the market. Sanitary ware products from higher value EC countries as Italy and France have also experienced a decline in average prices over the past three years in the UK.
2.3.2 Trends for Taps and Showers Information presented was extracted from a market research report focused on UK and used to address the development of the EU Ecolabel and GPP criteria for sanitary tapware.
Lifestyle changes have a great influence on the typical ‘everyday’ use of the bathroom. In general, the high level of refurbishment and additional bathroom installations in recent years has resulted in several key trends emerging in the UK. For showers, these include:
• The focus on the main bathroom in larger houses is changing to an area of well-being and relaxation.
• The replacement of the bath with a large shower enclosure or wet room in small properties.
• The shift towards compact baths or multi–purpose products such as showerbaths.
In recent years showerheads have seen a renewed focus, with now a wide range of choice for domestic and non-domestic premises. Current fashionable trend are towards Spa-like showers within the home, such as “rainshower” type showerheads within the UK. More recent development includes recycling showers, of which there are two types as described by the UK MTP50. MTP
49 BN DW Shower: Shower design and efficiency – Briefing Note relating to policy scenario objectives in Policy Brief
50 BNWAT25: Recycling showers - Innovation Briefing Note, the UK MTP, March 2008
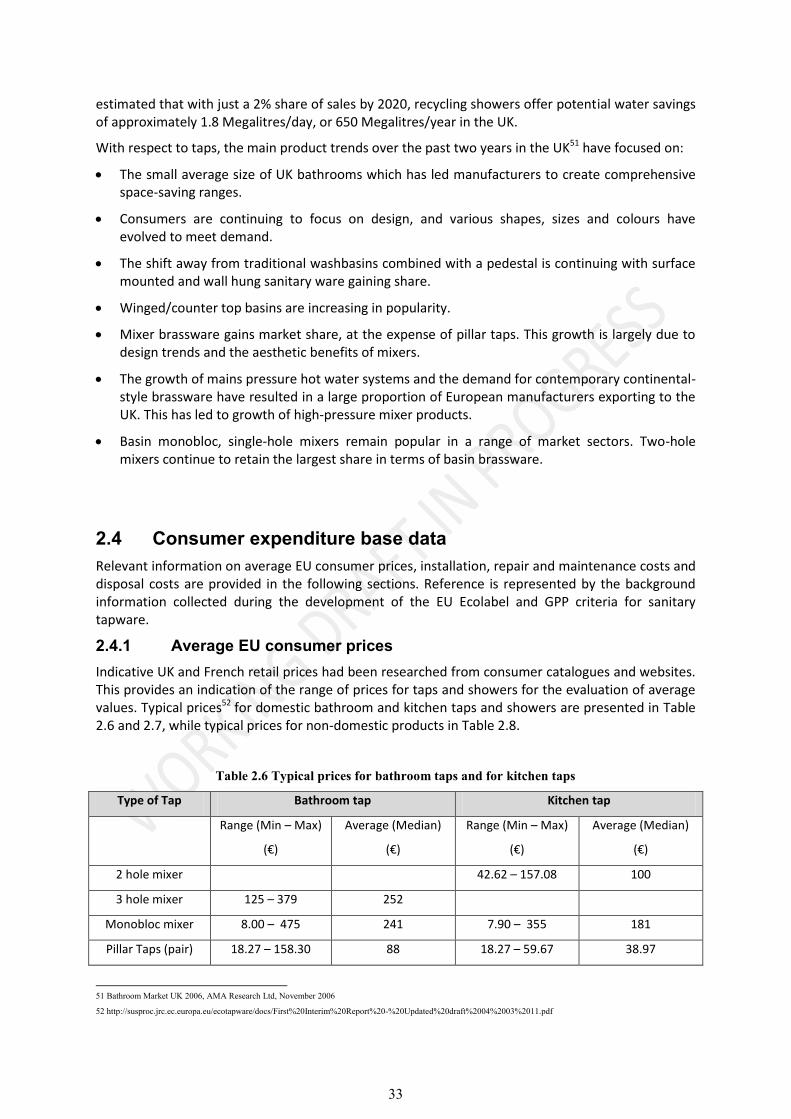
33
estimated that with just a 2% share of sales by 2020, recycling showers offer potential water savings of approximately 1.8 Megalitres/day, or 650 Megalitres/year in the UK.
With respect to taps, the main product trends over the past two years in the UK51 have focused on:
The small average size of UK bathrooms which has led manufacturers to create comprehensive space-saving ranges.
Consumers are continuing to focus on design, and various shapes, sizes and colours have evolved to meet demand.
The shift away from traditional washbasins combined with a pedestal is continuing with surface mounted and wall hung sanitary ware gaining share.
Winged/counter top basins are increasing in popularity.
Mixer brassware gains market share, at the expense of pillar taps. This growth is largely due to design trends and the aesthetic benefits of mixers.
The growth of mains pressure hot water systems and the demand for contemporary continental-style brassware have resulted in a large proportion of European manufacturers exporting to the UK. This has led to growth of high-pressure mixer products.
Basin monobloc, single-hole mixers remain popular in a range of market sectors. Two-hole mixers continue to retain the largest share in terms of basin brassware.
2.4 Consumer expenditure base data Relevant information on average EU consumer prices, installation, repair and maintenance costs and disposal costs are provided in the following sections. Reference is represented by the background information collected during the development of the EU Ecolabel and GPP criteria for sanitary tapware.
2.4.1 Average EU consumer prices Indicative UK and French retail prices had been researched from consumer catalogues and websites. This provides an indication of the range of prices for taps and showers for the evaluation of average values. Typical prices52 for domestic bathroom and kitchen taps and showers are presented in Table 2.6 and 2.7, while typical prices for non-domestic products in Table 2.8.
Table 2.6 Typical prices for bathroom taps and for kitchen taps
Type of Tap Bathroom tap Kitchen tap
Range (Min – Max)
(€)
Average (Median)
(€)
Range (Min – Max)
(€)
Average (Median)
(€)
2 hole mixer 42.62 – 157.08 100
3 hole mixer 125 – 379 252
Monobloc mixer 8.00 – 475 241 7.90 – 355 181
Pillar Taps (pair) 18.27 – 158.30 88 18.27 – 59.67 38.97
51 Bathroom Market UK 2006, AMA Research Ltd, November 2006
52 http://susproc.jrc.ec.europa.eu/ecotapware/docs/First%20Interim%20Report%20-%20Updated%20draft%2004%2003%2011.pdf

34
Table 2.7 Typical prices for showers
Showers
Range (Min – Max)
(€)
Average (Median)
(€)
1.50 – 82.80 42.15
Table 2.8 Typical prices for non-domestic products
Type of Tap/ Showerhead Range (Min – Max) (€)
Average (Median) (€)
Infra Red Mixer Tap 269.48 – 480.75 375.12
Lever Taps (Pair) 43.84 – 74.28 59.06
Single Lever Mixer Tap 89.20 – 624.68 356.94
Self closing single taps 27.73 – 316.60 172.17
Showerheads (Wall mounted/swivel design)
33.49 – 132.33 82.91
2.4.2 Installation, repair and maintenance costs Table 2.9 reports the average costs of installation, repair and maintenance quantified for different types of taps and showers with the support of stakeholders during the development of the EU Ecolabel and GPP criteria for sanitary tapware.
Installation, repair and maintenance costs are variable and depend on who undertakes the work. Some users undertake it themselves), others will engage a professional plumber to carry out the work. Maintenance and repair costs will also vary depending on the part that needs to be replaced, which will also be determined by the type of product installed.
Table 2.9 Installation – maintenance and repair cost
Installation cost
(€)
Maintenance
(€)
Repair
(€)
Domestic
Bathroom taps 30 - 100 0 to 50 20-100
Showerheads 20 - 60 0 to 15 20 -100
Kitchen taps 30 - 100 0 to 50 0 to 50
Outdoor taps 100 0 to 50
Other taps
Non-domestic
Bathroom taps
Showerheads 60
Kitchen taps 150 75 75
Outdoor taps
Other taps

35
Typical spare parts and indicative costs are indicated in Table 2.10, based on a past analysis on information received from UK suppliers. However it should be recognised that these are only indicative and costs may vary between suppliers and depending on whether a universal part can be fitted or a specific part for a model of tap is required.
Table 2.10 Indicative cost of spare parts
Spare Part Price (£) Euro (conversion)53
Washers Box of mixed washers for taps (approx 80) £6.83
8.32
O Rings Box of mixed o rings for taps (approx 115) £6.83 8.32
Valves:
Ceramic disc valve
Compression tap valve
20-30 (pair)
4 (single)
24.35 – 36.53 (pair)
4.87 (single)
Ceramic Disc Cartridges (single lever taps)
15 (single) 18.27 (single)
Tap heads 8.50 - 30 10.35 – 36.53
Aerators 5-6 6.09 – 7.31
2.4.3 Disposal Tariffs No information were found specifically in relation to the disposal costs for taps and showers within the development of the EU Ecolabel and GPP criteria for sanitary tapware. It was anticipated that end of life disposal costs for these products will vary depending on the procedures undertaken in different countries. Depending on the nature of the installation, the taps and showerheads may be disposed of alongside other waste, for example other bathroom fittings or construction waste. However, it seems that this products are usually recycled.
2.4.4 Gas and Electricity Prices Data on gas and electricity prices can be found for instance on the Eurostat website54. For comparison, the prices for electricity and gas for householders and industrial consumer, referred to the period 2005-2010 and published by Eurostat, are presented in Annex II, Tables A.2.18 and A.2.19. The prices are exclusive of any tax and are based on the first semester of each year.
53 Exchange Rate 1 British Pound = 1.2177 Euros – 20th August 2010
54 “This indicator presents the natural gas prices charged to final consumers. Natural gas prices for industrial consumers are defined as follows: Average national price in
Euro per Giga Joule (GJ) for gas and kWh for electricity without taxes applicable for the first semester of each year for medium size industrial consumers, and medium size
households.” http://epp.eurostat.ec.europa.eu/tgm/web/table/description.jsp http://epp.eurostat.ec.europa.eu/portal/page/portal/energy/data/main_tables

36
2.4.5 Water Prices The EuP Task 2 report for Washing Machines 55 presented data from a 2006 OECD report ‘Infrastructure to 2030: Telecom, Land Transport, Water and Electricity. This indicated that the cost of water supply and wastewater infrastructure in Europe for the year 2000 was as follows:
Water Supply and Combined Sewer – 2.54 Euro/m3
Water Supply and Separate sanitary sewer – 2.29 Euro/m3
Additional analysis in the Task 2 Washing Machines report estimated that the European average price for water supply and sewage is 2.5 Euro/m3.
Information published by the OECD56, based on a 2007-2008 survey indicates the price for water and sanitation services varies across European countries. The available information from the OECD is presented in Annex II, Tables A2.22. The average calculated is the same as that presented in the Task 2 report for Washing Machines. Water prices will rise as countries move towards the full cost recovery under the Water Framework Directive.
Taking into account growth and the move towards full cost recovery, the Task 2 report for Washing Machines considered an average price of 3.7 Euro/m3 for household water supply and sewage in Europe.
2.4.6 Interest and Inflation Rates Data that has to be used in this Paragraph can be found on the Eurostat website. For comparison, inflation rate across MS and long term interest rate, referred to the period 2005-2010, published by Eurostat are presented in Annex II, Tables A.2.23 and A.2.24.
2.4.7 Feedback from the 1st Questionnaire to stakeholders Average information on consumer expenditure base data (#22)
Average costs (and cost variation)
Taps Showers Showerheads
€/product €/kg of product
€/product €/kg of product
€/product €/kg of product
Factory prices incl. VAT:
Domestic
Non-domestic
Other specific applications
25-30€/product on average
150€ for a 3/4” sink mixer
End consumer prices incl. VAT:
• Domestic
• Non-domestic
• Other specific applications
52€/product on average for France in 2009
From 15€
300€ for a 3/4” sink mixer
From 15€
From 15€
Installation costs
55 http://www.ecowet-domestic.org/index.php?option=com_docman&task=cat_view&gid=17&Itemid=48
56 http://www.oecd.org/document/47/0,3343,en_2649_37465_36146415_1_1_1_1,00.html

37
Domestic
Non-domestic
Other specific applications
Maintenance costs along the product life time
Domestic
Non-domestic
Other specific applications
Repair costs along the product life time
Domestic
Non-domestic
Other specific applications
Disposal tariffs/ taxes
Domestic
Non-domestic
Other specific applications
2.5
Product Average weight (kg)
Domestic Non-domestic Other specific applications
Taps 0.8 kg
Showers
Showerheads
2.5 Next steps to complete the discussion on the Market Generic economic data:
for the latest full year for which at least half of the MSs have reported to Eurostat
data both in physical volume and money value and split by MSs
EU Production; To be updated based on Eurostat
Assumptions for the evaluation of the production in units to be revised with support of stakeholders.
Extra-EU Trade
Intra-EU Trade
EU sales and trade= production + import – export

38
Market and stock data, reference years
1990 (Kyoto and "20-20-20" reference);
2010 (or most recent real data);
2013-2016 (forecast, presumable entry into force of measures);
2020-2030-2050 (forecast, years in which all new ecodesigns of today will be absorbed by the market).
Average Product Life (in years), in service, and a rough indication of the spread (e.g. standard deviation)
To be revised based on the feedback received from stakeholders
Installed base (“stock”) and penetration rate To be updated, assumptions to be revised with support of stakeholders
Annual sales growth rate (% or physical units)
Total sales / real EU-consumption To be done
Replacement sales (derived)
New sales (derived
Market structure and trends
Market channels and production structure; identification of the major players (associations, large companies, share SMEs, employment);
To be revised with the support of stakeholders.
General market trends, trends in product-design and product-features
To include this within section on Technologies.
Trends in product design / features, illustrated by recent consumer association tests
To be included with the support of stakeholders.
Consumer expenditure base data
Average EU consumer prices (inclusive/exclusive of VAT) To be revised based on the feedback received from stakeholders
Consumer prices of consumables (water and energy), including average annual price increases abd regional differentiation
To be updated based on Eurostat and Chapter 3 of MEErP
Installation costs To be revised based on the feedback received from stakeholders
Repair and Maintenance costs (€/product life); To be revised based on the feedback received from stakeholders
Disposal tariffs / taxes (€/product); To be revised based on the feedback received from stakeholders
Recommendations
Refinement of the product scope from an economical/ commercial perspective (e.g. exclusion of niche markets)
To be included based on the feedback received from stakeholders
Barriers and opportunities for implementing product policy tools from the economical/ commercial perspective
To be done

39
3 USERS AND SYSTEM ASPECTS
The objective of this chapter is to collect, analyse and report information on the environmental impacts and on consumption of resources associated with the domestic and non-domestic use of taps and showers throughout their lifetime. The two main resources consumed during the use phase of taps and showers are water and energy. Their consumption can be influenced by different user behaviour patterns and also by the related technical systems they are used within. These could include:
a) Water abstraction, impoundment, storage, treatment and distribution of surface water or groundwater
b) Water supply and control at the user
c) Water heating
d) Waste-water collection and treatment which subsequently discharge into surface water.
3.1 Water consumption and user behaviour 3.1.1 Water consumption in Europe 3.1.1.1 Domestic water consumption On average, only 18% of total water abstraction in Europe is used for urban use. The proportion of water for abstracted urban use varies considerable from one region to another, depending on natural conditions and economic and demographic structures. This can range from 6.5% in Germany to more than 50% in the United Kingdom57.
Figure 3.1 illustrates that the daily consumption of domestic water in litre per person and day across Member States vary hugely, from a mere 67 litres per person per day in Lithuania to a considerable 320 litres per person per day in Italy. The very low value for Latvia seems to be an outlier, which can probably be attributed to statistical inconsistencies. The European average is 173 litres per person per day. Using data on population this equates to 30,198 Million m3. Higher standards of living are changing water demand patterns. This is reflected mainly in increased domestic water use, especially for personal hygiene. The result is that most of urban water consumption is for domestic use, with 33% for toilet flushing, 20-32% for bathing and showering and 15% for washing machines and dishwashers. Water used for cooking and drinking (3%) is minimal compared to the other uses58.
Figure 3.1 Total domestic water use by Member States59
57 http://www.water-efficiencylabel.org.uk/
58 Freshwater in Europe: Facts, Figures and maps, UNEP, 2004
59 IPTS Scoping Document, February 2010 http://susproc.jrc.ec.europa.eu/ecotapware/docs/Scoping%20document_WuP_100217.pdf

40
It is expected that these figures will vary from one Member State to another but nevertheless water consumption from taps and showers will always account for a significant proportion of the water domestic use. For example, in the UK shower and bathing count for 20% of annual water use in households, showering represents approximately 10%, while 25% of domestic water consumption is delivered via internal taps60. In the Netherlands the use of water per person has decreased overall by 7% between 1995 and 2007. However, water use per person per day for showering has increased from 38,3 litres to 49,8 litres per person per day. The share of the water used for showering now represents 39% of overall household water consumption, the largest share (in 2007).61
Table 3.1 shows that for most Member States, bathing and showering account for around 33 to 36% of the total domestic water consumption, it is the highest in Netherlands representing 42% and lowest in Finland at 19%.
Table 3.1 Total domestic water use according to purpose in Million m3 per year62 (in-house calculations)
Country Bathing/
showering/
personal hygiene
toilet flushing
washing clothes
dish washing
room cleaning, garden irrigation, car wash
Drinking and cooking
Other TOTAL
(Mm3/y) (Mm3/y) (Mm3/y) (Mm3/y) (Mm3/y) (Mm3/y) (Mm3/y) (Mm3/y)
Austria 162 97 65 8 24 16 28 400
Belgium 158 173 67 34 38 10 480
Bulgaria 243 178 101 60 40 33 63 718
Cyprus 9 6 4 2 1 1 2 25
Czech Republic 175 128 73 44 29 24 45 518
Denmark 93 71 34 28 n/a 20 37 283
Estonia 16 12 7 4 3 2 4 48
Finland 78 38 48 33 5 11 56 269
France 1,511 775 465 388 233 271 233 3,876
Germany 1,334 1,000 445 222 222 148 333 3,704
Greece 197 144 82 49 33 27 51 583
Hungary 168 123 70 42 28 23 43 497
Ireland 106 77 44 26 18 14 27 312
Italy 2,281 1,670 948 568 377 312 589 6,745
Latvia 4 3 2 1 1 1 1 13
Lithuania 29 21 12 7 5 4 7 85
Luxembourg 9 8 3 2 1 2 25
Malta 4 3 2 1 1 1 1 13
Netherlands 345 230 148 41 n/a 8 58 830
60 MTP UK, Improving the water efficiency of internal taps, March 2008
61 This information was received in response to the first questionnaire from the Ministry of Housing, Spatial Planning and the Environment in the Netherlands
62 IPTS Scoping Document, February 2010 http://susproc.jrc.ec.europa.eu/ecotapware/docs/Scoping%20document_WuP_100217.pdf
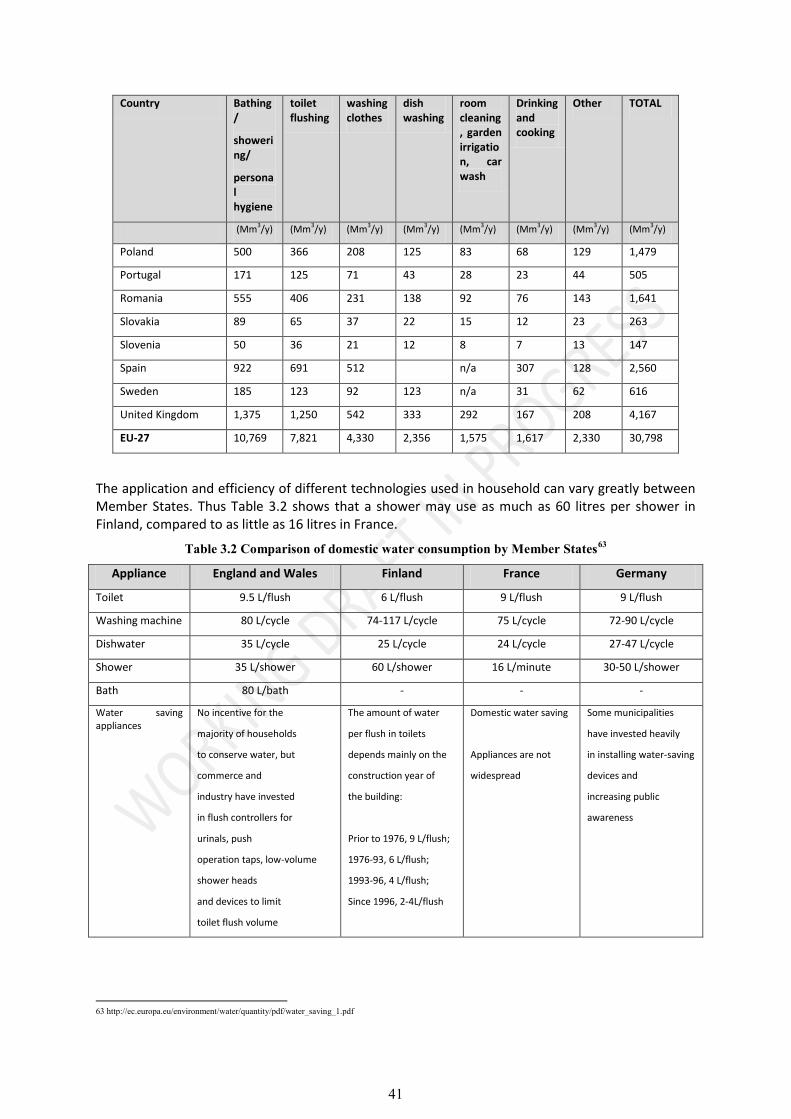
41
Country Bathing/
showering/
personal hygiene
toilet flushing
washing clothes
dish washing
room cleaning, garden irrigation, car wash
Drinking and cooking
Other TOTAL
(Mm3/y) (Mm3/y) (Mm3/y) (Mm3/y) (Mm3/y) (Mm3/y) (Mm3/y) (Mm3/y)
Poland 500 366 208 125 83 68 129 1,479
Portugal 171 125 71 43 28 23 44 505
Romania 555 406 231 138 92 76 143 1,641
Slovakia 89 65 37 22 15 12 23 263
Slovenia 50 36 21 12 8 7 13 147
Spain 922 691 512 n/a 307 128 2,560
Sweden 185 123 92 123 n/a 31 62 616
United Kingdom 1,375 1,250 542 333 292 167 208 4,167
EU-27 10,769 7,821 4,330 2,356 1,575 1,617 2,330 30,798
The application and efficiency of different technologies used in household can vary greatly between Member States. Thus Table 3.2 shows that a shower may use as much as 60 litres per shower in Finland, compared to as little as 16 litres in France.
Table 3.2 Comparison of domestic water consumption by Member States63
Appliance England and Wales Finland France Germany
Toilet 9.5 L/flush 6 L/flush 9 L/flush 9 L/flush
Washing machine 80 L/cycle 74-117 L/cycle 75 L/cycle 72-90 L/cycle
Dishwater 35 L/cycle 25 L/cycle 24 L/cycle 27-47 L/cycle
Shower 35 L/shower 60 L/shower 16 L/minute 30-50 L/shower
Bath 80 L/bath - - -
Water saving appliances
No incentive for the
majority of households
to conserve water, but
commerce and
industry have invested
in flush controllers for
urinals, push
operation taps, low-volume
shower heads
and devices to limit
toilet flush volume
The amount of water
per flush in toilets
depends mainly on the
construction year of
the building:
Prior to 1976, 9 L/flush;
1976-93, 6 L/flush;
1993-96, 4 L/flush;
Since 1996, 2-4L/flush
Domestic water saving
Appliances are not
widespread
Some municipalities
have invested heavily
in installing water-saving
devices and
increasing public
awareness
63 http://ec.europa.eu/environment/water/quantity/pdf/water_saving_1.pdf
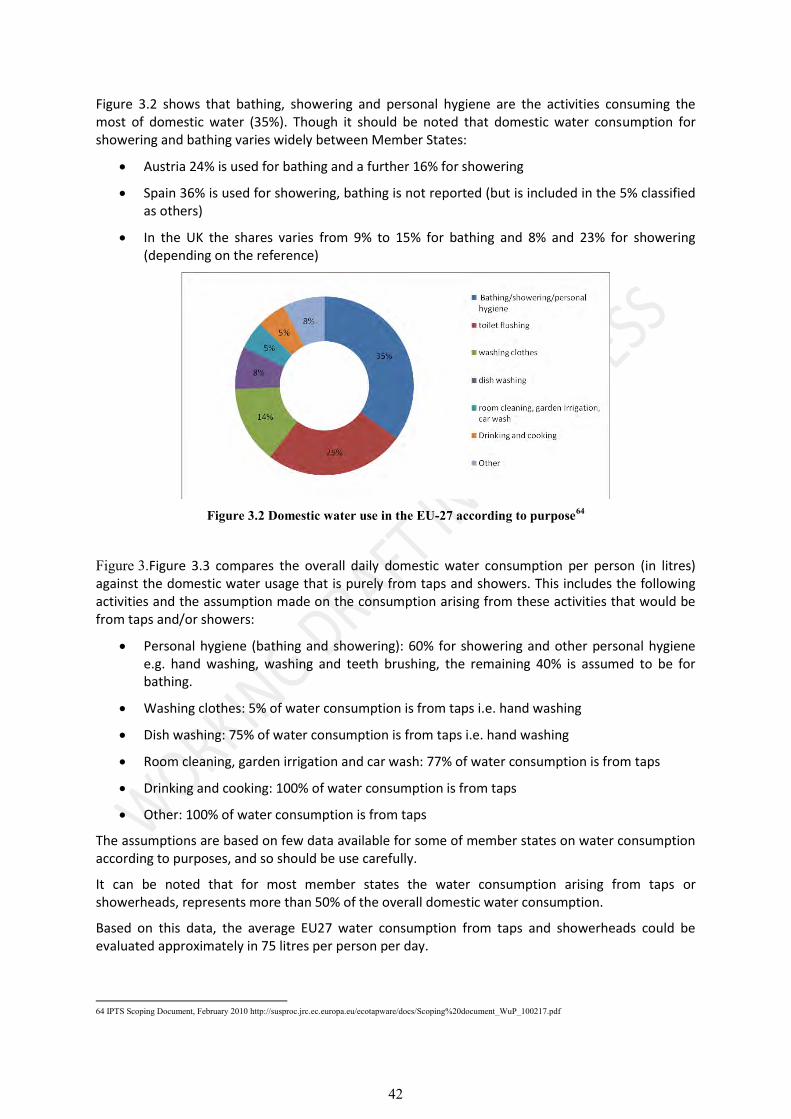
42
Figure 3.2 shows that bathing, showering and personal hygiene are the activities consuming the most of domestic water (35%). Though it should be noted that domestic water consumption for showering and bathing varies widely between Member States:
Austria 24% is used for bathing and a further 16% for showering
Spain 36% is used for showering, bathing is not reported (but is included in the 5% classified as others)
In the UK the shares varies from 9% to 15% for bathing and 8% and 23% for showering (depending on the reference)
Figure 3.2 Domestic water use in the EU-27 according to purpose64
Figure 3.Figure 3.3 compares the overall daily domestic water consumption per person (in litres) against the domestic water usage that is purely from taps and showers. This includes the following activities and the assumption made on the consumption arising from these activities that would be from taps and/or showers:
Personal hygiene (bathing and showering): 60% for showering and other personal hygiene e.g. hand washing, washing and teeth brushing, the remaining 40% is assumed to be for bathing.
Washing clothes: 5% of water consumption is from taps i.e. hand washing
Dish washing: 75% of water consumption is from taps i.e. hand washing
Room cleaning, garden irrigation and car wash: 77% of water consumption is from taps
Drinking and cooking: 100% of water consumption is from taps
Other: 100% of water consumption is from taps
The assumptions are based on few data available for some of member states on water consumption according to purposes, and so should be use carefully.
It can be noted that for most member states the water consumption arising from taps or showerheads, represents more than 50% of the overall domestic water consumption.
Based on this data, the average EU27 water consumption from taps and showerheads could be evaluated approximately in 75 litres per person per day.
64 IPTS Scoping Document, February 2010 http://susproc.jrc.ec.europa.eu/ecotapware/docs/Scoping%20document_WuP_100217.pdf

43
Figure 3.3 Water consumption per person per day overall vs. water consumption from activities using taps % showers65
3.1.1.2 Water consumption in non-domestic building Very little information is available regarding water consumption in non-domestic sources. Figure 3.4 below present’s water consumption in different sectors in the UK.
Figure 3.4 Water consumption in non-domestic premises in the UK66
Table 3.3 presents data from a French region where water consumption within public buildings has been estimated, and potential saving identified.
65 IPTS Scoping Document, February 2010 http://susproc.jrc.ec.europa.eu/ecotapware/docs/Scoping%20document_WuP_100217.pdf
66 MTP, Domestic water consumption in domestic and non-domestic properties, DEFRA/AEA 2008

44
Table 3.3 Water consumption and potential saving in public building in Loire Bretagne (France)67
Consumption of reference Saving potential
Source
Primary school 3m3/child/year 20% Lorient, Pontivy, Brest, Douarnenez,
Lannion, Perros, Guirrec
College General: 3,6 m3/student/year 18% Conseil régional de Bretagne
Professional: 6,1m3/student/year
Student housing 46,7 m3/bed/year 30% CROUS Aquitaine, Eco-Campus
Stadium (normal size) 1000m3/year for equipment use 20% Surveys CNFPT Midi Pyrénées 2002,
AIRES 1998, Report L. Cathala 2000m3/year for irrigation
Gymnasium (normal size) 800 m3/an 15%
Public swimming pools 0,33 to 0,42 m3/ visitor No data
Hospitals 100 m3/ bed/year 0% Water agency data, experts
Administrative
buildings
14,3 m3/ position/year 20% Water agency data
A separate study on evaluating the success of water saving devices was completed in the south of France in a Student housing complex of Talence (CROUS). The equipment implemented were: water meters in each building and sanitary blocks, water savings taps, water savings showerheads and low water consuming flush toilets. The results in terms of water use per student bed were: 157 litres per day per bed in non-equipped buildings, and 100 litres per day per bed in equipped area. It represents a saving of 35% for total water use and 45% for hot water. Equipment cost were 4 712 euros and the water cost avoided reached 11 000 euros/year; the payback period was about 6 months.68
3.1.2 User behaviours As generally valid for each product, the most efficient tap or shower will be actually efficient only if the consumer uses it adequately. Key questions to answer with regard use phase behaviour are:
How often users use taps and showers
How long users leave the water running each time they use a tap
How long users stay in the shower
How much technologies can have an influence on user behaviour.
The more the countries from which information is available the more detailed the analysis of user behaviour practices across the EU-27 would be.
In addition potential targets and regulations can play a critical role in the user behaviour and the usage pattern of the product. For example, the Government’s strategy for Water in the UK, presented in Defra’s ‘Future Water‘ publication, sets out the Government’s aim to reduce water consumption to 130 litres per person per day by 2030 and possibly to 120 litres per person per day depending upon new technological development and innovation. In 2010, this was equal to 150 L per person per day.
67 http://ec.europa.eu/environment/water/quantity/pdf/water_saving_1.pdf
68 http://ec.europa.eu/environment/water/quantity/pdf/water_saving_1.pdf
45
3.1.2.1 Usage Patterns - Taps The MTP69 established that in the UK approximately 25% of domestic water consumption, equivalent to approximately 38 litres per person per day, is delivered via internal taps.
There is generally a significant difference between the flow rate that a tap is capable of delivering at a specified pressure (‘nominal flow rate’) and the flow rate of the tap in use (‘actual flow rate’). This is because the water pressure at the point of installation will usually be slightly different and the user rarely turns a tap on to its maximum flow rate. Whilst there are significant differences in the nominal flow rate of taps designed for kitchen and basin uses, evidence gathered by MTP suggests there is little difference in the actual flow rate of the different types in use. The average volume of water per tap use per household is 2.3 litres. However, evidence shows that taps delivering flow rates greater than 1.8 litres per minute have an average volume per use of 1.9 litres, whilst those with a flow rate of less than 1.8 litres per minute have an average volume per use of 3.1 litres. It is concluded that it is unlikely that more efficient taps are run for longer as there are many events of high volume for a range of durations at high and low flow rates. The causal factors for these trends are unknown.
In the UK households of one to six occupants, have an average frequency of use for all taps of 39 uses per household per day in 200770. Multiplying this value per the average volume of per tap use (2.3 litres), the average amount of water used for all taps in a household of 89.7 litres per day is evaluated.
About the frequency of use:
In homes where a dishwasher is installed it is estimated that kitchen taps are used on average just over 17 times a day per household. In homes where no dishwasher is used, kitchen taps are used on average just over 24 times a day per household. This is equivalent to 55% of all tap uses across all homes.
Basin taps are thought to account for the remaining 45% of all internal tap uses in domestic properties. This is equivalent to 50% of tap uses in homes with dishwashers, and 41% of tap uses in homes without dishwashers.
3.1.2.2 Usage Patterns – Showers Taking a shower can save water compared to taking a bath; some sources say a 33% saving is possible. A quick three minute shower with the flow adjusted to a comfortable 5 litres per minute uses only 15 litres of water, whilst 10 minutes at 15 litres per minute will use ten times as much water and energy without enhancing the cleaning function.
A survey undertaken by Waterwise in the UK identified shower times as follows:
Reported average shower times differ for weekdays (6.93 minutes) and weekends (7.59 Minutes).
Under 35 people shower for longer, on average 2.16 minutes more on weekdays.
Information from the US Manufacturer, American Standard Group supports the above findings. Their website71 states that a typical shower lasts approximately 8 minutes.
69 MTP UK: BN DW TAPS: Briefing Note relating to projections of internal tap water consumption, March 2008
70 MTP UK: BN DW TAPS: Briefing Note relating to projections of internal tap water consumption, March 2008
71 http://www.responsiblebathroom.com/education/stream/water-saving-facts/a-bluer-bathroom/

46
'Water-saver' showerheads usually work by creating finer drops or by incorporating air into the flow. Typically, these showerheads require a pressure of at least 1 bar, which is available from mains pressure and pumped systems but rarely from gravity-feed hot water systems.
Typical flow rates from different shower designs in the UK can be seen in Table 3.4.
Table 3.4 Shower flow rates [source: UK Environmental Agency]
4 L/min 7.2kW electric
9.8kW electric
6 L/min water saver"
9.5 L/min water saver"
Power shower
Flow litre / minute
4 L/min 3.5 L/min 30°C temp
rise
4.7 L/min 30°C temp
rise
6 L/min regulated flow
9.5 L/min regulated
flow
Typically 12 + L/min
Notes
Can be effective but probably for the lower limit for most people especially if the bathroom is cold
May be perceived as poor performance particularly in winter
Perceived by many as adequate
A 'good shower' by traditional UK standards
Maximum flow rate permitted in the USA
Might not be used at full flow
Plumbing system compatibility
Combi boiler and some thermostatic mixer valves unlikely to work at such a low flow rate
Fed from mains pressure cold water
Fed from mains pressure cold water
Mains pressure or pumped hot water. Some combi boilers might not work at this flow rate
Mains pressure hot water or pumped
Water use for 5 minute shower
20 17.5 23.5 30 litres 47.5 60+
In U.S.A. the federal law establishes that the showers must be efficient, presenting a flow equal or inferior to 9.5 L/min. In Australia, the classification system establishes a good performance (AAA) for devices with inferior or equal volume of 9 L/min (0.15 L/sec).72
Water use in showers depends on a number of factors:
Heating mechanism: Combination-boiler warm-up and Pipe dead-leg (time for water to run hot)
Fixed / adjustable controls: Separate flow and temperature controls, Stability of combination-boiler temperature control and Stability of plumbing system pressures
Flow rate: Pressure and spray pattern influence perception of flow, Small flow reductions may not be noticed and Position of header tank/mains pressure/ pumped pressure
It should be noted that no literature was identified during the research regarding the use behaviour of taps and shower in the non-domestic sector. Behaviour in non-domestic settings may, in part, be influenced by the types of taps used. For example sensor and push taps are used more widely in non-domestic settings compared to domestic settings.
72 Water saving devices – Euroconsumers technical report C17050, Decp Prteste, 2008
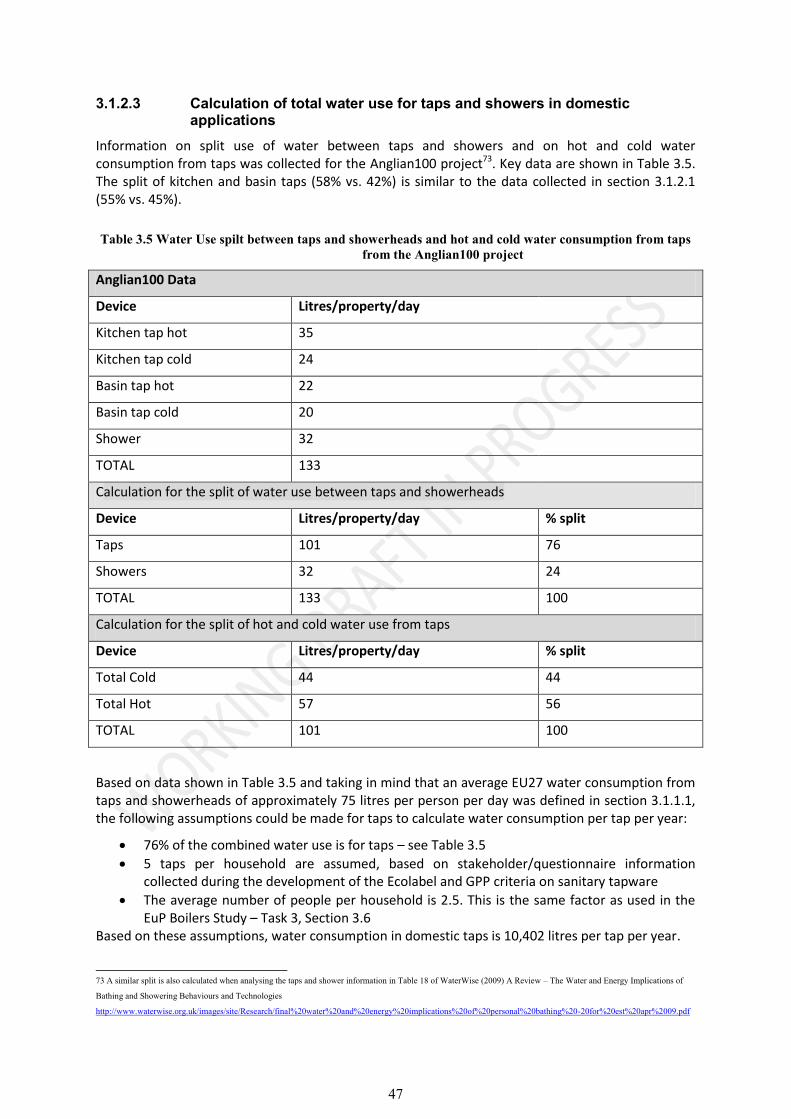
47
3.1.2.3 Calculation of total water use for taps and showers in domestic applications
Information on split use of water between taps and showers and on hot and cold water consumption from taps was collected for the Anglian100 project73. Key data are shown in Table 3.5. The split of kitchen and basin taps (58% vs. 42%) is similar to the data collected in section 3.1.2.1 (55% vs. 45%).
Table 3.5 Water Use spilt between taps and showerheads and hot and cold water consumption from taps
from the Anglian100 project
Anglian100 Data
Device Litres/property/day
Kitchen tap hot 35
Kitchen tap cold 24
Basin tap hot 22
Basin tap cold 20
Shower 32
TOTAL 133
Calculation for the split of water use between taps and showerheads
Device Litres/property/day % split
Taps 101 76
Showers 32 24
TOTAL 133 100
Calculation for the split of hot and cold water use from taps
Device Litres/property/day % split
Total Cold 44 44
Total Hot 57 56
TOTAL 101 100
Based on data shown in Table 3.5 and taking in mind that an average EU27 water consumption from taps and showerheads of approximately 75 litres per person per day was defined in section 3.1.1.1, the following assumptions could be made for taps to calculate water consumption per tap per year:
76% of the combined water use is for taps – see Table 3.5
5 taps per household are assumed, based on stakeholder/questionnaire information collected during the development of the Ecolabel and GPP criteria on sanitary tapware
The average number of people per household is 2.5. This is the same factor as used in the EuP Boilers Study – Task 3, Section 3.6
Based on these assumptions, water consumption in domestic taps is 10,402 litres per tap per year.
73 A similar split is also calculated when analysing the taps and shower information in Table 18 of WaterWise (2009) A Review – The Water and Energy Implications of
Bathing and Showering Behaviours and Technologies
http://www.waterwise.org.uk/images/site/Research/final%20water%20and%20energy%20implications%20of%20personal%20bathing%20-20for%20est%20apr%2009.pdf

48
Based on the above mentioned assumptions, the following assumptions are made for showers to calculate water consumption per shower per year:
24% of the combined water use is for showers – see Table 3.5
An average of 1.25 showers per household is assumed, based on stakeholder/questionnaire information
The average number of people per household is 2.5. This is the same factor as used in the EuP Boilers Study – Task 3, Section 3.
Based on these assumptions, water consumption in domestic showers is 13,140 litres per tap per year.
3.1.2.4 Calculation of total water use for taps and showers in non-domestic applications
Data availability means that the water consumption from taps and showers for non-domestic use needs to be calculated in a different way. According to the data collected in the IPTS Scoping Document, February 2010, and reported in Table 3.6, the following data on total non-domestic water consumption could be identified:
For basin and kitchen taps: 3,615,000 Million litres per year
For bathtub/showers: 723,000 Million litres per year.
Table 3.6 Non-domestic water use according to WuP in Mm3 74
Toilet Urinal Basin
faucet
Bathtub/
showerhead
Kitchen
fauce
Washing
machine
Total
(Mm3) 9377 1672 2621 723 994 11 15399
To calculate non domestic water consumption from showers only i.e. excluding bathtubs, it is assumed the split is 50:50 between showerheads and bathtubs75. Based on the stock figures (2007) for non-domestic taps and showerheads evaluated in the Market Analysis (see Section 2.2.1), the amount of water used per tap and showerhead can be calculated.
Non domestic stock of taps = 69,810,000 units
Non domestic stock of showerheads = 27,908,000 units Calculated non domestic water consumption per year for taps and showerheads is:
For taps: 51,783 litres per tap per year
For showerheads: 12,953 litres per showerhead per year
3.1.2.5 Calculation of hot water use The amount of domestic and non-domestic hot water use per year from taps can be calculated based on the following assumption regarding stock and the split between hot and cold water.
Based on data reported in Table 3.5, the proportion of hot and cold domestic water consumption could be estimated as follows:
Cold water consumption: 44%
Hot water consumption: 56%
74 IPTS Scoping Document, February 2010 http://susproc.jrc.ec.europa.eu/ecotapware/docs/Scoping%20document_WuP_100217.pdf
75 This assumption has been made in the absence of data to provide an alternative split.

49
This is based on domestic water use, however in the absence of other data this assumption will also be used for calculating hot water consumption from non-domestic use.
Calculated hot water use in domestic and non-domestic taps is as follows:
Domestic Taps: 5,825 litres per tap per year
Non Domestic Taps: 28,999 litres per tap per year For showers, a mixer shower could be assumed as these are most prevalent in Europe. It is assumed the water is heated using a boiler with 70% efficiency. It could be assumed that the hot and cold water mix ratio is 70:30, as suggested by guidance from Australia76. Similar guidance for the EU was not identified.
Using this assumption and the total water consumption for showers calculated paragraph 3.1.2.3, hot water use is calculated as follows:
Domestic Showerheads = 9198 litres per showerhead per year
Non Domestic Showerheads = 9067 litres per showerhead per year
3.1.3 Feedback from the 1st Questionnaire to stakeholders Water and energy consumption associated to products on the market (#11a)
Product (please modify including
average products and
water and energy saving technologies)
Description
(technology, country, year, av.
price)
Water flow
(L/min)
Water consumption
per person per day
(L/person)
Hot water
average cons.
(% of tot)
Average temp. of
hot water
(°C)
Electricity consumption
for supply and control of
water flow at the final user
(kWh/L)
Kitchen tap
Bathroom tap 4.3-13 L/min at 3 bar (for taps claiming to be water efficient)
Outlet water
56-71.5ºC (for inlet water at 71.5ºC at 3 bar)
14.6-45.8ºC (when regulator is in the central position)
Outdoor tap
Showers 4.2-18.3 L/min at 3 bar (for taps
Outlet water:
34.6-37ºC (inlet
76 http://www.energy.wa.gov.au/cproot/2311/2/choose_hot_water.pdf

50
claiming to be water efficient)
water at 36ºC at 0.1 bar)
40.8-42ºC (for inlet water at 42 ºC at 0.1 bar)
Industrial kitchen tap #1
Sink, pot or kettle filling
tap
30-100 L/min
n/a 25% 60°C n/a
Industrial kitchen tap #2
Pre-rinse spray unit
12-15 L/min
n/a 75% 60°C n/a
Additional sources of information:
Standard figures are extractable from charts in EN 806 and DIN 1988
Description of user behaviour practices (#11b)
Product (please modify including
average products and water and energy
saving technologies)
Daily frequency of use per person
(nr.use/person)
Average time for each single
use (min)
Water wasted due to wrong
user behaviour practices
(% of water used)
Water wasted due to inherent characteristics of the system
(e.g. waiting for hot-water)
(% of water used)
Kitchen tap
Bathroom tap 6 1 50%
Outdoor tap
Showers 1 10 50%
Sink, pot or kettle filling tap
3–4 times a day to cook a meal
5- 10 min per kettle filling
n/a n/a
Pre-rinse spray unit 10 times a day up to permanent use
1 min per batch for the dish
washing machine
n/a n/a
Note:
Presented figures are estimations (No aggregated data is known for Portugal, Spain, Italy and Belgium)
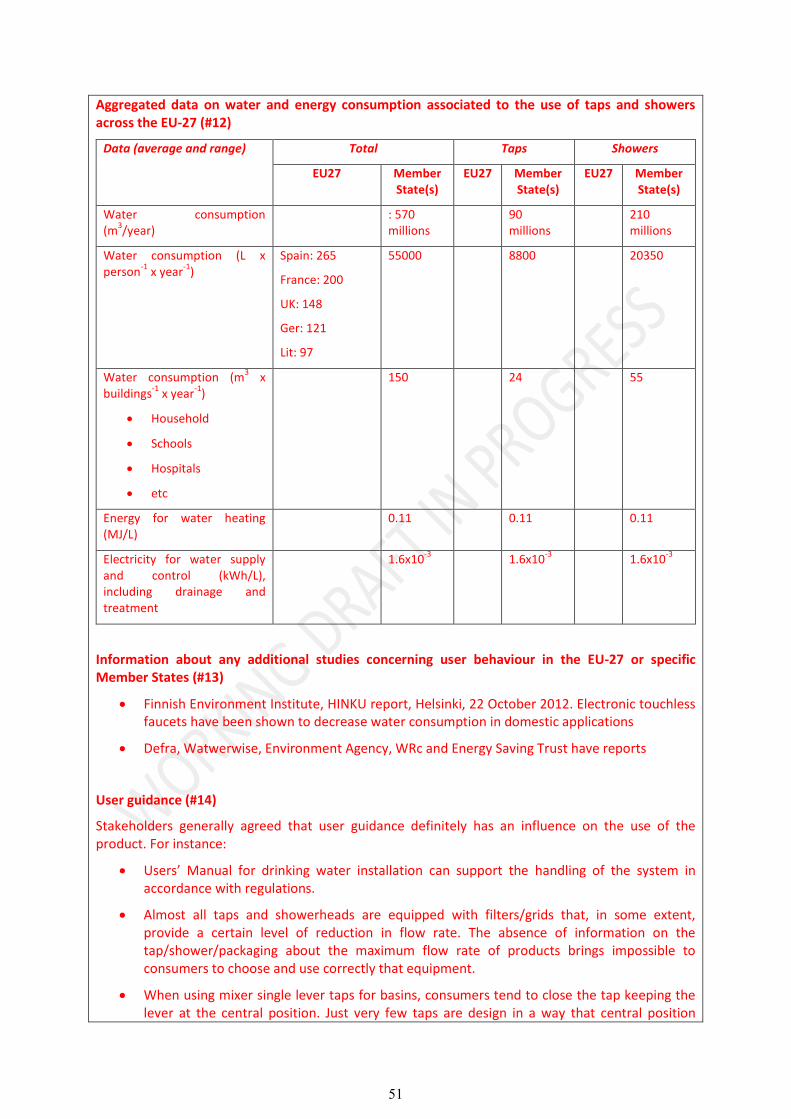
51
Aggregated data on water and energy consumption associated to the use of taps and showers across the EU-27 (#12)
Data (average and range) Total Taps Showers
EU27 Member State(s)
EU27 Member State(s)
EU27 Member State(s)
Water consumption (m
3/year)
: 570 millions
90 millions
210 millions
Water consumption (L x person
-1 x year
-1)
Spain: 265
France: 200
UK: 148
Ger: 121
Lit: 97
55000 8800 20350
Water consumption (m3 x
buildings-1
x year-1
)
Household
Schools
Hospitals
etc
150 24 55
Energy for water heating (MJ/L)
0.11 0.11 0.11
Electricity for water supply and control (kWh/L), including drainage and treatment
1.6x10⁻³
1.6x10⁻³
1.6x10⁻³
Information about any additional studies concerning user behaviour in the EU-27 or specific Member States (#13)
Finnish Environment Institute, HINKU report, Helsinki, 22 October 2012. Electronic touchless faucets have been shown to decrease water consumption in domestic applications
Defra, Watwerwise, Environment Agency, WRc and Energy Saving Trust have reports
User guidance (#14)
Stakeholders generally agreed that user guidance definitely has an influence on the use of the product. For instance:
Users’ Manual for drinking water installation can support the handling of the system in accordance with regulations.
Almost all taps and showerheads are equipped with filters/grids that, in some extent, provide a certain level of reduction in flow rate. The absence of information on the tap/shower/packaging about the maximum flow rate of products brings impossible to consumers to choose and use correctly that equipment.
When using mixer single lever taps for basins, consumers tend to close the tap keeping the lever at the central position. Just very few taps are design in a way that central position

52
corresponds to cold water. For the others, this central position will always provide tepid/hot water, even for uses that do not need it. Advising consumers about the result of such detail could lead to important energy savings.
When using mixer double lever taps for showers, consumers tend not to close the tap while soaping. If these taps are sell with a knob – or similar – to completely stop the flow without manipulating the handles, this problem could be solved.
It is important to inform consumers via printed material available in the stores
Today users mainly use hot water to pre-rinse the dishes in industrial kitchens. It would be better to set thermostats to deliver warm water (less than 40°C) but training is needed

53
3.2 Product use, maintenance and End-of-Life 3.2.1 Product use & stock life It is important to understand what is the life cycle of the product to establish how new environmental or performance criteria will impact the replacement rate and how quickly can savings been achieved. During the development of the EU Ecolabel and GPP criteria for sanitary tapware, the following ranges were identified for the time of use of the products.
Domestic premises
Taps kitchen: 5 to 20 years
Taps bathroom: 5 to 20, but are designed to last more than 20 years (this seems to indicate the influence of fashion and improved technologies)
Taps outdoor: 10 to 30 years
Showerhead :5 to 15 years
Non domestic:
All taps – 5 to 20 years
Showerhead – 5 to 10 years
The lifetime values used for the modelling presented in section 2.2 are based on average value from the stakeholder’s responses. These are summarised as follows:
Domestic all taps: 16 years
Domestic showerhead: 10 years
Non-domestic all taps - 10 years
Non-domestic showerhead – 7 years
3.2.2 Repair and Maintenance Trends The use phase of taps and showerheads will, in addition to the water and energy use outlined above, require maintenance and repair during their life time. This may include replacement valves and washers. The frequency of the replacement of parts for taps and showerheads is not known, but from experience is believed to be limited. The market Analysis (Section 2) includes information on costs of the product and on installation, repair/maintenance and utility (i.e. for water and electricity) prices.
3.2.3 Collection, recycling and disposal Feedback from stakeholders indicates that taps are generally recycled, due to their metal content which has value. This is also the case for metal parts of showers; however the position is less clear for plastic showerheads. It is thought that many of these will be sent to landfill.
Any taps and showers that need to be disposed-off are handled by professionals (plumbers or builders). These usually give the product r recyclers. However, it is uncertain how much of the products are recycled when it is a Do It Yourself (DIY) job undertaken by householders. A large proportion could be recycled, also due to the increasing pressure of Public Authorities for recycling household waste and the consequent availability of facilities where these products can be disposed-off.
Taps and showers are often changed before they fail, due to personal preferences and fashion. This raises the potential for a second-hand market for taps and shower heads; however information regarding the extent of this across Europe has not been identified.
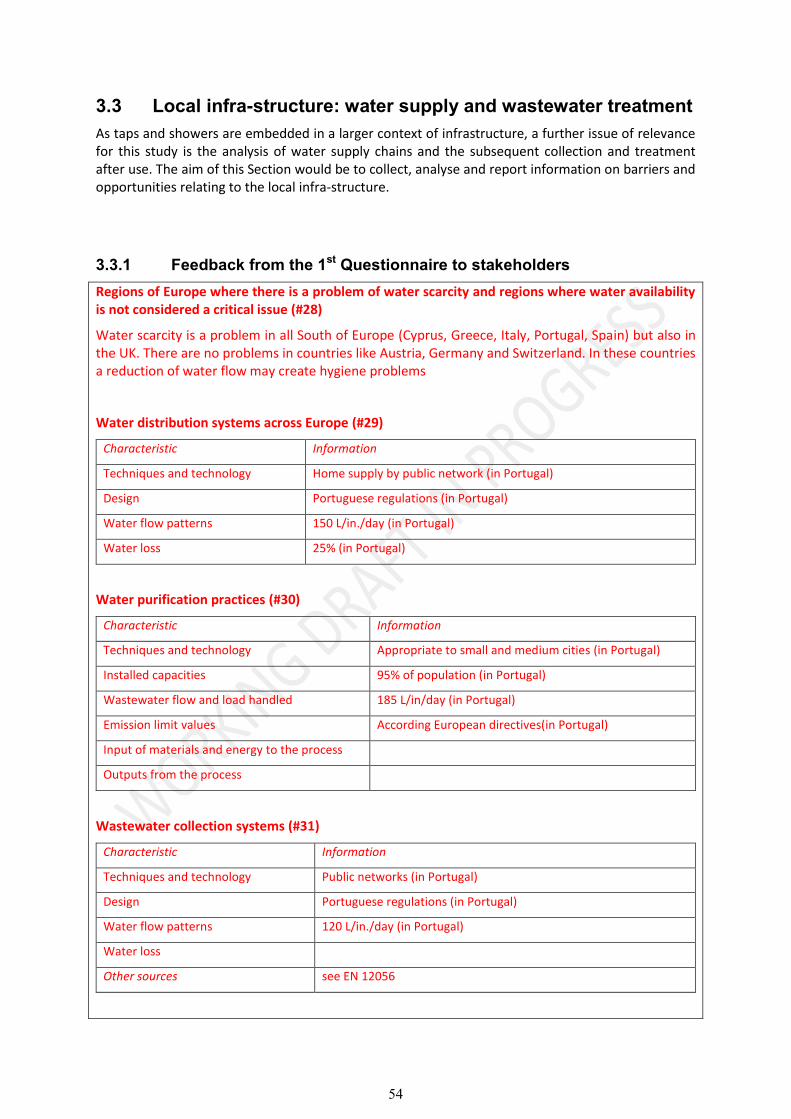
54
3.3 Local infra-structure: water supply and wastewater treatment As taps and showers are embedded in a larger context of infrastructure, a further issue of relevance for this study is the analysis of water supply chains and the subsequent collection and treatment after use. The aim of this Section would be to collect, analyse and report information on barriers and opportunities relating to the local infra-structure.
3.3.1 Feedback from the 1st Questionnaire to stakeholders Regions of Europe where there is a problem of water scarcity and regions where water availability is not considered a critical issue (#28)
Water scarcity is a problem in all South of Europe (Cyprus, Greece, Italy, Portugal, Spain) but also in the UK. There are no problems in countries like Austria, Germany and Switzerland. In these countries a reduction of water flow may create hygiene problems
Water distribution systems across Europe (#29)
Characteristic Information
Techniques and technology Home supply by public network (in Portugal)
Design Portuguese regulations (in Portugal)
Water flow patterns 150 L/in./day (in Portugal)
Water loss 25% (in Portugal)
Water purification practices (#30)
Characteristic Information
Techniques and technology Appropriate to small and medium cities (in Portugal)
Installed capacities 95% of population (in Portugal)
Wastewater flow and load handled 185 L/in/day (in Portugal)
Emission limit values According European directives(in Portugal)
Input of materials and energy to the process
Outputs from the process
Wastewater collection systems (#31)
Characteristic Information
Techniques and technology Public networks (in Portugal)
Design Portuguese regulations (in Portugal)
Water flow patterns 120 L/in./day (in Portugal)
Water loss
Other sources see EN 12056

55
Municipal wastewater treatment practices (#32)
Characteristic Information
Techniques and technology Appropriate to small and medium cities (in Portugal)
Installed capacities 80% of population (in Portugal)
Wastewater flow and load handled 150 L/in./day (in Portugal)
Emission limit values According European directives (in Portugal)
Input of materials and energy to the process
Outputs from the process
Measures aiming at reducing water consumption (#33)
A stakeholder reported that a document of potential interest is the Master's thesis of Ana Margarida Martins Monteiro "Study of the impact caused by the reuse of greywater in situ in drainage networks of domestic wastewater ". University of Tras-os-Montes and Alto Douro, Portugal (2011/2012).
If pipelines are not properly dimensioned, additional flush of water could be needed to compensate the reduced flow
Technical measures to adapt collection systems/waste water treatment plants to variations of the volumes of the drained water (#34)
Water could be flushed into pipelines or added to wastewater treatment stations whenever needed

56
3.4 System aspects related to the use phase: affected energy system(s)
This section reports and analyses information on the indirect energy consumption associated to the use of the product. Specifically, the aim is to:
Describe the affected energy system(s) and its interaction with taps and showers
Report key information on the affected energy system(s)
Quantify the energy use related to the affected energy system(s).
3.4.1 Affected energy systems The systems related to taps and showers in which energy is demanded include:
a) Water abstraction, impoundment, storage, treatment and distribution of surface water or groundwater
b) Water supply and control at the user
c) Water heating
d) Waste-water collection and treatment which subsequently discharge into surface water.
3.4.2 Calculation of the energy consumption associated with water heating
With reference to the background data collected during the development of the EU Ecolabel and GPP criteria for sanitary tapware, and based on the hot water consumption calculated in Section 3.1.2.5, the following assumptions could be used to quantify the energy consumption associated with water heating through electric boilers.
Energy use per litre can be quantified as 0.092 kWh. This is based on the following: o 4200 (J/deg C/litre) * temperature increase (deg C) / energy efficiency / 3,600,000 o Temperature increase is 55 deg C (from 5 to 60 deg C). This is based on guidance
that a boiler should be set to operate at a minimum 60 deg C to kill legionella bacteria77.
o Boiler efficiency is assumed as 70%78 Knowing the energy use per litre and the consumption of hot water is possible to quantify energy input figures in kWh per year. These are shown in Table 3.7 for taps and Table 3.8.
77 http://www.hse.gov.uk/pubns/indg376.pdf 78 From Table 11 of Critchley, R. and Phipps, D (2007) Water and Energy Efficient Showers: Project Report
http://www.unitedutilities.com/Documents/UULJMUwaterenergyefficientshowerFinalreport23rdMay2007.pdf

57
Table 3.7 Consumption of electricity during the use of taps
Use Type kWh per tap per year
Domestic 536
Non Domestic 2668
Table 3.8 Consumption of electricity during the use of showers
Use Type kWh per shower per year
Domestic 846
Non Domestic 834
Calculations need to be refined and repeated for different heating systems. Energy consumption for water supply and wastewater treatment also need to be estimated.
3.4.3 Feedback from the 1st Questionnaire to stakeholders Related system in which energy is demanded (#25)
Related system in which energy is demanded
Heat consumption (MJ/L)
Electricity consumption (kWh/L)
Other information of relevance
a) Water abstraction, impoundment, storage, treatment and distribution of surface water or groundwater
232 (in Portugal)(1)
b) Water supply and control at the user
c) Water heating Refer to boiler studies
0.03 (in Portugal)(1) Heating 1 m
3 of water
can cost 1.1€ (solar panel) to 8€ (piped propane boiler)
d) Waste-water collection and treatment which subsequently discharge into surface water.
227 (in Portugal) (1)
References:
(1) SILVA‐AFONSO, A.; RODRIGUES, F.; PIMENTEL‐RODRIGUES, C. – “Water efficiency in buildings: Assessment of its impact on energy efficiency and reducing GHG emissions” – Recent Researches in Energy & Environment (6th IASME/WSEAS International Conference on Energy & Environment – EE’11). Cambridge: WSEAS Press, 2011. ISSN 1792‐8230. ISBN 978‐960‐474-274‐5. pp. 191‐195.
Share of different water heating systems across the EU (#27a)
Water heating system
Installation share (%) - now Installation share (%) - trends
EU27 Member State(s) EU27 Member State(s)
Natural gas boiler
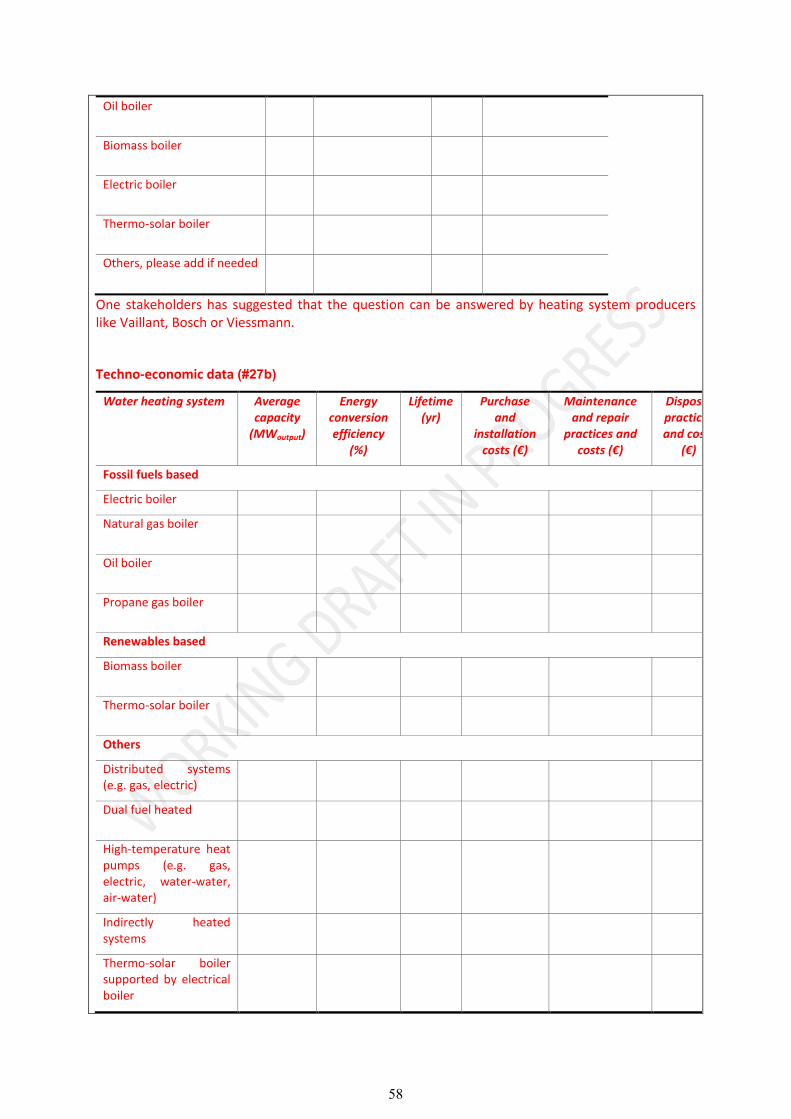
58
Oil boiler
Biomass boiler
Electric boiler
Thermo-solar boiler
Others, please add if needed
One stakeholders has suggested that the question can be answered by heating system producers like Vaillant, Bosch or Viessmann.
Techno-economic data (#27b)
Water heating system Average capacity
(MWoutput)
Energy conversion efficiency
(%)
Lifetime (yr)
Purchase and
installation costs (€)
Maintenance and repair
practices and costs (€)
Disposal practices and costs
(€)
Fossil fuels based
Electric boiler
Natural gas boiler
Oil boiler
Propane gas boiler
Renewables based
Biomass boiler
Thermo-solar boiler
Others
Distributed systems (e.g. gas, electric)
Dual fuel heated
High-temperature heat pumps (e.g. gas, electric, water-water, air-water)
Indirectly heated systems
Thermo-solar boiler supported by electrical boiler

59
3.5 Next steps to complete the discussion on Users and systems aspects
Water consumption and user behaviour
Aggregated data on water consumption To be revised based on the feedback of stakeholders
User behaviour patterns (average figures and variability for different products and influence of user behaviour practices)
To be revised with the support of stakeholders
Best Practice in sustainable product use To be included with the support of stakeholders
Product use, maintenance and End-of-Life
Product use & stock life To be revised based on the feedback received from stakeholders
Repair- and maintenance practice (frequency, spare parts, transportation and other impact parameters)
To be revised based on the feedback received from stakeholders
Collection rates To be revised based on the feedback received from stakeholders
Estimated second hand use, fraction of total and estimated second product life
To be included with the support of stakeholders
Local infra-structure: water supply and wastewater treatment
Barriers and opportunities
Analysis of technical impact on drainage/sewage systems and waste water treatment plants due to water efficiency measures (e.g. overview of EU27 drainage systems, overview of EU27 waste water treatment facilities/technologies, flow patterns in different drainage systems, possible effects in different drainage systems, possible effects in wastewater treatment works)
To be included based on the feedback received from stakeholders
System aspects related to the use phase: affected energy system(s)
Describe the affected energy system(s) and the interaction with the ErP To be included
Report key information on the affected energy system(s) To be improved based on the feedback received from stakeholders
Quantify the consumption of energy related to the affected energy To be included based on the feedback
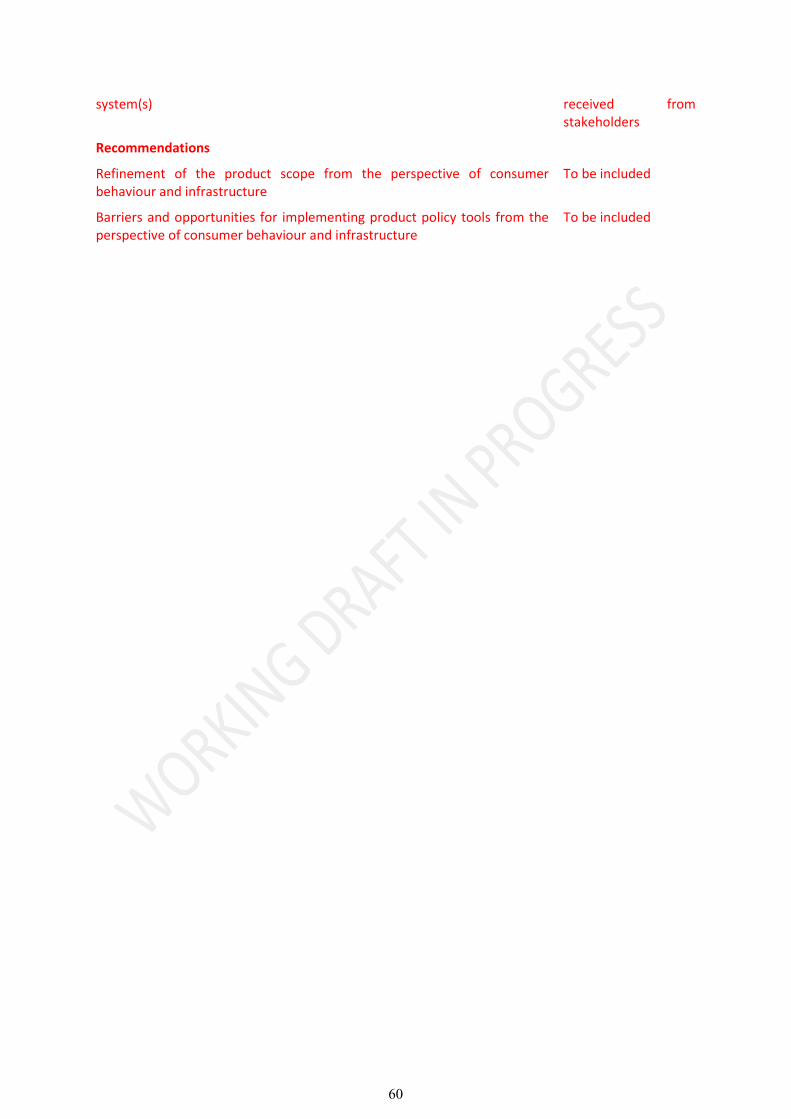
60
system(s) received from stakeholders
Recommendations
Refinement of the product scope from the perspective of consumer behaviour and infrastructure
To be included
Barriers and opportunities for implementing product policy tools from the perspective of consumer behaviour and infrastructure
To be included

61
4 ANALYSIS OF TECHNOLOGIES
4.1 Introduction The present section focuses on the analysis of technical aspects related to taps and showers and to different stages of the lifecycle of these products.
Typical taps and showers on the market and alternative design options are described also including indications on the use of materials, product performance and costs. Additionally, information on production processes, distribution and end-of-life practices is reported. Best Available Technologies, Best Not Available Technologies and technological trends are also analysed as far as possible.
Relevant background information is contained in the documentation supporting the development of EU Ecolabel and GPP criteria for sanitary tapware79,80.
4.2 Technical product description Taps and showers for the domestic and non-domestic sectors are produced in a variety of designs, using a range of different materials and varying functionality depending on their intended use. This section provides an overview of the key common elements of these products.
Different types of taps and showers available on the market (e.g. mono bloc mixer taps and pillar taps) have been introduced in Chapter 1 on Scope and Chapter 2 on Market. Additional technical information is described here which relates to the key components and mechanisms used in taps and showers.
4.2.1 Taps There are two main types of mechanisms used on taps currently available in the market:
Traditional/conventional spindle taps
Ceramic disc taps.
4.2.1.1 Traditional spindle taps In the past, traditional spindle taps were the only type of tap available. For this reason their use across the EU is common as they can be used in both high and low pressure systems.
The principle on which they operate is simple, being the flow rate controlled by turning the tap head. The tap consists of a spindle with a valve seat attached to the bottom of the spindle. A washer is attached to the end of the valve seat and it is positioned over the hole through which water flows. As the handle is turned it moves the valve seat up or down to adjust the flow. This mechanism is shown in Figure 5.1.
79 http://susproc.jrc.ec.europa.eu/ecotapware/docs/Task%204_Report_Base_Case_Assessment%20Final_Sept.2011.pdf
80 http://susproc.jrc.ec.europa.eu/ecotapware/docs/BAT%20Report%20Final_Sept%202011.pdf

62
Figure 5.1 - Spindle Tap Mechanism81
Spindle taps are typically composed of a number of common components which are shown in Figure 5.2 for a pillar tap. The various parts of the tap are generally robust and hard wearing. During the lifetime of a spindle tap, the key components likely to require replacing are tap washer, o-rings or regrinding of the valve seat where this has been eroded82.
Figure 5.2 - Components of a spindle tap83
The spindle mechanism cannot be applied to all the types of taps. For example, it cannot be used with lever taps, as repetitive turning is required to open and close the tap.
81 http://www.click4bathrooms.com/bathroom-images/bib-tap.JPG
82 http://www.diydoctor.org.uk/projects/dripping_tap.htm
83 http://www.diydoctor.org.uk/projects/dripping_tap.htm

63
4.2.1.2 Ceramic Disc Tap Ceramic disc taps operate differently to spindle taps. In this case, two ceramic discs in the tap body are separated when the handle is turned or lifted allowing water to flow. This means the tap can be turned fully on and off by a quarter turn of the handle. Many components of a ceramic disc tap are the same as those of a spindle tap, however the mechanism differs.
The components of a ceramic disc tap are listed in Figure 5.3, that illustrates an example of single lever mixer tap. These are:
Spout (A)
Tap cartridge B)
Handle (C)
Retaining Screw (D)
Screw cover/hot-cold indicator (E)
Figure 5.3 - Components of a ceramic disc tap84
The tap cartridge consists of a number of parts itself; these are shown in Figure 5.4:
Disc retaining washer (A)
Ceramic discs (B)
Ring (C)
Valve retaining nut (D)
Spindle, on which the handle sits (E)
84 http://www.diydoctor.org.uk/projects/ceramic_disc_taps.htm

64
Figure 5.4 - Components of a tap cartridge from a ceramic disc tap85
As with spindle taps, ceramic disc taps are designed to be hard wearing. The key components that wear are the ceramic discs. These are designed to be durable and it is unusual for them to wear-out completely. However, if new discs are needed, the whole tap cartridge is usually replaced.
In general ceramic disc taps require a certain pressure at which to operate in order to provide an acceptable flow rate for the end user. However the pressure at which ceramic disc taps will operate depends on the design of the tap itself (e.g. the size and alignment of the discs, the diameter of the opening for which water can pass through and the resistance provided).
This means that ceramic disc taps can be designed to operate at low pressures (e.g. 0.1 bar) as well as higher pressures (such as 0.5 bar or 1.0 bar and above). However, given that the main low pressure market is the UK and that pillar taps are still widely used in the UK in comparison to mainland Europe, the majority of ceramic disc taps are designed for higher pressure systems and not the low pressure systems. The important point to ensure an acceptable flow rate is achieved is to use a tap that is designed for the pressure system it is to be used with. It is therefore important that the product information states the min/max pressure at which the tap can be used so the consumer can make an informed choice.
4.2.2 Shower systems A shower system is typically composed of a showerhead and a valve, e.g. mixer/thermostatic or electric shower unit.
The showerhead delivers water to the end user and is usually connected to the valve via a hose or, if wall-mounted, via a shower arm. Design and components of showerheads can vary depending on the type and complexity of the product. For example, some showerheads can present aerators or built-in flow regulators. An indication of the types of components used in some example products is provided in Figures 5.5, 5.6 and 5.7. The following components are common in different showerhead designs:
Showerhead Body
Spay disc/plate
Seals (e.g. nitrile seals)
Flow Regulator / Aerator mechanisms (depending on the product design).
85 http://www.diydoctor.org.uk/projects/ceramic_disc_taps.htm

65
Figure 5.5 - Single Spray Showerhead86
Figure 5.6 - Example showerheads. On the left, "champagne" head shower87 (1 – Bellow, 2 – Sealing Washer, 3 – Strainer, 4 – Adjusting Ring 5 – Spray Faceplate). On the right: massage
handshower88 (1 – Adjusting Ring, 2 – Spray faceplate, 3 – Strainer).
86 http://www.wayneansell.com/portfolio/hh-336n_diagram_lrg.png
87 http://www.showerdoc.com/shower-spares/grohe/GROHE-PARENT-37-Grohe- movario-Head-Shower-Champagne-1-2in-28-396
88 http://www.showerdoc.com/shower-spares/grohe/GROHE-PARENT-32-Grohe-Movario-Handshower-Massage-28-391

66
4.3 Technology, trends and examples of products In the last years there has been an increasing focus on improving water efficiency of different industry sectors and uses of the resource. This has interested also the use of water in taps and showers, both in terms of product and system performance and of user behaviour.
This has resulted in a number of innovations over the years in order to improve water efficiency and this trend is expected to continue in the future. The following technologies/features have been so far identified as solutions to reduce water use through taps and showers:
Aerators
Flow regulators
Ecobuttons
Taps with water brakes
Hot water limiters
Energy saving features
Showerhead design and spray patterns
Sensor taps
Automatic shut-off taps (Push taps) These technologies can often be used in products on their own; however, the assessment of different technologies and the products they are included in has shown that it is common for two of more of the features to be included within a product.
4.3.1 Aerators An aerator entrains air into the water stream breaking it into many small droplets that provides an effective cleansing function but with less water. The resulting water stream is softer to touch and non-splashing.
Aerators do not necessarily control the flow rate by themselves. With standard aerators the flow will increase as the pressure increases, however, aerators are commonly combined with a flow regulator producing a constant flow rate regardless of pressure fluctuations (see Figure 5.7). These are manufactured to offer a range of flow rates, for example the product shown in Figure 5.7 can operate at 7 L/min, which is more than adequate for hand washing.
Figure 5.7 - Example of a pressure compensating aerator 89
Aerators can be used both in taps and in showers. Tap aerators are integrated into the spout (with or without a flow regulator) and are often used in homes with low water pressure in order to increase the perceived water pressure and provide a flow straightening function. Whilst aerators can
89 Neoperl product brochure and Water and Energy Saving presentation (as supplied by manufacturer)

67
be used for domestic and commercial applications they are more commonly used for domestic applications.
Water efficient taps commonly present both an aerator and a flow regulator. In comparison with conventional taps, this type of products can consume less water, which can also result in energy saving due to reduced hot water use. Example water and energy savings potential for a product on the market implementing such devices is shown in Table 5.1 together with indicative payback period of such technologies. Figures have been provided by the manufacturer of EcoSmart. In particular, payback periods indicate that the initial investment is returned after 7-20 months, which significantly shorter than the typical lifetime of a tap. However, the actual savings will depend on the pressure of the system the tap is used on, the price of water and electricity and the usage patterns/behaviour of the end users.
Table 5.1: Potential savings from a basin mixer fitted with integrated aerator and flow regulator
Conventional tap
EcoSmart EcoSmart with electronic mixer
Water flow (L/min) 13.5 5 5
Estimated annual savings in water costs (€) in Germany for a family of 4 persons
- 204 204
Estimated annual savings in energy costs (€) in Germany for a family of 4 persons
- 67 67
Total annual savings (€) - 271 271
Product payback period (months) - 7 20
Calculated Purchase Cost (€) 8-475 160 450
4.3.2 Flow Regulator Aerators are often used in conjunction with a flow regulator. Pressure compensating flow regulators maintain a constant flow rate regardless of variations in line pressure. This provides improved system performance ensuring comfort for the end user at lower pressures as well as water and energy savings at high pressures.
The flow regulator is based on an elastomeric component which is deformed by increasing water pressure, which closes the water bypass area of a specifically designed flow regulator core/profile (see Figure 5.8). Under static conditions (no flow, or low pressure) the elastomer is relaxed (position 1 in Figure 5.8). Under dynamic conditions (flow) the elastomer subjected to the line pressure is compressed into the seating area which reduces the water passage (position 2 in Figure 5.8). As the pressure increases the elastomer is compressed further into the seating area further reducing the water passage (position 3 in Figure 5.8). As the line pressure decreases the elastomer relaxes and reopens the water passage (returning to positions 2 and 1 as indicated in Figure 5.8).

68
Figure 5.8: Flow regulator mechanism90
Flow regulators are manufactured to provide control over a range of pressure conditions (see Figure 5.9), enabling the user to choose the suitable model for a given situation. Standard regulators begin controlling the flow in a pressure range from 0.8 to 10 bar. Special models developed for low pressure installations are typical for the UK and Ireland. The flow control function of low pressure regulators initiate at a significantly earlier stage at pressures as low as 0.25 bar. A variation from standard and low flow models of flow regulator is represented by dual flow regulators, which allow the users to select two possible flow rates or two pressure ranges in one regulator housing combining low pressure applicability (requiring maximum flow at low pressures) with pressure compensating flow regulation at standard pressure ranges.
Figure 5.9: Performance of different flow regulator types for up to 8 bar pressure91
All flow regulators can be designed to operate at different flow rates. Flow regulators for the majority of applications exist. Installers and end users must select the most suitable product for the intended used (e.g. high or low pressure system).
Flow regulators are commonly inserted in taps and showers, built into the overall product design or available for retro fitting. They can be accommodated in the inlet/outlet connections of an isolation valve or the ball of a quarter turn valve. Flow regulators can be easily installed, removed for
90 Neoperl products brochure – flow regulators (supplied by manufacturer)
91 Neoperl products brochure – flow regulators (supplied by manufacturer)

69
maintenance, replaced or upgraded, thus minimising the cost and therefore barriers to the use of this technology.
Flow regulators are suitable for both domestic and commercial applications. In commercial and institutional installations where multiple taps are supplied by a single hot/cold water system, flow regulators can also help to improve the distribution of water, as well as reducing consumption.
Flow regulators play a prominent role in the design of water efficient taps and showers and have done so for at least the last decade. They are generally manufactured by companies specialised in flow regulator design and which supply them to the tap and showers manufacturers. Whilst the technology is not new this is likely to continue to be one of the main technologies used in the coming years and will influence the capabilities of products to reduce flow rates further.
Considering a water and sewerage cost savings of around 16-17 € per tap and year92 and 15 seconds of use of a tap for 20 times per day93, using a product with a tap aerator and flow regulator, or retrofitting a product at a cost of less than 5.5 €/tap, has a short payback period of just a couple of months. The low cost and quick payback of flow regulators has been confirmed by manufacturers. For example, some manufacturers have indicated that flow regulators are included with products as standard, whereas other manufacturers offer taps with and without flow regulators and may charge a small premium for the inclusion of flow regulators94. They are a small percentage of the overall product cost and do not represent a barrier to the technology uptake.
4.3.3 Ecobuttons Ecobuttons are relatively new products, having been introduced on the market over the last couple of years. They allow the user to override a default lower flow rate setting in order to provide a higher flow rate.
The flow rate is controlled by an integrated flow regulator. By pressing the ecobutton, the user can switch to boost-mode and full flow is released through the valve (see Figure 5.10). This provides increased flexibility of the product for the end user, for instance when sinks or vessels must be filled. Once the ecobutton is pressed again the product reverts to its default water saving mode. It is important that these products come with clear instructions regarding the different modes they can operate in order to gain maximum benefits.
These control devices are easy to install and can limit water use by 50% or more, but whilst the default lower flow rate may meet water efficiency criteria, the higher flow rates could not.
An example product is the Neoperl Ecobooster. Domestic shower flow can be regulated to 8 L/min and 11 L/min. The boost-mode flow can be greater than 20 L/min at 3 bar supply pressure with a non-restrictive showerhead. Kitchen and bathroom sink taps can be regulated to 5 L/min .The boost-mode flow can be greater than 17 L/min at 3 bar supply pressure. The boost mode is functional at low supply pressure (0.4-0.5 bar). The Ecobooster costs approximately 25 €95. The payback period will be dependent on how much the default water saving position is used.
92 Product cost and savings converted into Euros from Sterling using an exchange rate of 1 GBP = 1.11993 EUR
93 Envirowise, ‘Reducing water use in washrooms: taps’, 2007, available online: http://envirowise.wrap.org.uk/england/Our-Services/Publications/EN664-Reducing-water-
use-in-washrooms-taps.html
94 For example Deva in the UK provide their Ikon Mono basin mixer (IKO113) without a flow regulator for £145.93, or with a 4 litre/min (IKO113/HSR4) or 2litre/min
f(IKO113/HSR2) low regulator for £148.49
http://www.deva.org.uk/products/detail1/bathroomtaps1.php?category1=bt&range1=ikon&imageField4.x=38&imageField4.y=40
95http://www.elcheapo.nl/kranen/neoperl/neoperl_ecobooster_kraan_m22_bi_waterbesparend_anti_kalk_02043498_145010696/

70
Figure 5.10: Ecobooster and example applications 96
Ecobuttons have also been incorporated in the thermostatic control valve of showers, for example the Hansgrohe Ecostop9798. Ecostop is a mechanical valve, with a mechanical stop position which can be overridden by pushing a button to reach the fully open position. It does not include a flow regulator. The water saving flow is limited to 10 L/min. When the button is pressed, the full flow of water is released. Assuming a standard shower has a flow rate of 20 L/min at 3 bar pressure, this features can restrict the water flow by up to 50%.
4.3.4 Taps with water brakes Taps fitted with water-brakes, commonly known as ‘click’ or two-stage taps, are increasingly included by manufacturers in their product ranges. As the operating lever is raised the water flow increases until a flow rate of typically between 5 to 10 L/min is reached depending on the product design. At this point the user will feel a resistance to movement, and opening the tap any further requires additional force to overcome the brake. Once overcome, the lever will move as easily as before towards full flow, as shown in Figure 5.11.
Figure 5.11: CeraMix Blue Eco tap99
In theory, water brakes can be fitted to pillar and rotary taps though they are normally only fitted to mono-bloc mixer taps. Click taps are generally set at 50% of maximum flow; however the break
96 Neoperl Ecobooster datasheet (supplied by manufacturer)
97 http://www.aquabrand.com/prodlist/201-hansgrohe-ecostat-thermostatic-shower-mixer-taps-exposed
98 http://www.hansgrohe.co.uk/cps/rde/xbcr//uk_en/publications/UK/Flow_limitors.pdf
99 http://www.myidealbathroom.com/media/pdf/Brochure_Ceramix_Blue.pdf

71
could be also set to a different point. As for ecobuttons, whilst the default lower flow rate may meet water efficiency criteria, the maximum flow rates could not.
Although taps fitted with water brakes have potential to save water, they do have some limitations100. Their operation is pressure-dependent and they are generally only suitable for systems with pressure above 1 bar, which is fine for the majority of mainland Europe, but is an issue for the UK and Ireland, although dual ceramic cartridge ‘click’ taps can operate under low pressure. Taps with water brakes are often fitted with a flow regulator and an aerator, for example the Ideal Standard Ceramix Blue Eco model101. The flow limiter reduces water consumption between 5 to 9 L/min.
This model costs approximately 210 €102. According to the market information available, the current price range for taps is 8-475 €, with an average of 241 € for mono-bloc basin taps. In addition, the manufacturer has estimated that for a family of four people, the installation of this model of taps could lead up to 430 € saving per year, including both water and energy savings. Breakdown of water and energy savings are shown in Figure 5.12. Average prices of water and energy have been considered 5.5€/m3 and 0.75€/L, respectively. Based on the above data, the payback time for this product could be comprised between 0-6 months.
Figure 5.12: Potential savings from CeraMix Blue Eco tap
4.3.5 Hot water limiters Since reducing flow rates could increase the scalding risk, all basin models are equipped with a hot water limiter. The hot water limiter is a special ring assembled within the tap cartridge, which can be adjusted by the installer or the end user to set the temperature of the hot water delivered. The water will only be delivered at the temperature set if the supply conditions i.e. the input water temperature and pressure remains constant. In addition to the safety aspect, the hot water limiter will also result in energy savings if lower temperature settings are used.
Hot water limiters are included in particular product ranges at the discretion of manufacturers; however they are a not included across all ranges for a number of different reasons. This may be due to the use of the tap, for example in a kitchen a higher temperature may be required for cleaning, or hygiene. Alternatively in the UK for example hot water limiters are used in the hospital sector, where temperatures need to be limited from a safety perspective as part of best practice.
100 http://www.water-efficient-buildings.org.uk/?page_id=1000
101 http://www.myidealbathroom.com/products/ceramix_blue.php
102 http://www.reuter-badshop.com/ideal-standard-ceramix-blue-basin-mixer-with-flow-rate-limiter-p308504.php

72
4.3.6 Energy saving taps Some taps directly integrate in their designs both water and energy saving features. During normal conditions, these taps deliver cold water. Hot water flows only when the lever is intentionally moved to the left, in some case requiring an additional pressure to the user. The mixer lever can be easily turned back to the water and energy savings position. Up 40-50% of energy saving is reported to be achievable with this type of taps.
Conventional mixers are cheaper to buy but more expensive when costs for use are considered, as shown in Figure 5.13103. The cost of purchasing and using three conventional taps for 15 years is estimated being 3225€, whereas the corresponding cost for resource-efficient mixers is estimated being 2500€. These include: investment at 4% real rate of interest; energy consumption (0.07 €/kWh); water consumption (1.56 €/m3); VAT. Assuming three energy and water saving mixers cost about 750€ (2.3 times the price of conventional taps) and that 725€ are saved over 15 years, the payback period for this technology would be approximately 8.8 years. This demonstrates that understanding life cycle costs of products can address the user to the most appropriate and wise purchase.
Figure 5.13: Estimated savings from energy and water saving single handle mixer tap
4.3.7 Showerhead design The design of a showerhead can affect its water consumption by controlling the flow and spray pattern and therefore the amount of water used. Low flow shower heads generally entrain air into the water and will often include a flow restrictor, the same as those described for taps. As seen with different tap designs, there is often a mixture of technology features included in a product to achieve its intended design purpose. Aeration makes water appearing more voluminous to the shower user. Low-flow shower heads are not always suitable in buildings with low water pressure for satisfactory user experience and they are not suitable for use with electric showers because the water can overheat. A lower flow rate means the water will stay in contact with the heating element for longer, resulting in overheating.
103 Save Energy with efficient tapware brochure/article, Swedish Energy Agency (Supplied by stakeholder)

73
Some products include safety features to prevent this from occurring, which results in the heating elements switching off and any remaining hot water being flushed from the system if the flow is too low and the water gets too hot.
Hansgrohe utilises both aeration and flow regulators in their water efficient shower ranges (see Figure 5.14). To use water more effectively, about 3 L of air per L of water is drawn-in through the entire spray disc and mixed together with inflowing water, which results in the water drops becoming more voluminous, lighter and softer. The combination of the flow limitation, special spray jets and the mixing of water with air can reduce water consumption down to 6-9 L/min, depending on the model.
Figure 5.14: EcoSmart Technology104
Based on information from manufacturers, the typical water and energy savings that can be achieved with this technology is shown in Table 5.2.
Table 5.2: Indicative water and energy savings per year and payback period for examples showerheads implementing aerators and flow regulators105
Parameter Raindance S150 AIR EcoSmart* Crometta 85 Green*
Water savings (L per year) 24024 43680
CO2 emission saving (kg per year) 180 326
Cost savings (€ per year) 181 329
Product payback period (months) 6 1
*Compared to the same product without the same technology for a family of four in Germany in 2009.
It is worth noting that product payback times are relatively short. Although these can change depending on the end user behaviour, this indicates that the product price should not be prohibitive if life cycle costs considerations are taken into account. Conventional shower sprays emit the water in many (often more than 20) small continuous jets of water producing a narrow needle-like spray. The water jets are usually set in a circular pattern to
104 http://www.hansgrohe.co.uk/cps/rde/xbcr//uk_en/publications/UK/enUK_HG_EcoSmart_2010.pdf
105 http://www.hansgrohe.co.uk/cps/rde/xbcr//uk_en/publications/UK/enUK_HG_EcoSmart_2010.pdf

74
balance coverage area and comfort. Newer shower head designs employ different spray types which can result in greater consumer satisfaction and water savings.
For example, the Methven Satinjet showers106 use twin jets of water that collide and turn the water stream into thousands of tiny droplets. These are also fitted with a flow restrictor, with flow rates of 9 and 14 L/min, and can also be retrofitted easily. The manufacturers website indicates that assuming a conventional shower flows at 20 L/min on mains pressure and that 4 showers of 10 minutes are on average taken in a household every day, a reduction of the water flow to 14 L/min could allow saving up to 27% of hot-water energy costs and up to 30% of the water costs. Cost savings would be 50% for energy and 55% for water with a further reduction of the water flow to 9 L/min. Relatively short payback times are calculated for this products (few months).
Another design concept is that of the Nordic Eco shower range. This is based on an original turbine vane-screw design where no air is introduced into the water stream. The water is delivered through the shower handle at full pressure and velocity and is deflected backwards into an expansion chamber from the underside of the screw. This action causes the water to be exposed to periodic and partial under and over pressure. When the pressure reaches a certain level, the water bounces back and out of the chamber about 30 to 40 times per second107. This technology manipulates the surface tension of the water droplet to maximise the wetting and rinsing properties. The Nordic Eco shower delivers a flow rate of 6-9 L/min, depending on the model. The Galant Max Efficiency model provides 6 L/min from 0.8 bar to 5 bar pressures and have an adjustable setting to allow users a wide spray through to a solid stream of water. The Galant Powershower model of 9 L/min is considered as effective as a conventional shower with a flow of 19 L/min. The shower heads are available at around £50 (approximately 59 Euros in June 2013). The literature for the Nordic Eco showers does not provide an indication of the payback period; however the website of the manufacturer does provide a tool to calculate savings associated with individual circumstances108.
4.3.8 Sensor Taps Sensor taps are typically used in non-domestic applications even if they are suitable also for households. Sensors taps are well suited for use within public washrooms since they operate without the user having to touch a button, tap or handle. They are also suitable for use within kitchens, restaurants, schools, hospitals and offices and have been being available on the market for a number of years. It is possible that their use could be expanded in the domestic market in the future, depending on the application.
Automatic sensor taps terminate flow after a fixed duration and generally consist of four key components: a solenoid valve, an infrared sensor, a power source, and a tap unit (see Figure 5.15).
When the infrared sensor (2) detects the presence of the user’s hands in front of the tap (1) it sends an electronic signal to the solenoid valve (5) inside the control box. This initiates the flow of water (6), which is fed to the user (8) via the flexible hose (7) connected to the tap. When the detected object is no longer present, the infrared unit sends a new signal to the solenoid valve to terminate the flow of water. This usually occurs after a few seconds. The solenoid valve transforms electrical energy into motion, and physically starts and stops the water flow.
106 http://www.methven.com/coming-soon-uk/ and www.satinjet.com
107 A video is available at http://multishower.org and http://www.nordicecoshower.co.uk/Technical/tabid/767/language/en-US/Default.aspx
Further product information is also available here: http://www.nordiceco.com/index.php?option=com_zoo&view=category&layout=category&Itemid=28
108 http://www.nordiceco.com/index.php?option=com_content&view=article&id=105&Itemid=30

75
Power consumption of these taps is minimal, for example ≤ 0.3 mW when static and ≤ 3 W when active (at a static current of ≤20μA), with some models able to operate on four AA batteries, which could last up to two years depending on the level of use109.
Figure 5.15: Sensor tap operation110
Sensor taps tend to require less maintenance in terms of parts replacement, cleaning and every day wear and tear. Since taps are activated or deactivated within a few seconds they do not drip (a common problem with manual taps). Based on the market information collated, the average price of infrared mixer taps is 375 €. It is estimated that 15 to 20% of new commercial buildings adopt this technology, and save aapproximately 70% water per hand wash. The savings potential for a sensor tap compared to a normal tap is shown in Figure 5.16. Typically, the payback period for sensor taps is 3-6 months111
109 http://www.autotaps.com/atx-8205-technical-details.html
110 Personal communication with Autotaps
111 http://www.autotaps.com/benefits-of-electronic-taps.html

76
Figure 5.16: Sensor taps savings potential 112
Commercial examples of sensor taps are:
The Dart Valley Systems infra-red electronic sensor tap, which has a flow rate of 6 L/min113;
The VOLA HV1E battery operated basin mixer, which has an on-off infra-red sensor delay and shut-off of 3-10-20 seconds. The tap is sold with a flow restrictor that can be optionally activated to limit the flow to 3 L/min at 3 bar114.
4.3.9 Automatic shut-off taps (Push taps) As with sensor taps, automatic shut off/push taps are typically used in the commercial sector rather than the domestic sector. Once activated, automatic shut-off taps (push action operated taps) give a short flow of water which is terminated after a fixed time interval, typically around 15-20 seconds per event. Push taps cannot be left running for an indefinite time and they are often designed to be tamper-proof and vandal resistant, for example due to their use in public washrooms.
As well as being water efficient, push taps offer a good level of hygiene, and there are designs for hand, elbow or knee operation depending on the end users requirements. Push taps are suitable for both high and low pressure conditions, they can have adjustable flow rates. For instance, the Dart Valley System Q range models are supplied with a range of cups designed to give the required flow rate, which can be adjusted between 5 and 9.5 L/min. They are also supplied with two discs which are designed to vary the opening time of taps between 3 and 11 seconds. The average screw head tap will deliver approximately 12 L/min when turned partially on. The manufacturer indicates they can achieve up to 50% water savings115.
These taps typically cost between 35-50€. Based on a slightly lower product price of approximately 26€, previous research has shown product payback periods of 7 and 3.2 months for cold and hot push taps, respectively116.
In order to maximise the potential water saving offered by push taps, the use of the tap needs to be considered carefully in order to optimise the settings, in particular the flow rate and the running time.
112 Autotaps http://www.autotaps.com/sensor-taps-facts-and-charts.html
113 http://www.dartvalley.co.uk/shopexd.asp?id=108 114 http://www.vola.com/Default.aspx?id=169 115 Dart Valley Systems – Push Tap Product Information Sheet
116 http://envirowise.wrap.org.uk/media/attachments/236724/GG707R_InfoSheets.pdf

77
4.3.10 Technology penetration, design cycles, barriers and opportunities The key water and energy saving technologies presented in this section are summarised in Table 5.3.
Table 5.3: Summary of water and energy technologies for taps and showerheads
Technology Flow rate Water / energy saving potential
Purchase price (1)
Payback time (2)
Barriers to implementation/ Limitations
Integrated aerators with/without Flow regulators
Variable.
Typically 2 to 9 L/min at 3 bar
Dependent on end flow rate.
Typically 40-65% for water if fitted with a flow regulator
160-450 € for the example products (integrated aerators and flow regulators)
Between 7 and 20 months for the example products (integrated aerators and flow regulators)
Standard aerators do not regulate flow rate on their own, however they are often integrated with flow regulators.
Not suitable for use with electrically heated showers.
Hot water limiters could be needed
Flow regulators
Variable; dependent on requirements.
Typically 1-25 L/min at 3 bar
Dependent on end flow rate.
Typically 40-65% for water
< 5.5 € for the flow regulator
Zero to a couple of months for the flow regulator.
Normally operated in working conditions of up to 45°C, beyond which the performance of the regulator can be slightly affected.
Hot water limiters could be needed
Ecobuttons
Taps: 5-7 L/min in water saving position
Showers: 8-10 L/min in water saving position
Typically 50% for water
Approximately 25 € for the example product
No info available it depends on how often the user employs the water saving position
Often only incorporated into the product (no possibilities of retrofitting).
Hot water limiters could be needed
Taps with water brakes
5-7 L/min in water brake
40-50% for water
Approximately 210 € for the example
Zero to 6 months
Generally only suitable for systems with

78
position product pressure > 1 bar
Not suitable for people with arthritis or weak wrists.
Hot water limiters could be needed
Water and energy saving tap
As for other water saving taps
40–50% for energy
As for other products for water
Approximately 750 € for the example product
Approximately 8.8 years for a small household.
Higher initial investment
Hot water limiters could be needed
Showerhead design:
Aeration
6–14 L/min if fitted with a flow regulator
50-70% for water
Approximately 20-120 € for the example product
Between 1 and 6 months for the example products
Aerating shower heads not suitable for electric showers
Showerhead Design:
spray patterns/mechanism
9-14 L/min depending on the product
50% for energy
55% for water
Approximately 60–220 € for the example product
Few months’ for the product example
Lower flow rates can be achieved through other technology e.g. aeration.
Sensor taps Adjustable flow rates. Typically 3-6 L/min
Up to 70% for water
Average price of 375 € for an infrared mixer tap
Between 3-6 months
Not necessarily suitable for the domestic market
Hot water limiters could be needed
Automatic shut off taps (push taps)
Adjustable flow rates. Typically 5-10 L/min
Up to 50% for water
Approximately 35-50 € for the example range
7 and 3.2 months for cold and hot push taps, respectively, based on a product price of approximately 26 €.
Not necessarily suitable for the domestic market
Hot water limiters could be needed
Note 1: Prices are provided for specific components or for final products containing the technology depending on availability of information.
Note 2: Product payback periods are provided based on information supplied by stakeholders or from the manufacturers product literature/websites.

79
The market penetration of particulars types of products and technologies is a fundamental factor for understanding their availability and stage of development. Unfortunately detailed information is limited. Nevertheless, an indication of the products available in the market in terms of water flow rate can be found within the BMA’s labelling scheme, as reported in Table 5.4 (figures updated at September 2011).
Table 5.4: Number of products registered against different flow rates in the BMAs labelling scheme figures updated at September 2011117
Flow Rate (L/min) Taps (does not include kitchen taps) Showerheads
1.7 3
3 3
3.5 2
4 21
4.7 35
5 67
6 36 2
8 19
9 2 5
12 N/A 1
4.3.11 Feedback from the 1st Questionnaire to stakeholders
Segmentation and expected trends in terms of applications (#9b)
Application Taps (%) Showers (%) Showerheads (%)
Domestic vs. Non-domestic
80% by volume domestic in France
80% domestic in the Germany, same share expected in the near future
89% domestic in the UK, share of non-domestic applications in the UK expected to decrease slightly over the next 5 years.
100% by Volume
90% domestic in the Germany, same share expected in the near future
96% domestic in the UK, share of non-domestic applications in the UK expected to increase slightly over the next 5 years.
90% domestic in the Germany, same share expected in the near future
117 Number of products registered as of 7th June 2011 - Data supplied by BMA

80
domestic in one global retailer
Additional information to further break down the market segmentation by application
MSI study reports that kitchen taps represent 25% of the French market
Segmentation and expected trends in terms of water flow rate (#9c)
Water flow in L/min
Taps (%) Showers (%)
Max 3 L/min) 0% (in one global retailer)
Max 4 L/min 0% (in one global retailer)
40% (in Portugal)
Max 5 L/min 0% (in one global retailer)
Max 6 L/min 29.5% (in one global retailer)
20% (in Portugal)
Max 8 L/min 70% (in one global retailer) 50% (in Portugal)
Max 10 l/min
Max 13 L/min 0.5%
Max 15 L/min
> 15 L/min
Lowest maximum flow rate technically feasible? (L/min; specific application)
1.98 L/min
6 L/min (in one global retailer)
2 L/min at 3 bar (kitchen taps may need a lowest maximum flow rate than basin taps)
Basin taps with flows below 2 L/min can be found for non-domestic applications but it cannot be said if these values are close to a technical limit, neither if these products are fit for use
4.5 L/min at 3 bar
Showerheads below 6 L/min can be found but it cannot be said if these values are close to a technical limit, neither if these products are fit for use
Highest flow rate known? (L/min; specific application)
110 L/min in pot or kettle filling tap
30 L/min at 3 bar
20 L/min
12 L/min (in one global retailer)
> 30 L/min at 3 bar
Segmentation and expected trends in terms of main materials (#9c)
Taps (%) Showers (%) Showerheads (%)

81
99% brass, 1% stainless steel in France
95% brass, 5% stainless steel in Germany
99% brass, 0.8% stainless steel, 0.2% plastic in the UK. No change foreseen for the near future
80% brass (trend to 70%), 19% Zinc Al alloys, 1% Plastic (trend to 3%) in one global retailer
95% brass, 5% stainless steel in Germany for industrial kitchen taps
100% brass in Germany
5% brass, 95% stainless steel in Germany
Identification of water and/energy savings technologies (#9d)
Technology Taps Showers Showerheads
Commonly used Aerators
Self-closing taps
Sensor operated taps
Thermostatic taps for bath and shower
Aerators
Innovative but not widely spread yet
Aerators with flow switch knob built-in
Energy saving cartridges
Single lever mixer with a well-defined position in intermediate overture (clic position), corresponding to a low flow rate)
Single lever mixer where horizontal central position flow is only cold water
Thermostatic basin tap or kitchen tap
Flow limiters for showers (introduced between showerhead and hose or this one and bath tap)
Flow switch knob built-in the showerhead
Still in pilot stage
Electronic controlled kettle filling taps
Segmentation and expected trends in terms of water and/energy savings technologies (#9e)
Technology Taps (%) Showers (%) Showerheads (%)
Aerators Almost 100% in France
100%by value in one global retailer
75% for industrial kitchen taps in Germany and market growing
4.8 to 15 L/min at 3 bar (for models claiming to be water efficient)
7.5 to 16 L/min at 3 bar (for models claiming to be water efficient)
7.5 to 16 L/min at 3 bar (for models claiming to be water efficient)
High flow 100 %by value in one global

82
barriers retailer
Thermostat 26% in France (but only used for shower taps/systems and premix systems)
0% by value nowadays in one global retailer, 5% expected in the near future
10% for industrial kitchen taps in Germany and market growing
Hot water barriers
100%by value in one global retailer
Segmentation and expected trends in terms of water control devices (#9f)
Water control device Taps (%) Showers (%)
Showerheads (%)
Single lever, single outlet
62% in France, market penetration increasing
25% in the UK, +3% expected over next five years
0% in one global retailer
30% for industrial kitchen taps in Germany market penetration increasing
4.3 to 13 L/min at 3 bar (for models claiming to be water efficient)
Double lever, single outlet
10% in France, market penetration decreasing
43% in the UK, -2% expected over next five years
0% in one global retailer
50% for industrial kitchen taps in Germany market penetration decreasing
Double outlet 0% in France, market penetration decreasing
30% in the UK, -2% expected over next five years
0% in one global retailer
Infrared sensors 1.8% in France, market penetration increasing
0% in one global retailer
10% for industrial kitchen taps in Germany, market stable

83
Push button and non-manual controls
8% in France, market stable
0% in one global retailer
10% for industrial kitchen taps in Germany, market stable
Thermostatic 18% in France, market penetration increasing
Identification of niche products (#9h)
Niche product
Market share Expected trends Relevance and rationale
Industrial kitchen taps
The physical volume in Germany is 1% (relation between industrial kitchens and domestic households)
Volume is growing but the market share is not expected to be higher that 2%.
Product design (#17)
According to stakeholders, design of new product lines occurs in general every 2 years for domestic appliances. However, no major changes tor industrial kitchen taps can be identified in the last 5 years.
Expected innovations include:
Materials for ensuring respect of hygiene quality standards and presence of more electronics (e.g. water saving programs or data gathering)
In private household there will be an increasing number of automatic taps and faucets, especially in kitchen appliances
Using a shower as a wellness application will gain importance in the future
Influence on aerator change and cleaning

84
4.4 Production, distribution, use and end-of-life Additional technical input on taps and showers is reported in the following sections. This comprises the following life cycle phases: production, distribution, use and end of life.
4.4.1 Production Taps and showerheads on the European market come in a variety of designs, using a range of materials.
Taps are mostly of brass construction with a chrome plating finish, and this is unlikely to change in the short to medium term. This is also confirmed by a review of the type of taps available through retailers. For basin taps the market trend is towards mixer taps over pillar taps, although this possible varies between different member states.
In addition to brass/chrome plated taps, there is a trend towards stainless steel taps, however these are currently a very low percentage of the market.
A range of plastic and metals can be used for showers and showerheads, although the use of plastic is increasing.
4.4.1.1 Bill-of-Materials of example products Average data on material composition and weight of taps and showerheads was provided by CEIR. This is reported in Table 5.5 for taps and in Table 5.6 for showerheads.
Information on taps refers to two example brass and stainless steel taps used for domestic or non-domestic applications.
Information on showerheads refers to two example plastic and metal showerheads used for domestic or non-domestic applications.
Due to the wide range of materials and designs the composition information provided is not representative for all products but still relevant since referring to examples of products commonly available on the market.
Table 5.5 Bill of Materials - Brass Tap and Stainless Steel Tap
Material Weight (g) Material code in
EcoReport Brass Tap Stainless Steel Tap
Brass (Body) 842 31-CuZn38 cast
Stainless Steel (Body, including handle)
720 25-Stainless 18/8 Coil
Nickel Chrome Plating 2 2 40-Cu/Ni/Cr plating
Plastic 63 63 10-ABS
Ceramic 21 21 24-Ferrite(1)
Zinc 209
(1) Ceramic does not appear in the EcoReport’s list of material. The Product Cases report written by the developers of EcoReport indicates that "24–Ferrite" has been used to represent ceramic in other product groups (e.g. Room Air Conditioners and Central Heating Circulators)
118
118 http://ec.europa.eu/enterprise/policies/sustainable-business/ecodesign/methodology/index_en.htm

85
Table 5.6 Bill of Materials – Plastic and Metal Showerheads
Material Weight (g) Material code in
EcoReport Plastic Showerhead Metal Showerhead
Brass (Body) 1902 31-CuZn38 cast
Nickel Chrome Plating 2 2 40-Cu/Ni/Cr plating
Plastic 177 393 10-ABS
4.4.2 Product distribution Limited information is available on packaging and on the volume of the packaged product. Default packaging dimensions/volume for purchased products are:
Length: 38.5 cm;
Width: 18 cm;
Height: 13 cm;
Volume: 9.009 L.
Indication from retail stores is that taps and showers are predominately supplied in cardboard with smaller amounts of plastic (e.g. LDPE bags).
4.4.3 Use, technical product life and time-to-failure of critical parts Information on the use of taps and showers is provided in the section dealing with user behaviour. Table 5.7 summarises key average data gathered for this product group.
Table 5.7 - Use of water and energy and lifetime of taps and showers
Parameter Domestic Tap Non Domestic
Tap Domestic
Showerhead Non Domestic Showerhead
Lifetime (years) 16 10 10 7
Electricity consumption (kWh/year) (1)
536
(222-986)
2668 846
(350-1557)
834
Water consumption (m3/year) (1)
10.4
(4.30-19.14)
51.8 13.14
(5.43-24.18)
12.95
(1) Range reported within brackets
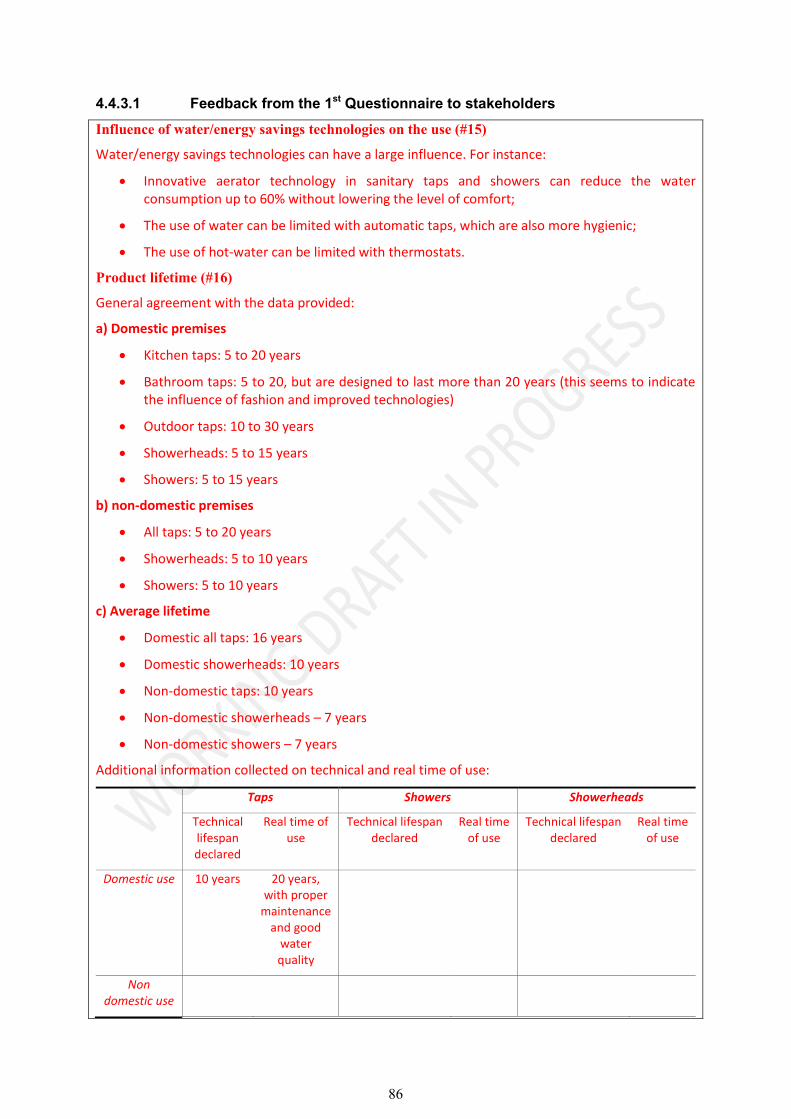
86
4.4.3.1 Feedback from the 1st Questionnaire to stakeholders
Influence of water/energy savings technologies on the use (#15)
Water/energy savings technologies can have a large influence. For instance:
Innovative aerator technology in sanitary taps and showers can reduce the water consumption up to 60% without lowering the level of comfort;
The use of water can be limited with automatic taps, which are also more hygienic;
The use of hot-water can be limited with thermostats.
Product lifetime (#16)
General agreement with the data provided:
a) Domestic premises
Kitchen taps: 5 to 20 years
Bathroom taps: 5 to 20, but are designed to last more than 20 years (this seems to indicate the influence of fashion and improved technologies)
Outdoor taps: 10 to 30 years
Showerheads: 5 to 15 years
Showers: 5 to 15 years
b) non-domestic premises
All taps: 5 to 20 years
Showerheads: 5 to 10 years
Showers: 5 to 10 years
c) Average lifetime
Domestic all taps: 16 years
Domestic showerheads: 10 years
Non-domestic taps: 10 years
Non-domestic showerheads – 7 years
Non-domestic showers – 7 years
Additional information collected on technical and real time of use:
Taps Showers Showerheads
Technical lifespan declared
Real time of use
Technical lifespan declared
Real time of use
Technical lifespan declared
Real time of use
Domestic use 10 years 20 years, with proper
maintenance and good
water quality
Non domestic use

87
Maintenance (#18)
Maintenance is product specific and it is simple for some products while more complicated for others. Consumer is not very interested in maintenance of the product, though this supports durability of the products.
Some additional examples have been reported:
Aerator cleaning is usually made by the user
Seals / Valve / Diverter / Thermostatic cartridge change is most likely done by the plumber
The industrial kitchen industry provides an engineering service that repairs taps and pre-rinse spray units as soon as products have a problem. The usual spare parts to repair are head works, cartridges, handles, spray guns, jet regulators, hoses, springs
Some producers provide spare parts for repairing but this possibility is not frequently mentioned in product labelling
Installation (#19)
Durability and maintenance vary from product to product. For instance:
In the non-domestic sector the product design is more focussed on the prevention of vandalism
For the industrial kitchen industry the place of installation and the cleaning cycles of the kitchens have a big influence on the durability. The place of installation could be close to a dishwashing machine i.e. impact of steam. The cleaning routines and the use of detergents or abrasive cleaning stuff has a big influence on the surface (chrome plating)
Moreover, it has been reported that parameters as temperature, hardness and velocity of water can have a great influence on the installation.
4.4.4 End-of-life practices Information on end-of-life is provided in the section dealing with user behaviour. Taps and showers are generally recycled, due to the value of their metal content. For what concern the disposal of plastic showerheads, it is considered that these are usually sent to landfill.
4.4.4.1 Feedback from the 1st Questionnaire to stakeholders
End-of-Life practices (#20, #21)
According to stakeholders, products are usually collected by installers and recycled. Indicatively, 90-95% of brass-based products are recycled.
Metals and alloys are extensively recycled via well-established, highly efficient and economically sound markets. There are few barriers to the recycling of stainless steel, copper and copper-based alloys from taps, showers and showerheads. This includes the recycling of nickel-containing stainless steels and copper alloys containing lead (Pb) and nickel.
The feasibility of recycling metals used in taps, showers and showerheads depends on their collection when used in domestic settings, where waste tends to be sent to municipal waste sites rather than to established commercial recycling facilities. However, in recent years, local authorities have introduced segregation of metals in domestic settings and at municipal waste sites, which should further enhance metal collection rates.

88
4.5 Conclusive recommendations for technologies An increasing number of water/energy-efficient taps and showers have been being manufactured so that a wide range of performance levels is offered to consumers. Minimum and maximum water flow rates could be defined. However, some other technical issues are to be considered together with the flow rate, such as the scalding risk, the different pressure of water supply systems and the level of acceptable performance for the end user.
In most of the cases, a reduction in water consumption can be achieved by installing flow regulators, which are largely applied by manufacturers in their product ranges. These are a cheap and flexible technology, easy to be installed and that offer possibilities of retrofitting. Considering also that their payback time is short, the regulation of the water flow seems to be technically feasible on a wide scale.
Apart from flow regulators, the number of water saving technologies on the market is increasing. These are often included in products in addition to a flow regulator and aim at controlling and/or addressing the end users behaviour (e.g. sensor and push taps, water brakes and ecobuttons). Some technologies as water brakes and ecobuttons allow for different flow positions.
Savings potential offered by water and energy technologies strongly depend on the user practices. However, based on life cycle costs considerations, products implementing this type of technologies appear more convenient than the conventional ones.
4.6 Next steps to complete discussion on technologies Technical product description (information on performance, price, resources/emissions impact)
Existing products Information to be revised based on the feedback received from stakeholders
Products with standard improvement (design) options
Best Available Technology BAT (best of products on the market)
Best Not yet Available Technology BNAT (best of products in field tests, labs, etc.)
Production, distribution and end-of-life
Product weight and Bills-of-Materials Information available, to be revised with support of stakeholders
Assessment of the primary scrap production during sheet metal manufacturing
Information not available, to be investigate with support of stakeholders and then included
Packaging materials Information available, to be revised with support of stakeholders to be investigate with support of stakeholders and then included
Volume and weight of the packaged product Information available, to be revised with support of stakeholders to be investigate with support of stakeholders and then included

89
Actual means of transport employed in shipment of components, sub-assemblies and finished products
Information not available, to be investigate with support of stakeholders to be investigate with support of stakeholders and then included
Materials flow, collection and treatment effort at end-of-life (secondary waste), to landfill/ incineration/ recycling/ re-use (industry perspective)
Information available, to be revised with support of stakeholders
Technical product life (time-to-failure of critical parts)
Information to be included based on the feedback received from stakeholders
Recommendations
Refinement of the product scope from a technical perspective (e.g. exclusion of special applications for niche markets)
Information to be included based on the feedback received from stakeholders
Barriers and opportunities for implementing product policy tools from a technical perspective
Information to be revised based on the feedback received from stakeholders
Typical design cycle for this product group Information to be included based on the feedback received from stakeholders

90
5 ENVIRONMENT AND ECONOMICS OF DESIGN OPTIONS
5.1 Identification of base cases and design options and summary of preliminary base of evidence
This section aims at identifying product options and scenarios for which it is relevant to perform an environmental end economic assessment based on the EcoReport Tool, as provided with the MEErP.
The assessment should consider:
a) Average and reference products already available on the market;
b) Alternative design options and scenarios of potential relevance;
c) Best available technologies for improving water/energy efficiency already available on the market;
d) Technologies for improving water/energy efficiency yet to be deployed on the market.
5.1.1 Selection of case studies Chrome-plated brass taps have been selected as reference case study being these the most common products on the market. Although their current market share is marginal, stainless steel taps are also considered another interesting option to assess because of their growing sales.
With respect to showers, showerheads made of metal and/or plastic are considered to design options worthy of evaluation.
Indications about the possible material composition for example products have been collected and reported in the previous section. However, it must be born in mind that some products can use other materials depending on their design or application.
With respect to the use, both domestic and non-domestic applications should be assessed for each base cases.
Based on the experience gathered during the development of the EU Ecolabel and GPP criteria for sanitary tapware119, the following product have been preliminary identified:
1. An example tap made of brass used in domestic applications in similarity with UK conditions;
2. An example tap made of brass used in non-domestic applications in similarity with UK conditions;
3. An example tap made of stainless steel used in domestic applications in similarity with UK conditions;
4. An example tap made of stainless steel used in non-domestic applications in similarity with UK conditions;
5. An example showerhead made of plastic used in domestic applications in similarity with UK conditions;
6. An example showerhead made of plastic used in non-domestic applications in similarity with UK conditions;
7. An example showerhead made of plastic and metals used in domestic applications in similarity with UK conditions;
119 http://susproc.jrc.ec.europa.eu/ecotapware/docs/Task%204_Report_Base_Case_Assessment%20Final_Sept.2011.pdf
91
8. An example showerhead made of plastic and metals used in non-domestic applications in similarity with UK conditions.
Base cases and scenarios for sensitivity analysis should be revised and extended to include in the assessment:
a) Average and reference product systems already available on the market;
b) Alternative design options and sensitivity analysis scenarios of potential relevance (e.g. consideration of different consumption figures for water and energy, analysis of different technologies, comparison between different geographical areas and alternative water energy systems, inclusion of indirect demands of energy within the product system).
This will require an additional effort to collect data of relevance for the analysis (e.g. Bill of Materials, water and energy consumption data, costs, life time).
5.1.2 Preliminary base of evidence The case studies identified above have been assessed to contribute forming a base of evidence for the development of EU Ecolabel and GPP criteria for sanitary tapware. The available analysis has been performed using the Ecoreport tool version provided with the MEEuP that has been recently updated with the MEErP.
Results for the evaluated case studies are reported in Annex III. Contribution of single lifecycle stages to the overall impacts of a brass domestic tap and of a plastic domestic showerhead are reported in Tables 5.1 and 5.2. It is important to remark that the assessment must be updated. This information is reported only to provide some indications about the preliminary outcomes obtained in the EU Ecolabel and GPP framework.

92
Table 5.1 – Contribution of single lifecycle stages within different impact categories for a brass domestic sector tap
Parameter Units Production Distribution Use End of Life Total
% of total % of total % of total % of total % of total
Total Energy (GER) MJ 0.06% 0.07% 99.86% 0.01% 100.00%
of which, electricity (in primary MJ)
MJ 0.01% 0.00% 99.99% 0.00% 100.00%
Water (process) ltr 0.00% 0.00% 100.00% 0.00% 100.00%
Water (cooling) ltr 0.01% 0.00% 99.99% 0.00% 100.00%
Waste, non-haz./ landfill
g 2.79% 0.05% 97.09% 0.07% 100.00%
Waste, hazardous/ incinerated
g 0.05% 0.05% 96.96% 2.90% 100.00%
Emissions (Air)
Greenhouse Gases in GWP100
kg CO2 eq. 0.08% 0.13% 99.80% 0.00% 100.00%
Ozone Depletion, emissions
mg R-11 eq. neg
Acidification, emissions
g SO2 eq. 0.16% 0.06% 99.78% 0.00% 100.00%
Volatile Organic Compounds (VOC)
g 0.00% 0.00% 100.00% 0.00% 100.00%
Persistent Organic Pollutants (POP)
ng i-Teq 5.74% 0.00% 94.26% 0.00% 100.00%
Heavy Metals mg Ni eq. 5.37% 0.18% 94.33% 0.12% 100.00%
PAHs Mg Ni eq. 1.63% 1.63% 96.20% 0.00% 100.00%
Particulate Matter (PM, dust)
g 0.37% 5.75% 91.84% 2.04% 100.00%
Emissions (Water)
Heavy Metals mg Hg/20 1.36% 0.00% 98.64% 0.17% 100.00%
Eutrophication g PO4 0.00% 0.00% 100.00% 0.00% 100.00%
Persistent Organic Pollutants (POP)
ng i-Teq neg
NB Values have been rounded to whole numbers, and percentages to two decimal places. Therefore the values in each life cycle phase may not appear to add up to the total value, and small percentages may appear as 0.00%.
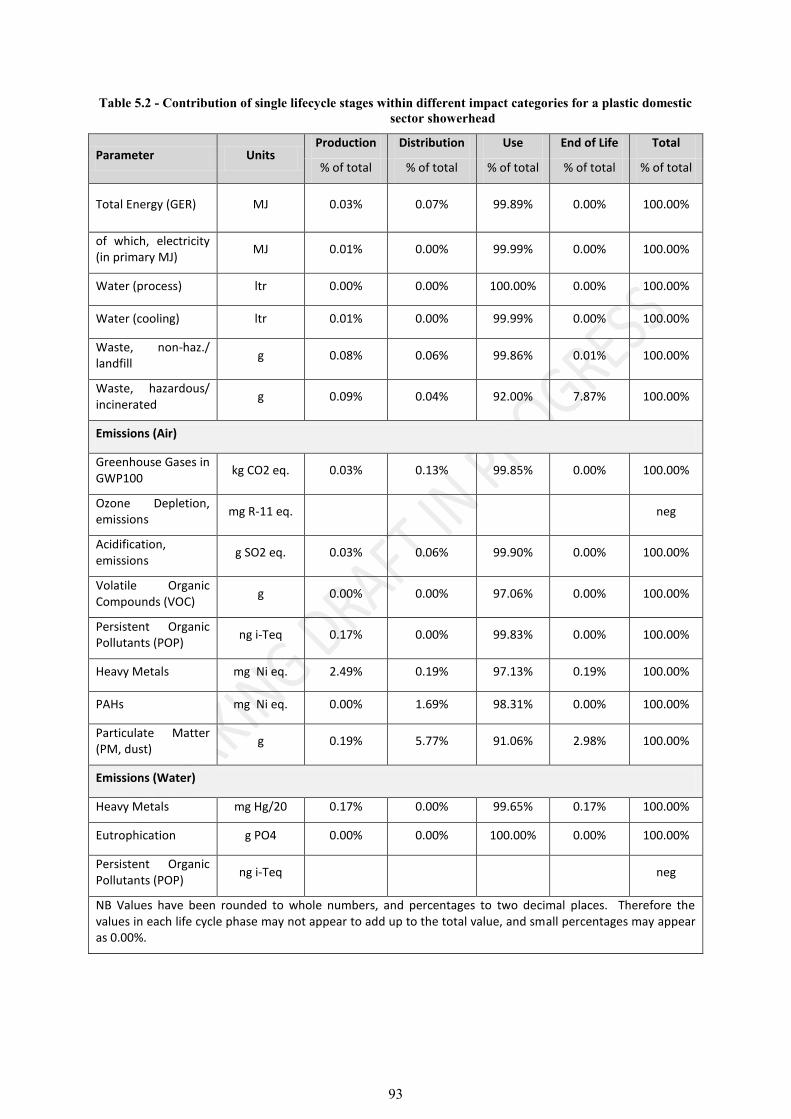
93
Table 5.2 - Contribution of single lifecycle stages within different impact categories for a plastic domestic sector showerhead
Parameter Units Production Distribution Use End of Life Total
% of total % of total % of total % of total % of total
Total Energy (GER) MJ 0.03% 0.07% 99.89% 0.00% 100.00%
of which, electricity (in primary MJ)
MJ 0.01% 0.00% 99.99% 0.00% 100.00%
Water (process) ltr 0.00% 0.00% 100.00% 0.00% 100.00%
Water (cooling) ltr 0.01% 0.00% 99.99% 0.00% 100.00%
Waste, non-haz./ landfill
g 0.08% 0.06% 99.86% 0.01% 100.00%
Waste, hazardous/ incinerated
g 0.09% 0.04% 92.00% 7.87% 100.00%
Emissions (Air)
Greenhouse Gases in GWP100
kg CO2 eq. 0.03% 0.13% 99.85% 0.00% 100.00%
Ozone Depletion, emissions
mg R-11 eq. neg
Acidification, emissions
g SO2 eq. 0.03% 0.06% 99.90% 0.00% 100.00%
Volatile Organic Compounds (VOC)
g 0.00% 0.00% 97.06% 0.00% 100.00%
Persistent Organic Pollutants (POP)
ng i-Teq 0.17% 0.00% 99.83% 0.00% 100.00%
Heavy Metals mg Ni eq. 2.49% 0.19% 97.13% 0.19% 100.00%
PAHs mg Ni eq. 0.00% 1.69% 98.31% 0.00% 100.00%
Particulate Matter (PM, dust)
g 0.19% 5.77% 91.06% 2.98% 100.00%
Emissions (Water)
Heavy Metals mg Hg/20 0.17% 0.00% 99.65% 0.17% 100.00%
Eutrophication g PO4 0.00% 0.00% 100.00% 0.00% 100.00%
Persistent Organic Pollutants (POP)
ng i-Teq neg
NB Values have been rounded to whole numbers, and percentages to two decimal places. Therefore the values in each life cycle phase may not appear to add up to the total value, and small percentages may appear as 0.00%.

94
The base of evidence currently available suggests that use-phase is the environmental hot-spot of for all the case studies evaluated. Water and energy consumption associated with use phase are in fact the main contributor for all the impact categories considered in the Ecoreport tool version provided with the MEEuP.
Based on this observation, these can be considered the key parameters to play with in order to estimate a range of variation of the impacts across the EU depending on different technologies and user practices. The preliminary analysis indicates that, with the exception of water consumption, magnitude of energy could be up to 90-100% for all the impact categories.
Aside from user behaviour and technical aspects, there are other parameters that could have a potential influence on the life cycle impacts of taps and showers, for example boiler types and efficiency and product lifetime, weight and composition.
A preliminary life cycle cost assessment is also available that shows the importance of considering costs associated with water and energy consumption in addition to the initial product purchase price.
The assessment shows that just by reducing water consumption it could be possible to save from 244 to 1193 € per product over its lifetime. Additional cost saving can be pursued with reductions in energy consumption. This indicates that purchasing strategies should be aimed at minimising lifecycle costs on a case by case basis.
Even if variable for each product, repair and maintenance costs are likely to be relatively low in the overall life cycle costs as the level of repair required is generally minimal. The same can be said for installation costs, where the case.
5.1.3 Feedback from the 1st Questionnaire to stakeholders Relevance of the case studies (#23)
Case studies are generally considered relevant. However, it must be remarked that these are examples and there is a chance that they do not accurately represent all the products counting for a significant share of that market (e.g. pillar taps are the dominant product type in some markets).
Identification of additional product/scenarios to analyse (#24)
The list of products worthy of consideration for the environmental and economic analysis at the moment include: Taps made of Plastics and Brass.
5.2 Next steps to complete the environmental and economic analysis
Definition of base cases and design/scenarios options
Identification of base cases and on design/scenarios options
To be performed with the support of stakeholders
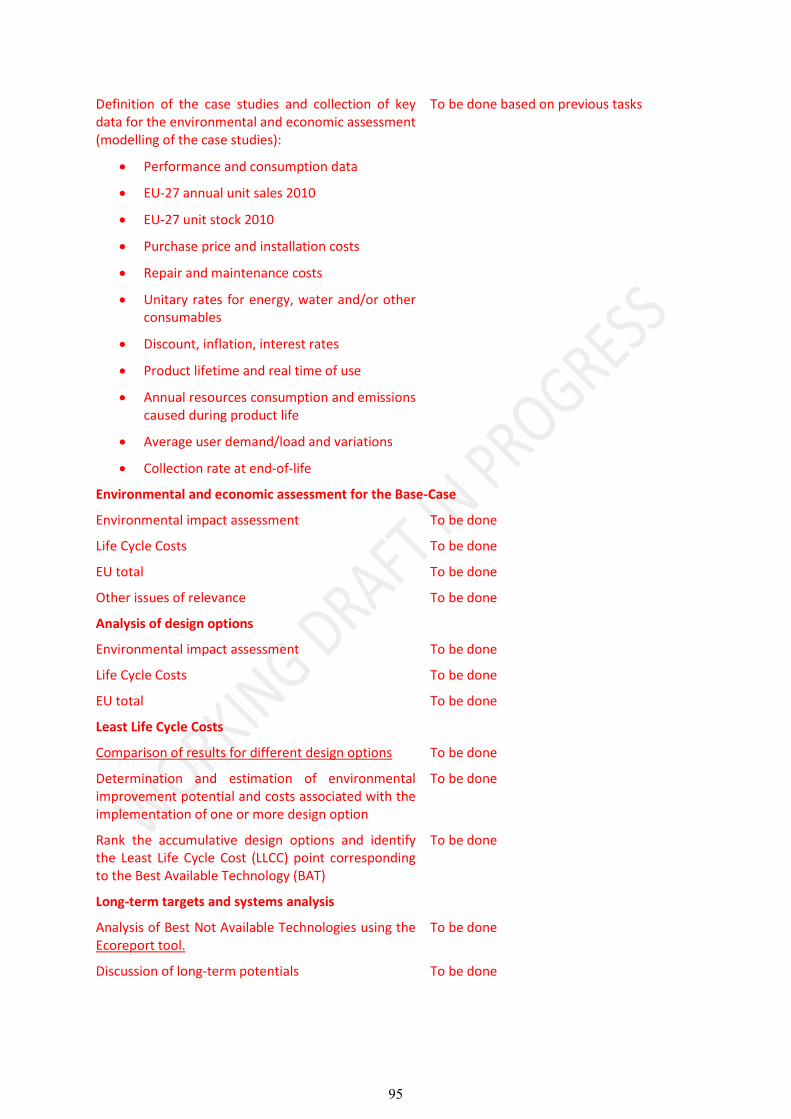
95
Definition of the case studies and collection of key data for the environmental and economic assessment (modelling of the case studies):
Performance and consumption data
EU-27 annual unit sales 2010
EU-27 unit stock 2010
Purchase price and installation costs
Repair and maintenance costs
Unitary rates for energy, water and/or other consumables
Discount, inflation, interest rates
Product lifetime and real time of use
Annual resources consumption and emissions caused during product life
Average user demand/load and variations
Collection rate at end-of-life
To be done based on previous tasks
Environmental and economic assessment for the Base-Case
Environmental impact assessment To be done
Life Cycle Costs To be done
EU total To be done
Other issues of relevance To be done
Analysis of design options
Environmental impact assessment To be done
Life Cycle Costs To be done
EU total To be done
Least Life Cycle Costs
Comparison of results for different design options To be done
Determination and estimation of environmental improvement potential and costs associated with the implementation of one or more design option
To be done
Rank the accumulative design options and identify the Least Life Cycle Cost (LLCC) point corresponding to the Best Available Technology (BAT)
To be done
Long-term targets and systems analysis
Analysis of Best Not Available Technologies using the Ecoreport tool.
To be done
Discussion of long-term potentials To be done

96
This document has been prepared to serve as input for the first "Kick off" meeting of a preparatory study on taps and showers to be developed according to the MEErP.
This study will build on existing knowledge as far as possible. However, additional and complementary investigation is required to achieve the goals of the study.
With this respect, the present report summarises the background information so far gathered:
during the development of the EU Ecolabel and GPP criteria for sanitary tapware and
through the consultation of stakeholders with the 1st questionnaire.
Moreover, areas which need to be revised, updated and integrated to reflect the current state of play and to align with the MEErP methodology are also identified.
Experts are welcome to provide their comments at [email protected] in order in order to validate, revise and integrate the material presented. Additional questionnaires will also be sent in the coming weeks to fill any gaps of information needed to complete the study.
Once the necessary data has been collected, this background document will be enlarged to address all sections prescribed in MEErP.
CONCLUSIONS

97

98
As the Commission’s in-house science service, the Joint Research Centre’s mission is to provide
EU policies with independent, evidence-based scientific and technical support throughout the
whole policy cycle.
Working in close cooperation with policy Directorates-General, the JRC addresses key societal
challenges while stimulating innovation through developing new standards, methods and tools,
and sharing and transferring its know-how to the Member States and international community.
Key policy areas include: environment and climate change; energy and transport; agriculture
and food security; health and consumer protection; information society and digital agenda;
safety and security including nuclear; all supported through a cross-cutting and multi-
disciplinary approach.