developing an interpretable schizophrenia deep learning
TRANSCRIPT

Developing an Interpretable Schizophrenia DeepLearning Classifier on fMRI and sMRI using a
Patient-Centered DeepSHAP
Jacob ReiterDepartment of Computer Science
Stanford UniversityCS 335 - FAccT Deep Learning
Abstract
This paper aims to explore the applications of interpretable methods to the taskof schizophrenia classification. We use the Mind Research Network’s data whichconsists of functional network connectivity values (FNC) and source-based mor-phometry (SBM) loadings. These features are derived from fMRI and sMRI, re-spectively. We design a deep neural network for the classification task and achievehigh AUC for the literature. Then, we explore various iterations of DeepSHAP,a form of SHapley Additive exPlanations or estimations of Shapley values, asour interpretable method. We find that Standard DeepSHAP is a successful toolfor schizophrenia interpretability. However, we note that a Label-ConsolidatedDeepSHAP more accurately portrays collective feature importance for FNC values.Lastly, we conduct initial needfinding for a Patient-Centered DeepSHAP concept;from a human-centered perspective, we explore a patient experience with ourDeepSHAP results.
1 IntroductionFor most modern day psychiatric disorders, physicians are left to subjective measures in orderto diagnose patients. With no blood test for mental illness, psychiatrists look to the Diagnosticand Statistical Manual of Mental Disorders (DSM) in order to make a diagnosis. Yet, even therequirements laid out by the DSM have been critiqued as arbitrary in nature and continue in a relianceon subjective reporting from the patient.
Achieving a correct diagnosis is critical, as it indicates the optimal treatment for a patient. Thisproblem is even more apparent for those suffering from psychosis, delusions, and hallucinations.Schizophrenia, schizoaffective disorder, delusional disorder, schizotypal disorder, and schizophreni-form disorder all fall within the family of schizophrenia spectrum disorders. However, psychosismight often be an indication of bipolar disorder with psychotic features; the same is seen with majordepressive disorder. These minute, but critical distinctions, often leave psychiatrists guessing for acorrect diagnosis. The dangers of prescribing a patient mood stabilizers when anti-psychotics are ac-tually necessary are great: the side effects of anti-psychotics can be debilitating and mood stabilizerswould not provide the preventative measures for an impending fully developed schizophrenia. Theconverse is also true, however, almost half of patients diagnosed within the family of schizophreniaspectrum disorders do not actually have any [1]. Thus, it is critical to develop new methods ofaccurately diagnosing schizophrenia in patients.
Even more so, for such a technology to exist, it is critical that physicians can make use of thepredictions given. Current research in the literature for schizophrenia classification is rooted in
32nd Conference on Neural Information Processing Systems (NeurIPS 2018), Montréal, Canada.

black-box models that fail to provide transparency for physicians. Physicians should be able to seefrom where decisions are derived, and choose how to use that information in combination with theirown examination and training. We also will explore how psychiatrists view this topic, and considerhow these same questions arise for patients.
It is in this way that I argue developing a transparent, interpretable, and explainable model fordiagnosing schizophrenia is of importance. This paper will employ a deep learning neural networkfor the schizophrenia classification task. DeepSHAP will be explored as the interpretable method.Modifications to DeepSHAP will be considered in order to meet physician and patient needs througha human-computer interaction lens.
2 Data
This research makes use of the Mind Research Network’s publicly available data through the IEEEInternational Workshop on Machine Learning for Signal Processing. The data was released to thepublic in 2014, and centers on both functional magnetic resonance imaging (fMRI) and structuralmagnetic resonance imaging (sMRI).
The data concerns 144 patients, 69 received diagnoses of schizophrenia. The data has been pre-processed into functional network connectivity (FNC) maps and features, as well as source-basedmorphometry (SBM) loadings and maps. FNC values and SBM loadings derive from fMRI andsMRI, respectively.
FNC values are a type of functional modality feature, and indicate correlation between brain mapsover time. SBM loadings are built upon voxel-based morphometry (VBM), and use independentcomponent analysis to identify groupings. SBM can be understood as a method of measuring graymatter in the brain.
Below is an example of the Mind Research Networks’ fMRI cross-sectional brain map.
Figure 1: Cross-sectional fMRI brain map.
The 32 SBM loading features are derived from the 32 cross-sectional sMRI maps. The 378 FNCvalues, which represent brain map correlation, correspond to each pairwise combination of the 28cross-sectional fMRI maps.
Research now posits that "FNC in schizophrenia patients shows less hemispheric asymmetry com-pared to that of the healthy controls" [2]. In addition, studies have also shown that SBM can indicatepresence of schizophrenia [3], as gray matter presence can largely be understood as brain operatingpower in correlated regions of the brain.
This is also a High Dimensional Low Sample Size (HDLSS) dataset, in which there are minimalsubjects, but a large number of features. This informs design decisions for the deep learning modelpresented.
2

3 Related Work
The data this paper considers has been tackled in some other notable works. Two Finland researchersat Aalto University have produced the best results thus far using Gaussian process classification [4],where one considers observations as coming from Bernoulli distributions. Additionally, a team ofdoctoral researchers in India published in the Journal of Applied Science and Computations explainthat they used a Random Forest classifier and stayed away from deep learning approaches [5].
Other approaches include that from Karolis Koncevicius of Lithuania’s Vilnius University in whichhe used distance weighted discrimination to achieve a high AUC score [6].
Almost every paper cited avoids the usage of a deep learning model and explores some other method.Of all the published studies explaining approaches to solving this schizophrenia classification problem,only one makes notable mention of using neural networks or deep learning. Kamini Jodha’s research[7] shows his exploration of only a maximum of 3 hidden layers in a schizophrenia classification task,however he does not dive deeper in optimization. Other research not using the MRI data discussedthus far has shown that deep learning models for the diagnosis of schizophrenia can be very promising.For example, work published in the Schizophrenia Research Journal explores the application of deeplearning to EEG features and data [8].
No research thus far in the literature has aimed to make these schizophrenia classifiers interpretable,transparent, or explainable. None consider the specific needs of patient and physician.
4 Approach
4.1 Pre-Processing and Environment
A significant consideration for our research is the problem of a High Dimensional Low SampleSize dataset. Several approaches are considered in this paper, firstly we explore a simple training,validation, and test set split. Alternatively, we explore a K-fold cross validation method, in whichmore of the training and validation data can be used.
Data across FNC and SBM loadings are consolidated by subject for training, and errors and missingvalues are cleaned in pre-processing. Data manipulation is done in NumPy and pandas.
This research is conducted with use of Google Cloud Platform’s Compute Engine, using a VMinstance with one NVIDIA Tesla K80 GPU with a virtual environment.
4.2 Baselines
4.2.1 Interpretability Baseline
For interpretability, the true baseline that we use is the finalized deep neural network prior to anyinterpretable methods being appended or added. These set a clear expectation for the current baselineinterpretability that exists for deep learning models.
To continue, we as well develop baselines for the deep neural network.
4.2.2 DNN Baseline
While the focus of this paper is to explore and develop an interpretable schizophrenia classifier, it iscritical to ensure that the classification itself is accurate and successful. Thus, a significant portion ofthis paper is devoted to developing a deep neural network on which we will apply an interpretablemethod. The primary metric for development is accuracy, but additional metrics are considered. Formedical predictions, minimizing false negatives and false positives is of utmost importance.
For the deep neural network, we chose to develop with Keras and TensorFlow. We create a simplemodel with only two dense layers. First, we split the data on a 0.8 to 0.2 training to validation split.Data is sliced into TensorFlow batches of size 16.
This baseline model has one dense layer of 128 units, followed by a prediction dense layer withsigmoid activation. The starting learning rate is a simple and constant 0.3, binary cross entropy loss,
3
and accuracy as a metric. There are 48,641 trainable parameters. We achieved a validation accuracyof 0.7059 after 15 epochs.
When running this model on the actual test data that is hidden by the data owners, all that can be seenis the area under the ROC curve score, for which this very simple model gets an AUC of 0.62053.
4.3 DNN Final Implementation
Further network architecture research was conducted on the deep neural network.
Firstly, we adjust several components of the data pre-processing, including shifting the labels from 0and 1 to a centered -0.5 and 0.5. Additionally, we coalesce the FNC and SBM features.
Secondly, we now use 4 dense layers. Beginning with 128 units, followed by two 256 unit layers, anda final prediction dense layer with sigmoid activation.
Thirdly, we continue with our usage of an Adam optimizer, but lower our learning rate to 0.001.
4.4 DeepSHAP
4.4.1 Standard DeepSHAP
In making the model transparent, we apply the model-agnostic method of DeepSHAP to the deepneural network
DeepSHAP is a form of SHapley Additive exPlanations (SHAP)– estimations of Shapley values.Shapley values are rooted in coalition game theory, in which the Shapley value of each feature is theaverage of its contributions to every possible combination of features– or "coalitions" [9].
When we deal specifically with HDLSS datasets, exploring every possible feature combination is toocomputationally costly, and thus DeepSHAP is a powerful tool to estimate Shapley values in deeplearning models. We are able to keep the computational power and accurate results of deep learningmodels, while keeping the interpretative power of Shapley values.
For SHAP estimations, we can represent Shapley values as additive feature attribution methods. ForSHAP, we represent the "coalition vector" z′ through the explanation model g as:
g(z′) = φ0 +
M∑j=1
φjz′j
Here, we take the sum from feature j = 1 to the maximum coalition size, M , of the feature attributionfor j, φj , multiplied by the coalition vector of j, z′j .
The "coalition vector" z′ ∈ {0, 1}M . Each feature represented in the coalition vector can either be"present" or "absent" in the combination of features, represented as either 1 or 0 [9].
4.4.2 Label-Consolidated DeepSHAP
As explained in the data section, this paper makes use of a HDLSS dataset. This informs not onlythe design of the neural network, but also of the interpretability experience. Even in the usage ofstandard DeepSHAP, a user may very well be overwhelmed by the possibility of over 400 features.Additionally, the feature space of FNC is exponentially greater than that of SBM given that the verynature of FNC is to represent the pairwise combination of the 28 cross-sectional fMRI maps.
Due to these conditions, we reverse the labels of the FNC features to correspond again to the FNCmaps. For example, we would convert the feature label of "FNC_322" to a label of "FNC_12->29",representing the feature that shows the correlation between cross-sectional fMRI maps 12 and 29.
In addition, we then explore consolidating the FNC labels for each of the fMRI maps, as well as thecorresponding Shapley values. For example, all features that involve cross-sectional fMRI map 12,will be consolidated into a feature of "FNCMerged_12".
For simplicity, we choose to take the mean of the feature values for the merged value, however, wetake the sum of Shapley values to preserve the combined influence. We considered taking the sum of
4

the absolute values of the Shapley values, yet decided that the influence depicted in the force plots ismore adequately represented as the sum of signed influences.
4.4.3 Patient-Centered DeepSHAP
Any discussion of interpretability is void without considering the perceptions of those who will haveto interpret and make use of the technology in the real world. We began initial needfinding, andconducted a user interview with a Stanford University psychiatrist. The goal of this user interviewwas to perform some amount of needfinding.
There are several key findings that informed a third iteration of our interpretable model, this onecentering more on melding the deep learning model combined with DeepSHAP with user experienceand human-computer interaction.
We found verification in the need for a correct diagnosis, and subsequently the correct treatment andmedication. However, we were surprised to discover that interpretability for the patient seemed almostmore important than interpretability for the physician. Often, initial psychotic episodes and symptomsmay be indicative of a severe psychosis and schizophrenia to come. Prescribing anti-psychotics earlycan drastically improve the prognosis for patients, slowing and even perhaps preventing full-blownpsychosis and schizophrenia. However, we find that a key struggle was in convincing patients to takea medication with severe side-effects for a disease that may or may not develop. Providing patientswith transparent information will help inform their own choices to engage with treatment.
There are several key methods found in our user interview for improving transparency for patientsthat would mimic key techniques already employed by psychiatrists. Firstly, we focus on providingadditional context through comparison against other patient predictions (while ensuring privacy).Secondly, we develop routine methods for explanations, as if a psychiatrist was explaining the veryprediction model. Lastly, we provide methods of further exploration and detail to inform decisionmaking.
5 Results
5.1 DNN Results
In order to make an interpretable model, we wanted to ensure that we had a successful model to buildupon. On our final 4 dense layered network, we were able to achieve a validation accuracy of 0.8235.On the test data, our model receives an AUC of 0.81282.
5.2 DeepSHAP Results
5.2.1 Standard DeepSHAP Results
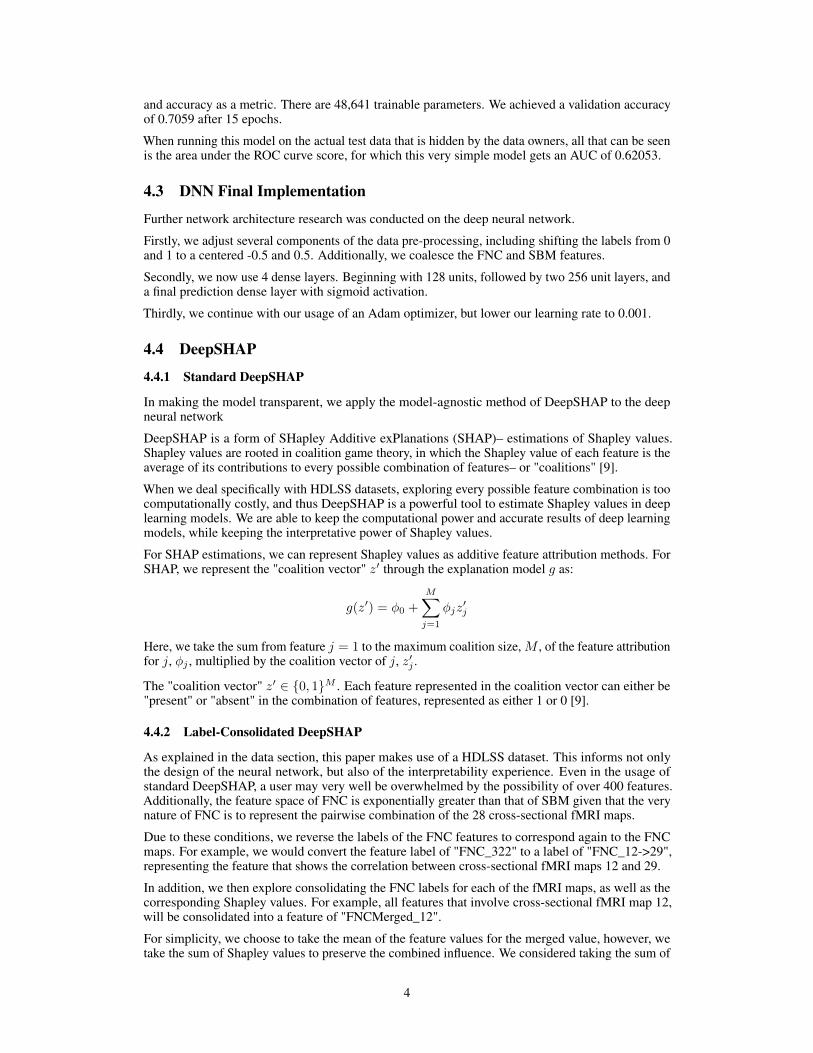
We manage to produce various interpretable results through the Standard DeepSHAP packages.Firstly, as seen in Figure 2, we produce a graph of stacked SHAP force plots. On the x-axis areindividual data instances, or individual patients. The y-axis shows the model’s prediction output.Each slice of blue depicts an individual feature’s corresponding Shapley value. Blue marks featuresthat decreased the model’s prediction, while red features increased the model’s prediction. Where thetwo meet is the final prediction for that user. In Figure 2, the users are clustered by similarity.
We can sort by model output, as is shown in Figure 3. In this example, we show that in interactiveversions of this tool, hovering on a specific user depicts the feature names and their correspondingvalues which contributed to the model’s prediction. In bold, we see we are evaluating the index 15which has predicted value of 0.9549.
5
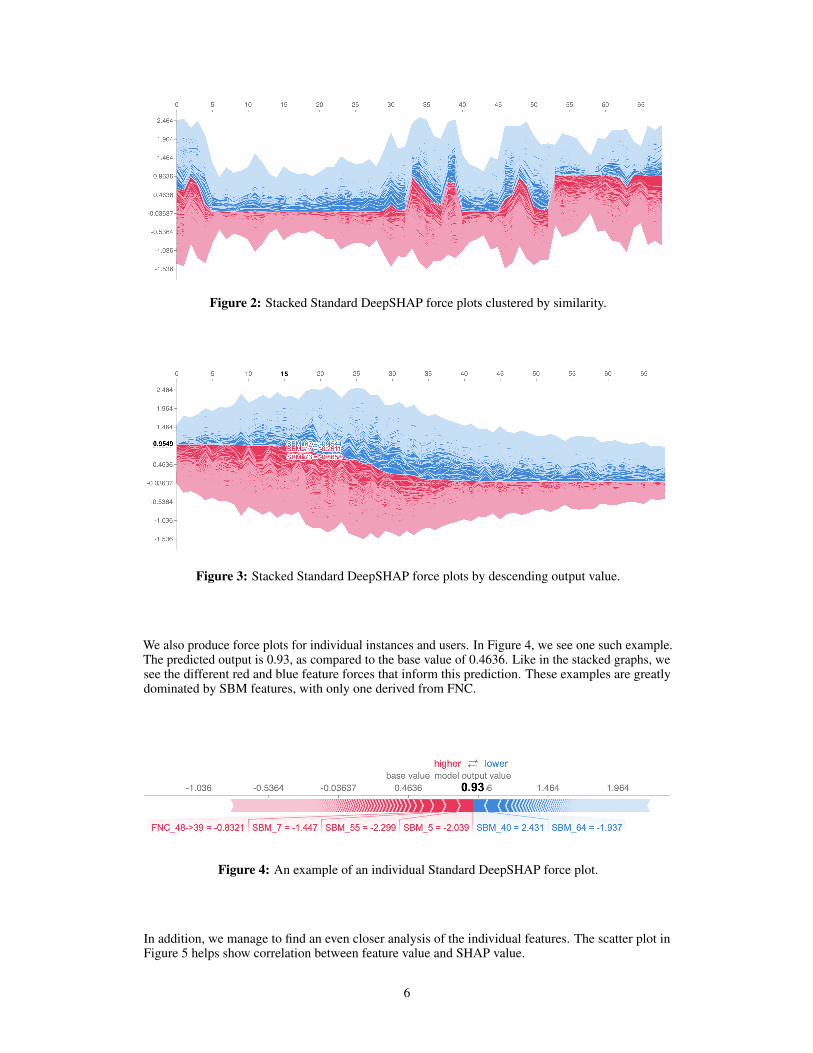
Figure 2: Stacked Standard DeepSHAP force plots clustered by similarity.
Figure 3: Stacked Standard DeepSHAP force plots by descending output value.
We also produce force plots for individual instances and users. In Figure 4, we see one such example.The predicted output is 0.93, as compared to the base value of 0.4636. Like in the stacked graphs, wesee the different red and blue feature forces that inform this prediction. These examples are greatlydominated by SBM features, with only one derived from FNC.
Figure 4: An example of an individual Standard DeepSHAP force plot.
In addition, we manage to find an even closer analysis of the individual features. The scatter plot inFigure 5 helps show correlation between feature value and SHAP value.
6

Figure 5: Scatter plot showing correlation between feature value and Standard DeepSHAP values.
5.2.2 Label-Consolidated DeepSHAP Results
The most critical distinction discovered through our Label-Consolidated DeepSHAP is the effecton the highest ranking features by mean(|SHAP value|). This can be understood as depicting whatfeatures held the most impact on the model’s output. In Figure 6, we can see the difference in bargraph representation between the Standard and Label-Consolidated DeepSHAP models.
Figure 6: Bar graph comparison between Standard and Label-Consolidated DeepSHAPfeature importance, ranked by mean(|SHAP value|).
We can see that consolidating FNC features by their individual map reveals that the collective impactfrom FNC values is actually significant to the model. We can see this same impact in the force plotsfor individual instances and users. In Figure 7, we provide one such example. The predicted output is
7

0.35, below the base value of 0.4636. FNCMerged features completely dominate both the positiveand negative forces that make up the final prediction.
Figure 7: An example of an individual Label-Consolidated DeepSHAP force plot.
5.2.3 Patient-Centered DeepSHAP Results
The results of this section are largely exploratory and preliminary. As will be discussed, theseconcepts must be tested and used by actual patients, not solely psychiatrists as was done in this paper.
In line with our needfinding, we first hoped to mimic the technique already employed by psychiatristsof providing context to the patient about the realistic status of their condition. We find that makinguse of the stacked DeepSHAP force plots in descending output value is very interpretable to patients.This concept can be seen in Figure 8. The stacked force plot helps visually show the patient how theirprediction compares to others. We avoid classic violations of Jakob Nielsen’s Usability Heuristicsby converting language of the Standard DeepSHAP into more digestible language. We give the usercontrol and freedom to explore through interactive buttons for deeper exploration.
Figure 8: Patient-Centered DeepSHAP concept with stacked force plot.
Through user exploration of the "view detailed prediction" button, we make use of the Label-Consolidated DeepSHAP force plot. This concept can be seen in Figure 9. We believe the Label-Consolidated view adds a level of abstraction that is helpful in reducing complexity. Again, we aimto reduce possibility of errors through helpful guidance, as well as provide clarity through languageand rhetoric.
While we hope to reduce complexity, there remains an importance to provide the patient with theability to get as detailed into the prediction explanation as they choose. Thus, users can look at anindividual feature and learn more about its derivation. In the example shown in Figure 9, the userchooses to look at the specific feature SBM_17. A pop-up provides added explanation and also showsthe specific cross-sectional map that corresponds with SBM_17. We found in our needfinding thatthere was a specific desire to see brain maps as a source of scientific ethos. Concepts marked in redare interactable and can provide further explanation for the user.
8

Figure 9: Patient-Centered DeepSHAP concept with individual force plot,with detail pop-up on specific feature SBM_17.
Figure 10: Close view of detail pop-up on specific feature SBM_17.
6 Discussion
To begin, we believe it is important to discuss the distinctive results across Standard and Label-Consolidated DeepSHAP. It is clear that Standard DeepSHAP shows SBM values as dominatingthe output prediction. At first glance, the interpretation of the Standard DeepSHAP would be thatSBM loadings are more important than FNC to the classification of schizophrenia. However, ourLabel-Consolidated DeepSHAP shows this is incorrect. The very fact that there are exponentiallymore FNC values than there are SBM loadings dilutes the importance of each individual FNCvalue. Consolidating the FNC values shows that they are indeed critical to the classification ofschizophrenia. This conclusion lines up with previous work demonstrating the connection betweenFNC and schizophrenia.
9

However, the Label-Consolidated DeepSHAP is not error free. The individual merged FNC valuesdo not overcount, however the many merged FNC values together do. This is due to the fact that anFNC value corresponding to the correlation between maps 12 and 17 is incorporated into the mergedFNC values of both 12 and 17. This is an important benefit to using Standard DeepSHAP.
We also find several unique discoveries worth discussing from the stacked force plots. We noticethat the model particularly likes making binary choices, this is because it is of course trained onbinary inputs. However, one can see that the times where the model does not make a binary choice,and instead falls in the middle, the width of the stacked graph is greatest. What this intuitively tellsus, is that there is comparatively a greater number of both positive and negative factors to otherindividual instances. Because of this, the model can essentially not make up its mind, and chooses tofall somewhere in the middle.
We also note from our individual force plots that our base value is highly skewed. This is due tothe data pre-processing methods employed that ensured a more even split of schizophrenia andneurotypical patients. In real world implementations, the significantly lower true base value will onlyemphasize the value of high predictions.
The scatter plot also unveils unique discoveries in the research of schizophrenia classification. Againin line with other research predicting a connection between gray matter and schizophrenia, we seesimilar evidence in Figure 5. What we find uniquely novel is that for some cross-sectional brain maps,low amounts of gray matter had high SHAP values, or increased the model’s prediction. However,for other cross-sectional brain maps, high amounts of gray matter also had high SHAP values andincreased the model’s prediction. The literature highly suggests that low amounts of gray matter isassociated with schizophrenia, however our research depicts that it perhaps is a combination of bothlow and high amounts of gray matter at different cross-sectional maps.
Lastly, we do see Patient-Centered DeepSHAP as an impactful and exciting concept for the future ofhuman-centered artificial intelligence. Our needfinding revealed a unique importance in providingpatients with an explainable experience to inform their decision to engage with treatment and pursueanti-psychotic medication. This topic should be the focus of further work, as only psychiatrists andphysicians were consulted in needfinding.
7 Conclusion
This paper demonstrates not only the growing need for more robust technologies in the worldof psychiatry, but that in these developments there remains a commitment to ensuring fairness,accountability, and transparency. We find that DeepSHAP serves as a powerful tool in making adeep neural network classifier for schizophrenia interpretable. However, it also becomes clear thatadditional modifications enhance the transparency of DeepSHAP. Consolidating and modifying theSBM loadings and FNC values derived from fMRI and sMRI substantially influence the results ofDeepSHAP. Additionally, we see the importance of a human-centered approach to this interpretablemodel. Needfinding with psychiatrists and physicians revealed the real world needs of interpretabilityfor patients and illuminate the need for further user research.
10

References[1] Coulter, Chelsey, Baker, Krista K., Margolis, Russell L. Specialized Consultation for Suspected Recent-onsetSchizophrenia Diagnostic Clarity and the Distorting Impact of Anxiety and Reported Auditory Hallucinations.Journal of Psychiatric Practice, 2019 DOI: 10.1097/PRA.0000000000000363
[2] Agcaoglu O, Miller R, Damaraju E, et al. Decreased hemispheric connectivity and decreased intra- and inter-hemisphere asymmetry of resting state functional network connectivity in schizophrenia. Brain Imaging andBehavior. 2018 Jun;12(3):615-630. DOI: 10.1007/s11682-017-9718-7.
[3] Xu, L., Groth, K. M., Pearlson, G., Schretlen, D. J., Calhoun, V. D. (2009). Source-based morphometry: theuse of independent component analysis to identify gray matter differences with application to schizophrenia.Human brain mapping, 30(3), 711–724. https://doi.org/10.1002/hbm.20540
[4] Solin, A., Sarkka, S. (n.d.). Mlsp 2014 Schizophrenia Classification Challenge: Winning Model Documenta-tion . Aalto University.
[5] Bombade, B., Hanwate, A., Jadhav, S. (n.d.). Diagnose Schizophrenia through Ginni-Index along WithRandom Forest Classification on Multi-Modal Brain Magnetic Resonance Imaging.
[6] Karolis Koncevicius, K. K. (n.d.). MLSP 2014 Schizophrenia Classification Challenge: 3rd Position.Retrieved from https://github.com/KKPMW/Kaggle-MLSP-Schizo-3rd
[7] Jodha, K. (n.d.). Retrieved from http://homepages.cae.wisc.edu/ ece539/project/f17/Jodharpt.pdf
[8] Shim, M., Hwang, H.-J., Kim, D.-W., Lee, S.-H., Im, C.-H. (2016). Machine-learning-based diagnosis ofschizophrenia using combined sensor-level and source-level EEG features. Schizophrenia Research, 176(2-3),314–319. doi: 10.1016/j.schres.2016.05.007
[9] Molnar, Christoph. "Interpretable machine learning. A Guide for Making Black Box Models Explainable",2019. https://christophm.github.io/interpretable-ml-book/.
11