developing and evaluating esu-wide scenarios for … · web viewexample of the interaction of the...
TRANSCRIPT

Integrated Recovery Planning for Listed Salmon:Technical Guidance for Watershed Groups in Puget Sound
Puget Sound Technical Recovery Team and Shared Strategy Staff GroupDraft February 3, 2003
Puget Sound Technical Recovery Team Members
M. Ruckelshaus (Chair), National Marine Fisheries Service; K. Currens, Northwest Indian Fisheries Commission; R. Fuerstenberg, King County; W. Graeber, Washington Department of Natural Resources; K. Rawson, Tulalip Tribes; N. Sands, National Marine Fisheries Service; J.
Scott, Washington Department of Fish and Wildlife
Shared Strategy Staff Group
This draft document developed by the Puget Sound Technical Recovery Team and the Shared Strategy work group describes the biological content of a recovery plan directed to ultimately fulfill obligations of the Endangered Species Act (ESA) and address broader recovery goals. Although many topics we discuss can be found in other documents, we felt it was important to:
1) identify the concepts of a viable salmonid population (VSP) as the basic building block of a recovery plan;
2) provide a series of technical questions that link VSP to each Shared Strategy Step;
3) promote an integrated analysis of habitat, harvest and hatchery actions that assesses their cumulative effects and interactions;
4) stress the importance of considering both instream habitat conditions and landscape processes when addressing the effects of habitat on salmon;
5) illustrate the steps in plan development with examples from existing tools and applications;
6) discuss criteria that can be used to evaluate the certainty of the results predicted by the plan.
The Puget Sound Technical Recovery Team is using the watershed guidance document as our "bible" for conducting our case study in the Snohomish watershed. We plan to address the Shared Strategy's "Step 3" questions through the course of the case study, eventually including the integrative "H" questions.
We would appreciate receiving your comments and suggestions at [email protected] by February 25, 2003 so that we can improve the next draft of this document.

Table of ContentsPage
1.0 Introduction........................................................................................................................12.0 Characteristics of a Viable Salmonid Population...........................................................23.0 Steps in the Development of a Recovery Plan.................................................................2
3.1 Develop Recovery Plan Outline......................................................................................43.2 Define Planning Targets................................................................................................12
3.2.1. Identify Populations...............................................................................................123.2.2. Describe VSP Parameters......................................................................................13
3.3 Assess, Evaluate, and Identify Actions..........................................................................153.3.1. Assess Population..................................................................................................163.3.2. Evaluate and Develop Working Hypothesis..........................................................193.3.3. Identify Strategies..................................................................................................393.3.4. Evaluate Management Actions In Place................................................................493.3.5. Identify and Evaluate Action Scenario..................................................................533.3.6. Frame Monitoring Plan..........................................................................................553.3.7. Frame Adaptive Management Plan.......................................................................56
3.4 Review Regional Recovery Scenarios...........................................................................583.5 Finalize Plan..................................................................................................................58
3.5.1. Finalize Action Scenarios......................................................................................583.5.2. Finalize Monitoring Plan.......................................................................................583.5.3. Finalize Adaptive Management Plan.....................................................................59
4.0 Administrative Criteria...................................................................................................605.0 Assistance..........................................................................................................................606.0 References..........................................................................................................................60
i
List of Tables
PageTable 1. Technical tasks and key questions associated with each step in the Shared Strategy
process.....................................................................................................................................5Table 2. Status of population identification for each ESU of concern to the Shared Strategy.....13Table 3. Characteristics of the HPVA and PVA models used by the TRT..................................14Table 4. Examples of tools to estimate the capacity and productivity of a population................18Table 5. Examples of tools for conducting analyses that include the effects of landscape-scale
processes on VSP parameters. [Note: this table is draft and is not complete.].....................23Table 6. Examples of tools for conducting analyses for the effects of harvest management
actions on VSP parameters. The section number where these tools are discussed is given in parentheses in the first column. [Note: this table is draft and is not complete.]...................31
Table 7. Collecting information for a conceptual model of the effects of hatchery actions on abundance (A), productivity (P), diversity (D), and spatial structure (SS) in a watershed for current conditions (C) and desired future conditions (F).......................................................35
Table 8. Examples of tools for conducting analyses that integrate the potential effects of habitat, harvest and hatchery management actions on VSP parameters. [Note: this table is draft and is not complete]......................................................................................................................38
Table 9. Examples of alternative habitat management strategies associated with habitat forming processes or aquatic habitat characteristics...........................................................................42
Table 10. Four strategies from the Comprehensive Coho Salmon Management Plan based on the management goal (harvest or recovery) and degree of reproductive integration with the naturally produced fish (integration or isolation), and their risks, benefits, and critical elements.................................................................................................................................47
ii

List of Figures
PageFigure 1. Example of the interaction of the physical environment and processes that affect
aquatic habitat and the VSP parameters of a population.......................................................20Figure 2. Example of the interactions among habitat, hatchery, and harvest management actions
and their potential effects on the VSP parameters of a population........................................37
iii

1.0IntroductionThis document describes the biological content of a recovery plan directed to ultimately fulfill obligations of the Endangered Species Act (ESA) and address broader recovery goals. We frame the biological content through a series of technical questions that drive the development of: 1) a working hypothesis that describes the current interaction of the population and the ecosystem; 2) an integrated strategy that describes the types of habitat, harvest, and hatcheries measures that will lead to recovery; 3) a set of specific, integrated actions for habitat, harvest, and hatcheries that are hypothesized to result in achieving the salmon population targets; and 4) a suite of monitoring, evaluation, and decision criteria that facilitate adaptive implementation of the watershed plan.
Although many of our questions are focused at the individual population level, we recognize that a watershed recovery plan must be developed and evaluated within the context of the entire Evolutionarily Significant Unit (ESU). Developing a list of actions that will lead to achieving population targets cannot be done without considering the cumulative effects of harvest, hatchery and habitat management actions occurring throughout the range of the population. More importantly, since the ESU is the listed entity under the ESA, the goals and proposed recovery actions for the individual watersheds will ultimately be evaluated based upon how they operate together towards recovery of the entire ESU.
We believe that satisfactorily addressing the questions will lead to the development of a recovery plan with a high likelihood of success, and with a high likelihood of approval by NOAA Fisheries. Our suggestions are not unique – rather we have attempted to distill the ideas and information from many sources, including NMFS (1996), NWPPC (2001), and Beechie et al. (2002).
Effective recovery planning for salmonids requires expertise in many scientific fields and the participation of many groups. Our questions are designed to help make this multidisciplinary task easier, to provide a common framework for salmon recovery planning that brings together, rather than isolates, the extensive expertise that already exists in the Pacific Northwest. Who answers the questions will vary, depending on the types of actions being considered in each watershed. We assume that the audience includes (but is not limited to) watershed groups and co-managers. Progressing from the questions outlined here to a set of actions a watershed will take to achieve population targets involves several additional policy steps that we do not outline in this document. Rather, our aim here is to clearly articulate questions that will form the technical basis for policy decisions that answer the broad question: “What actions are necessary to achieve population planning targets?”
We have attempted to foster multidisciplinary discussion and understanding by providing a synopsis of the rationale for each question we pose, examples of how the question has been addressed, and tools that are available. We have also included a preliminary indication of how to evaluate the certainty of the response; that is, “How confident are we in our answer to the question?” Understanding the certainty of the recovery plan, and approaches that have been incorporated to address uncertainty, will become increasingly important as we all attempt to assess if the plan is likely to result in recovery.
1

Linking actions in habitat, hatchery and harvest management to salmon population status involves describing the four key characteristics of population health: abundance, productivity or growth rate, diversity, and spatial structure (see Characteristics of a Viable Salmonid Population, below). The questions emphasize the importance of integrating the predicted effects of habitat characteristics and processes, hatchery and harvest practices on salmon populations throughout their life cycle. For example, predicting the effects of a hatchery management program on salmon population status is not meaningful if the effects of the habitat condition in the watershed and the harvest regime are ignored. Evaluating the effects of habitat on salmon populations is especially complex. The questions contained in this document highlight the importance of understanding the conditions within freshwater and estuarine habitats (e.g., flow, sediment loads) and the landscape-scale processes (e.g., hydrology, sediment budgets). Linking the means through which landscape processes produce habitat conditions, and how they in turn affect salmon populations is a challenging task that must be undertaken for each watershed so that habitat-related actions for recovery can be identified.
2.0Characteristics of a Viable Salmonid PopulationOur approach to recovery planning rests on the concept of a viable salmonid population (VSP). A VSP is an independent population that has a negligible risk of extinction due to threats from demographic variation, local environmental variation, and genetic diversity changes over a 100-year time period (McElhany et al. 2000). Four characteristics of a population are linked to viability - abundance, population growth rate/productivity, spatial structure and diversity (see Box 1). Abundance is the number of individuals in the population at a given life stage or time; productivity or growth rate is the actual or expected ratio of abundance in the next generation to current abundance; spatial structure refers to how the abundance at any life stage is distributed among available or potentially available habitats; and diversity is the variety of life histories, sizes, and other characteristics expressed by individuals within a population.
3.0Steps in the Development of a Recovery PlanOur suggested approach builds on the five steps in the Shared Strategy planning process:
Step 1. Recovery Plan Outline: Develop an outline for a recovery plan that addresses the needs of the Endangered Species Act (ESA) and broader regional goals.
Step 2. Planning Targets: Define the abundance, productivity/growth rate, diversity, and spatial structure desired for each population.
Step 3. Action Identification: Identify the habitat, harvest, and hatchery management actions necessary to attain the planning targets.
2

Box 1. Characteristics of a Viable Salmonid Population (VSP)
McElhany et al. (2000) provided a conceptual basis for salmonid conservation assessments, identified four key characteristics of a population, and described their role in maintaining population viability:
Abundance is recognized as an important parameter because, all else being equal, small populations are at greater risk of extinction that large populations, primarily because several processes that affect population dynamics operate differently in small populations that they do in large populations. These processes are deterministic density effects, environmental variation, genetic processes, demographic stochasticity, ecological feedback, and catastrophes.
Population growth rate (i.e., productivity over the entire life cycle) and factors that affect population growth rate provide information on how well a population is “performing” in the habitats it occupies during the life cycle. Estimates of population growth rate that indicate a population is consistently failing to replace itself are an indicator of increased extinction risk. Although our overall focus is on population growth rate over the entire life cycle, estimates of stage-specific productivity – particularly productivity during freshwater life-history stages – are also important to comprehensive evaluation of population viability. Other measures of population productivity, such as intrinsic productivity and the intensity of density-dependence may provide important information for assessing a population’s viability. The guidelines for population growth rate are closely linked with those for abundance.
Spatial structure must be taken into account for two reasons: 1) Because there is a time lag between changes in spatial structure and species-level effects, overall extinction risk at the 100-year time scale may be affected in ways not readily apparent from short-term observations of abundance and productivity, and 2) population structure affects evolutionary processes and may therefore alter a population’s ability to respond to environmental change. Spatially structured populations in which “subpopulations” occupy “patches” connected by some low to moderate stray rates are often generically referred to as “metapopulations”. A metapopulation’s spatial structure depends fundamentally on habitat quality, spatial configuration, and dynamics as well as the dispersal characteristics of a population.
Diversity exists within and among populations, and this variation has important effects on population viability. In a spatially and temporally varying environment, there are three general reasons why diversity is important for species and population viability. First, diversity allows a species to use a wider array of environments that they could without it. Second, diversity protects a species against short-term spatial and temporal changes in the environment. Third, genetic diversity provides the raw material for surviving long-term environmental change.
3

Step 4. Regional Recovery: Determine which set of options in individual watersheds will add up to recovery at the regional scale, the scale at which chinook salmon, summer chum salmon, and bull trout are listed under the ESA.
Step 5. Finalize Plan: Finalize an initial set of recovery goals and management actions consistent with treaty rights and the ESA.
Key technical questions in each step are summarized in Table 1 and discussed in the following sections.
3.1 Develop Recovery Plan Outline
Question: What technical information and analyses must be included in a recovery plan?
The ESA identifies three components of a recovery plan:
1) “a description of contents of such site-specific management actions as may be necessary to achieve the plan’s goal for the conservation and survival of a species”;
2) “objective, measurable criteria which, when met, would result in a determination, in accordance with the provisions of this section, that the species be removed from the list”; and
3) estimates of the time required and the cost to carry out those measures needed to achieve the plan’s goal and to achieve intermediate steps toward that goal.”
In addition, NMFS salmon conservation guidance (1996) requests:
4) an assessment of the factors that led to population declines and/or which are impeding recovery; and
5) a comprehensive monitoring and evaluation program for gauging the effectiveness of recovery measures and overall progress towards recovery.
The “Technical Guide for Subbasin Planners” (NWPPC 2001) provides a complementary perspective and additional suggestions for the contents of a watershed plan.
The Shared Strategy staff group reviewed these sources and developed a draft outline for a recovery plan for Puget Sound salmon (see www.sharedsalmonstrategy.org). The outline is intended to stimulate discussion at the local and regional level, and to help all participants in the Shared Strategy think about how pieces of local and regional salmon protection and restoration efforts can fit into a region-wide plan. Evolution of the outline will occur as work proceeds on each of the Shared Strategy steps.
4

Table 1. Technical tasks and key questions associated with each step in the Shared Strategy process.
Shared Strategy Step
Technical Tasks
Key QuestionsHabitat Harvest Hatcheries Integrated
Step 1
Develop Recovery Plan
Outline
Identify Elements of
Plan
What technical information and analyses must be included in a recovery plan?
{Note: This step in the Shared Strategy process has been completed. The draft recovery plan outline can be obtained at www.sharedsalmonstrategy.org.}
Step 2
Define Planning Targets
Identify Populations
What populations were present in the watershed historically? What populations are present in the watershed currently?
{Note: This step in the Shared Strategy process has been completed for Puget Sound chinook salmon populations. A draft paper identifying the populations is available at http://www.nwfsc.noaa.gov/cbd/trt/popid.pdf.
Describe VSP Parameters
What abundance, productivity/growth rate, diversity, and spatial structure would be consistent with a viable salmonid population?
{Note: This step in the Shared Strategy process has been completed for Puget Sound chinook salmon with the exception of the North Lake Washington, Cedar River, Green River, White River, Skokomish River, and Elwha River populations. The conceptual basis for establishing the planning targets is described in a TRT document (“Planning Ranges and Guidelines for the Delisting and Recovery of the Puget Sound Salmon Evolutionarily Significant Unit”) available at http://www.nwfsc.noaa.gov/cbd/trt; a synopsis developed by the Shared Strategy staff group can be obtained at www.sharedsalmonstrategy.org.}
Step 3 Assess What are the current abundance, productivity/growth rate, diversity, and spatial structure of
5

Shared Strategy Step
Technical Tasks
Key QuestionsHabitat Harvest Hatcheries Integrated
Assess, Evaluate, and
Identify Actions
Population the population? How do they compare with the historical characteristics of the population?Evaluate and
Develop Working
Hypothesis
What are the plausible hypotheses for how habitat management actions affect aquatic habitat and the demographic, genetic, and ecological processes that determine the current and future VSP characteristics of the population? What are the key assumptions and uncertainties?
Example. See section 3.3.2.1.
What are the plausible hypotheses for how harvest management actions affect the demographic, genetic, and ecological processes that determine the current and future VSP characteristics of the population? What are the key assumptions and uncertainties?
Example. See section 3.3.2.2.
What are the plausible hypotheses for how hatchery management actions affect the demographic, genetic, and ecological processes that determine the current and future VSP characteristics of the population? What are the key assumptions and uncertainties?
Example. See section 3.3.2.3.
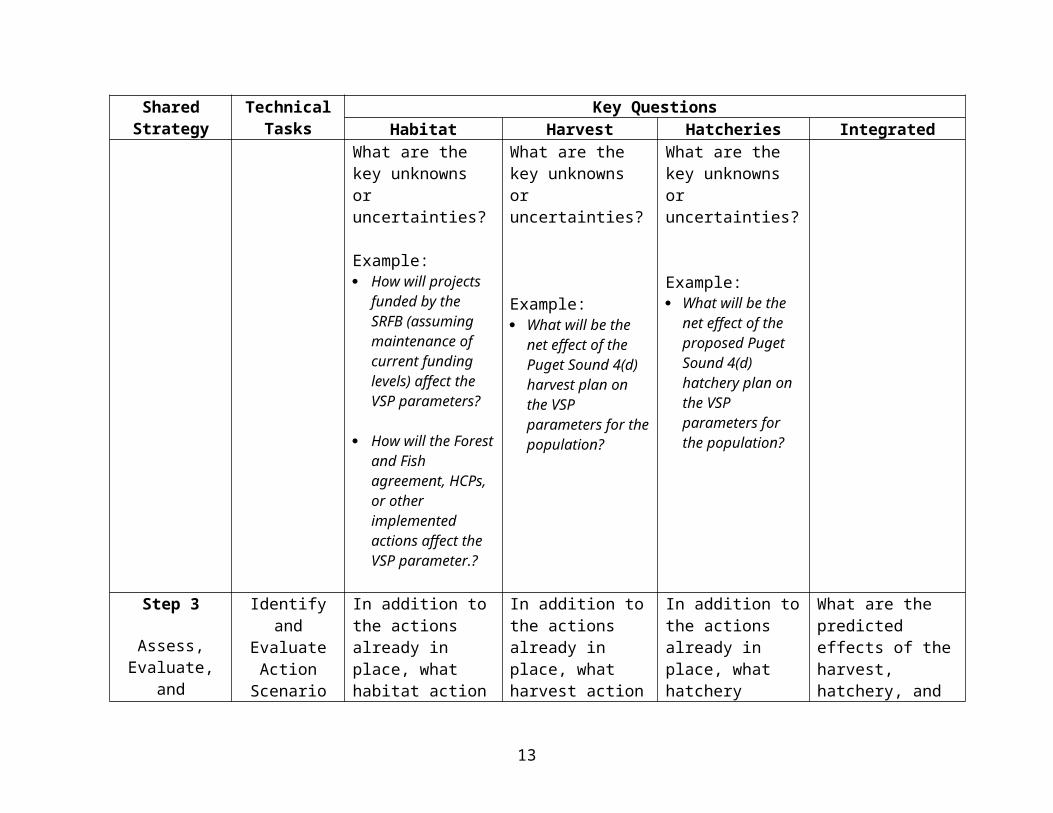
What are the characteristics of an integrated plan for harvest, hatchery, and habitat that we hypothesize would be consistent with achieving the planning targets for the VSP parameters of the population? What are the key unknowns or uncertainties?
Example. See section 3.3.2.4.
Step 3
Assess, Evaluate, and
Identify Actions(continued)
Identify Strategies
What types and sequence of habitat management strategies does the working hypotheses suggest will be needed to achieve the planning targets? How do these strategies address uncertainty?
What types and sequence of fishery management strategies do the working hypotheses suggest will be needed to help achieve the planning targets? How do these strategies address uncertainty?
What types and sequence of hatchery management strategies do the working hypotheses suggest will be needed to help achieve the planning targets? How do these strategies address uncertainty?
What integrated set of management strategies do the working hypotheses suggest? How does this integrated set of strategies address uncertainty?
6

Shared Strategy Step
Technical Tasks
Key QuestionsHabitat Harvest Hatcheries Integrated
Examples: Reduce streambed
fine sediment levels and increase population productivity by reducing the number of miles of roads per square mile of forested watershed.
Increase population diversity by restoring estuarine areas.
Examples: Restore population
spatial structure and population diversity by increasing the number and range in size of spawners.
Enhance productivity by establishing goals for egg deposition.
Examples: Increase population
diversity by reducing the number of nonlocal stocks spawning with the population.
Increase population productivity by using natural broodstock and reducing the number of hatchery origin fish in natural spawning areas.
Step 3
Assess, Evaluate, and
Identify Actions(continued)
Evaluate Actions in
Place
What habitat management actions are in place? In conjunction with other ongoing changes to the watershed (buildout, delayed response to changes in habitat forming processes), what will be their net effect on the VSP parameters of the population? What are the key unknowns or
What harvest management actions are in place? In conjunction with other ongoing changes to the watershed (buildout, delayed response to changes in habitat forming processes), what will be their net effect on the VSP parameters of the population? What are the key unknowns
What hatchery management actions are in place? In conjunction with other ongoing changes to the watershed (buildout, delayed response to changes in habitat forming processes), what will be their net effect on the VSP parameters of the population? What are the key
What is the predicted status of the VSP parameters of the population in 20, 50, and 100 years after accounting for the management actions that have been implemented? ? What are the key unknowns or uncertainties?
7

Shared Strategy Step
Technical Tasks
Key QuestionsHabitat Harvest Hatcheries Integrated
uncertainties?
Example: How will projects
funded by the SRFB (assuming maintenance of current funding levels) affect the VSP parameters?
How will the Forest and Fish agreement, HCPs, or other implemented actions affect the VSP parameter.?
or uncertainties?
Example: What will be the net
effect of the Puget Sound 4(d) harvest plan on the VSP parameters for the population?
unknowns or uncertainties?
Example: What will be the net
effect of the proposed Puget Sound 4(d) hatchery plan on the VSP parameters for the population?
Step 3
Assess, Evaluate, and
Identify Actions(continued)
Identify and Evaluate Action
Scenario
In addition to the actions already in place, what habitat action scenario is needed to provide the aquatic habitat conditions, habitat forming processes, and population characteristics that are consistent with the planning targets for the VSP parameters? How
In addition to the actions already in place, what harvest action scenario is needed to provide the population characteristics that are consistent with the planning targets for the VSP parameters? How does this action scenario address uncertainty?
In addition to the actions already in place, what hatchery action scenario is needed to provide the population characteristics that are consistent with the planning targets for the VSP parameters? How does this action scenario address uncertainty?
What are the predicted effects of the harvest, hatchery, and habitat action scenarios on the VSP parameters of the population in 25, 50, and 100 years? How do these actions address uncertainty?
8

Shared Strategy Step
Technical Tasks
Key QuestionsHabitat Harvest Hatcheries Integrated
does this action scenario address uncertainty?
Examples: River miles I-J will
be identified as critical areas with a riparian buffer of K feet.
Close roads X, Y, and Z to reduce sediment loading.
Examples: Close all nontreaty
fisheries in areas A-D for the period July 1 through September 30.
Eliminate minimum size limits in recreational fisheries.
Examples: Eliminate net pen
program X that has a high risk of introducing fish of nonlocal origin into spawning areas.
Step 3
Assess, Evaluate, and
Identify Actions(continued)
Frame Monitoring
Plan
What types of monitoring should be linked to the action scenarios to assess if the actions were implemented as proposed? How will we determine if the actions had the hypothesized effect on habitat and the VSP parameters of the population?
What types of monitoring should be linked to the action scenarios to assess if the actions were implemented as proposed. How will we determine if the actions had the hypothesized effect on harvest and the VSP parameters of the population?
What types of monitoring should be linked to the action scenarios to assess if the actions were implemented as proposed. How will we determine if the actions had the hypothesized effect on hatcheries and the VSP parameters of the population.
How will we determine if the recovery plan had the hypothesized effect on the VSP parameters of the population?
Frame Adaptive
Management Plan
How will results from the monitoring program be used to modify habitat programs?
How will results from the monitoring program be used to modify harvest programs?
How will results from the monitoring program be used to modify hatchery programs?
How will results from the monitoring program be used to develop an integrated habitat, harvest, hatchery management
9

Shared Strategy Step
Technical Tasks
Key QuestionsHabitat Harvest Hatcheries Integrated
habitat response?
Step 4
Review Regional Recovery Options
Identify and Evaluate ESU
Scenarios
Does the suite of proposed actions result in a set of populations meeting the criteria for recovery of the ESU?
Step 5
Finalize Plan
Finalize Action
Scenarios
What additional management actions are necessary for the populations to achieve the population targets and for a set of populations to meet the criteria for recovery of the ESU?
Finalize Monitoring
Plan
Were habitat management actions implemented as proposed? Did the actions have the hypothesized effect? Did the VSP parameters of the population respond as hypothesized?
Were harvest management actions implemented as proposed? Did the actions have the hypothesized effect? Did the VSP parameters of the population respond as hypothesized?
Were hatchery management actions implemented as proposed? Did the actions have the hypothesized effect? Did the VSP parameters of the population respond as hypothesized?
Did the recovery plan have the hypothesized effect on the VSP parameters of the population?
Finalize Adaptive
Management Plan
How will results from the monitoring program be used to modify habitat programs?
How will results from the monitoring program be used to modify harvest actions?
How will results from the monitoring program be used to modify hatchery programs?
How will results from the monitoring program be used to develop an integrated habitat, harvest, and hatchery management
10

Shared Strategy Step
Technical Tasks
Key QuestionsHabitat Harvest Hatcheries Integrated
response?
11

3.2 Define Planning TargetsA key step of the Shared Strategy process is the development of recovery planning ranges and targets for the populations that comprise each ESU. The ranges and targets provide a sense of the magnitude of the effort necessary to recover populations, and a common measure that can be used by habitat, harvest, and hatchery managers to guide the identification and evaluation of recovery actions.
The planning range, as determined by several technical models, provides a broad estimate of the abundance needed for a population to be viable over time. The ranges are large because of: 1) our limited understanding of the interacting factors controlling population dynamics; 2) the quality and quantity of data available; and 3) our inability to predict the environmental conditions that will affect each population in the future. The planning target provides a more specific measure within the range based on a fully functioning estuary, improved freshwater conditions, restored access to blocked habitats, and poor ocean conditions (see additional discussion below). Local governments, marine groups, and watershed groups are asked to work with the state, tribes, and Services to identify the actions necessary to attain the planning targets and reach consensus on how to implement those actions. Planning ranges and targets are discussed in greater detail in section 3.2.2.
Before the planning ranges and targets can be defined, the populations that comprise the ESU must be identified.
3.2.1. Identify Populations
Question: What populations were present in the watershed historically? What populations are present in the watershed currently?
Identification of the historical and current populations in an ESU is the initial step in the development of a recovery plan. The population is the basic unit for viability assessments and, at an ESU scale, the number, characteristics, and geographic distribution of current and historical populations is an important consideration in delisting decisions. NMFS has defined an independent population as a group of fish that does not, to a substantial degree, interbreed with fish from another group. For purposes of recovery planning, two groups are considered to be independent populations if exchanges of individuals do not substantially affect their population dynamics or extinction risk over a 100-year time period (McElhany et al. 2000).
Tools and Applications. The definitive information needed to identify populations is inter-group migration rates and the demographic consequences of those migration rates. In practice, information on straying of salmon between streams is rarely available. An alternative approach is to use diverse sources of information that are proxies for understanding the degree of reproductive isolation between groups of fish. These sources of information, in order of the strength of inference, include: 1) the spatial distribution of spawning habitat; 2) migration rates between spawning locations; 3) genetic attributes; 4) patterns of life history and phenotypic characteristics; 5) population dynamics; 6) environmental and habitat characteristics; and 7) the size of geographic area inhabited (Ruckelshaus et al., in prep.; McElhany et al., in prep.).
12

Evaluation. The certainty of the population structure can be evaluated using the hierarchy of information types listed above, the consistency of inferences drawn from different types of information, and the strength (e.g., number of samples, length of record, sampling protocols) of the empirical data.
Who Provides. The TRT has the task of identifying the current and historical populations for each listed species. Each report describing the historical population structure will also identify data needs and uncertainties to help guide research and monitoring and to provide watershed planners with a context for evaluating the risks posed by alternative actions. The status of population identification work by the TRT is summarized in Table 1.
Table 2. Status of population identification for each ESU of concern to the Shared Strategy.
ESU Status ReferencePuget Sound Chinook Completed Ruckelshaus et al. (in press)Hood Canal Summer Chum Completed1 WDFW and PNPTT (2000)
1 The TRT agrees with the population structure for summer chum identified in WDFW and PNPTT (2000). A draft TRT report discussing the population structure of summer chum will be available in the spring of 2003.
3.2.2. Describe VSP Parameters
Question: What abundance, productivity/growth rate, diversity, and spatial structure would be consistent with a viable salmonid population?
The TRT has conducted quantitative analyses to estimate the abundance, growth rate, and productivity criteria for Puget Sound chinook salmon populations. Specification of these criteria at this stage is aimed at helping planners evaluate the magnitude of effort that will be needed from each population to achieve recovery. Quantitative viability criteria for spatial structure and diversity have not been thoroughly developed, but the TRT has developed a set of recommendations that describe criteria for each of these characteristics. Initial guidelines for population spatial structure and diversity have also been presented to help planners understand how these fit with the quantitative population-level abundance and productivity criteria.
Although the TRT is developing separate criteria for each of the VSP parameters, it is important to understand that they are closely interrelated. For example, opening up additional high quality habitat will benefit both abundance and spatial structure. It is also important to recognize, however, that addressing one key characteristic may negatively affect another one. For example, to meet spatial structure and diversity criteria, it may be necessary to provide opportunity for chinook salmon to occupy habitats where they are less productive than in the best habitats in the system. This may, in some cases, reduce the average productivity of the population.
13
Tools and Applications. The TRT identified criteria for abundance and the productivity/growth rate of a population using two types of analyses: 1) Population Viability Analysis (PVA) and 2) Habitat Productivity Viability Analysis (HPVA).
The PVA used by the TRT addresses the question “What is the equilibrium abundance associated with the observed variability in growth rates for Puget Sound chinook salmon that assures the population will persist for a prescribed period of years with a given level of probability?” The PVA predicts the equilibrium abundance level based solely on three fundamental demographic properties of a population (abundance, quasi-extinction threshold (QET), and variability in growth rate or 2) and two policy parameters (the probability and time period for persistence); that is, it predicts the abundance required for population persistence without consideration of ecological interactions, the spatial distribution of the population, or life history diversity. Because these factors are not considered, and a single estimate of the variability in growth rate is used for all populations, the predictions are not population specific.
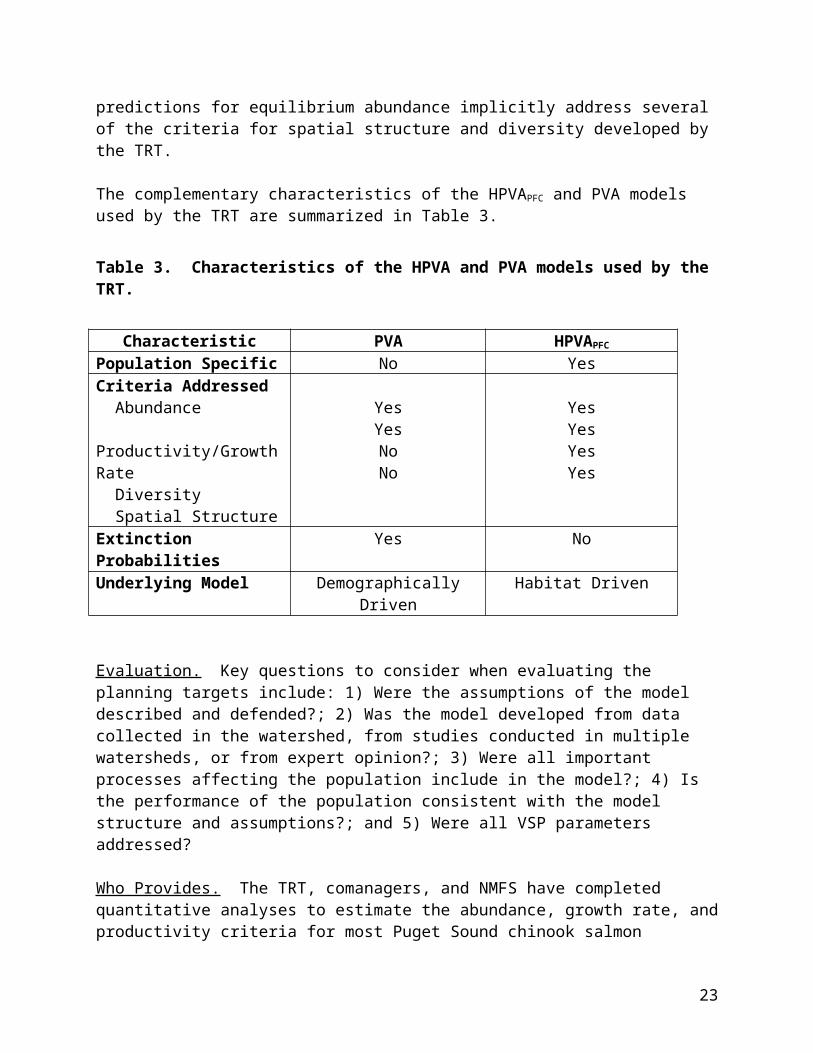
The HPVA used by the TRT addresses the question “What is the equilibrium abundance associated with the habitat characteristics predicted to support a persistent population?” The HPVAPFC is an application of NMFS’ concept of Properly Functioning Conditions (PFC), or the habitat conditions “essential to conservation of the species, whether important for spawning, breeding, rearing, feeding, migration, sheltering, or other functions”. The HPVAPFC derives its prediction for equilibrium abundance by developing a set of explicit relationships between habitat conditions and salmon survival, and applying the minimum thresholds for PFC for habitat throughout the watershed. By incorporating these minimum conditions for habitat throughout the watershed, the HPVAPFC predictions for equilibrium abundance implicitly address several of the criteria for spatial structure and diversity developed by the TRT.
The complementary characteristics of the HPVAPFC and PVA models used by the TRT are summarized in Table 3.
Table 3. Characteristics of the HPVA and PVA models used by the TRT.
Characteristic PVA HPVAPFC
Population Specific No YesCriteria Addressed Abundance Productivity/Growth Rate Diversity Spatial Structure
YesYesNoNo
YesYesYesYes
Extinction Probabilities Yes NoUnderlying Model Demographically Driven Habitat Driven
Evaluation. Key questions to consider when evaluating the planning targets include: 1) Were the assumptions of the model described and defended?; 2) Was the model developed from data
14

collected in the watershed, from studies conducted in multiple watersheds, or from expert opinion?; 3) Were all important processes affecting the population include in the model?; 4) Is the performance of the population consistent with the model structure and assumptions?; and 5) Were all VSP parameters addressed?
Who Provides. The TRT, comanagers, and NMFS have completed quantitative analyses to estimate the abundance, growth rate, and productivity criteria for most Puget Sound chinook salmon populations (analyses for North Lake Washington, Cedar River, Green River, White River, Skokomish River, and the Elwha River are still underway). The conceptual basis for these analyses is described in a TRT document (“Planning Ranges and Guidelines for the Delisting and Recovery of the Puget Sound Salmon Evolutionarily Significant Unit”) available at http://www.nwfsc.noaa.gov/cbd/trt. From these technical analyses, the Shared Strategy Development Committee has defined the planning targets for use by watershed planning groups. . A synopsis developed by the Shared Strategy staff group can be obtained at www.sharedsalmonstrategy.org.
Quantitative viability criteria for spatial structure and diversity have not been developed, but the TRT has developed a set of recommendations that describe criteria for each of these characteristics.
3.3 Assess, Evaluate, and Identify ActionsThe ultimate objective of Step 3 of the Shared Strategy is for local governments, marine groups, and watershed groups to work with the state, tribes, and Services to identify the actions necessary to attain the planning targets. Our suggested approach for achieving this objective is to:
1) assess the status of the population (section 3.3.1);2) develop a working hypothesis that describes the interaction of the population and the
ecosystem (section 3.3.2);3) identify strategies to improve the status of the population (section 3.3.3);4) evaluate the potential effects of the management actions already in place (section 3.3.4);5) identify site-specific management actions that are predicted to result in the population
achieving the planning targets (section 3.3.5);6) develop a conceptual framework for a monitoring plan (section 3.3.6); and7) develop a conceptual framework for an adaptive management plan (section 3.3.7).
Successful completion of these steps assures meeting a fundamental requirement of a recovery plan – “a description of contents of such site-specific management actions as may be necessary to achieve the plan’s goal for the conservation and survival of a species”.
15

3.3.1. Assess Population
Question: What are the current abundance, productivity/growth rate, diversity, and spatial structure of the population? How do they compare with the historical characteristics of the population?
The current and historical abundance, productivity/growth rate, diversity, and spatial structure of the population are important reference points for the recovery plan. Comparison of the planning targets with the current and historical conditions provides an indication of the risks facing the population and helps identify the magnitude of change that will be required. It is important when these comparisons are made that a common “measure” is used. For example, since the planning target is expressed in terms of equilibrium spawners, a similar measure should be used for current and historical abundance if we are to identify the magnitude of change required.
Abundance and Productivity.
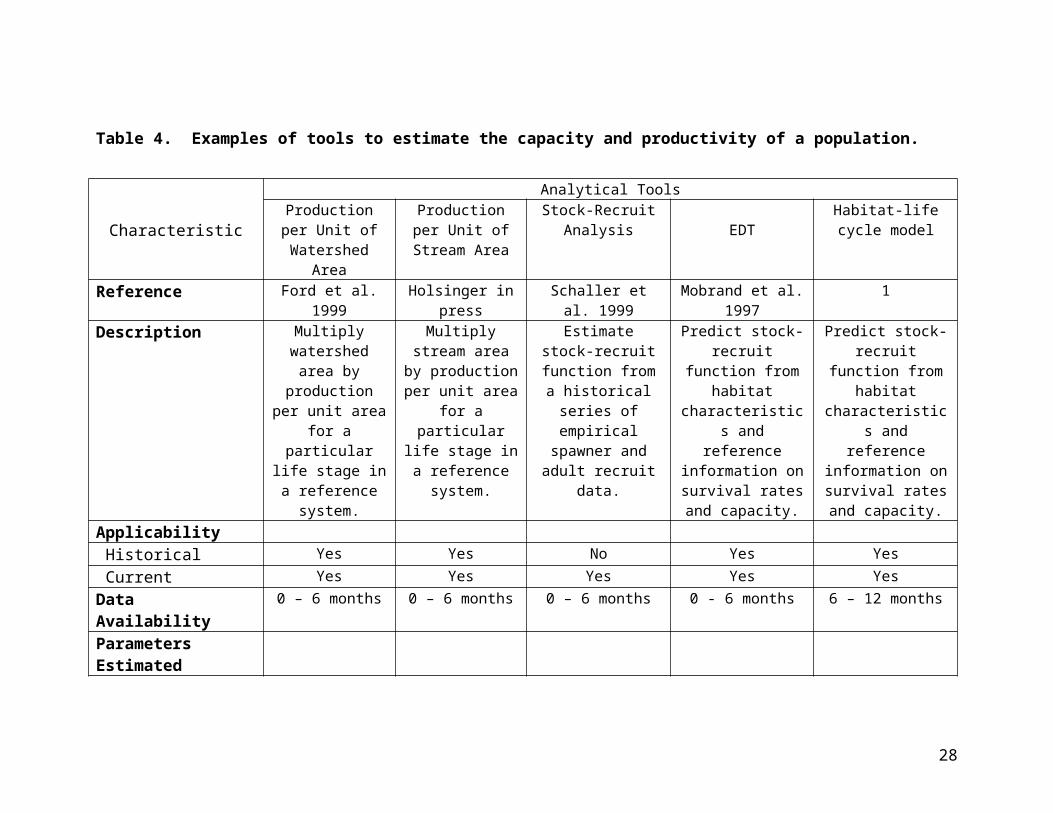
Tools and Applications. Several methods are available for estimating the current and historical equilibrium abundance, capacity, and/or productivity of the watershed (Table 4). The Ecosystem Diagnosis and Treatment model (EDT) (Mobrand et al. 1997) has been broadly applied throughout Washington (see section 3.3.2.1 for additional discussion of EDT). Additional analytical approaches to estimating current and historical abundance of chinook in Puget Sound watersheds are described in Haas and Collins (2001), Holsinger (2002), and Collins and Montgomery (in press). Estimates of current and historical parameters for many chinook salmon populations are available, including populations in the Nooksack River, the Skagit River, the Stillaguamish River, the Snohomish River, the Puyallup River, the Nisqually River, the Dosewallips River, and the Dungeness River.
Evaluation. The tools used to assess populations can be evaluated relative to several criteria: 1) Was the analysis developed from data collected in the watershed, from studies conducted in multiple watersheds, or from expert opinion; 2) Do the prediction intervals from the model have a coefficient of variation of less than 30%, more than 30%, or is no prediction interval provided?; 3) Have all important processes been included in the model structure?; 4) Has the model been validated?; 5) Have the assumptions of the model been identified and defended?; and 6) How sensitive are the results to processes or parameters with significant uncertainty?
Who Provides. Estimates of current and historical abundance will be provided to watershed planning groups by the TRT, WDFW, and the Puget Sound treaty tribes.
Spatial Structure.
Tools and Applications. Few assessments of population spatial structure are known to currently exist. However, the Ecosystem Diagnosis and Treatment model (EDT) (Mobrand et al. 1997) has been broadly applied throughout Washington (see section 3.3.2.1 for additional discussion of EDT). In the process of estimating abundance and productivity based upon the habitat conditions inputs, the EDT model simulations generate life stage specific spatial distribution data
16

in the form of 1ife history trajectories. These data can be captured and quantitatively analyzed to describe the population spatial structure associated with the abundance, productivity, and diversity estimates.
Evaluation. See “Abundance” section above.
Who Provides. WDFW, the Puget Sound tribes, and the Washington State Conservation Commission have compiled GIS layers with barriers to fish passage, current distribution, and presumed historical distribution.
Diversity.
Tools and Applications. Few quantitative tools to evaluate diversity have been applied for salmon populations. EDT provides a measure of diversity by comparing the predicted number of life history trajectories (unique paths through time and space) that are sustainable under alternative conditions.
Evaluation. See “Abundance” section above.
Who Provides. Estimates of current and historical diversity will be provided to watershed planning groups by the TRT, WDFW, and Puget Sound treaty tribes.
17

Table 4. Examples of tools to estimate the capacity and productivity of a population.
Characteristic
Analytical ToolsProduction per Unit of Watershed Area
Production per Unit of Stream Area
Stock-Recruit Analysis EDT
Habitat-life cycle model
Reference Ford et al. 1999 Holsinger in press Schaller et al. 1999 Mobrand et al. 1997 1Description Multiply watershed
area by production per unit area for a
particular life stage in a reference
system.
Multiply stream area by production per unit area for a
particular life stage in a reference
system.
Estimate stock-recruit function from a
historical series of empirical spawner
and adult recruit data.
Predict stock-recruit function from habitat
characteristics and reference information on survival rates and
capacity.
Predict stock-recruit function from habitat
characteristics and reference information on survival rates and
capacity.Applicability Historical Yes Yes No Yes Yes Current Yes Yes Yes Yes YesData Availability 0 – 6 months 0 – 6 months 0 – 6 months 0 - 6 months 6 – 12 monthsParameters Estimated Equilibrium Abundance No No Yes Yes Potentially Capacity Yes Yes Yes Yes Yes Intrinsic Productivity Yes No Yes Yes YesCriteria Addressed Abundance Yes Yes Yes Yes Yes Productivity No No Yes Yes Yes Diversity No No No Yes Potentially Spatial Structure No Yes No No YesUncertainty Included Measurement Error No Yes Potentially No No Model No No Potentially No Potentially Environmental Potentially No Potentially Yes Yes1. Nickelson and Lawson (1998), Greene and Beechie (2002), Sharma et al. (2002)
18

3.3.2. Evaluate and Develop Working HypothesisThe NWPPC (2001) describes the working hypothesis as “a collection of component hypotheses – a set of key assumptions that are based on assessment data and analysis”. It includes a synthesis of the underlying data, assumptions, key uncertainties, and analyses that provide the basis for a holistic view of the current interaction of the population and the ecosystem. The working hypothesis drives the subsequent development of management strategies and is a crucial element of the adaptive management plan. In some cases, alternative hypotheses may exist, and it will be important to discuss the ramifications of the alternatives, how risks associated with acting upon an incorrect hypothesis can be minimized, and how the alternative hypotheses should be addressed in an adaptive management plan.
The working hypothesis is likely to be hierarchical, beginning at a relatively broad scale geographic or biological scale, and ultimately drilling down to a sufficiently fine scale to inform the identification and selection of management strategies.
3.3.2.1 Habitat
Aquatic habitat conditions result from a complex web of biological and physical processes operating under the geomorphic and climatic constraints in the watershed (Fig. 1). The processes operate at multiple temporal and spatial scales, ranging from watershed processes occurring over time periods as long as 10,000 years to site specific processes affecting individual channel units such as a pool or bar (Montgomery and Buffington 1998). Habitat management actions can affect aquatic habitat directly, or indirectly through disruption of the underlying processes and alteration of the physical environment of the watershed.
The VSP parameters of a population are most directly linked to the aquatic habitat in which the population spawns, rears, and migrates. Assessing the current quantity, quality, and connectivity of aquatic habitat, then, is an obvious first step if we are to develop hypotheses about the mechanisms through which habitat management actions have affected the VSP parameters of the population. Equally important, however, is to identify the how habitat management actions disrupted the landscape scale processes controlling aquatic habitat conditions (Frissell and Nawa 1992; Beechie and Bolton 1999). Failure to identify and address these processes can lead to costly site-specific restoration actions that are unlikely to persist in the face of large-scale, persistent habitat forming processes (Roni et al. 2001).
19

Figure 1. Example of the interaction of the physical environment and processes that affect aquatic habitat and the VSP parameters of a population.
Physical Environment
• Geomorphology• Climate
PotentialDegrading Actions
• Levee Construction• Gravel Mining• Fossil Fuel Burning
Processes
• Erosion• Hydrology• Succession• Organic Flux
• Forest Harvest• Water Removal• Road Construction• Crop Fertilization
Aquatic Habitat
• Channel Area• Channel Scour• Streambed Fines• Temperature• LWD
VSP Parameters
• Abundance• Productivity• Diversity• Spatial Structure
• Size Selective Harvest• Domestication• Predation/Competitionfrom Hatchery Fish
PotentialDegrading Actions
PotentialDegrading Actions
PotentialDegrading Actions
• Barrier Construction
20

Question. Part A) What are the plausible hypotheses describing how aquatic habitat affects the demographic, genetic, and ecological processes that determine the current and future VSP characteristics of the population? What are the key assumptions and uncertainties?
The specific aquatic habitat conditions limiting the abundance, productivity, diversity, and/or spatial structure of a population should be identified to direct subsequent assessment activities and recovery actions. For some populations, the one or two key habitat conditions limiting population viability may be readily apparent; for other populations, the complex interaction of the life history of salmonids with the ecosystem may require a more detailed analysis that links all life history stages. Estuarine and nearshore habitats, for example, may play a critical role in determining the abundance, productivity, and diversity of Puget Sound populations of chinook salmon (Simenstad 2000).
Tools and Applications. Most assessments of the effects of habitat on salmonid populations have either been qualitative, limited to a single life stage, or focused on a single habitat characteristic. The Washington State Conservation Commission, for example, completed a qualitative review of the habitat features limiting salmonid production for many watersheds in Washington (see www.conserver.org). Quantitative relationships between habitat attributes (e.g., peak flow, interstitial dissolved oxygen concentrations, temperature) and survival rates or production have been identified in some watersheds with long-term monitoring or in experimental studies. Excellent surveys of the habitat requirements of salmonids may be found in Spence et al. (1996) and Bjornn and Reiser (1991).
While this information is invaluable, a comprehensive, integrated model will often be required to evaluate the effects of the temporal and spatial interaction of salmon with aquatic habitat (cf., Nickelson and Lawson 1998). One general model that has been frequently used is the Ecosystem Diagnosis and Treatment (EDT) model (Mobrand et al. 1997). By relating habitat attributes at the stream reach level to the watershed capacity, productivity, and the diversity of the population, the model provides a systematic method for developing hypotheses about the key factors limiting the attainment of the VSP parameters. Results can be presented at a stream reach by life stage scale, or summarized over life stages for a subcomponent of the watershed (Appendix 1, Fig. 1). Additional analyses addressing the effects of habitat on chinook populations that have been applied in Puget Sound streams include Greene and Beechie (2002) and Sharma et al. (2002). Analyses of current and historical parameters for many listed species are available, including chinook salmon in the Nooksack River, the Skagit River, the Stillaguamish River, the Snohomish River, the Puyallup River, the Nisqually River, the Dosewallips River, and the Dungeness River.
Evaluation. ISAB (2001) provided a review of several models used in the Columbia Basin, including EDT, a statistical model (Cumulative Risk Initiative, (CRI)), and a decision analysis support tool (Plan for Analysis and Testing Hypothesis (PATH)). The conclusions were that:
1) None of the models presently in use in the Columbia Basin is complete enough to serve as the sole decision support tool for the region.
2) The models are best at ranking the expected effects of management alternatives.3) All the modeling efforts are severely constrained by lack of data.
21

4) Decision-makers would be well served by drawing on all the available analytical tools.5) Effective communication between decision-makers and scientists is essential if scientific
results are to play an integral role in the decision-making process.
The tools used to assess the effects of aquatic habitat conditions on the VSP parameters of a population can be evaluated relative to several criteria: 1) Was the analysis developed from data collected in the watershed, from studies conducted in multiple watersheds, or from expert opinion; 2) Do the prediction intervals from the model have a coefficient of variation of less than 30%, more than 30%, or is no prediction interval provided?; 3) Have all important processes been included in the model structure?; 4) Has the model been validated; 5) Have the assumptions of the model been identified and defended?; and 6) How sensitive are the results to processes or parameters with significant uncertainty?
Who Provides. The critical aquatic habitat factors limiting the attainment of VSP parameters will be identified by the watershed planning group.
Question: Part B. What are the plausible hypotheses describing the mechanisms through which habitat management actions affect habitat forming processes and the aquatic habitat conditions in the watershed? What are the key assumptions and uncertainties?
Developing hypotheses on how habitat management actions have disrupted the physical environment and processes controlling aquatic habitat conditions is a crucial step in designing effective habitat restoration and protection strategies. Key watershed processes and physical traits to evaluate will be driven by the assessment of aquatic habitat conditions, but are likely to include hydrology, erosion, succession (riparian function), and geomorphology (including hydromodifications such as levees).
Tools and Applications. The manual for watershed analysis (WFPB 1997) provides a compendium of tools for process assessment, including appendix chapters on mass wasting, surface erosion, hydrology, riparian, and water quality. Table 5 provides examples of habitat process-related analyses and models that have been applied in salmonid watersheds. Additional applications of a sediment mass-wasting model that has been used for landscape process planning in Puget Sound can be found in Montgomery and Dietrich (1994) and Montgomery et al. (1998).
One valuable hydrologic model that is available for Puget Sound watersheds is the Distributed Hydrology-Soil-Vegetation Model (DHSVM) (Storck et al. 1998). Unlike the previous generation of spatially aggregated models, DHSVM provides spatially explicit predictions of the effects of land surface changes on hydrology. As described by Storck et al. (?), DHSVM “provides a dynamic (one day or shorter time step) representation of the spatial distribution of soil moisture, snow cover, evapotranspiration, and runoff production…Model inputs are near-surface meteorology (precipitation, temperature, wind, humidity) and incoming short- and longwave radiation. Digital elevation data are used to model topographic controls on incoming shortwave precipitation, air temperature, and downslope water movement. Surface land cover and soil properties are assigned to each digital elevation model (DEM) grid cell or pixel. The
22

Table 5. Examples of tools for conducting analyses that include the effects of landscape-scale processes on VSP parameters. [Note: this table is draft and is not complete.]
Approach/Tool Tool FundamentalsAbility to Assess VSP Parameters Action-VSP
Links Benefits Uncertainties/Risks ApplicationsA P D S
Hydrologic Simulation Models
Models generate hydrographs based on land use/land cover attributes, geology and soil characteristics. Some models possess water quality analysis capability as well.
X X X
Predicts unit hydrographs or for various basin scales. Models often calibrate against gage data for varying durations--from 2-10 years or are physically-based routing models. Various models in common use; generally easy to develop and apply. Can illuminate spatial variations in flow.
Validation and confidence depends on length of record used in calibration. Absolute flow values often contain significant error in flow prediction if calibration poor.
Bicknell et al. USEPA (1997); Storck (2002).
Hydrologic Simulation Program Fortran (HSPF).
HSPF also has a water quality module that can be used to characterize and compare water quality effects from various land uses.
Lumped parametric types of models that use catchment-based geology, soil and land cover to generate hydrologic data that can be used for comparative and predictive purposes.
X X X Generally easy to construct if land cover is known. Can provide end-of-catchment flow predictions for almost any sized catchment. Output makes analysis relatively straightforward for some flow
Model accuracy depends on length of record used for calibration. Generally poor at extreme low and extreme high flow events such as low flow and 100-year floods. Unable to make reach-specific predictions unless there is overlap with
Bicknell et al. USEPA (1997)
23
parameters--peak flows, durations. catchment output.
Physical models. Storck (UW--under construction).
Physically-based distributive models attempt to capture the pathways by which rainfall moves through the watershed and create the best possible mathematical description of the processes operating in all parts of the catchment. Are generally a series of linked mathematical descriptions of evapotranspiration, sotrage, inter- and surface flow, grounwater exchenge, etc.
X X
Models do not require calibration against real records. They can link to a variety of physical and chemical processes operating in catchments such as solute transfer. Can have a strong spatial component.
Must have considerable faith in hydrologic theory or have invested in a large field verification process for the various processes modeled.
Storck (2002), under construction but currently unavailable.
Ungaged watershed Methods
Methods that: 1) use flow from nearby gaged watersheds of similar size, shape and composition to estimate runoff (regionalization); 2) use coefficients related to landcover, soils and geology to estimate runoff from rainfall events.
X
Methods can be applied in watersheds where gage data is absent or of irregular duration or where data quality is poor. Inexpensive and relatively simple to generate for most watersheds if basic watershed features are known.
Methods generate relatively coarse estimates Formulas allow estimates of total water yield, various rainfall-runoff events (25-year flood, 100-year flood) but cannot be used to reliably reconstruct a continuous hydrograph.
Dunne and Leopold (1978); Gordon, McMahon, and Finlayson (1992).
Solute and pollutant runoff estimation
Land cover and land use based estimates of nutrient and contaminant
x x Flow generators such as HSPF are linked to land
Models for the washoff of pollutants must be calibrated
USEPA (1997)
24

techniquesHSPF water quality modules
delivery to streams and rivers. These estimates are often tightly coupled to surface erosion rates and locations.
x
cover characteristics through washoff models. Now in common use by federal, state and local agencies for water quality predictions.
just as the hydrologic models are calibrated. Regional parameters are often used but can be misleading unless corrected for local conditions
Surface erosion estimates
Empirical methods: RUSLE and MMF
Physically-based models: WEPP
Empirical methods are generally based on the Revised Universal Soil Loss Equation (RUSLE) that links soil loss to rainfall, vegetation cover and soil erosivity. Also, estimates as measured from particular studies can be used.
Designed to replace the RUSLE, WEPP was designed for the NRCS and has three components: a watershed module, a climate module, and an erosion module. Available for free from the WEPP website at http://topsoil.nserl.purdue.edu
X
X
Empirical models and results can be applied to real time erosion problems and can provide estimates for a variety of situations from agricultural practices to urban practices.
Physically-based models such as WEPP are more useful at the small catchment level and can reliably predict soil loss from surface and rill erosion.
Most erosion methods are limited to areas and management conditions and are difficult to extrapolate beyond the local data. The RUSLE can be applied only to relatively small areas and cannot be extended to whole catchments without considerable uncertainty. WEPP is useful at the small catchment size (< 500 Hectares) and would require a breakdown of large watersheds into these catchments. It’s advantage is that it is now Windows-based and relatively easy to run using regional climate data and erosion information..
See Morgan (1995) for a description of RUSLE and for MMF (Morgan, Morgan and Finney method);
Dunne and Leopold (1978); Dietrich and Dunne (1978); Montgomery et al. (1998).WEPP was developed by Nearing et al (1989) and has undergone extensive testing..
Mass WastingInventory and
Inventory throughout watersheds to identify
X Field inventories are the most
Field inventories are quite time consuming
Montgomery et al. (1998); Lunetta et al
25

volume estimation
landslide-prone areas. May use field inventories together with remote sensor data and analysis based on slope, geology and vegetation types.
X
useful for quantifying sediment delivery via mass wasting for recent decades. Remote sensor data coupled with geologic and slope information can rapidly locate areas with high risk of sediment delivery.
while remote sensor data and landslide risk estimation are less accurate. Maps and aerial photography may assist in finding historic landslides.
(1997)
Debris torrent Inventories and mass loading estimates
Use topographic data and geology to locate steep, zero order channels in forested areas. Aerial photo inventories and field inventories are common. Remote sensor data can be used in conjunction with topographic and geologic data to predict locations and risk of debris torrents.
X
X
Field and aerial inventories can provide confidence in estimates of sediment and debris and can illuminate historic and recent debris flows. The use of predictive attributes such as geology, slope, and hydrology are somewhat less accurate but can produce useful levels of risk across watersheds.
Field inventories are time consuming difficult to carry out in steep terrain. Aerial inventories--especially color aerial photography at 1:24000--provide considerable information about recent torrents.
Correlative methods are less accurate but can pinpoint areas with high probabilities of such events, especially when calibrated with field data.
Benda and Cundy (1990); Benda and Dunne (1987). Montgomery et al. (1996); Lunetta et al (1997).
Distribution and frequency of sediment and wood supply areas (and
Inventories taken from erosional processes above are overlaid onto forest succession and
X X Mapping the presumed sources of woody debris
Requires GIS data layers for various age categories of forest as well as estimates of
Lunetta et al. (1997) comes closest in the technique for GIS overlays.
26

their deposition zones) in the watershed. Depends on forest successional patterns and past and present rates of mass wasting, debris torrents and channel migration.
management patterns to map the spatial distribution of sediment and wood sources to rivers throughout the watershed. Depositional areas can also be mapped in this way. The use of GIS map data and aerial photographs is required.
X
and sediment to the river system provides a view to past and future distributions of these important processes. Coupled with estimates of event frequency, a picture of trends can be developed for each watershed.
the frequency and age of mass wasting, debris torrent sites, and channel migration zones.
Population Dispersal and Connectivity relative to disturbance in aquatic ecosystems. Inventories of population
distribution over time; geomorphic models that link segment scale of habitat disturbance and attributes with population distribution (Core areas); spatially explicit population models (SEPMs)
X
X X
Models can link populations explicitly to landscape patches and rates of change in habitat. Some SEPMs address dispersal mechanisms and their relation to patch turnover and location. Most useful in addressing problems require considerations of the amount, geometry and rates of change in habitats.
Most SEPMs are data hungry and lack of data at appropriate scales limits application.
Core areas are the result of inventories of population dispersal relative to fluvial and geomorphic attributes of the system. These are poorly developed at this time but some efforts are underway in King County, WA.
Noon and McKelvey (1996);Dunning et al. (1992); Reeves et al (1995);
Lucchetti, Martin, Benda and Schrefler are developing geomorphic correlates of population dispersal for King County, WA. Preliminary results are due in January of 2003.
Succession models that link forest structure to disturbance and watershed
Coastal Landscape Analysis and Modeling Study from the OR Dept of Forestry is a multi-resource assessment
x X Models explicitly links spatial and temporal attributes of the
Models are data intensive and requires a strong inter-disciplinary team to carry off the
CLAMS: Bettinger et al (2000).
LANDIS:Mladenhoff et al.
27

processes: CLAMS
LANDIS is a spatial model of disturbance, succession and management.
developed for the Oregon Coast Range. Can be used to assess the effects of management scenarios on landscape processes.LANDIS is an integrated model of disturbance and succession developed in Wisconsin and applied to a 500,000 hectare forest landscape. While not directly applicable to PNW forests, LANDIS provides some useful linkages among disturbance patterns and successional trajectories.
x
landscape to various processes such as sediment, wood recruitment and successional trajectories. Can be used to evaluate management actions on spatial and temporal attributes of the watershed.
assessment. (1996) and Mladenhoff and He (1999)
28
DEM resolution is arbitrary, but the land surface is usually represented with pixels of dimension less than 100 m by 100 m.”
Beamer et al. (2002) describes the application of several tools in the Skagit River, where the Skagit Watershed Council has developed a “scientific framework that strives to identify: 1) the natural landscape processes active in a watershed; 2) the effects of land-use on natural processes; and 3) the causal relationships between land-use and habitat conditions.” Models were developed to describe the hydrology, sediment supply, riparian function, channel-floodplain interactions, and isolation of habitat. The hydrologic analysis indicated that increased peak flows led to the impairment of 23% of the mountain sub-basins in the Skagit, where impaired was defined as a subbasin with more than 50% of the watershed area in hydologically immature vegetation due to land-use or more than 2 km of road length existed per km2 of watershed area. active in a watershed, 2) the effects of land use on natural processes, and 3) the causal relationships between land use and habitat conditions.”
Evaluation. See section 3.3.2.1.
Who Provides. The habitat forming processes linked to the critical aquatic habitat characteristics will be identified by the watershed planning group.
3.3.2.2 Harvest
Question: What are the plausible hypotheses for how harvest management actions affect the demographic, genetic, and ecological processes that determine the current and future VSP characteristics of a population? What are the key assumptions and uncertainties?
Our objective in this section is to evaluate harvest management actions in the context of the current VSP parameters of the population (section 3.3.1) and identify the characteristics of a harvest management regime that are consistent with achieving the planning targets. In completing the evaluation, it is often helpful to look for trends in harvest or harvest rates that can be related to trends in population attributes, especially related to the VSP parameters. Examples of the type of questions to ask include:
Have catches or exploitation rates increased while abundance of returning adults and/or escapement declined? This would also result in a decreasing overall growth rate.
Has harvest targeted (on purpose or inadvertently) larger and, therefore, more productive fish, thereby reducing spawning productivity? In this case, spawning productivity could be have been decreased while growth rate remained constant (if some other mortality was reduced to compensate for the decrease in productivity).
Has the timing of the fishery selected early or late returning fish, thereby reducing the diversity of the run timing?
Has the timing or location of harvest impacted one segment of the population (e.g., early returning fish that spawn in the higher reaches or larger fish that spawn in faster currents with larger substrate) more than another, thereby reducing spatial distribution?
29

These examples are not comprehensive. One should look for relationships between harvest and other biological traits. Often relationships will not be obvious and alternative hypotheses can be developed, to be tested during subsequent steps and in the monitoring stage. The working hypothesis may be refined in an iterative fashion as the assessment develops.
Tools and Applications. Table 6 provides examples of analyses and models that have been used to address the effects of harvest on VSP parameters. To answer these questions, one would start with correlation analyses to determine if harvest management practices and harvest are possible candidates for affecting the VSP parameters. While correlation analysis does not prove cause, especially when many factors (e.g. other H’s) are working at once on the population, it does help guide where to look for cause.
The temporal and spatial scale of analysis should be sufficient to detect differences or relationships, with special attention to this when addressing diversity and spatial structure correlations.
Evaluation. Evaluation of relevant information to formulate the working hypotheses can be made in part by looking at the literature and other situations where the cause and effect have been shown. Also, previous changes in harvest practices for the population in question can be compared to observed changes in the VSP parameters.
Who Provides. The harvest hypotheses will be identified by the Puget Sound treaty tribes and the Washington Department of Fish and Wildlife (WDFW).
30

Table 6. Examples of tools for conducting analyses for the effects of harvest management actions on VSP parameters. The section number where these tools are discussed is given in parentheses in the first column. [Note: this table is draft and is not complete.]
Approach/Tool Tool FundamentalsAbility to Assess VSP Parameters Action-VSP Links Benefits Uncertainties/RisksA P D S
Correlation Analysis (5.2.2)
Looks for relationships between factors X X X X
Look for correlations between harvest
practices and any of the VSP parameters.
Shows possible areas to address. Does not identify causes.
FRAM (Pacific Fisheries Management Council) (5.4.2)
Harvest Simulation Model X Not often at population
level
CTC (Pacific Salmon Commission) (5.4.2)
Harvest Simulation Model X Not often at population
level
NMFS Hydro BiOp; Kareiva et al. 2002; Greene, in prep.
Matrix population model. Specify life-stage transition probabilities (for 2+ life stages); calculate sensitivity of population growth rate to changes in life-stage specific mortalities.
X X?
X?
predicts effects of improvements in life-stage specific mortalities on population growth rate; allows tradeoff analyses
Does not help in identifying links between actions and life-stage-specific mortality rates; data-intensive
PasRas Model for chinook (Gretchen Osterhout)
Based on Nickleson/ Lawson coho model.structured.
X ? ? ?
Models the effects of havbitat quality, eatuaries, disease, harvest regimes, etc. on population and is age-
Proportional Migration, Lawson and Comstock (2000) (5.4.2)
Models abundances over two dimensions of space (multiple sequential fisheries) and time. Uses cohort analysis
X ? ?
Includes incidental mortalities and sampling recognition rates.
Has been used for impacts of selective fisheries and could be adapted to relate results for the timing and spatial aspects of the VSP parameters.
31

Newman model (Newman 1999) (5.4.2)
Cohort analysis; one fishery X
Impacts on wild stocks when hatchery stocks are targeted.
VRAPPuget Sound chinook 4d rule. (5.4.2)
Spawner-Recruit simulation of population based on model, management, and environmental stochasticity
X X
Risk assessment of various harvest
proposals on extinction given current abundance
and productivity parameters
Allows static or changing environmental factors, uncertainty in management, and process error for spawner-recruit function. Isolates the effects of harvest relative to other H’s
Is sensitive to assumptions of survival and starting population size.
Frieberg Model (in prep)
Cohort run reconstruction X
Tests effects of various harvest strategies on population abundance
32

3.3.2.3 Hatcheries
Question: What are the plausible hypotheses for how hatchery management actions affect the demographic, genetic, and ecological processes that determine the current and future VSP characteristics of a population? What are the key assumptions and uncertainties?
This question asks planners to identify a conceptual model that links hatchery actions and their effects on demographic, genetic, and ecological processes that could change the current characteristics of a population towards the desired future characteristics.
Hatchery actions can influence the demographic, genetic, and ecological process operating on a population. These in turn affect abundance, productivity, spatial structure and diversity of natural populations, depending on 1) the magnitude of the hatchery effects on the demographic, genetic, and ecological process and 2) the degree of reproductive and ecological separation between the hatchery-produced and naturally produced fish. For example, large hatchery programs that control the photoperiod, rearing environment, feeding, and growth and size of the fish may have potentially greater effects than small hatchery programs that use natural rearing conditions. Likewise, hatchery programs where most of the hatchery produced fish spawn in the wild are more likely to affect the characteristics of the natural population than hatchery programs where most of the fish do not spawn in the wild.
The key VSP characteristics can be described quantitatively using a variety of metrics (e.g., number of reproducing adults or juvenile outmigrants, number of recruits per spawner, number of redds per kilometers, or number of outmigrant life history types, etc.) or qualitatively by status relative to viability (e.g., high, moderate, or low risk). Descriptions of key characteristics are necessary for current conditions and future conditions, such as short-term (1-5 years), or moderate-term (5-25 years), or long-term planning horizons (> 25 years).
An important characteristic of hatchery actions is that they may have unavoidable conflicting effects on population characteristics. These should be identifiable from the conceptual model. For example, using hatcheries to increase juvenile survival and the number of adults spawning in the wild may increase overall abundance of naturally produced fish but decrease productivity or diversity.
There are many ways to begin formulating a conceptual model. One approach would be to list types of hatchery actions, their effects on current and future population characteristics, and the assumption and uncertainties about the effects of those actions on ecological, genetic, and demographic processes (Table 7).
Tools and Applications. The following tools and applications may help develop a conceptual model that links hatchery actions and their effects on demographic, genetic, and ecological processes that could change the current characteristics of a population towards the desired future characteristics. For general overviews, the reports of the Hatchery Scientific Review Group (HSRG) include matrices showing the effects of each hatchery program on each wild population within a river basin.
33

1) Stock Assessment Reports—Recent characteristics of chinook salmon populations are available from a variety of sources. These include:a) Salmon and Steelhead Stock Inventory (SASSI; WDFW and WWTIT 1994)b) Salmonid Stock Inventory (SaSI; http://www.wa.gov/wdfw/fish/sassi/intro.htm)c) NMFS Status Reviews (Myers et al. 1998)d) Resource Management Plans (WDFW and WWTIT 2001, 2002)e) Consultants’ Reports (e.g., Cramer et al. 1999)f) Unpublished, watershed-specific analyses by the co-managers.
2) Watershed Recovery Planning. Watershed recovery groups are developing desired future characteristics of populations as watershed recovery planning targets (see Section 4.2).
3) Literature Reviews. The general effects of hatcheries on population characteristics have been described in a variety of scientific reviews and texts, including but not limited to Allendorf and Ryman 1987; Steward and Bjornn 1990; Hard 1992; Tave 1993; Busack and Currens 1995; Campton 1995; Flagg et al. 2000.
Evaluation. The working hypothesis may be judged relative to how well it addresses each of the following questions:
1) Do the desired characteristics of the populations address VSP characteristics?2) Does the description of recent conditions use the best available data?3) Does the conceptual model of hatchery actions relate current and future characteristics of
the population?4) Does the analysis describe the uncertainty of the conclusions?
Who Provides? The working hypothesis for hatcheries will be developed by WDFW and the Puget Sound treaty tribes.
34

Table 7. Collecting information for a conceptual model of the effects of hatchery actions on abundance (A), productivity (P), diversity (D), and spatial structure (SS) in a watershed for current conditions (C) and desired future conditions (F).
Effects on Target Species NORs Effects on Non-Target SpeciesA P D SS A P D SS
Activity C F C F C F C F C F C F C F C F Assumptions about Processes Uncertainties Brood selection Brood collection Mating Rearing Release Management of returning adults
Other fish disposition
Facility Impacts
35

3.3.2.4 Integrated
Question: What are the characteristics of an integrated plan for harvest, hatchery, and habitat that we hypothesize would be consistent with achieving the planning targets for the VSP parameters of the population?
The status of salmon populations is a result of the cumulative effects of natural and human-caused environmental factors on salmon throughout their life cycle (Fig. 2). Considering the effects of one factor at a time (e.g., harvest, habitat, or hatchery management actions) on salmon population characteristics is more tractable from a technical standpoint, but such estimates of effects are sure to be wrong in most instances. The question above asks managers to consider suites of habitat, harvest, and hatchery actions together, especially with a view towards how these factors interact to affect salmon population characteristics.
Developing an “integrated” plan for management of hatcheries, harvest and habitat to achieve desired salmon population responses will involve technical comparisons of actions in one sector with different combinations of actions in the other “H’s”. The comparison of isolated vs. integrated actions can be both within an “H” or among “H”’s. For example, a comparison of habitat actions might reveal that an upstream improvement to spawning gravel quality will not result in increased population size because a downstream blockage is not going to be reversed. A comparison of hatchery and habitat actions might reveal that planned release numbers will overwhelm a habitat slated to be improved; thereby preventing the expected effect of the habitat action from occurring.
Through the process of examining the interactions between suites of actions in habitat, hatchery and harvest management, an hypothesis(es) can be developed that describes the predicted cumulative effects of management in all “H” sectors. For each set of management characteristics hypothesized to be consistent with achieving planning targets, a strategic approach to identifying specific actions can be developed (see Section 3.3.3).
Tools and Applications. There are a number of analyses and tools that have the capability to predict that cumulative effects of more than one “H” on salmon populations. Most of the tools listed in Table 8 link the effects of “H’s” on abundance and productivity of salmon populations, thus, tools for predicting the integrated effects of “H’s” on diversity and spatial structure will be much more qualitative. The EDT model is useful for predicting the cumulative effects of habitat
36
Figure 2. Example of the interactions among habitat, hatchery, and harvest management actions and their potential effects on the VSP parameters of a population.
Habitat Actions
Landscape Processes
Aquatic Habitat
Conditions
VSP Parameters (Abundance, Productivity, Diversity, Spatial Structure)
Hatchery Actions
Harvest Actions
Demographic Processes
Ecological Processes (Species)
Genetic Processes
37

Table 8. Examples of tools for conducting analyses that integrate the potential effects of habitat, harvest and hatchery management actions on VSP parameters. [Note: this table is draft and is not complete].
Approach/Tool Tool FundamentalsAbility to Assess VSP Parameters Action-VSP
Links Benefits Uncertainties/Risks ApplicationsA P D S
Matrix population models
Specify life-stage transition probabilities (for 2+ life stages); calculate sensitivity of population growth rate to changes in life-stage specific mortalities.
X X X
predicts effects of improvements in life-stage specific mortalities on population growth rate; allows tradeoff analyses
Does not help in identifying links between actions and life-stage-specific mortality rates; data-intensive
NMFS Hydro Biop; Kareiva et al. 2002; Greene, in prep.
Population dynamic models using recruit/spawner functions
X X X X
Integrates well with EDT approach to habitat modeling.
Hilborn model (SHIRAZ—Sharma et al. 2002);
Nickleson and Lawson
Habitat-based, spatially explicit life-cycle model. Can predict a population’s response to changes in habitat condition and harvest management.
X
X
X Spatially explicit.
Nickleson and Lawson (1998)
38

actions throughout a watershed. Similarly, the SHIRAZ model can be used to predict the effects of habitat conditions and processes on salmon throughout a watershed, and it also can be used to explore interactions among hatchery, harvest and habitat management on salmon populations (Sharma et al. 2002). The Viability and Risk Assessment Procedure (VRAP) is useful for predicting the integrated effects of habitat actions and harvest management strategies.
Evaluation. The certainty of the integrated working hypothesis can be evaluated by addressing the following questions:
1)Do desired characteristics of the populations address all four VSP characteristics?2)Does description of recent conditions use the best available data?3)Are the conceptual models of habitat, harvest, and hatchery actions related to each other so
that one can predict the current and future characteristics of the population?4)Does the analysis describe certainty of the information included and the resulting
conclusions?
Who Provides. The integrated working hypothesis will be developed by WDFW, the Puget Sound Treaty tribes, watershed planning groups, and the TRT.
3.3.3. Identify Strategies
A strategy describes the general approach that, when viewed in the context of the working hypothesis, is likely to improve the status of the population. Strategies are not specific actions, but provide guidance for the subsequent identification of projects and/or management actions.
3.3.3.1 Habitat
Question: What types and sequence of habitat management strategies does the working hypothesis suggest will be needed to achieve the planning targets? How do these strategies address uncertainty?
Recognition of the complexities of the environment, and the limitations of single species management, has resulted in new approaches to natural resource planning that emphasize landscape scale processes and the interconnections of populations, communities, and ecosystems (Christensen et al. 1996; Spence et al. 1996). This approach recognizes that actions that “reduce complexity and diversity in order to increase productivity of particular ecosystem components may be deficient in key ecosystem processes and, therefore, less stable and less sustainable” (Christensen et al. 1996). Habitat management strategies that emphasize the role of habitat forming processes and their interconnections are most likely to result in the persistence of the aquatic habitat conditions necessary to sustain a salmonid population (see Box 2).
Strategy selection should be driven by the working hypothesis, but socio-economic factors that influence the time frame, funding, and societal constraints on habitat management actions will also influence the identification and evaluation of a strategy. Restoration of pre-disturbance
39

aquatic functions and related physical, chemical, and biological characteristics may not be feasible throughout the entire range of a population. Under these conditions, the certainty of achieving the VSP parameters for the population is reduced, and long-term anthropogenic intervention will likely be required.
Tools and Applications. Numerous references are available to identify potential strategies consistent with the working hypothesis (cf. NRC (1992; 1995); Frissell (1993); Frissell et al. (1996); Spence et al. (1996); and Roni et al. 2002; Beechie et al. 2002). These typically group potential strategies by the habitat attribute or process that they address (Gregory and Bisson 1996; Mobrand et al. 1997), or provide a matrix that links a single strategy with one or more habitat attributes or processes (Table 9).
The NRC (1992) provided guidance on a preferred sequence for restoring watershed processes:
1) Restore the natural sediment and water regime. Regime refers to at least two time scales: the daily-to-seasonal variation in water and sediment loads, and the annual-to-decadal patterns of floods and droughts.
2) Restore a natural channel geometry, if restoration of the water and sediment regime alone does not.
3) Restore the natural riparian plant community, which becomes a functioning part of the channel geometry and floodplain/riparian hydrology. This steps is necessary only if the plant community does not restore itself upon achievement of objectives 1 and 2.
4) Restore native aquatic plants and animals, if they do not recolonize on their own.
Evaluation. Does the plan explain: 1) the linkage between the planning target, the working hypothesis, and the strategy; 2) the rationale for the selection of this strategy versus other options; 3) the sequencing of elements included in the strategy; and 4) how the strategy addresses uncertainty and preserves options if the working hypothesis proves to be incorrect?
Who Provides. Habitat strategies will be identified by the watershed planning groups.
40
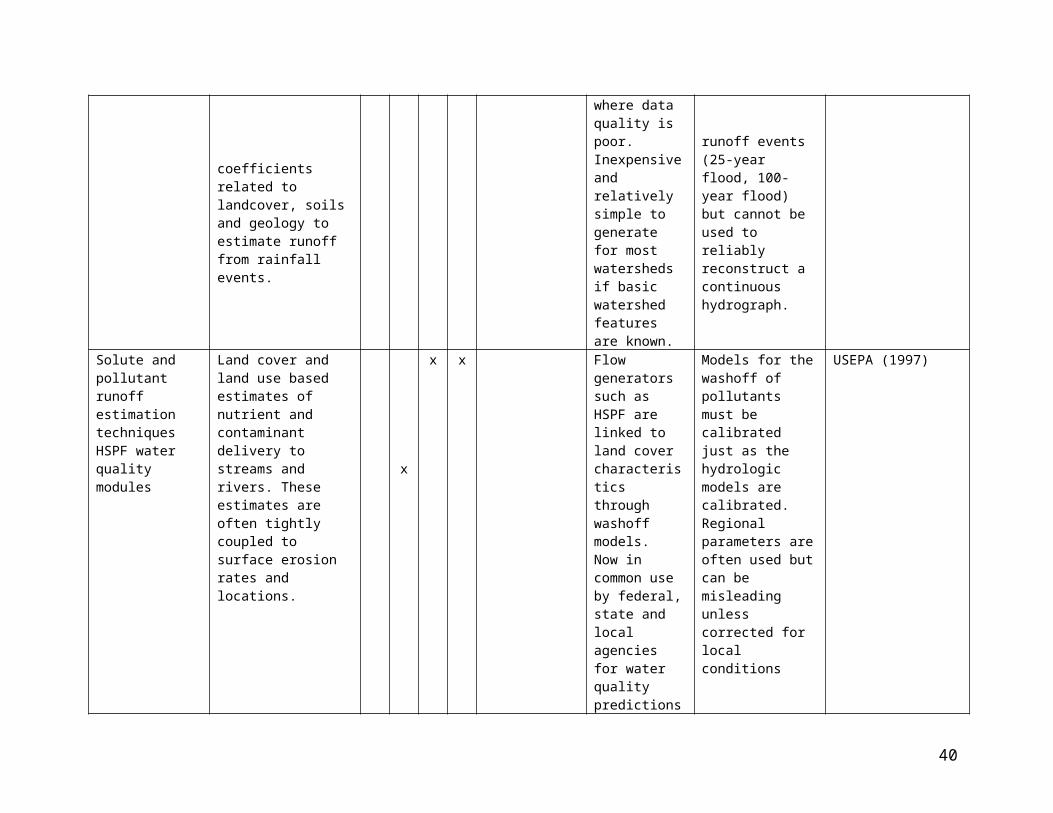
Box 2. Framework for Development of Habitat Management Strategies
Four habitat management strategies directions are to protect, restore, rehabilitate, and substitute (NRC 1992; 1995). The complex interactions between habitat forming processes, landscape ecology, and salmomid populations typically result in a decreased certainty of maintaining the desired aquatic habitat conditions and achieving the VSP parameters of a population as the habitat management strategy moves from protection to substitution.
Evaluation Criteria Strategy Type
Incr
easi
ng U
ncer
tain
ty o
f Suc
cess
in A
chie
ving
VSP
Par
amet
ers
Incr
easi
ng O
ngoi
ng R
esou
rce
Inpu
ts to
Ach
ieve
Via
bilit
y
Incr
easi
ng E
valu
atio
n an
d M
onito
ring
Req
uire
d
Protect Protect watersheds where the VSP parameters of the population are supported by fully functioning natural processes.
Significant uncertainty exists in our ability to predict the effectiveness and temporal pattern of restoration, rehabilitation, and substitution actions. By protecting watersheds with functioning natural processes, we provide refuges for recolonization and maximize the likelihood that our strategy will contribute to achieving the VSP parameters of the population.Restore Restore watersheds where habitat degradation has
occurred but recovery of natural processes is feasible.
Restoration is the “reestablishment of predisturbance aquatic functions and related physical, chemical, and biological characteristics” (NRC, 1992). Restoration can occur through either a passive or active approach:
Passive. Anthropogenic controls are removed and natural processes, such as floods, natural revegetation, or erosion are allowed to restore the watershed to the predisturbance conditions.
Active. Anthropogenic controls are removed and natural processes are supplemented by actions intended to accelerate the return to predisturbance conditions.
Rehabilitate Rehabilitate watersheds where restoration is not feasible, but actions can be taken to improve aquatic habitat and improve the VSP parameters of the population.
Rehabilitation occurs when ecosystem processes or functions are partially re-established. Continual anthropogenic intervention will likely be required because restoration of the underlying ecosystem processes has not occurred.Substitute Substitute habitat features in watersheds where
rehabilitation is not possible.
Substitution is the creation of habitat features lost through anthropogenic degradation. Substitution can range from the creation of a spawning channel to adding logs to create a pool.
41

Table 9. Examples of alternative habitat management strategies associated with habitat forming processes or aquatic habitat characteristics.
Aquatic Habitat Characteristic
Linked Physical Environmental
Characteristics and Processes
Protect Restore Rehabilitate Substitute
Channel Scour GeomorphologyHydrologySediment Transport
Maintain natural processes in watershed
through education, conservation easements,
or acquisition.
1) Remove dikes.2) Allow natural cycle
of succession to occur throughout the watershed.
1) Move dikes back from channel.
2) Institute land-use regulations that reduce the impervious area within the watershed.
1) Install stormwater retention system.
2) Construct off-site spawning channel.
Water Temperature HydrologySuccession
Same 1) Allow natural cycle of succession to occur in all riparian areas of the watershed.
1) Revegetate riparian areas as needed to maintain water temperature.
2) Institute instream flow regulations to maintain appropriate water temperature.
1) Store and provide water as necessary to maintain appropriate water temperature.
Fine Sediments GeomorphologyHydrologySediment Transport
Same 1) Close roads in areas with steep slopes.
2) Allow natural cycle of succession to occur throughout the watershed.
1) Institute improved road maintenance procedures
2) Revegetate riparian areas as needed to minimize sediment inputs.
1) Install sediment traps.2) Construct off-site
spawning channel.
Estuarine Acreage GeomorphologyHydrologySediment Transport
Same 1) Remove dikes. 1) Remove dikes blocking access to habitat likely to be usable.
2) Institute land-use regulations prohibiting adverse modification of estuarine areas.
1) Create new estuarine habitat.
42
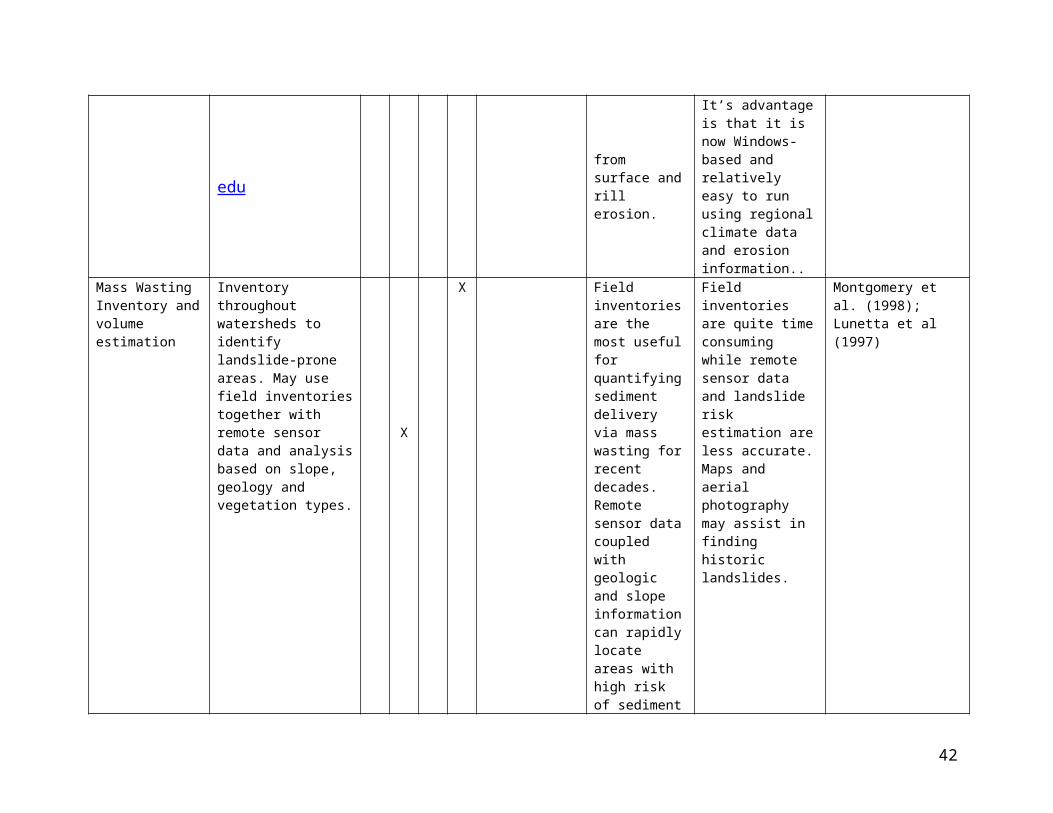
3.3.3.2 Harvest
Question: What types and sequence of fishery management strategies do the working hypotheses suggest will be needed to help achieve the planning targets? How do these strategies address uncertainty?
Using the population assessments and working hypotheses identified above, recovery planners can begin to develop strategies. The strategies describe a general approach to adjusting harvest practices that will help achieve the planning targets for abundance, productivity, diversity, and spatial structure. More specific actions will be addressed in section 3.3.2. The examples given below are for illustration only; they do not encompass all possible situations. A given solution may not work in all systems or may be discarded for an alternate approach. Strategies must be developed that are workable for the water basin, conditions, and population in question.
Examples of strategies for given working hypotheses are:
1) Situation: Escapements for population X have remained relatively constant while recruitment abundance has declined; harvest practices have decreased harvest rates in an attempt to increase escapement without success. Hypothesis: The current harvest rate is not limiting recruitment of population X. If other factors were held constant, the number of recruits would increase. Strategy: An analysis of allowable exploitation rates resulting in less than a 5% chance of extinction and an increase in spawners given all other factors remain constant or improve gives an allowable rate of x% for all fishing mortality on this population. Continue to monitor annual exploitation rate and spawning escapement. Monitor other mortalities that might take place between fishing and spawning; these could confound the relationship between harvest and escapement abundance. Monitor other factors and the abundance and productivity to outmigration to determine if assumed conditions have been met or detect changes in productivity and capacity.
2) Situation: The productivity of population Y is decreasing over time measured in adult recruits per spawner, even during the period of relatively low but constant marine survival. Ocean fishery F1 has been demonstrated to take mostly 5 year old fish. Hypothesis: The productivity of population Y is being reduced by the selective removal of age 5 fish, which have more eggs than age 3 or 4 fish. Strategy: An upper size limit or gear modification will be implemented on fishery F1 to reduce harvest rate on the older fish. If age samples from the escapement have not been taken before, a program should be started to get annual age distribution of the spawners to see if the proportion of 5+ year olds changes.
3) Situation: The run timing (when the population enters the river basin) of population Z is shortening over time, reducing the diversity of the population concerning run spawning timing. An inriver fishery targeting hatchery returns, but also causing indirect mortalities on the wild population Y, takes place early in the season. Hypothesis: The mortality to the wild fish early in the season has altered the average return timing of the population to later in the year. Strategy: The fishery should be regulated to allow more wild fish to
43

spawn early in the season to restore the original range of spawn timing. This may include drastically reducing or eliminating, for a while, fisheries early in the season. Catch and return timing of the run should be monitored on a daily or weekly time scale. (The eventual solution might also entail a hatchery strategy of changing hatchery timing to not interfere with the wild timing, but for now we are looking for possible harvest solutions. Hatchery/harvest interactions will be addressed under the integrated section below.)
4) Situation: Population AA is has been observed spawning in the lower reaches of its historical spawning area; the populations use of its spatial structure is expanding . The coho fishery that takes place inriver within the chinook lower spawning area has recently instituted chinook non-retention regulations. Hypothesis: The chinook non-retention regulation is resulting in rebuilding of the spatial structure of the spawning population Strategy: Maintain the chinook non-retention regulations. Harvest managers might alternatively choose to move the coho fishery below all chinook spawning grounds or employ pulse fishing to pass chinook through to their spawning grounds.
Tools and Applications. Strategies need to be developed that will work for the circumstances of the water basin and population. Simulation models can help determine whether the general approach defined by the strategy will give the desired results. Harvest models such as FRAM can be used to determine effects of varying harvest rates by fisheries. Matrix models based on stage specific mortalities can be used to determine effects of changing mortality on specific age or size groups. Habitat use surveys, biological data sampling by appropriate time strata will provide the data necessary to determine whether the hypotheses were correct and monitor the effects of the harvest actions.
Evaluation. Does the plan explain: 1) the linkage between the planning target, the working hypothesis, and the strategy; 2) the rationale for the selection of this strategy versus other options; 3) the sequencing of elements included in the strategy; and 4) how the strategy addresses uncertainty and preserves options if the working hypothesis proves to be incorrect?
Strategies need scientific and public review. Changes in management actions should include a monitoring and evaluation plan that collects the type of data and in such a way that is can be used to test the hypotheses.
Who Provides. The strategies will be developed by the Puget Sound treaty tribes and WDFW.
3.3.3.3 Hatcheries
Question: What types and sequence of hatchery management strategies do the working hypotheses suggest will be needed to help achieve the planning targets? How do these strategies address uncertainty?
This question asks planners to 1) classify hatchery actions into strategies, 2) identify alternative strategies that are consistent with achieving planning targets over different planning horizons based on which key populations characteristics are most important to protect or recover immediately versus later, and 3) to choose between the strategies.
44

The overall strategy for hatcheries should be to minimize negative effects on viability by balancing the potential conflicting effects of hatchery actions on the key population characteristics (abundance, productivity, spatial structure, and diversity). This involves identifying conflicts, agreeing on priorities, and making trade-offs over time, space, and different species. For example, in the short-term using hatcheries to increase abundance rapidly to prevent immediate risk of extinction may be necessary even though it results in loss of diversity. The same hatchery actions to increase abundance at the cost of diversity when populations are no longer at immediate risk of extinction may not minimize negative effects on viability. Consequently, to balance risks and benefits over time, the hatchery strategy would need to change once the population was no longer at immediate risk of extinction.
Identifying planning horizons that link key desired population characteristics and different hatchery strategies is essential for accomplishing the overall hatchery strategy. These planning horizons need to be consistent with the expected timeframe for the effects of different actions for harvest and habitat to occur, because they also affect the population characteristics. Consequently, hatchery strategies and other recovery actions should be explicitly linked by the planning horizons. Identifying hatchery strategies involves combining the key characteristics of hatchery programs to have different effects on the population characteristics, such changes in direction (e.g., increases versus decreases in abundance) or levels of risk (e.g., low risk of loss of diversity versus moderate risk). Potential key characteristics of hatchery programs include the 1) target species, 2) goals (e.g., enhancement of harvest or maintenance, recovery, or reintroduction of natural populations), 3) its duration (e.g., short-term, long-term, in perpetuity), 4) its size, and 5) the degree of reproductive and ecological similarity and separation between the hatchery-produced fish and naturally produced fish. For example, a small, short-term program for reintroduction is a different strategy than a large, long-term population maintenance program or a small, harvest enhancement program where hatchery and natural fish are isolated. Table 10 illustrates the risks and benefits of four different strategies for coho salmon hatcheries (WDFW and WWTIT 199?), which were classified based on management intent of the hatchery (recovery or harvest) and degree of reproductive integration with natural stocks. If the key characteristics of a hatchery program are not obvious, describing the assumptions about how hatchery actions affect genetic, ecological, and demographic processes and the uncertainties (Fig. 1) will help identify these characteristics.
Tools and Applications. Examples of tools include:1) Comprehensive Coho Salmon Management Plan (WDFW and WWTIT 199?)2) Comprehensive Chinook Salmon Management Plan (WDFW and WWTIT 2002)3) Artificial Production Review?
Evaluation. Does the plan explain: 1) the linkage between the planning target, the working hypothesis, and the strategy; 2) the rationale for the selection of this strategy versus other options; 3) the sequencing of elements included in the strategy; and 4) how the strategy addresses uncertainty and preserves options if the working hypothesis proves to be incorrect?
Do the hatchery strategies have different effects on VSP population characteristics?
45

1. Does the plan explain the link between the working hypothesis, the strategies, and the planning targets?
2. Does the plan identify and justify priorities for sequencing the strategies? 3. Do the hatchery strategies address uncertainty?
Who Provides. The strategies will be developed by the Puget Sound treaty tribes and WDFW.
3.3.3.4 Integrated
Question: What integrated set of management strategies does the working hypothesis suggest will be needed to achieve the planning targets?
This question asks planners to 1) consider the proposed habitat, harvest, and hatchery strategies together, 2) identify alternative sets of strategies that are consistent with achieving planning targets according to the hypothesis(es). These strategies should be developed over different time-planning horizons, based on which key population characteristics are most important to protect or recover immediately versus those that can be recovered later, and 3) to narrow the possible combinations of strategies to one or very few alternatives for implementation. More than one management strategy may be chosen as an interim approach in order to account for uncertainty in the predicted outcomes of alternative strategies.
Tools and Applications. General guidance on how to develop management strategies from hypotheses about how salmon populations are affected by the “H’s” is scarce. [cite refs of examples from existing plans or guidance? EDT’s Yakima or Nisqually plans? ] Both EDT and SHIRAZ have the capability to incorporate information about management actions in hatchery, harvest and habitat arenas into predictions of resulting salmon population characteristics.
Evaluation. Does the strategy explain: 1) the linkage between the planning target, the working hypothesis, and the strategy; 2) the rationale for the selection of a particular strategy versus other options; 3) the sequencing of elements included in the strategy; and 4) how the strategy addresses uncertainty and preserves options if the working hypothesis proves to be incorrect?
Who Provides. The integrated strategy will be developed by WDFW, the Puget Sound Treaty tribes, and watershed groups.
46

Table 10. Four strategies from the Comprehensive Coho Salmon Management Plan based on the management goal (harvest or recovery) and degree of reproductive integration with the naturally produced fish (integration or isolation), and their risks, benefits, and critical elements.
Integrated Recovery Project Integrated Harvest ProjectPotential Biological Hazards: Loss of genetic diversity, loss of fitness in the wild Increased competition, predation on wild fish of same or other species. Masking of natural population status
Potential Biological Benefits: Increased population abundance and distribution Prevent extinction Accelerated recovery Avoidance of inbreeding and genetic bottlenecks Increase in ecological diversity and nutrients
Summary: Integrated recovery provides a way of increasing numbers of at-risk, naturally spawning fish. Successfully creating a composite natural/artificial population without risking the long-term natural sustainability of the natural population involves careful planning and is likely to be technically and logistically difficult in many cases.
Critical Elements: Analysis of extinction risk versus risks of project Causes of decline must be addressed in order for the natural population to
recover - an artificial propagation project on its own is unlikely to be sufficient to achieve recovery
Multiple safeguards and intensive monitoring to reduce uncertainties and detect hazards
Multiple approaches to spread risk and optimize success Performance measures and endpoints for judging success or failure.
Potential Biological Hazards: Loss of genetic diversity, loss of fitness in the wild Increased competition, predation on wild fish of same or other
species. Masking of natural population status Unintentional overharvest of wild fish while fishing for artificially
propagated fish.
Potential Harvest Benefits: Provide fishery when alternative strategies would not Provide opportunity to transition from non-native to locally adapted
stocks
Summary: Integrated harvest provides a way of using the adaptations of a local brood stock to increase returns to fisheries. It also makes managing some risks associated with artificial production more difficult than (successfully) isolated propagation because negative genetic and ecological impacts may be amplified due to the high level of interaction between natural and hatchery fish. Ability of program to succeed may depend heavily on successful harvest management.
Critical Elements: Healthy local stock Careful monitoring of health natural production Multiple approaches to spread risk and optimize success Successful integration with harvest management
47

Table 7. Continued.
Isolated Recovery Project Isolated Harvest ProjectPotential Biological Hazards: Genetic or phenotypic change during captivity may jeopardize successful
reintroduction Unrecoverable losses due to hatchery facility failure
Potential Biological Benefits: Prevention of extinction/ recovery of population Preservation of genetic diversity (i.e. a gene bank) for future uses Speeding of recovery compared to non-hatchery alternatives (can produce
a large increase in abundance relatively quickly)
Summary: Isolated recovery projects may provide insurance against population extinction, but should be considered to be experimental due do to limited experience with these programs. The likelihood of successfully reintroduction to the wild is likely to decrease with increasing generations in an artificial environment.
Critical elements: Analysis of extinction risks versus risks of project Causes of decline must be addressed in order for the natural population to
recover - an artificial propagation project on its own is unlikely to be sufficient to achieve recovery
Multiple facility and operational safeguards Monitoring and evaluation Multiple approaches to spread risk and optimize success Performance measure and endpoints standards for judging success
Potential Biological Hazards: Loss of genetic diversity, loss of fitness in the wild Increased competition, predation on wild fish of same or other
species. Masking of natural population status Unintentional overharvest of wild fish while fishing for artificially
propagated fish.
Potential Harvest Benefits: Provide harvest in areas where wild populations are unproductive or
not viable
Summary: If successful, isolated harvest can provide substantial harvest augmentation while minimizing impacts on wild fish, but isolation may be difficult to achieve or have only limited applications. Ability of program to succeed may depend heavily on successful harvest management.
Critical elements: Strategy that will assure a high degree of isolation of hatchery and
natural fish Ability to separate wild and hatchery fish Adequate monitoring to assess degree of isolation Successful integration with harvest management
48

3.3.4. Evaluate Management Actions In Place
It is important to understanding the potential effects of the management actions already in place prior to identifying what additional actions are necessary to achieve the planning targets. In some watersheds, extensive modifications to management may already have occurred, including the Forest and Fish Agreement, habitat restoration and protection projects, and the comanagers’ resource management plans for hatcheries and harvest. In this section, all management actions in place that will affect the population are compiled and evaluated.
3.3.4.1 Habitat
Question: What habitat management actions are in place? In conjunction with other ongoing changes to the watershed (buildout, delayed response to changes in habitat forming processes), what will be their net effect on the VSP parameters of the population? What are the key unknown or uncertainties?
Habitat management actions that are in place include the Forest and Fish Agreement (1999), habitat conservation plans, and habitat restoration and protection projects funded by the Salmon Recovery Funding Board (SRFB). Many watersheds also have a prioritized list of projects that, assuming funding is provided in the future, may also have a beneficial impact on the population. All actions may not have beneficial effects. For example, increased human population density and buildout, although conducted in a manner consistent with current ordinances, could have a negative impact on some populations.
Tools and Applications. See Section 3.3.2.1.
Evaluation. See Section 3.3.2.1.
Who Provides. Identification and evaluation of the habitat management actions in place will be completed by the watershed planning groups with assistance from the TRT, WDFW, and the Puget Sound treaty tribes.
3.3.4.2 Harvest
Question: What harvest management actions are in place? In conjunction with other ongoing changes in fisheries, what will be their net effect on the VSP parameters of the population? What are the key unknowns or uncertainties?
How do fishing regimes (including those that target or incidentally impact mixed populations of chinook) affect the population in question? How is the fishing mortality for this population distributed over space and time relative to the population’s migration pattern, spatial structure, age structure, and run timing? Are all sources of fishing mortality (direct and indirect, ocean and terminal, commercial, recreational, subsistence, and ceremonial) accounted for? What harvest actions have been taken to address effects on VSP parameters? What is known about the response of the population to their implementation?
49

Tools and Applications. Habitat use surveys, mark-recapture studies, and biological data sampling by appropriate time strata will provide the data necessary to determine whether the hypotheses were correct and monitor the effects of the harvest actions. Managers may use focused harvest management strategies such as pulse fishing, non-retention regulations, and temporal and spatial fishery shaping to achieve goals.
Most harvest tools currently used to project the effects of proposed harvest plans on abundance do not directly address impacts on productivity, growth rate, diversity, or spatial structure at the population level. However, in some cases, these models can provide information about these other VSP parameters. For example, the FRAM model used by the Pacific Fisheries Management Council and the CTC Model (CTC 1993) used by the Pacific Salmon Commission both model the effects of mixed stock fisheries on abundance of individual populations or population aggregates. The models are age-specific for harvest, and thus to some extent address the issues of gear selectivity on size or age. A change in age distribution over time could theoretically be detected.
To determine if changing fishing harvest patterns will affect abundance, productivity, diversity, or spatial distribution, one needs a model that looks at fishing mortalities over a fine time (less than a year) and spatial grid. The models developed or adapted for evaluating selective fisheries do this, as they are evaluating the effect of different types of fisheries on the ultimate escapement. The “Proportional Migration” (PM) model ( Lawson and Comstock 2000) and the Newman model (1999) both were developed to determine the amount of mortality to hatchery and natural stocks given selective fisheries (selective on a visual mark, e.g., adipose fin clip). The PM model allows multiple fisheries and gears, selective and non- selective.
To measure the effect of harvest rate fishery plans on the extinction rate, the Viability and Risk Assessment Procedure (VRAP) model has been used. This model estimates extinction probabilities for a range of harvest rates given assumptions/data about the stock spawner recruit function, environmental stochasticity, and management precision. This model addresses abundance and growth rate.
The Nickelson and Lawson (1998) metapopulation model, originally developed for Oregon coastal coho salmon, could be used to project changes in spatial structure occurring as a result of different harvest management regimes under different habitat conditions. The time scale for this analysis would be over several generations of chinook salmon.
Tools/analyses to measure the effect of harvest actions on diversity and spatial structure would require examining the harvest and spawning population at a finer scale of space and time than river basin and year. Test fisheries could be used to mark fish followed by spawning ground recapture studies to determine where which fish from proposed fishing sites are being impacted (see Skagit run reconstruction efforts, ref??).
Evaluation. An evaluation of the estimation technique used should examine the assumption and data needs of the various models and compare with data availability for the population in question. Does the population have a coded-wire-tagged indicator stock that can be used in the
50
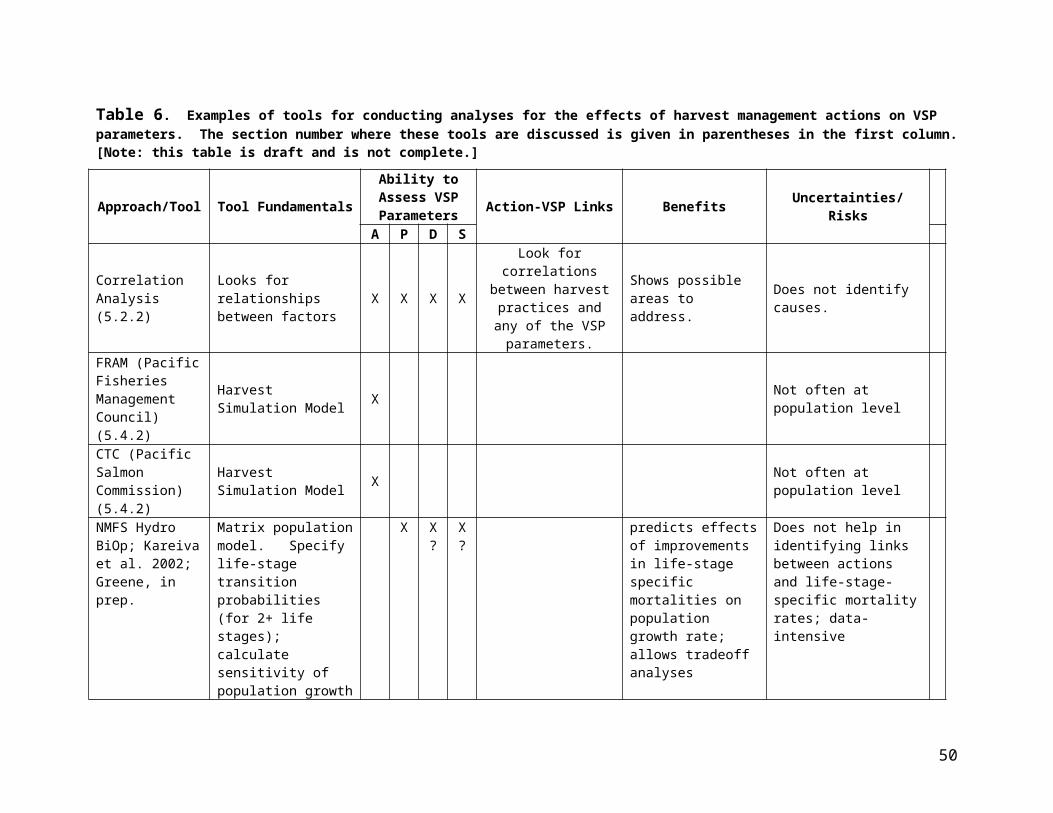
harvest models to estimate harvest rates? Or must a surrogate (hopefully similar, but from another area) or aggregated indicator stock be used? What is the length of the time series of escapement and harvest data? Does the model assume constant survivals and mortalities from other factors over this period of time and is that reasonable? How accurate/reliable are harvest and escapement estimates? Changes in management actions should include a monitoring and evaluation plan that collects the type of data and in such a way that is can be used to test the hypotheses. Models should be peer reviewed.
Who Provides. The current actions will be reviewed by the Puget Sound treaty tribes and WDFW.
3.3.4.3 Hatcheries
Question: What hatchery management actions are in place? In conjunction with changes occurring in hatcheries, what will be their net effect on the VSP parameters? What are the key uncertainties and assumptions?
This question asks planners to evaluate whether current hatchery management actions are consistent with the proposed strategy and what the expected net effects of these actions will be.
This step is important to be able to allow planners to identify whether current hatchery management actions alone will lead to desired future characteristics of the population and whether current actions of all the hatchery programs in the watershed are consistent with the with the desired strategy. An important part of this assessment is identifying the key assumptions and uncertainties that the conclusions are based on and evaluating how much violations or changes in these assumptions might affect the overall conclusion.
Tools and Applications. Examples of sources of information on the operation of hatchery programs and an evaluation of their impacts include:
1. HGMPs. Provide a detailed description of the operation of a hatchery program.2. Equilibrium Brood Document and Future Brood Planning Document. Documents
required under the Puget Sound Salmon Management Plan that describe brood stock, egg take, and production goals.
3. HSRG reviews. Evaluate the consistency of the goal and operation of a hatchery program.
4. ESA Section 7, 10, or 4(d) Resource Management Plan reviews. Provides description of operation of hatchery program and evaluates consistency with the ESA.
5. Benefit Risk Assessment Procedure. Analyses used by WDFW to evaluate the risks of artificial production in the ecological context of the watershed.
Who Provides. The current actions will be reviewed by the Puget Sound treaty tribes and WDFW.
51

3.3.4.4 Integrated
Question: What is the predicted status of the VSP parameters of the population in 20, 50, and 100 years, after accounting for the management actions that have been implemented?
This question asks managers and planners to project the combined effects of all the planned harvest, hatchery, and habitat management actions on the population at three different points in the future. There are several important considerations that arise in this exercise. One important one is that, along with the effects of an action, the time scale of the effect must be predicted. A change in harvest rate, for example, will immediately affect the population performance within one or a few generations, while the effects of converting streambank vegetation from a plowed field to old growth forest will take several centuries to fully manifest themselves.
Another key consideration in the integrated analysis is that the harvest, hatchery, and habitat actions work together synergistically. For example, historically functioning salmon habitat contained marine-derived nutrients that were provided by adult salmon returning from the ocean. Harvest management actions must consider marine-derived nutrient requirements in restored freshwater habitats so that sufficient adult fish are returned to those areas for needed ecological functioning. As another example, hatchery programs must be designed to complement the current needs of natural production and must change as habitat improvements change the factors limiting natural production. A supplementation program may be designed to take advantage of rearing habitat that is underutilized because poor quality spawning habitat limits overall production. The size of this type of program should be reduced once spawning habitat is improved and no longer limits the ability of natural production to supply juveniles to the rearing habitat. One can easily construct a complex network of “H” management interactions such as these, and such considerations should be part of planning for recovery.
Tools and Applications. Current efforts to integrate the assessment of habitat, hatchery, and harvest effects involve developing interfaces between existing models that focus on one of these areas. One critical point of interface among such models is that population status needs to be expressed in common units by all models. This is why we stress the use of the four VSP parameters so strongly in this guidance. If the individual models express abundance, productivity, diversity, and spatial distribution in common units, then the next step of combining the models will be possible. Besides common units for expressing population status, models for the individual “H”’s need to be compatible in terms of geographical and temporal scale in order to be compatible.
The SHIRAZ model appears to have many of the characteristics necessary for investigating the cumulative effects of actions in the three “H”’s (Sharma et al. 2002). The within-river geographical scale is appropriate for investigating the effects of habitat attributes on salmon life stages, the model treats the effects of hatchery and wild fish that coexist in freshwater reaches, and the model expresses population performance in a way that allows the effects of different harvest management strategies to be compared.
The Nickleson and Lawson (1998) habitat-based life-cycle model also lends itself to some integrated analyses. This approach deals with spatial distribution as well as abundance and
52

productivity. It treats the way that fish use the available habitat, dependent upon both environmental attributes and abundance. It is unique in that it can address the combined effects of habitat and harvest management and that it addresses spatial distribution as well as abundance and productivity.
Either of these models, or others that may be considered, would have to be extended to include interactions among all the H’s as they affect all four VSP parameters. The effort would be worthwhile because there are likely to be unanticipated interactions among the H’s that would not be revealed by focus on each H individually.
Evaluation. Useful models will include significant effects from harvest, hatchey, and habitat management and will address population performance in terms of all four VSP parameters. Furthermore, as additional “H’s” are included in models, incorporating uncertainty in the reporting of results becomes ever more important.
Who Provides. The integrated analysis of actions already in place will be conducted by WDFW, the Puget Sound Treaty tribes, and watershed groups.
3.3.5. Identify and Evaluate Action Scenario
3.3.5.1 Habitat
Question: In addition to the action scenarios already in place, what habitat action scenario is needed to provide the aquatic habitat conditions, habitat forming processes, and population characteristics that are consistent with the planning targets for the VSP parameters? How does this action scenario address uncertainty?
Site-specific management actions are a required element of a recovery plan (section 4(f)(B)(i)). Selection of the management actions will likely require an evaluation of the costs, benefits, and uncertainties associated with a range of alternatives. Predicting the benefits of potential management actions will often involve three steps: 1) predicting the effect of the action on habitat forming processes; 2) predicting the effect of the habitat forming process on aquatic habitat; and 3) predicting the effect of the change in aquatic habitat on the abundance, growth rate/productivity, diversity, and spatial structure of the population.
Management actions can be categorized as follows: 1) active restoration; 2) passive restoration; and 3) preservation. Preservation is often identified as the highest priority due to the high costs often associated with active restoration and the extended time frame for passive restoration (Lestelle et al.1996). Tools and Applications. EDT provides a systematic method to help identify the stream reaches of subbasins with the greatest importance for restoration or preservation (Appendix 1, Figure 2). The preservation splice algorithm in EDT sequentially degrades a stream reach, predicts the change in population productivity, abundance, and diversity, resets the reach to current habitat
53

conditions, and moves to the next reach. The benefits of preserving each reach can then be compared and prioritized.
EDT also provides a method predicting the benefits of other habitat management actions, but those actions that restore access to isolated habitat, improve fish passage, or provide screening are likely to be the simplest to evaluate. The evaluation of other actions are likely to have a high level of uncertainty, and/or require expert opinion in the absence of an empirically derived model. As discussed previously, the manual for watershed analysis (WFP 1997) provides a compendium of tools for process assessment, including appendix chapters on mass wasting, surface erosion, hydrology, riparian, and water quality.
An extensive review of methods for evaluating action scenarios is provided by Beechie et al. (2002).
Evaluation. See section 3.3.3.1.
3.3.5.2 Harvest
Question: In addition to the actions already in place, what harvest action scenario is needed to provide the population characteristics that are consistent with the planning targets for VSP parameters? How does this action scenario address uncertainty?
Which of these strategies are not addressed by current harvest practices? If current harvest management actions are not deemed to be addressing critical aspects of improving VSP parameters of the population, additional scenarios may be developed. These may consist of several alternative scenarios, as there is usually more than one way to approach/solve a problem.
Tools and Applications. See section 3.3.4.2.
Evaluation. See section 3.3.4.2.
Who Provides. The comanagers will develop harvest action scenarios. Implementation of any of these scenarios must be done through the Puget Sound Salmon Management Plan, Pacific Salmon Commission, and Pacific Fisheries Management Council processes. Thus it is important to have alternative scenarios for these bodies to consider, and the bodies, working with the comanagers, may come up with other scenarios that will address the concerns presented in the working hypotheses.
3.3.5.3 Hatcheries
Question: In addition to the actions already in place, what hatchery action scenario is needed to provide the population characteristics that are consistent with the planning targets for VSP parameters? How does this action scenario address uncertainty?
54

This question builds on the assessment needed for the previous question (see 3.3..4.3). If current conditions are unlikely to achieve planning targets within the desired time, planners need to identify what additional actions will be necessary to achieve the targets. The question also builds on the answers to the earlier question that addressed sequencing alternative strategies. In this question, the planners have the opportunity to describe the sequences or alternative sequences.
Tools and Applications1. HSRG review2. ESA Section 7, 10, or 4(d) Resource Management Plan reviews3. Risk Analyses
Evaluation1. Are the actions consistent with the strategy?2. Was the model for the analysis of effects described and justified?3. Did the analysis address all VSP parameters?4. Were all the relevant processes affecting VSP included in the model?5. Does the analysis describe uncertainty?6.
Who Provides. The action scenario will be developed by the Puget Sound treaty tribes and WDFW.
3.3.5.4 Integrated Assessment
Question: What are the predicted effect of the proposed harvest, hatchery, and habitat management actions on the VSP parameters of the population in 20, 50, and 100 years?
Tools and Applications. See section 3.3.4.4.
Evaluation. See section 3.3.4.4.
Who Provides. The integrated assessment of action scenarios will be provided by WDFW, the Puget Sound Treaty Tribes, and watershed groups.
3.3.6. Frame Monitoring Plan
3.3.6.1 Habitat
Question: What types of monitoring should be linked to the action scenarios to assess if the actions were implemented as proposed? How will we determine if the actions had the hypothesized effect on the habitat and the VSP parameters of the population?
Tools and Applications.
Evaluation.
55

Who Provides.
3.3.6.2 Harvest
Question: What types of monitoring should be linked to the action scenarios to assess if the actions were implemented as proposed? How will we determine if the actions had the hypothesized effect on harvest and the VSP parameters of the population?
Tools and Applications.
Evaluation.
Who Provides.
3.3.6.3 Hatcheries
Question: What types of monitoring should be linked to the action scenarios to assess if the actions were implemented as proposed? How will we determine if the actions had the hypothesized effect on hatcheries and the VSP parameters of the population?
Tools and Applications.
Evaluation.
Who Provides.
3.3.6.4 Integrated
Question: How will we determine if the recovery plan had the hypothesized effect on the VSP parameters of the population?
Tools and Applications.
Evaluation.
Who Provides.
3.3.7. Frame Adaptive Management Plan
56

3.3.7.1 Habitat
Question: How will the results from the monitoring program be used to modify habitat programs?
Tools and Applications.
Evaluation.
Who Provides.
3.3.7.2 Harvest
Question: How will the results from the monitoring program be used to modify harvest programs?
Tools and Applications.
Evaluation.
Who Provides.
3.3.7.3 Hatcheries
Question: How will the results from the monitoring program be used to modify hatchery programs?
Tools and Applications.
Evaluation.
Who Provides.
3.3.7.4 Integrated
Question: How will the results from the monitoring program be used to develop an integrated harvest, hatchery, and habitat response?
Tools and Applications.
Evaluation.
Who Provides.
57

3.4 Review Regional Recovery Scenarios
Question: Does the suite of proposed actions result in a set of populations meeting the criteria for recovery of the ESU?
3.5 Finalize Plan
3.5.1. Finalize Action Scenarios
Question: What additional management actions are necessary for the populations to achieve the planning targets and for a set of populations to meet the criteria for recovery of the ESU?
3.5.2. Finalize Monitoring Plan
3.5.2.1 Habitat
Question: Were habitat management actions implemented as proposed? Did the actions have the hypothesized effect? Did the VSP parameters of the population respond as hypothesized?
Tools and Applications.
Evaluation.
Who Provides.
3.5.2.2 Harvest
Question: Were harvest management actions implemented as proposed? Did the actions have the hypothesized effect? Did the VSP parameters of the population respond as hypothesized?
Tools and Applications.
Evaluation.
Who Provides.
3.5.2.3 Hatcheries
Question: Were harvest management actions implemented as proposed? Did the actions have the hypothesized effect? Did the VSP parameters of the population respond as hypothesized?
58

Tools and Applications.
Evaluation.
Who Provides.
3.5.2.4 Integrated
Question: Did the recovery plan have the hypothesized effect on the VSP parameters of the population?
Tools and Applications.
Evaluation.
Who Provides.
3.5.3. Finalize Adaptive Management Plan
3.5.3.1 Habitat
Question: How will results from the monitoring program be used to modify habitat programs?
Tools and Applications.
Evaluation.
Who Provides.
3.5.3.2 Harvest
Question: How will results from the monitoring program be used to modify harvest programs?
Tools and Applications.
Evaluation.
Who Provides.
59

3.5.3.3 Hatcheries
Question: How will results from the monitoring program be used to modify harvest programs?
Tools and Applications.
Evaluation.
Who Provides.
3.5.3.4 Integrated
Question: How will results from the monitoring program be used to develop an integrated habitat, harvest, hatchery management response?
Tools and Applications.
Evaluation.
Who Provides.
4.0Administrative Criteria
5.0Assistance
6.0References
Beamer, E. M., T. J. Beechie, B. S. Perkowski and J. R. Klochak. 2002. Appendix B. Restoration of habitat-forming processes: An applied restoration strategy for the Skagit River. Pp. 241-282 in Beechie, T.J., P. Roni and E.A. Steel (eds.) 2002. Ecosystem recovery planning for listed salmon: An integrated assessment approach for salmon habitat. NOAA Fisheries, Northwest Fisheries Science Center.
Beechie, T.J., and S. Bolton. 1999. An approach to restoring salmonid habitat-forming processes in Pacific Northwest watersheds. Fisheries 24(4): 6-15.
Beechie, T.J., P. Roni, and E.A. Steel (eds.). 2002. In prep. Ecosystem recovery planning for listed salmon: An integrated assessment approach for salmon habitat. NOAA Fisheries, Northwest Fisheries Science Center. Available at http://www.nwfsc.noaa.gov/ec/wpg/reports.htm.
60
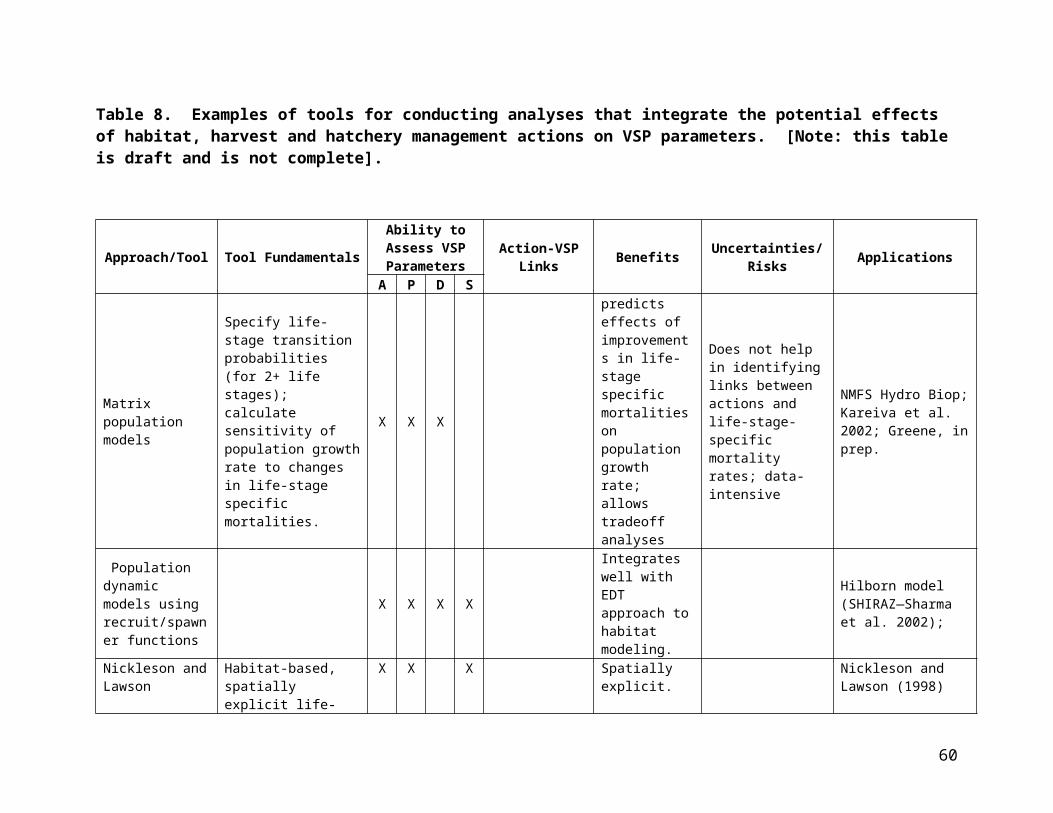
Benda, L.E. and T. Dunne. 1987. Sediment routing by debris flows. In R.L. Beschta, G.E. Grant, G. Ice and F.J. Swanson, eds. Erosion and Sedimentation in the Pacific Rim. IAHS Publication 165, International Association of Hydrological Sciences, Wallingford, UK.
Benda, L.E. and T.W. Cundy. 1990. Predicting deposition of debris flows in mountain channels. Canadian Geotechnical Journal 27: 409-417.
Bettinger, P., K.N. Johnson, J. Brooks, A.A. Herstrom, and T.A. Spies. 2000. Phase I Report on Developing Landscaape Simulation Methodologies for Assessing the Sustainability of Forest Resources in Western Oregon. CLAMS Simulation Modeling Report. Oregon Department of Forestry. Salem, OR.
Bicknell, B.R., J.C. Imhoff, J.L. Kittle, jr., A.S, Donigian, and R.C. Johanson. 1997. HSPF: User’s manual for versioin 11. USEPA National Exposure Research Laboratory, Athens, GA. EPA/600/R-97/080. 755 p.
Bjornn, T.C., and D.W. Reiser. 1991. Habitat requirements of salmonids in streams. Pages 83-138 in W.R. Meehan, ed. Influences of forest and rangeland management on salmonid fishes and their habitats. Special Publication 19. American Fisheries Society, Bethesda, Maryland.
Christensen, N.L., A.M. Bartuska, J.H. Brown, S. Carpenter, C. D’Antonio, R. Francis, J.F. Franklin, J.A. MacMahon, R.F. Noss, D.J. Parsons, C.H. Peterson, M.G. Turner, and R.G. Woomansee. 1996. The report of the Ecological Society of America Committee on the Scientific Basis for Ecosystem Management. Ecological Society of America, Washington, D.C.
Collins, B.D., and D.R. Montgomery. In press. Importance of archival and process studies to characterizing pre-settlement riverine geomorphic processes and habitat in the Puget lowland. In J.M. Dorava, D.R. Montgomery, B. Palcsak, and F. Fitzpatrick (eds.). Geomorphic processes and riverine habitat. American Geophysical Union, Washington, D.C.
CTC (Chinook Technical Committee). 1993. Users guide for the Pacific Salmon Commission Chinook Technical committee chinook model. Pacific Salmon Commission, Vancouver, British Columbia.
Dietrich, W. E., and T. Dunne. 1978. Sediment budget for a small catchment in mountainous terrain. Z. Geomorph. N.F. Suppl. Bd. 29: 191-206.
Dunne, T. and L. Leopold. 1978. Water in Environmental Planning. University of Washington Pres, Seatle, WA.
Dunning, J.B., B.J. Danielson, and H.R. Pulliam. 1992. Ecological processes that affect populatioins in complex landscapes. Oikos 65: 169-175.
61

Fieberg, J. In prep. Role of model uncertainty in assessing harvest strategies for chinook salmon.
Ford, M., P. Budy, C. Busack, D. Chapman, T. Cooney, T. Fisher, J. Geiselman, T. Hillman, J. Lukas, C. Peven, C. Toole, E. Weber, and P. Wilson. 1999. Upper Columbia River steelhead and spring chinook salmon population structure and biological requirements. Draft report prepared by the Upper Columbia River Steelhead and Spring Chinook Salmon Biological Requirements Committee, dated 14 December 1999. National Marine Fisheries Service, Northwest Fisheries Science Center.
Frissell. C.A. 1993. A new strategy for watershed restoration and recovery of Pacific salmon in the Pacific Northwest. Pacific Rivers Council, Eugene, Oregon.
Frissell, C.A., and R.K. Nawa. 1992. Incidence of causes of physical failure of artificial habitat structures in streams of western Oregon and Washington. North American Journal of Fisheries Management 12: 182-197.
Gordon, McMahon and Finlayson. 1992. Hydrology for Ecologists. J. Wiley and Sons, New York.
Greene, C. and T. Beechie. 2002. Habitat-specific population dynamics of ocean-type chinook salmon (Oncorhynchus tshawytcha) in Puget Sound. In review.
Gregory, S.V., and P.A. Bisson. 1996. Degradation and loss of anadromous salmonid habitat in the Pacific Northwest. Pages 277-314 in D.J. Stouder, P.A. Bisson, and R.J. Naiman, eds. Pacific salmon and their ecosystems. Chapman and Hall, New York, New York.
Haas, A. and B. Collins. 2001. A historical analysis of habitat alterations in the Snohomish River Valley, Washington, since the mid-19th century: Implications for chinook and coho salmon. Report prepared for the Snohomish County Dept. of Public Works, Surface Water Management Division for the Tulalip Tribes. Everett and Marysville, Washinton.
Holsinger, L. 2002. Appendix A. Estimating chinook spawner capacity for the Stillaguamish River. Pages 215-240 in T.J. Beechie, P. Roni, and E.A. Steel (eds.). Ecosystem recovery planning for listed salmon: An integrated assessment approach for salmon habitat. NOAA Fisheries, Northwest Fisheries Science Center.
ISAB (Independent Science Advisory Board). 2001. Model synthesis report. An analysis of decision support tools used in Columbia River basin salmon management. Executive summary. ISAB 2001-1a. Northwest Power Planning Council., Portland, Oregon.
Lawson, P.W. and R.M. Comstock. 2000. The proportional migration selective fishery model. Pages 423-433 in E.E. Knudsen, C.R. Steward, D.D. MacDonald, J.E. Williams, and D.W. Reiser, eds. Sustainable fisheries management. Lewis Publishers, New York, New York.
62
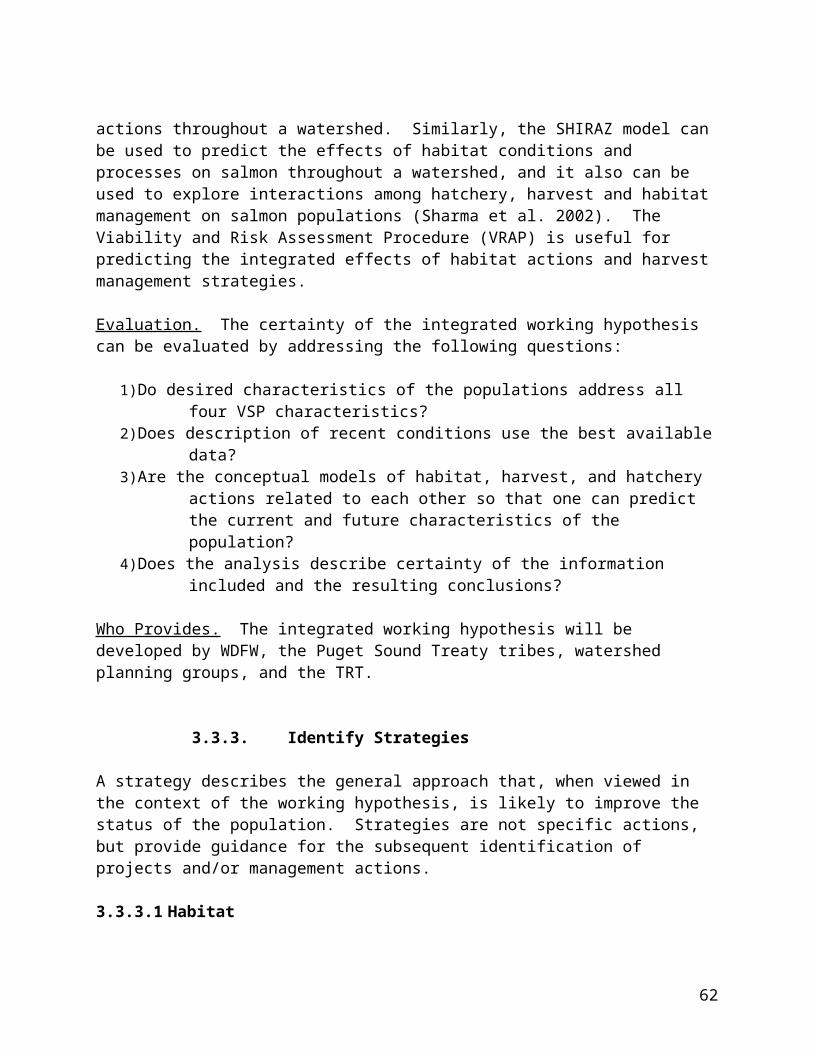
Lucchetti, G., D. Martin, L. Benda, and D. Schreffler. In development. Core Areas for Salmon Recovery in King County, WA. Department of Natural Resources and Parks, King County, WA.
Lunetta, R.S., B. Cosentino, D.R. Montgomery, E.M. Beamer, and T.J. Beechie. 1997. GIS-based evaluation of salmon habitat in the Pacific Northwest. Photogramm. Eng. Remote Sensing 63(10): 1219-1229.
McElhany, P., M.H. Ruckelhaus, M.J. Ford, T.C. Wainwright, and E.P. Bjorkstedt. 2000. Viable salmonid populations and the recovery of evolutionarily significant units. U.S. Dept. Commer., NOAA Tech. Memo. NMFS-NWFSC-42, 156p.
Mladenoff, D.J., G.E. Host, J. Boeder and T.R. Crow. 1996. LANDIS: a spatial model of forest landscape disturbance, succession and management. In: M.F. Goodchild, L.T. Stayaert and B.O. Parks, eds. GIS and Environmental Modeling, pp. 175-180. National Center for Geographic Information and Analysis, Santa Barnara, CA.
Mladenoff, D.J. and H.S. He. 1999. Design and Behavior of LANDIS, an object oriented model forest landscape disturbance and succession. In D.J. Mladenoff and W.L. Baker, eds, Spatial Modeling of Forest Landscape Change: Approaches and Applications, pp. 125-162. Cambridge University Press, Cambridge, UK.
Mobrand, L. E., J. A. Lichatowich, L. C. Lestelle, and T. S. Vogel. 1997. An approach to describing ecosystem performance “through the eyes of salmon”. Canadian Journal of Fisheries and Aquatic Sciences 54: 2964-2973.
Montgomery, D. R., T. B. Abbe, N.P. Peterson, J. M. Buffington, K.M. Schmidt and J. D. Stock. 1996. Distribution of bedrock and alluvial channels in forested mountain drainage basins. Nature 381: 587-589.
Montgomery, D.R., and J. M. Buffington. 1998. Channel processes, classification, and response. Pages 13-42 in R. Naiman and R. Bilby, eds. River ecology and management: Lessons from the Pacific coastal ecoregion. Springer-Verlag, New York, New York.
Montgomery, D.R., and W.E. Dietrich. 1994. A physically based model for the topographic control on shallow landsliding. Water Resour. Res. 30: 1153-1171.
Montgomery, D.R., K. Sullivan, and H.M. Greenberg. 1998. Regional test of a model for shallow landsliding. Hydrol. Process. 12: 943-955.
Morgan, R.P.C. 1995. Soil Erosion and Conservation. Longman Group, London, UK.Nearing, M.A. , G.R. Foster, L.J. Lane, and S.C. Finkner. 1989. A process-based soil erosion
model for USDA-Water Erosion Prediction technology. Trans. American Soc. Agric Eng. 32: 1587-1593.
63

Newman, K.B. 1998. State space modeling of animal movement and mortality with application to salmon. Biometrics 54: 274-297.
Newman, K.B. 2000. Hierarchic modeling of salmon harvest and migration. Journal of Agricultural, Biological, and Environmental Statistics. 5(4): 430-455.
Nickelson, T E and P W Lawson. 1998. Population viability of coho salmon, Oncorhynchus kisutch, in Oregon coastal basins: application of a habitat-based life cycle model. Canadian Journal of Fisheries and Aquatic Sciences 55: 2383-2392.
NMFS (National Marine Fisheries Service). 1996. Coastal salmon conservation: Working guidance for comprehensive salmon restoration initiatives on the Pacific Coast. National Marine Fisheries Service, Northwest Region.
Noon, B.R. and K.S. McKelvey. 1996. A common framework for conservation planning: linking individual and metapopulation models. In D.R. McCullough, ed. Metapopulationns and Wildlife Conservation, pp. 139-166. Island Press, Washington, DC.
Norris, J.G. 2000. Defining equivalent exploitation rate reduction policies for endangered salmon stocks. Pages 451-466 in E.E. Knudsen, C.R. Steward, D.D. MacDonald, J.E. Williams, and D.W. Reiser, eds. Sustainable fisheries management. Lewis Publishers New York, New York.
NRC (National Research Council). 1992. Restoration of aquatic ecosystems: Science, technology, and public technology. National Academy Press, Washington, D.C.
NRC (National Research Council). 1996. Upstream: Salmon and society in the Pacific Northwest. National Academy Press, Washington, D.C.
NWPPC (Northwest Power Planning Council). 2001. Technical guide for subbasin planners. NWPPC document 2001-20, 24p. Portland, Oregon.
Reeves, G. H., L.E. Benda, K.M. Burnett, P.A. Bisson, and J.K. Sedell. 1995. A disturbance-based ecosystem approach to maintaining and restoring freshwater habitats of evolutionarily significant units of anadromous salmonids in the Pacific Northwest. American Fisheries Society Symposium 17: 334-349.
Roni, P., T.J. Beechie, R.E. Bilby, F.E. Leonetti, M.M. Pollock, and G.R. Pess. 2002. A review of stream restoration techniques and a hierarchical strategy for prioritizing restoration in Pacific Northwest watersheds. North American Journal of Fisheries Management 22: 1-20.
Ruckelhshaus, M., T. Beechie, E. Buhle, C. Busack, K. Currens, J. Doyle, W. Graeber, L. Holsinger, A. Marshall, K. Rawson, N. Sands, J. Scott. In prep. Independent populations of chinook salmon in Puget Sound. NOAA Fisheries, Northwest Fisheries Science Center.
64

Schaller, H. and T. Cooney. 1992. Draft Snake River fall chinook life-cycle simulation model for recovery and rebuilding plan evaluation. Washington Department of Fisheries, Olympia, Washington.
Sharma R., A. B. Cooper and R. Hilborn. 2002. A quantitative framework for analysis of habitat and hatchery practices on Pacific salmon. In review.
Simenstad, C. 2000. Commencement Bay aquatic ecosystem assessment: Ecosystem-scale restoration for juvenile salmon recovery. Contract report for City of Tacoma, Washington Department of Natural Resources, and U.S. Environmental Protection Report. Wetland Ecosystem Team, School of Fisheries,University of Washington, Seattle, Washington.
Spence, B.C., G.A. Lomnicky, R.M. Hughes, and R.P. Novitzki. 1996. An ecosystem approach to salmonid conservation. TR-4501-96-6057. ManTech Environmental Services Corp., Corvallis, Oregon.
Storck, P., L. Bowling, P. Wetherbee, and D. Lettenmaier. 1998. Application of a GIS-based distributed hydrology model for prediction of forest harvest effects on peak stream flow in the Pacific Northwest. Hydrological Processses 12: 889- 904.
WDFW and PNPTT (Washington Department of Fish and Wildlife and Point No Point Treaty Tribes). 2000. Summer chum salmon conservation initiative. Washington Department of Fish and Wildlife, Olympia, Washington.
WFRB (Washington Forest Practices Board). 1997. Standard methodology for conducting watershed analysis. Version 4.0. Washington Forest Practices Board, Olympia, Washington.
65

Appendix 1. Examples of diagnostics available from EDT.
66

Appendix 1, Figure 1. Identification of key habitat factors limiting the viability of the Puyallup chinook salmon population. Large black circles indicate the habitat attributes and locations with the most significant effects. (Source: Mobrand Biometrics 2001)
67

Appendix 1, Figure 2. Relative importance of geographic areas for protection measures for Puyallup chinook salmon. Areas are ranked and assigned to benefit categories according to potential (A is highest) to affect population performance. (Source: Mobrand Biometrics 2001)
68