developing and using a simple regression equation. the simple regression model is based on the...
TRANSCRIPT

Developing and Using a Simple Developing and Using a Simple Regression Equation.Regression Equation.
The simple regression model is The simple regression model is based on the equation for a based on the equation for a
straight line:straight line:
Yc = A+BXYc = A+BX

Yc = A+BXYc = A+BX
where:where:
Yc = the calculated or estimated Yc = the calculated or estimated value for the dependent variablevalue for the dependent variable
A= the Y interceptA= the Y interceptB= the slope of the lineB= the slope of the line
X = independent variableX = independent variable

Graphical depiction of a Graphical depiction of a regression lineregression line
Y
X0
Yc = A + BX
intercept
slope

Corn Yield
40.0
60.0
80.0
100.0
120.0
140.0
160.0
1955 1960 1965 1970 1975 1980 1985 1990 1995 2000 2005
year
bu/a
cre
Corn Yield
How can we estimate next year’s yield?

Corn Yield
40.0
60.0
80.0
100.0
120.0
140.0
160.0
1955 1960 1965 1970 1975 1980 1985 1990 1995 2000 2005
year
bu/a
cre
Corn Yield
How can we estimate next year’s yield?
Take the average?

Corn Yields
40.0
60.0
80.0
100.0
120.0
140.0
160.0
Year
bu/a
cre Predicted Yield
Actual Yield

What might trend represent?What might trend represent?

What might trend represent?What might trend represent?
Technology – innovation – Technology – innovation – hybrid developmenthybrid development

We want to find the line of best We want to find the line of best fit.fit.
An average just won’t cut it.An average just won’t cut it.
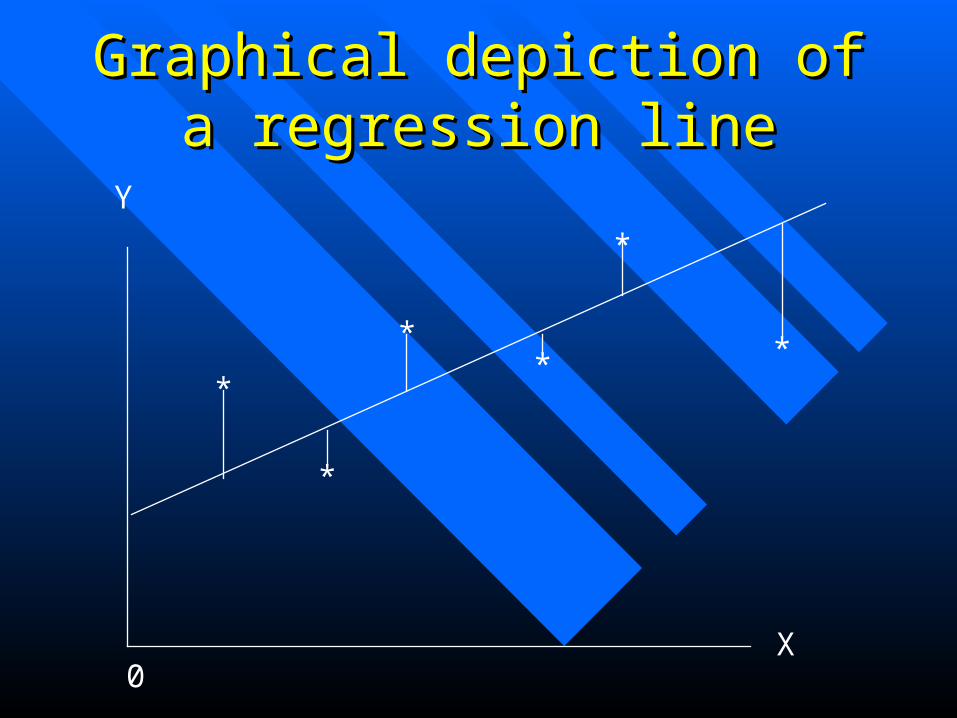
Graphical depiction of a Graphical depiction of a regression lineregression line
Y
X0
*
*
** *
*

Step 1: Collect the historical Step 1: Collect the historical data.data.
Every Y observation must have Every Y observation must have an X.an X.

Step 2: Step 2: Put the data in a tabular form.Put the data in a tabular form.
year yield1994 138.01995 112.01996 127.01997 126.01999 134.01999 134.02000 141.9
X Y

year yield1994 138.01995 112.01996 127.01997 126.01998 134.01999 134.02000 141.9
1997 130.41429
Step 3:Step 3:
Calculate the Means of X and YCalculate the Means of X and Y

X = X = X X ----- ----- n n
Y = Y = Y Y ----- ----- n n

Step 4. Compute the slope (B) Step 4. Compute the slope (B) and Y intercept (A)and Y intercept (A)
B = XY – n X Y ------------------ X2 – n X2

A = Y - BXA = Y - BX

X Yyear yield X * Y X * X1994 138.0 275172 39760361995 112.0 223440 39800251996 127.0 253492 39840161997 126.0 251622 39880091998 134.0 267732 39920041999 134.0 267866 39960012000 141.9 283800 4000000
Means 1997 130.414 1823124 27916091

B = 1823124 – (7*1997*130.414)B = 1823124 – (7*1997*130.414)____________________________________________27916091 – (7*1997*1997)27916091 – (7*1997*1997)
B = (67/28) = 2.3929B = (67/28) = 2.3929

A = 130.414 – (2.3929 * 1997)A = 130.414 – (2.3929 * 1997)
A = 130.414 – 4778.62A = 130.414 – 4778.62
A = - 4648.20A = - 4648.20
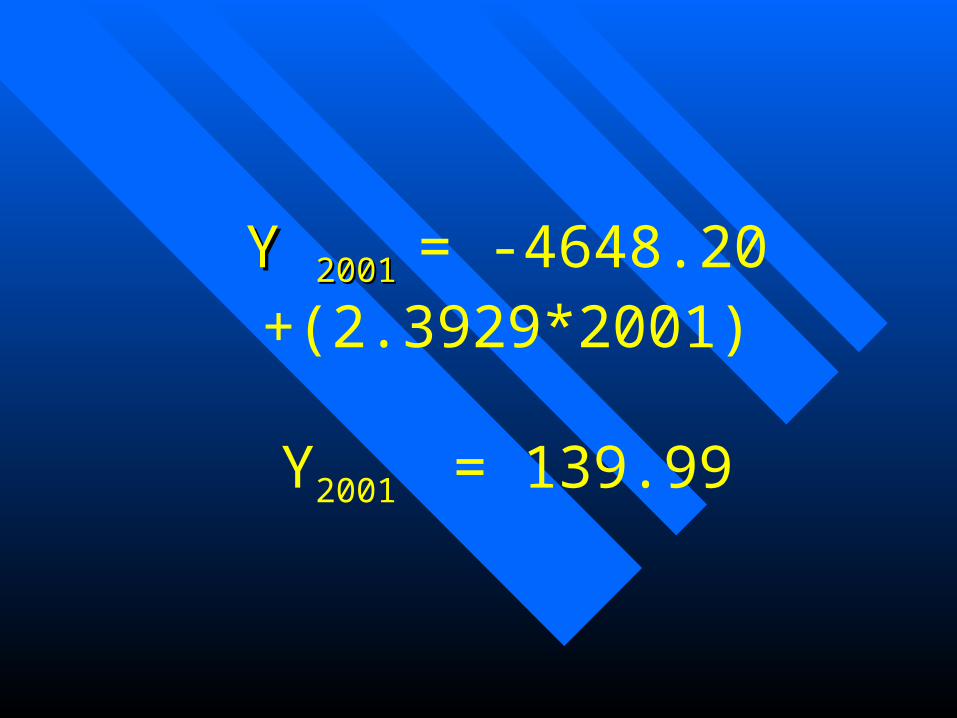
Y Y 2001 2001 = -4648.20 +(2.3929*2001)
Y2001 = 139.99

Corn Yields
100.0
105.0
110.0
115.0
120.0
125.0
130.0
135.0
140.0
145.0
1994 1995 1996 1997 1998 1999 2000
Year
bu/a
cre Actual Yields
Projected Yields