developing and validating a fast and accurate method to
TRANSCRIPT
City University of New York (CUNY) City University of New York (CUNY)
CUNY Academic Works CUNY Academic Works
Student Theses John Jay College of Criminal Justice
Spring 5-15-2019
Developing and Validating a Fast and Accurate Method to Developing and Validating a Fast and Accurate Method to
Quantify 18 Antidepressants in Oral Fluid Samples Using SPE and Quantify 18 Antidepressants in Oral Fluid Samples Using SPE and
LC-MSMS LC-MSMS
Sanghee S. Shin CUNY John Jay College, [email protected]
How does access to this work benefit you? Let us know!
More information about this work at: https://academicworks.cuny.edu/jj_etds/104
Discover additional works at: https://academicworks.cuny.edu
This work is made publicly available by the City University of New York (CUNY). Contact: [email protected]
Developing and Validating a Fast and Accurate Method to Quantify 18 Antidepressants
in Oral Fluid Samples Using SPE and LC-MSMS
A Thesis Presented in Partial Fulfillment of the Requirements for the Degree of
Master of Science in Forensic Science
John Jay College of Criminal Justice
The City University of New York
Sanghee Sarah Shin
May of 2019
Developing and Validating a Fast and Accurate Method to Detect the Presence of 18
Antidepressants in Oral Fluid Samples Using SPE and LC-MSMS
Sanghee Sarah Shin
This thesis has been presented to and accepted by the office of Graduate Studies, John
Jay College of Criminal Justice in partial fulfillment of the requirements for the degree of
Master of Science in Forensic Science.
Thesis Advisor: Dr. Concheiro-Guisan, Ph. D
Second Reader: Dr. Chen, Ph. D
Third Reader: Dr. Borg, Ph. D
Table of Contents Pages
Acknowledgments i
Abstract ii
Introduction 1– 4
Methods and Materials 5 – 15
Results 15 – 22
Discussion 22 – 25
Conclusion 25
References 26 – 28
i
Acknowledgements
The author will like to thank Professor Concheiro-Guisan, Dr. Cheng, Dr. Borg,
Dr. Stripp, and R&D lab technician of Cordant health solution for their help till the end.
Their thoughtful contribution and comments in developing and finishing this research;
along with providing resources, instruments, and funding for this research helped a lot.
Grateful for all the support.

ii
Abstract
Antidepressant drugs are one of the most widely used medicines for treating
major depressive disorders for long time periods. Oral fluid testing offers an easy and
non-invasive sample collection. Detection of antidepressants in oral fluid is important in
clinical and forensic settings, such as therapeutic drug monitoring and roadside testing for
driving under influence. We developed and validated a comprehensive liquid
chromatography tandem mass spectrometry method for 18 antidepressants (amitriptyline,
bupropion, citalopram, clomipramine, cyclobenzaprine, desipramine, desvenlafaxine,
doxepin, duloxetine, fluoxetine, imipramine, mirtazapine, nortriptyline, paroxetine,
sertraline, trazodone, trimipramine, venlafaxine) in oral fluid collected by Quantisal®
oral collection devices. 0.5 mL of Quantisal® oral fluid (125µL of neat oral fluid) was
submitted to solid-phase extraction. The chromatographic separation was performed
employing a biphenyl column in gradient mode with a total run time of 5 min. The MS
detection was achieved by multiple reaction monitoring with two transitions per
compound. The range for linearity of all analytes was from 10-1,000 ng/mL, with a limit
of quantitation of 10 ng/mL. Results of intra and inter-day’s accuracy and precision
(n=15) were all within acceptable limits, ± 20% error and ± 15% relative standard
deviation. Analyte recovery at 400 ng/mL concentration (n=15) ranged from 91-129%.
Matrix effect ranged from 73.7-157%. The internal proficiency test detected all
antidepressants with accuracy ranging from 83.1-112.1%. The authentic patient samples
showed percentage difference compare to the previously calculated concentration of
86.3-111%. This method provides for the rapid detection of 18 antidepressants in oral
fluid, which is readily applicable to a routine laboratory.

1
1. Introduction
Antidepressant drugs are one of the most widely used medicines that have been
administered to treat major depressive disorders for long periods of time (NHS, 2016).
Certain antidepressant drugs have also been used to treat anxiety and bipolar disorders in
certain cases. In the United States, one in eight Americans aged 12 or more reported
taking antidepressants between the year of 2011 to 2014 (Brody, Gu & Pratt 2017). This
number of antidepressant users increased from 7.7 to 12.7% of the adult population over
the 15-year time frame from 1999-2014 (Brody, Gu & Pratt 2017). There are different
types of antidepressant such as norepinephrine and dopamine reuptake inhibitors
(NDRIs), serotonin and norepinephrine reuptake inhibitors (SNRIs), selective serotonin
reuptake inhibitors (SSRIs), tricyclic antidepressants (TCA), and non-selective serotonin
and norepinephrine reuptake inhibitors. Most of them work to regulate neurotransmitters
such as norepinephrine or serotonin cycle in one’s brain (Coulter et al. 2010).
Antidepressants, especially TCA, have a narrow therapeutic window, so there lies
a greater risk of cardiotoxicity and central nervous system (CNS) toxicity and potentially
lethal in overdose (Castro, et al, 2008), including risk of respiratory depression (Kerr,
McGuffie, & Wilkie 2001). SSRIs are commonly prescribed among others because of
their low risk, fewer side effects, and better long-term outcomes (Binns, Egger, & Reznik
2017). Because of these reasons, there is a decrease in the prescription of TCA and rise in
SSRIs and SNRIs use (Ciraulo, Greenblatt, & Shader 2010). The growing trend for the
use of SSRIs reflects how there is a small pool of antidepressant options and favorable
profile for safety and greater risk of serotonin syndrome happening (Chan et al. 2015).
However, since the majority of antidepressants work modifying neurotransmitter levels,
2
cases related to reactions like serotonin syndrome, also known as serotonin toxicity, are
commonly observed (Kaye, Kaye, & Volpi 2013). Serotonin syndrome is a group of
symptoms caused by over-activation of both the peripheral and central postsynaptic 5HT-
1A and 5HT-2A receptors (Kaye, Kaye, & Volpi 2013). Many of the life-threatening
cases are related to the using of serotonergic drug alone or a combination of different
drugs with the serotonergic drug (Dunn, Mackay, & Mann 1999).
Oral fluid (OF) is an interesting alternative biological sample that is on the rise. It
has characteristic of being non-invasive and easy to collect; so it is suitable to be used in
the clinical, workplace, driving under influence of drug, drug treatment, and criminal
justice settings (Bosker & Huestis 2009). OF represents recent-uptake of free analyte
fraction of the drugs (parent) and its metabolite (Castro et al. 2008). OF is less prone to
adulteration than urine, and although it has a smaller window of detection time compared
to urine, the result of on-site OF analysis corresponded closely to urine analysis (Bennett
et al. 2003). Oral fluid gives similar or better positive rates and higher sensitivity of
quantification compare to urine in illicit drugs (Borg, Fey, Getto, Kunkel, & Stripp,
2015). For these reasons, OF seems to be a useful and widely available as an alternative
matrix for clinical and forensic toxicology analysis; where the tester is interested in
assessing what’s in the donor’s system at the time of drug test collection.
The main disadvantages of oral fluid include the reduction and limit of sample
volume, the required sensitivity of analytical methods to quantify multiple analytes,
several factors that affect diffusion of analyte from plasma to oral fluid (pH, particle size,
degree of protein binding, drug pKa and lipophilicity) and the possibility of oral
contamination (Bosker & Huestis 2009; Crouch 2005). OF can be collected by spitting,
3
draining, suction, or using a commercially available collection device. The collection
devices offer the advantages of collecting a fixed amount of oral fluid (normally 1 mL)
and of containing a preservative buffer that limits the instability of the drugs and
metabolites in the oral fluid. Among the different devices available, Quantisal® has been
reported in several applications of OF (Compagnone et al, 2015).
It is important to quantify antidepressants in the oral fluid because of serious
clinical and forensic implications, such as therapeutic drug monitoring (TDM) and
driving under influence (DUI). TDM of antidepressants during the treatment is key for
the success of it, to optimize the drug therapy experience for the individual patient
(Bednar et al. 2016) and also for avoiding the risk of any toxicity (Kang & Lee 2009). If a
patient misses a dose, they are likely to be associated with a discontinuation syndrome. If
a patient over medicates oneself, then it is likely to be associated with serotonin
syndrome. If a patient takes additional forms of other drugs, it may lead to serotonin
syndrome or even death due to drug-drug interactions. For antidepressants, many of the
overdose result from the combination of drugs such as monoamine oxidase inhibitors
(MAOI) and SSRI (Gilman 2006). To avoid such situations, it is important to have steady
state data of prescription drugs in chronic treatment (Ciraulo, Greenblatt, & Shader
2010).
Previous studies have shown that there are higher risks of a motor vehicle
accident with a patient who uses psychotropic drugs because psychoactive drugs may
impair judgment, thinking, or motor skills (Sansone & Sansone 2009). Antidepressants,
especially long term SSRIs users, may experience impairment of cognitive and
psychomotor functioning relevant to driving (Coulter et al. 2010). Cognition and motor
4
performance are affected or potentially interfered by patients having antidepressant
withdrawal syndrome (Sawyer & Spiller 2007) and the side effects of antidepressants
(Chihuri et al. 2017).
Much of the research was done with quantifying antidepressants in blood and
urine with different methods (Athanaselis et al. 2012; Benites et al. 2013; Fuller et al.
2013; Berm et al. 2015; Goldstein et al. 2012). A limited number of publications were
done with detection of multiple antidepressants in oral fluid. Castro et al. (2008)
presented a fully validated method for analyzing 9 antidepressants in OF using solid
phase extraction (SPE) and LC-MS/MS while OF was collected by spitting in
polypropylene tubes. Knihnicki et al. (2014) use micro-extraction by packed sorbent
(MEPS) and UHPLC-MS to detect 6 antidepressants in OF collected by Salivette® and
collected OF were pre-treated by dilution and centrifugation before analysis. Coulter et
al. (2010) presented a validated method for analyzing 16 antidepressant using LC-
MS/MS in OF by using Quantisal® .
The aim of this study was to develop a fast procedure for the determination of 18
antidepressants in oral fluid using SPE and LC-MS/MS analysis. This study could
contribute to TDM for the characterizing the steady-state concentrations of these
antidepressants in oral fluid in patients chronically prescribed and DUI involving
prescription antidepressants.
2. Materials and Methods
2.1 Reagents and chemicals

5
All 18 antidepressants (amitriptyline, bupropion, citalopram, clomipramine,
cyclobenzaprine, desipramine, desvenlafaxine, doxepin, duloxetine, fluoxetine,
imipramine, mirtazapine, nortriptyline, paroxetine, sertraline, trazodone, trimipramine,
venlafaxine) and some of their internal standards (ISTD; amitriptyline-d3, bupropion d9,
citalopramd6, desipramine d3, doxepin d3, duloxetine d3, fluoxetine d6, imipramine d3,
nortriptyline d3, venlafaxine d6, paroxetine d6, sertraline d3) were purchased from
Cerilliant (Round Rock, TX) at 1 mg/mL in methanol. Solvents and chemicals, including
methanol, dichloromethane, 2-propanol, formic acid, acetic acid, sodium acetate,
ammonium hydroxide, isopropanol, sodium phosphate, and acetone were purchased from
VWR International (Bridgeport, NJ). All solvents were high-performance liquid
chromatography grade or better.
2.2 Oral fluid collection Devices
Quantisal® devices for the collection of oral fluid specimens were obtained from
Immunalysis Corporation (Pomona, CA). The devices contain a collection pad with
volume adequacy indicator, which turns blue when 1 mL (± 10%) of oral fluid has been
collected. The pad is placed into a tube containing a buffer (3mL). The total specimen
volume for the analysis is 4 mL (1 mL oral fluid + 3 mL buffer).
2.3 Oral Fluid Specimens for method development
Blank oral fluid samples from volunteers obtained by Cordant Health laboratory
for drug analyses using saliva collection device (Quantisal® l). Authentic donor oral fluid
samples were de-identified clinical specimens obtained by Cordant Health laboratory.
6
Negative synthetic oral fluid mixed with Quantisal buffer from Immunalysis Corporation
(Pomona, CA) was used for preparation of calibrators and quality controls.
2.4 Stock solutions
A 100,000 ng/mL intermediate stock was prepared; firstly, by adding 9
antidepressants at 1 mg/mL in 10 mL volumetric flask and vortexed for a few seconds.
Then the mixture was dried completely in 40°C under a stream of nitrogen gas. Repeated
the same procedure after adding the rest of 9 antidepressants and drying it out. Ten mL of
methanol was added to the flask and was vortexed for 15 seconds. The solution was
transferred to the brown bottle labeled Antidepressant Stock 100,000 ng/mL. Other
intermediate stocks (10,000 ng/mL, 1,000 ng/mL, and 100 ng/mL) containing 18
antidepressants were made by dilution with methanol. The stock solutions were stored at
-20°C freezer.
Three working quality control (QC) standards were prepared in methanol from
separate stock material at a concentration of 100, 1,000, and 10,000 ng/mL. A deuterated
internal standard (ISTD) working solution of 10,000 ng/mL was prepared by
appropriately diluting the ISTD stock solution with 50% methanol in distilled water and
stored at -20°C freezer until the analysis.
2.5 Calibrators and QCs
Six calibrators at concentrations of 10, 20, 40, 200, 400, and 1,000 ng/mL and
three QC samples at concentrations of 40, 200, and 800 ng/mL were prepared by spiking
the corresponding calibrators’ and controls’ methanolic working solutions in 0.5 mL of
7
drug-free synthetic OF-buffer mixture (0.125 mL OF + 0.375 mL Quantisal buffer) from
Immunalysis Corporation (Pomona, CA).
2.6 Extraction procedure
An automated liquid dispenser (ALD) Cerex® 48, SPEware (Baldwin Park, CA)
and mixed mode Cerex® Trace-B cartridges 3mL 35mg, SPEware (Baldwin Park, CA)
were used in the extraction procedure. To condition the cartridge, 500 µL of methanol
and then 500 µL of distilled water was added. To activate the cartridge, 1 mL of 0.1M
sodium phosphate buffer pH 6 was added. Five hundred µL of the Quantisal® l sample
and 30 µL of ISTD at 500 ng/mL were mixed and loaded on to the cartridge. No other pH
modification was done to samples. Wash was performed with 3 mL of distilled water,
3mL of 0.1M of acetic acid, and 3mL of 25% methanol in distilled water. Cartridges were
dried with nitrogen heated to 40°C for 14 minutes. To elute the samples, 750 µL of
elution solvent (dichloromethane: isopropyl alcohol: ammonium hydroxide; 70:26:4) was
added to each cartridge. The eluent was evaporated at 40°C under a stream of nitrogen
gas. The dried extract was reconstituted in 150µL of a mobile phase A, 0.1% formic acid
in distilled water. The reconstituted sample was transferred to autosampler vials and the
LC-MS/MS injection volume was 10 µL.
2.7 Instrumental Analysis
The instrument employed was an Agilent Technologies 6460 LC equipped with
triple-quadrupole liquid chromatography tandem mass spectrometer (QQQ LC-MS) with
a Jetstream electrospray source. To determine which transitions to monitor, we performed

8
a direct injection (no column) of 1 µL of each analyte at 1,000 ng/mL. Using the
molecular weight and the electrospray ion source in the positive mode, the precursor ion
was obtained and product ion scans at different collision cell energies were performed to
obtain a list of fragment ions. All tandem mass spectrometer parameters were optimized
to produce the greatest analyte response. These parameters include source temperature,
nebulizer gas flow, nebulizer gas pressure, capillary voltage, fragmentor, and collision
energy.
The mass spectrometer operated in electrospray positive mode with cell
accelerator voltage of 7. Scheduled multiple reaction monitoring (MRM) mode was used
for compound detection with a detection window set of 1 min around the expected
retention time. The MRM transitions are summarized in Table 1; where two transition
ions were used for analyte and one transition ion for the internal standard.
Table 1. Compound name, precursor ion, product ion, retention time, fragmentor,
collision energy with constant cell accelerator voltage of 7 and positive polarity
Compound Name
Precursor
Ion
Product
Ion
Ret
Time
(min) Fragmentor
Collision
Energy
Amitriptyline 278.2 105.1 2.37 45 15
278.2 232.9 2.37 45 13
Amitriptyline-d3 281.2 105.1 2.37 70 10
Bupropion 240.1 184 1.65 45 7
240.1 131.1 1.65 45 7
Bupropion-d9 249.2 185.1 1.63 80 10
Citalopram 325.2 262.2 1.96 15 18
325.2 108.9 1.96 15 18
Citalopram-d6 331.2 108.8 1.96 50 22
Clomipramine 315.2 86.1 2.3 50 22
315.2 58.1 2.3 50 22
Cyclobenzaprine 276.2 231.2 2.33 25 14
276.2 216 2.33 25 14

9
Desipramine 267.3 236.3 2.28 10 6
267.2 72.1 2.28 10 6
Desipramine-d3 270.3 75.1 2.27 10 6
Doxepin 280.2 235 2.07 110 16
280.2 107.4 2.07 110 20
Doxepin-d3 283.2 107.1 2.07 110 20
Duloxetine 298.2 154 2.32 80 2
298.2 44.2 2.32 80 16
Duloxetine-d3 301.1 157.2 2.32 70 2
Fluoxetine 310.1 148 2.12 70 2
310.1 44.1 2.12 70 2
Fluoxetine-d6 316.2 154.1 2.11 70 2
Imipramine 281.2 86.2 2.31 110 12
281.2 58.1 2.31 110 48
Imipramine-d3 284.3 89.1 2.31 90 14
Mirtazapine 266.2 209.1 1.42 30 16
266.2 195.1 1.42 30 16
Nortriptyline 264.2 233.3 2.34 105 16
264.2 117.2 2.34 105 24
Nortriptyline d3 267.3 117.1 2.34 30 16
O-desmethylvenlafaxine 264.2 246.2 1.22 100 8
264.2 201.2 1.22 100 8
Paroxetine 330.2 192 2.28 110 16
330.2 70.2 2.28 110 34
Paroxetine d6 336.2 198.5 2.28 70 10
Sertraline 307.1 275.8 2.51 85 6
307.1 158.8 2.51 85 24
Sertraline d3 309.1 275.1 2.51 60 4
Trazodone 372.2 176.1 2 50 14
372.2 148.1 2 50 14
Trimipramine 295.2 208.1 2.42 50 14
295.2 100.2 2.42 50 14
295.2 58.1 2.42 50 14
Venlafaxine 278.2 147.2 1.77 65 18
278.2 121 1.77 65 20
Venlafaxine d6 284.3 266.2 1.76 85 8
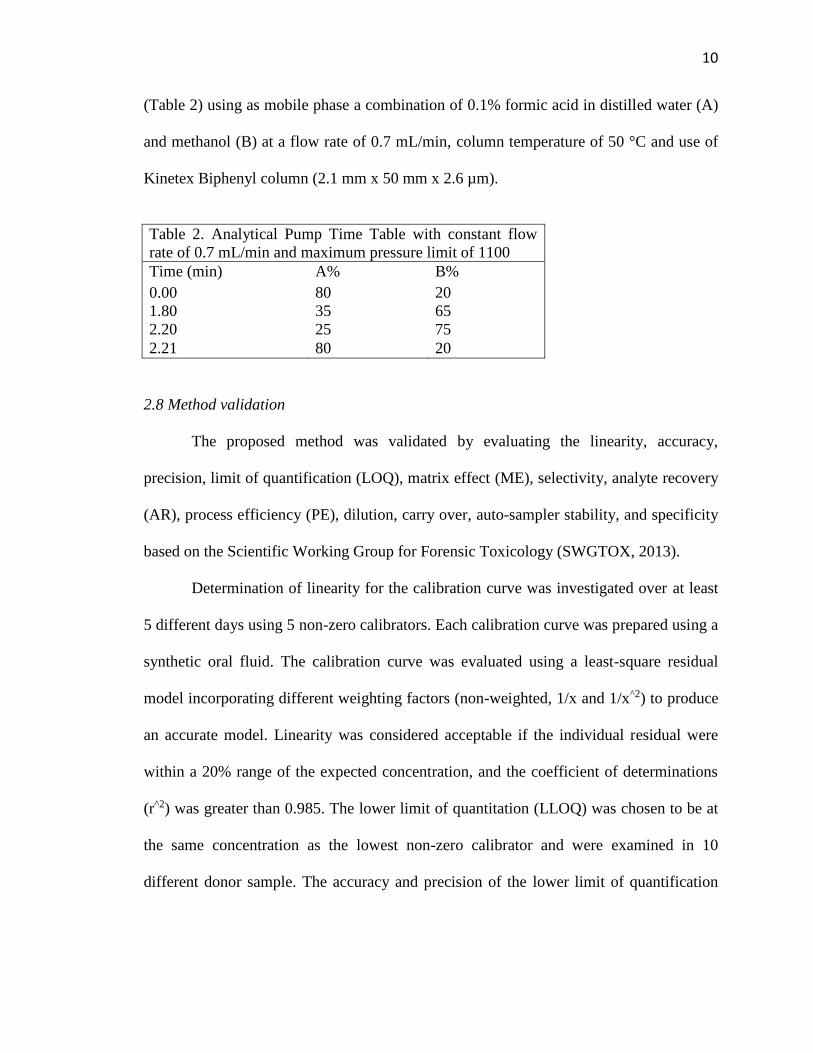
Chromatographic optimization was performed by using methods proposed by
previous publications (Coulter et al 2010, Knihnicki et al 2014, Castro et al, 2008) and
Cordant Health Solution internal protocol with slight modifications to mobile phase
composition, chromatographic column, gradients and flow rates. We employed a gradient
10
(Table 2) using as mobile phase a combination of 0.1% formic acid in distilled water (A)
and methanol (B) at a flow rate of 0.7 mL/min, column temperature of 50 °C and use of
Kinetex Biphenyl column (2.1 mm x 50 mm x 2.6 µm).
Table 2. Analytical Pump Time Table with constant flow
rate of 0.7 mL/min and maximum pressure limit of 1100
Time (min) A% B%
0.00 80 20
1.80 35 65
2.20 25 75
2.21 80 20
2.8 Method validation
The proposed method was validated by evaluating the linearity, accuracy,
precision, limit of quantification (LOQ), matrix effect (ME), selectivity, analyte recovery
(AR), process efficiency (PE), dilution, carry over, auto-sampler stability, and specificity
based on the Scientific Working Group for Forensic Toxicology (SWGTOX, 2013).
Determination of linearity for the calibration curve was investigated over at least
5 different days using 5 non-zero calibrators. Each calibration curve was prepared using a
synthetic oral fluid. The calibration curve was evaluated using a least-square residual
model incorporating different weighting factors (non-weighted, 1/x and 1/x^2) to produce
an accurate model. Linearity was considered acceptable if the individual residual were
within a 20% range of the expected concentration, and the coefficient of determinations
(r^2) was greater than 0.985. The lower limit of quantitation (LLOQ) was chosen to be at
the same concentration as the lowest non-zero calibrator and were examined in 10
different donor sample. The accuracy and precision of the lower limit of quantification

11
(LLOQ) samples were required to be within 20% of the expected concentration in order
to pass.
Six calibration curve, negative sample, quality control - low (QC-L), quality
control – medium (QC-M), and quality control – high (QC-H) were extracted on the same
day and analyzed by LC-MS/MS on five separate days; and expressed by relative mean
error (RME%), standard deviation (SD%), and coefficient variation (CV%) were
expressed for intra-day and inter-day precision and accuracy. The precision of this
method was determined by triplicate analysis of quality control (QC) samples at the
following concentration: 40, 200, and 800 ng/mL. Samples were analyzed as part of one
batch to determine intra-day precision of the assay (n=3). Additionally, samples were
analyzed in triplicate on 5 separate days to determine inter-day precision (n=15).
Accuracy = 100 − ((expected concentration − calculated concentration)
expected concentration× 100)
Intra − day CV% = SD of a single run of sample x 100
Mean calculated value of a single run of sample
Inter − day CV% = SD grand mean of each concentration x 100
Grand mean of each concentration
To identify carry over, samples were extracted at the upper limit of linearity,
ULOL (1,000 ng/mL) and 10 times the concentration of ULOL (10,000 ng/mL). Two
blank samples were placed after ULOL and three blank samples were placed after 10 X
ULOL. The detection of the analytes above the limit of detection in blank samples would
indicate that carryover exists in this method.
12
Matrix effect was evaluated comparing the neat, pre-extraction, and post-
extraction response (Chavez-Eng et al. 2003). Negative oral fluid specimens from 15
donors were selected and analyzed to determine if any significant LC-MS/MS response
regarding 18 antidepressants was present. Three neat bottles are prepared by adding 1,000
ng/mL concentration drug panel directly into LC-MS/MS vial to achieve level 6 (400
ng/mL). Two sets of 15 real matrices (500 µL) were prepared by spiking with a stock
solution to achieve 400 ng/ml concentration, level 6. One set was called pre-extraction
because drugs were added prior to the extraction. The other set was called post-extraction
because drugs were added after extraction (directly into the vial). All samples were
evaporated and followed with reconstitution of 150 µL of 0.1% formic acid in distill
water. Matrix effect was calculated comparing pre-extraction and neat samples. Analyte
recovery was calculated comparing post-extraction and pre-extraction samples. Process
efficiency was calculated comparing post-extraction and neat samples. Matrix effect
value less than 100% indicate ion suppression and values greater than 100% indicate ion
enhancement.
Matrix Effect (ME) = Mean(pre)
Mean(neat) × 100
Analyte Recovery (AR) = Mean(post)
Mean(pre) × 100
Process Efficiency (PE) = Mean(post)
Mean(neat) × 100
To determine if specimens with a higher concentration than the ULOL could be
diluted to be analyzed, dilution integrity was done. ULOL (1,000 ng/mL) was diluted 1:2,
13
1:5, and 1:10 with negative oral fluid (n=4). Results were expected to be within 20% of
the target value.
Limit of quantification (LOQ) was defined as the lowest concentration, where the
analyte could be quantified with a mean relative error less than 20 %. Ten samples were
spiked at LOQ (level l = 10 ng/mL) in the synthetic oral fluid.
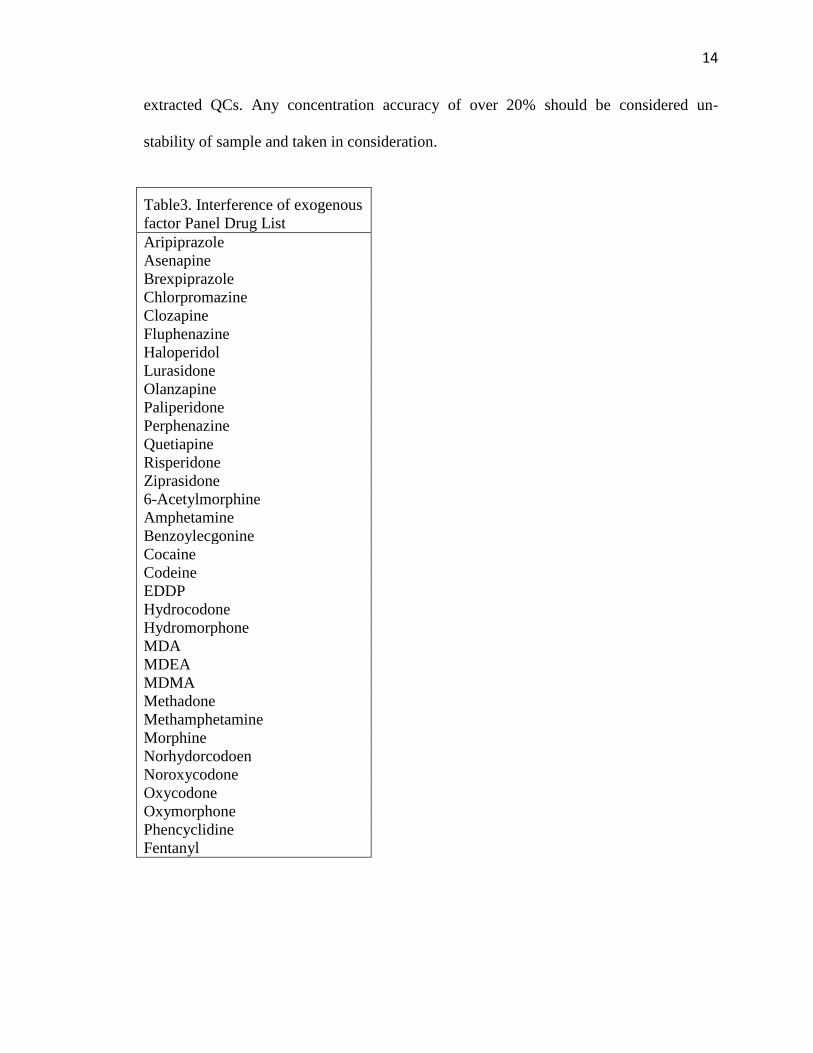
Selectivity was investigated testing for possible interferences from the specimen
(endogenous), ISTD, and exogenous factors. To evaluate the interference of endogenous
factors, 15 authentic donor’s samples, without any presence of analytes of interest or
ISTD. Interference of endogenous factors was absent if the response at the point of
interest was below one half of the response of LOD. To evaluate the interference of
exogenous factors, 10 samples with antidepressant panel spiked at level 1 (10 ng/mL),
and multiple drug panel (Table 3) spiked at level 7 (1,000 ng/mL) with ISTD in OF
samples. Interference of exogenous factors was absent if the concentration of the
antidepressant drugs was within ±20% of 10 ng/mL. To determine if the addition of
internal standard could contribute to the analyte response, oral fluid specimen from 15
volunteers were spiked with internal stands and analyzed to determine if any significant
LC-MS/MS response representing any of the antidepressants. The presence of an LC-
MS/MS peak could indicate possible internal standard impurity. Each drug response and
ISTD response were compared to see the significance of each. Presence of any peak that
was not expected would indicate possible impurity.
Auto-sampler stability was evaluated in extracted samples. Three levels of QCs
samples were left out at room temperature for 72 h. They were compared with newly
14
extracted QCs. Any concentration accuracy of over 20% should be considered un-
stability of sample and taken in consideration.
Table3. Interference of exogenous
factor Panel Drug List
Aripiprazole
Asenapine
Brexpiprazole
Chlorpromazine
Clozapine
Fluphenazine
Haloperidol
Lurasidone
Olanzapine
Paliperidone
Perphenazine
Quetiapine
Risperidone
Ziprasidone
6-Acetylmorphine
Amphetamine
Benzoylecgonine
Cocaine
Codeine
EDDP
Hydrocodone
Hydromorphone
MDA
MDEA
MDMA
Methadone
Methamphetamine
Morphine
Norhydorcodoen
Noroxycodone
Oxycodone
Oxymorphone
Phencyclidine
Fentanyl

15
2.9 Authentic and internal control oral fluid specimens
The method was applied to 7 authentic oral fluid samples previously analyzed by
Cordant Health Solution Laboratory, by SPE and LC-MSMS. No additional information
about those cases was available. The samples were collected with Quantisal® l and stored
at room temperature until analysis from few days to weeks. The method was also applied
to 3 samples fortified at the 3 levels (48, 280, 780 ng/mL), as part of an internal
proficiency test in the laboratory.
Ethics
Cordant Health Solutions obtained human oral fluid from donation and expired
ones for the research and development part of the lab. All of the samples were de-
identified and were no longer used in the clinical lab. The research conducted was in an
acceptable manner, applied towards the planning, execution, and reporting. It was
performed ethically to protect the interest of the individuals involved and followed all
federal, professional, and institutional guidelines and regulations.
3. Results
Calibration curves were linear (1/x^2, weighted regression model) for the
analytical method, with a correlation coefficient greater than 0.985 over the range from
10 to 1,000 ng/mL of oral fluid. The ratio of the intensity of the qualifying transitions to
the intensity of the quantifying transitions was acceptable if the ratio fell within ± 20%
for 10 -20, ± 30% for ≥ 30, and ± 50% ≤ 10. The 15 OF samples spiked at LLOQ levels
16
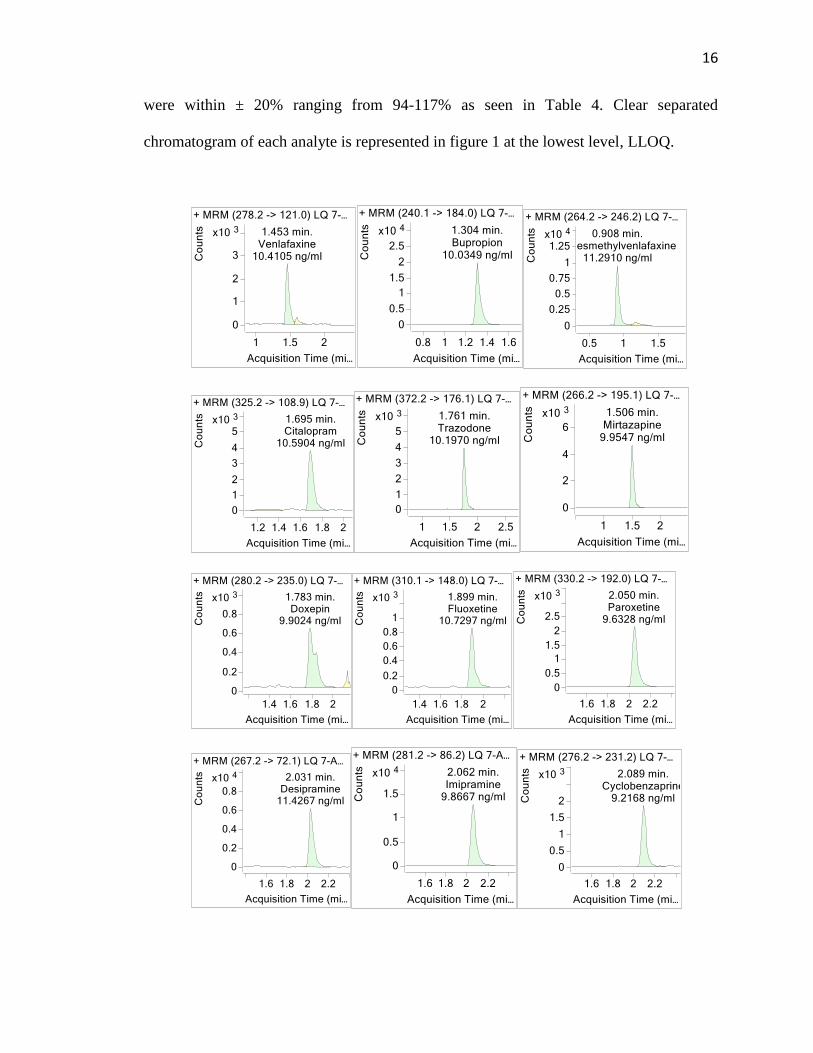
were within ± 20% ranging from 94-117% as seen in Table 4. Clear separated
chromatogram of each analyte is represented in figure 1 at the lowest level, LLOQ.

17
Figure 1. A representative sample chromatogram showing the chromatographic
separation of all analytes at the LLOQ (10 ng/mL).
Table 4: OF sample spiked at LLOQ (10 ng/mL) accuracy
Average Accuracy (%, n=15)
Amitriptyline 106.9
Bupropion 101.2
Citalopram 107.8
Clomipramine 107.1
Cyclobenzaprine 94.1
Desipramine 115.2
Doxepin 106.8
Duloxetine 116.7
Fluoxetine 104.4
Imipramine 104.2
Mirtazapine 108.1
Nortriptyline 102.2
O-desmethylvenlafaxine 114.5
Paroxetine 107.7
Sertraline 117
Trazodone 102.3
Trimipramine 103.2
Venlafaxine 107.3

18
For accuracy, percent error of all inter-day analyses was between 0-11.6% and
intra-day analyses was between 0.7-9.9%. For precision, the relative standard deviation
of all inter-day analyses was between 3.8-11.3% and intra-day analyses was between 0–
7.3%. All the accuracy was within 20% and precision was within 15% as shown in Table
5. The inter-day analysis was based on 5 days and intra-day analysis was one of those 5
days.
Table 5. Intra and Inter-day Precision and Accuracy (Q1: 40 ng/mL, Q2: 200 ng/mL,
Q3: 800 ng/mL; n=15).
Precision (CV%) Accuracy (% error)
Intra-day Inter-day Intra-day Inter-day
Q1 Q2 Q3 Q1 Q2 Q3 Q1 Q2 Q3 Q1 Q2 Q3
Amitriptyline 1.4 0.8 4.1 6.7 5.5 8.9 4.1 3.8 3.7 0.6 0.8 2.9
Bupropion 0.5 0.2 0.7 4.5 5 7.2 5.2 6.2 5.8 0.5 1 4.4
Citalopram 2.5 0.9 0.7 5.6 4.7 7.1 2.5 5.6 5.8 1.1 0.2 3.9
Clomipramine 2.5 1.2 1 6.2 6.7 7.2 1.9 4.9 6.2 1.6 0.1 3.5
Cyclobenzaprine 4.3 2.4 2.6 7.7 8.5 7.3 8.5 9.3 5 0.2 0 1.8
Desipramine 1.1 1.6 0.4 6.7 5.8 7.5 2.6 6.2 5.3 1.5 0 4.9
Doxepin 2.9 2.4 1.2 5.2 7 7.6 5.3 6.9 9.2 1.2 3.2 2.1
Duloxetine 4.2 2.2 3 8.1 12 5.3 3.3 1.8 5.3 1.9 4.7 5.2
Fluoxetine 5.6 3.8 0.6 7.6 9.9 8.1 5.3 4.1 5.2 2.5 1.4 5.9
Imipramine 0.7 1 0 6.9 7.5 7.5 6.1 7.1 7.1 1.5 1.3 3.6
Mirtazapine 1.5 1.5 0.1 6.7 7 8.2 0.7 5 4.4 1.8 1.7 5.4
Nortriptyline 3.2 2 2 6.6 5.9 7.7 3.1 4.1 5.6 0.1 0.9 4
O-
desmethylvenlafaxine 0.5 1.1 1 6 6.4 9.8 4.1 9.1 7.5 4.9 5.4 2.1
Paroxetine 6.2 5.4 7.3 5.9 6.4 11.3 9.9 9.1 8.3 11.6 7.9 2.6
Sertraline 6 0.9 1.4 8 6.8 9.7 4 0.8 7.6 1.7 4 3.9
Trazodone 1.2 1.1 0.2 3.8 5.6 6.6 1.1 3.9 6 3 0.6 4.5
Trimipramine 2.6 0.9 4.6 7.3 6.5 4.8 2 5.1 3.3 1.3 0.2 5
Venlafaxine 2.1 0.3 1 5 4.6 7.6 2.6 6.6 7.7 0.6 2.3 2.7
19
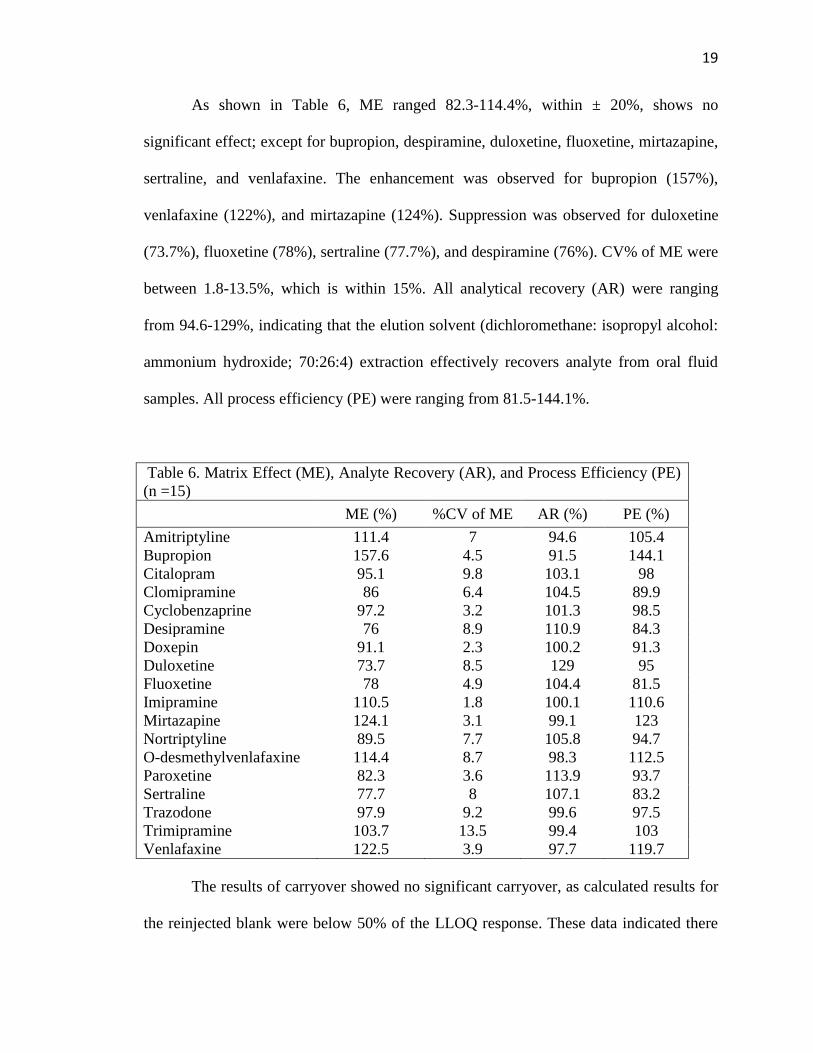
As shown in Table 6, ME ranged 82.3-114.4%, within ± 20%, shows no
significant effect; except for bupropion, despiramine, duloxetine, fluoxetine, mirtazapine,
sertraline, and venlafaxine. The enhancement was observed for bupropion (157%),
venlafaxine (122%), and mirtazapine (124%). Suppression was observed for duloxetine
(73.7%), fluoxetine (78%), sertraline (77.7%), and despiramine (76%). CV% of ME were
between 1.8-13.5%, which is within 15%. All analytical recovery (AR) were ranging
from 94.6-129%, indicating that the elution solvent (dichloromethane: isopropyl alcohol:
ammonium hydroxide; 70:26:4) extraction effectively recovers analyte from oral fluid
samples. All process efficiency (PE) were ranging from 81.5-144.1%.
Table 6. Matrix Effect (ME), Analyte Recovery (AR), and Process Efficiency (PE)
(n =15)
ME (%) %CV of ME AR (%) PE (%)
Amitriptyline 111.4 7 94.6 105.4
Bupropion 157.6 4.5 91.5 144.1
Citalopram 95.1 9.8 103.1 98
Clomipramine 86 6.4 104.5 89.9
Cyclobenzaprine 97.2 3.2 101.3 98.5
Desipramine 76 8.9 110.9 84.3
Doxepin 91.1 2.3 100.2 91.3
Duloxetine 73.7 8.5 129 95
Fluoxetine 78 4.9 104.4 81.5
Imipramine 110.5 1.8 100.1 110.6
Mirtazapine 124.1 3.1 99.1 123
Nortriptyline 89.5 7.7 105.8 94.7
O-desmethylvenlafaxine 114.4 8.7 98.3 112.5
Paroxetine 82.3 3.6 113.9 93.7
Sertraline 77.7 8 107.1 83.2
Trazodone 97.9 9.2 99.6 97.5
Trimipramine 103.7 13.5 99.4 103
Venlafaxine 122.5 3.9 97.7 119.7
The results of carryover showed no significant carryover, as calculated results for
the reinjected blank were below 50% of the LLOQ response. These data indicated there
20
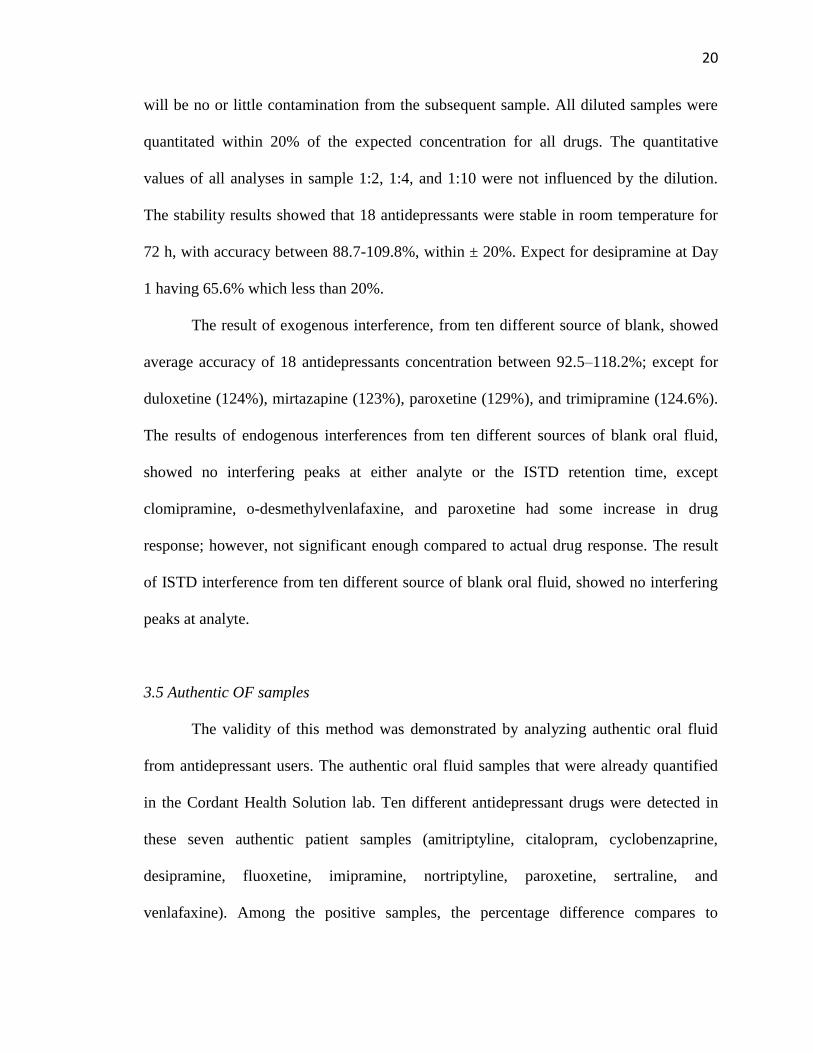
will be no or little contamination from the subsequent sample. All diluted samples were
quantitated within 20% of the expected concentration for all drugs. The quantitative
values of all analyses in sample 1:2, 1:4, and 1:10 were not influenced by the dilution.
The stability results showed that 18 antidepressants were stable in room temperature for
72 h, with accuracy between 88.7-109.8%, within ± 20%. Expect for desipramine at Day
1 having 65.6% which less than 20%.
The result of exogenous interference, from ten different source of blank, showed
average accuracy of 18 antidepressants concentration between 92.5–118.2%; except for
duloxetine (124%), mirtazapine (123%), paroxetine (129%), and trimipramine (124.6%).
The results of endogenous interferences from ten different sources of blank oral fluid,
showed no interfering peaks at either analyte or the ISTD retention time, except
clomipramine, o-desmethylvenlafaxine, and paroxetine had some increase in drug
response; however, not significant enough compared to actual drug response. The result
of ISTD interference from ten different source of blank oral fluid, showed no interfering
peaks at analyte.
3.5 Authentic OF samples
The validity of this method was demonstrated by analyzing authentic oral fluid
from antidepressant users. The authentic oral fluid samples that were already quantified
in the Cordant Health Solution lab. Ten different antidepressant drugs were detected in
these seven authentic patient samples (amitriptyline, citalopram, cyclobenzaprine,
desipramine, fluoxetine, imipramine, nortriptyline, paroxetine, sertraline, and
venlafaxine). Among the positive samples, the percentage difference compares to
21
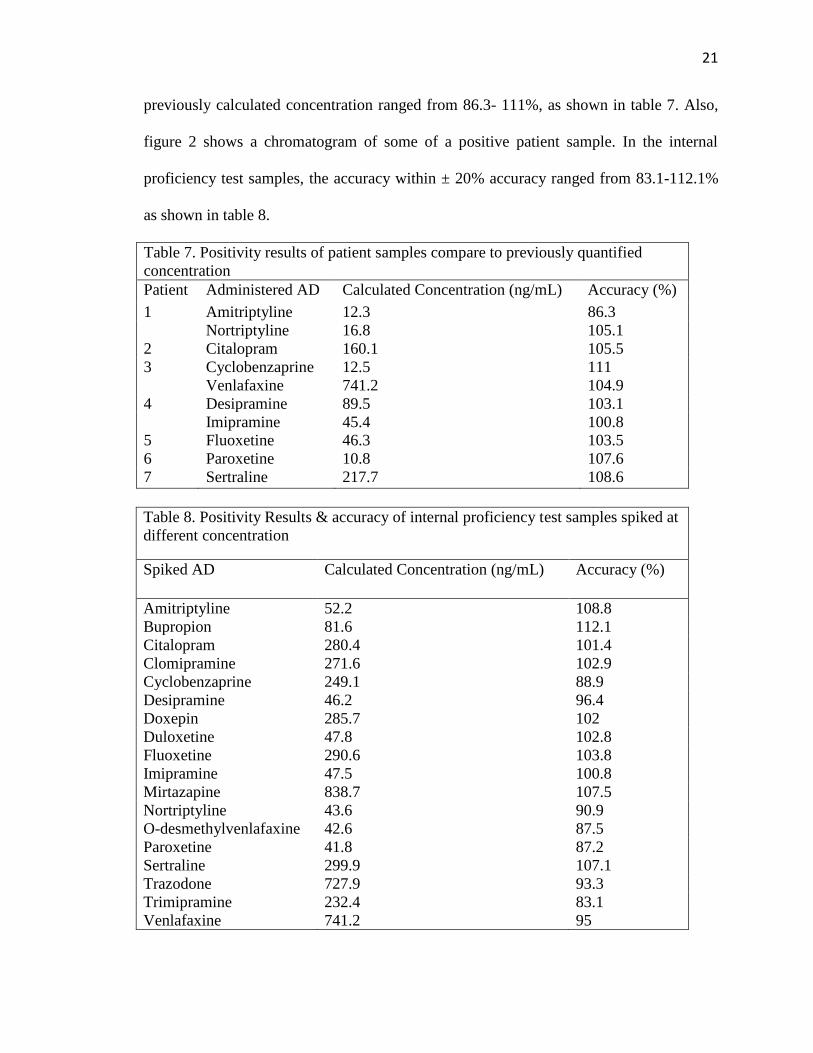
previously calculated concentration ranged from 86.3- 111%, as shown in table 7. Also,
figure 2 shows a chromatogram of some of a positive patient sample. In the internal
proficiency test samples, the accuracy within ± 20% accuracy ranged from 83.1-112.1%
as shown in table 8.
Table 7. Positivity results of patient samples compare to previously quantified
concentration
Patient Administered AD Calculated Concentration (ng/mL) Accuracy (%)
1 Amitriptyline 12.3 86.3
Nortriptyline 16.8 105.1
2 Citalopram 160.1 105.5
3 Cyclobenzaprine 12.5 111
Venlafaxine 741.2 104.9
4 Desipramine 89.5 103.1
Imipramine 45.4 100.8
5 Fluoxetine 46.3 103.5
6 Paroxetine 10.8 107.6
7 Sertraline 217.7 108.6
Table 8. Positivity Results & accuracy of internal proficiency test samples spiked at
different concentration
Spiked AD Calculated Concentration (ng/mL) Accuracy (%)
Amitriptyline 52.2 108.8
Bupropion 81.6 112.1
Citalopram 280.4 101.4
Clomipramine 271.6 102.9
Cyclobenzaprine 249.1 88.9
Desipramine 46.2 96.4
Doxepin 285.7 102
Duloxetine 47.8 102.8
Fluoxetine 290.6 103.8
Imipramine 47.5 100.8
Mirtazapine 838.7 107.5
Nortriptyline 43.6 90.9
O-desmethylvenlafaxine 42.6 87.5
Paroxetine 41.8 87.2
Sertraline 299.9 107.1
Trazodone 727.9 93.3
Trimipramine 232.4 83.1
Venlafaxine 741.2 95

22
Figure 2: Chromatogram of positive patient samples: amitriptyline of 13.3 ng/mL,
sertraline of 217.8 ng/mL, imipramine of 45.4 ng/mL, desipramine of 89.5 ng/mL,
fluoxetine of 28.2 ng/mL, citalopram of 148.9 ng/mL.
Discussion
We have developed and validated a method that is specific and sensitive for
quantification of 18 antidepressants in oral fluid. This study employs 500 µL Quantisal®
collection device (equals to 125 µL of neat oral fluid) compare to Coulter et al (2010)
used 1mL from the Quantisal® collection device (equals to 250 µL of neat oral fluid),
Knihnicki et al. (2014) used 1 mL of oral fluid from the Salivette swabs, and Castro et al.
(2008) used 0.2 mL of sample that was spat into polypropylene tubes directly from
volunteers. Methodology employing a low amount of sample is beneficial if there is a
limited amount of sample, as it happens in oral fluid.

23
Before extraction, Knihnicki et al. (2014) pretreated the oral fluid by adding 0.5
mL of phosphate buffer (pH 7.4), sonicating for 30 minutes, and centrifuging twice.
Coulter et al. (2010) added potassium phosphate buffer (0.1M, pH 6) to oral fluid before
extraction. Castro et al. (2008) added sodium acetate buffer pH 3.6 to oral fluid before
the extraction. While for our study, we did not add any additional buffer to the oral fluid
sample and did not do any pretreatment; which did not affect recovery of analyte
significantly. This method helped the lab to save the material and the time to handle when
preparing the oral fluid sample before the extraction.
For extraction, only the extraction solvent varied compared to previous
publications. Knihnicki et al. (2014) used 200 µL of methanol, water, and 20% ammonia
solution (95:4:1, v/v/v), Coulter et al. (2010) used 3 mL of methylene chloride, methanol,
ammonium hydroxide (78:20:2, v/v/v), and Castro et al. (2008) used 2mL of
dichloromethane, 2-propanol, ammonium hydroxide (75:24.5:0.5, v/v/v). Similar to
Castro et al. (2008), 750 µL of dichloromethane, isopropyl alcohol, ammonium
hydroxide (70:26:4, v/v/v) was used for this research. Following previous studies,
extraction column was in mixed mode cation exchange and reversed-phase (Coulter et al.
2010; Castro et al. 2008; Knihnicki et al. 2014).
We were able to achieve an LLOQ/LOD of 10 ng/mL and linear range of 10-
1,000 ng/mL for oral fluid. Most methods had lower LLOQ and narrower range; Castro et
al. (2008) used 2-500 ng/mL, Coulter et al. (2010) used 5-500 ng/mL, and Knihnicki et
al. (2014) used 1.25-10 ng/mL as their linear range. Our LLOQ (10 ng/mL) is higher than
most of the previous methods because some of the drugs were not fulfilled the criterion

24
for the accuracy, making it not suitable for determination of analyte at a lower level. The
sensitivity of analysis should be improved for the future.
For the chromatographic separation of analytes, a biphenyl column was used in
this research compare to C18 column (Castro et al. 2008; Knihnicki et al. 2014; Colulter
et al. 2010). Mobile phases of 0.1% formic acid in distill water and methanol compare
was used compared to 0.2% acetic acid and methanol (Colulter et al. 2010) or acetonitrile
and ammonium formate buffer (Castro et al. 2008) or acetonitrile and diluted phosphoric
acid (Knihnicki et al. 2014) in previous studies. With the use of biphenyl column giving a
total run time of 5 min, this study made it faster compare to Castro et al (2008), 8 min
and Knihnicki et al (2014), in 15 min, but same as Coulter et al (2010), in 5 min.
For selectivity and especially for exogenous interference, this study analyzed by
adding 34 different drugs of antipsychotic and other commonly abused drugs. The
accuracy of duloxetine, mirtazapine, paroxetine, and trimipramine were out of range so
this should be taken into consideration when analyzing the concentration; since their
concentration could be higher than expected for future analysis. Coulter et al. (2010) used
cocaine, benzoylecgonine, cocaethylene, norphetamine, methylenedioxyamphetamine,
methylenedioxyethylamphetamine, carisoprodol, methadone, diazepam, nordiazepam,
oxazepam, alprazolam, chlordiazepoxide, bromazepam, temazepam, lorazepam,
flurazepam, nitrazepam, triazolam, secobarbital, pentobarbital, butalbital, and
phenobarbital for exogenous interference and no significant interference was observed.
ME (73.7-157%), AR (94.6-129%), and PE (81.5-144.1%) results for some of the
drugs were out of the range, but this could be due to no direct isotopically labeled
analog/deuterated internal standard. Also, the oral fluid of each individual and buffer of
25
Quantisal could have influenced the ME, AR, and PE. Compare to Coulter et al. (2010)
the recovery of drugs were higher (51.4-87.4%) even with the same use of OF collection
device, Quantisal. Castro et al. (2008) had a recovery of 49-72%.
The processed sample stability of oral fluid extracts appears to be stable. No
significant analyte loss was noticed in any of the QC, suggesting that samples awaiting
analysis are stable for up to 72 h in room temperature. Castro et al. (2008) analyzed the
stability of freeze/thaw cycles samples to freshly prepared samples and only sertraline in
oral fluid showed decrease in the signal. Coulter et al. (2010) analyzed the stability of
extracted drugs to 48 h after the extraction and there were less than a 5% difference in the
quantitation
Conclusion
Based on the validation results, it was demonstrated that this method of SPE and
LC-MS/MS can be used for reliable identification and quantification of 18
antidepressants (amitriptyline, bupropion, citalopram, clomipramine, cyclobenzaprine,
desipramine, o-desmethylvenlafaxine, doxepin, duloxetine, fluoxetine, imipramine,
mirtazapine, nortriptyline, paroxetine, sertraline, trazodone, trimipramine, and
venlafaxine) in OF. The major advantage of this method is the rapid run time and
minimal sample volume with sample preparation. This method could be a useful tool in
clinical and forensic laboratories to determine concentrations of antidepressant drugs in
OF.
26
References
Athanaselis, S., Khraiwesh, A., Nikolaou, P., Papoutsis, I., Pistos, C., & Spiliopoulou, C.
(2012). A fully validated method for the simultaneous determination of 11
antidepressant drugs in whole blood by gas chromatography-mass spectrometry.
Journal of pharmaceutical and Biomedical Analysis, 70:557-562.
Bednar, P., Lemr, K., Lordache, A. M., Saldanha, H. M. E. B., Sistik, P., & Turjap, M.
(2016). Quantification of selected antidepressants and antipsychotics in clinical
samples using chromatographic methods combined with mass spectrometry: A
review (2006-2015). Biomedical Paper, 160:39-53
Benites, J., Bravo, F., Calderon, P. B., Rios, D., Venegas, K., & Zambra, C. (2013).
Forensic cases in the north of Chile: determination of antidepressant drugs in
human whole blood. Journal of Chile Chemistry Society, 58:1733-1736
Bennett, Davies, & Thomas. (2003). Is oral fluid analysis as accurate as urinalysis in
detecting drug use in a treatment setting? Drug and Alcohol Dependence, 72(3),
265-269.
Berm, E., Brummel-Mulder, E., Hak, E., Maring, J. G., Paardekooper, J., & Wilffert, B.
(2015). A simple dried blood spot method for therapeutic drug monitoring of the
tricyclic antidepressants amitriptyline, nortriptyline, imipramine, clomipramine,
and their active metabolites using LC-MS/MS. Talanta, 134:165-172
Binns, A., Egger, G., & Reznik, R. (2017). Chapter 15 – Depression. Lifestyle Medicine
Third edition (pp. 247-261). London, UK: Elsevier.
Brody, D. J., Gu, Q., & Pratt, L. A. (2017). Antidepressant use among persons aged 12
and over: United States, 2011-2014. NCHS data Brief. 283:1-8.
Borg, D., Fey, E., Getto, C., Kunkel, F., & Stripp, R. (2015). Assessment of the use of
oral fluid as a matrix for drug monitoring in patients undergoing treatment for
opioid addition. Journal of Opioid Management. 11(5): 435-442
Bosker, W. M., & Huestis, M. A. (2009). Oral fluid testing for drugs of abuse. Clinical
Chemistry, 55(11): 1910-1913.
27
Castro, A., Concheiro. M., Cruz, A., Quintela, O., & Lopez-Rivadulla, M. (2008). LC-
MS/MS method for the determination of nine antidepressants and some of their
main metabolites in oral fluid and plasma study of correlation between
venlafaxine concentration in both matrices. Journal of Pharmaceutical and
Biomedical Analysis, 48,183-193
Chan, A. T., Glovannucci, E. L, Hass, J. S, Kantor, E. D., & Rehm, C. D. (2015). Trends
in prescription drug use among adults in the United States from 1999-2012. The
journal of the American Medical Association, 314(17):1818-1831.
Chavez-Eng, C. M, Constanzer, M. L. & Matuszewski, B. K (2003). Strategies for the
assessment effect in quantitative bioanalytical methods based on HPLC-MS/MS.
Analytical Chemistry, 75:3019-3030
Chihuri, S., Hill, L. L., Lauzon, V., Lee, K. C., Li, G. & Winbrock, E. L. (2017)
Depression, antidepressants and driving safety. Injury Epidemiology 4:1-10
Ciraulo, D. A., Greenblatt, D. J., & Shader, R. I. (2010). Clinical pharmacology and
therapeutics of antidepressants. Pharmacotherapy of Depression, 2:125-184
Crouch, D. J. (2005) Oral fluid collection: The neglected variable in oral fluid testing.
Forensic Science International, 150: 165-173
Compagnone, D., Curini, R., Lo Sterzo, C., Montesano, C., Sergi, M., & Simeoni, M.
(2015). Determination of illict drugs and metabolites in oral fluid by
microextraction on packed sorbent coupled with LC-MS/MS. Analytical
Bioanalysis Chemistry. 407(13): 3647-3658
Coulter, C., Taruc, M., Tuyay, J., & Moore, C. (2010). Antidepressant drugs in oral fluid
using liquid chromatography-tandem mass spectrometry. Journal of Analytical
Toxicology, 34(2):64.
Dunn, N. R., Mackay, F. J., & Mann, R. D. (1999). Antidepressants and serotonin
syndrome in general practice. British Journal of General Practice, 49:871-874
Fuller, M., Sajatovic, M., & Handiwala, L. (2013). Clinical perspectives on the influence
of drug formulation on patient tolerability and use of commonly prescribed
28
antidepressants in major depressive disorder. Archives of Pharmacy
Practice, 4(3): 83-92.
Gilman, P. K. (2006). A Review of serotonin toxicity data: implications for the
mechanisms of antidepressant drug action. Biology psychiatry, 59:1046-1051
Goldstein, A., Poklis, A., Poklis, J. L., Wolf, C. E., & Wolfe, M. L. (2012) Detection and
quantification of tricyclic antidepressants and other psychoactive drugs in urine
by HPLC/MS/MS for pain management compliance testing. Journal of Clinical
Laboratory Analysis, 26(4):286-294
Kang, J. S., & Lee, M. H. (2009). Overview of therapeutic drug monitoring. The Korean
Journal of Internal Medicine, 24(1), 1-10.
Kaye, A. D., Kaye, A. M., & Volpi-Abadie, J. (2013). Serotonin syndrome. The Ochsner
Journal.13:553-540
Kerr, G.W., McGuffie, A.C., &Wilkie, S. (2001) Tricyclic antidepressant overdose: a
review. Emergency Medicine Journal, 18: 236-241.
Knihnicki, P., Koscielniak, P., Moos, A., Wieczorek, M., Wietecha-Poshuszny, R., &
Wozniakiewicz, M. (2014). Development of microextraction by packed sorbent
for toxicological analysis of tricyclic antidepressant drugs in human oral fluid.
Journal of Chromatography A, 1337:9-16.
National Center for Health Statistics (2016). Health, United States, 2015: With special
feature on racial and ethnic health disparities. Hyattsville, MD.
Sansone, L. A & Sansone, R. A. (2009) Driving on antidepressant: cruising for a crash?
Psychiatry, 7(9):13-16.
Sawyer, T. S & Spiler, H. (2007) Antidepressant withdrawal syndrome and DUI
evaluation. Forensic Examiner, 50-54.
Scientific working groups for forensic toxicology (SWGTOX) (2013) Standard practices
for method validation in forensic toxicology. Journal of Analytical Toxicology,
37:452-474.