developing data and analytics maturity framework to
TRANSCRIPT

Salla Kuula
Developing Data and Analytics Maturity
Framework to Support Business
Transformation
Case: Veho Oy Ab
Metropolia University of Applied Sciences
Master of Business Administration
Business Informatics
Thesis
15.12.2018

Abstract
Author Title Number of Pages Date
Salla Kuula Developing Data and Analytics Maturity Framework to Support Business Transformation Case: Veho Oy Ab 62 pages + 4 appendices 15 Dec 2018
Degree Master of Business Administration
Degree Programme Master’s Degree Programme in Business Informatics
Instructor
Antti Hovi, Senior Lecturer
The purpose of this study was to find ways the case company Veho Oy Ab could address the challenge of not using data to its full potential. Veho is a Finnish downstream automo-tive company selling, importing and repairing passenger and commercial vehicles. Veho’s digital strategy emphasises the importance of good quality Data and Analytics services, but the company lacks the means to bring this statement into reality. Maturing into an organiza-tion that is able to fully benefit from its data assets needs a maturity framework to steer leaders when prioritizing projects, planning needed actions and measuring the progress. Existing knowledge was used to gain better understanding on how Data and Analytics are changing modern business culture and why maturity matters. Relevant maturity dimensions were chosen from existing maturity models and best practises were studied more closely. Research in the case organization was conducted through a comprehensive set of qualita-tive interviews to build a holistic view on the current state of Data and Analytics maturity. The current state analysis was combined with conceptual framework and used for building the framework suitable for Veho’s business. The maturity score for the current state was assessed based on the analysis. The target stage was set through workshops and addi-tional interviews. The outcome of this study is a Data and Analytics maturity framework designed for Veho. The framework includes five dimensions: strategy and vision, organization and people, technology, analytics, and data management. It introduces a five-level scale for assessing the maturity for each of the dimensions. The current state analysis revealed that Veho is at level two out of five and is targeting to reach level four in 2021 when the actual benefits of data can be seen realized. From the framework, Veho can find the needed criteria to gain the next level of maturity and eventually reach the target. The author suggests that Veho uses the maturity framework when planning and measuring Data and Analytics transformation programme for years 2019-2021. By doing this Veho is able to make more accurate plans and decisions when growing maturity throughout the organization. Eventually Veho will more likely achieve the targets described in digital strat-egy and gain value through better business decisions and results.
Keywords Data, Analytics, Maturity model, Business intelligence

Contents
Abstract
Table of Contents
1 Introduction 1
1.1 Overview 1
1.2 Business Challenge 1
1.3 Case Company 2
1.4 Objective and Scope 2
1.5 Key terms/Concepts 3
1.6 Thesis Outline 3
2 Research Design 5
2.1 Research Approach 5
2.2 Research Design 6
2.3 Data Collection and Analysis 9
2.4 Validity and Reliability 10
3 Conceptual framework 11
3.1 Data is changing business world 11
3.2 Data and Analytics maturity 12
3.3 Maturity models 14
3.3.1 Gartner’s Enterprise Information Model (EIM) and IT Score Overview for BI and Analytics 14
3.3.2 IBM Big Data and Analytics maturity Model 18
3.3.3 TDWI Big Data Maturity Model 20
3.4 Chosen maturity dimensions 22
3.4.1 Strategy and vision 23
3.4.2 Organization and people 24
3.4.3 Technology 27
3.4.4 Analytics 31
3.4.5 Data management 33
4 Current state analysis 36
4.1.1 Strategy and vision 37
4.1.2 Organization and people 38
4.1.3 Technology 39
4.1.4 Analytics 40

4.1.5 Data management 41
5 Building the framework 43
5.1 Strategy and vision 43
5.2 Organization and people 44
5.3 Technology 45
5.4 Analytics 47
5.5 Data Management 48
5.6 Summary 49
6 Validation of the proposal 50
6.1 Validation overview 50
6.1.1 Project team validation 50
6.1.2 Practical validation 50
6.1.3 Executive level validation 52
6.2 Final proposal: Maturity framework for Veho 52
6.3 Implementation 54
7 Discussion and conclusions 55
7.1 Summary 55
7.2 Practical implications 57
7.3 Evaluation of the thesis 58
7.3.1 Outcome vs objective 58
7.3.2 Reflection & Afterword 58
References 60
Appendices
Appendix 1. Data collection plan
Appendix 2. Base questions for current state interviews
Appendix 3. Maturity dimensions from Gartner Enterprise Information Model, TDWI Big Data maturity model and IBM Big Data and Analytics maturity model
Appendix 4. Proposed maturity framework for Veho

1 (62)
1 Introduction
1.1 Overview
Veho is one of the biggest downstream automotive industry companies in Finland. Cus-
tomer experience and efficiency are at the core of Veho’s business values and Data
and Analytics has many possibilities around challenges related to these. To get the
competitive advantage analytics offers, Veho needs a plan on how to increase Data
and Analytics maturity.
1.2 Business Challenge
Data can be seen as an asset to a company and a competitive advantage when utilized
properly. Data analytics can help to reduce costs, find patterns in order to predict
events, optimize processes, find new prospects and focus resources. Without data
companies can guess what has happened and what will happen but to minimize risks
and to find new customers or profitable sales, analytics is an essential part of modern
business management and decision making. Especially for a sales and marketing or-
ganization, having a 360-view of a customer with full information on sales, marketing
actions, contact information combined with external information that affect sales, is an
advantage over competitors.
Veho is storing large amounts of customer and product data. The data is used in mar-
keting, financial services and in business to understand the customers better. Yet it is
not utilized in a structured way to support strategic actions and decision making.
Veho is launching a new corporate strategy in 2018 with a focus on digitalization and
connectivity. This means that when the industry is moving from product centric to cus-
tomer centric, Veho wants to be a forth runner in this. It is stated in the new strategy
that one way to increase the customer centricity is to increase operational and profita-
ble transparency by developing and utilizing analytical capabilities. It is highlighted
even more in the digital strategy which is built from the corporate strategy goals. The
digital strategy states ‘Veho will have a competitive advantage from its advanced inter-

2 (62)
nal analytics services and high-quality, up to date customer and product information.
We will have the needed competencies and resources for it‘(Veho, 2018:p.13). The
challenge is that Veho is missing a clear view of the steps it needs to be able to suc-
ceed in the cultural change to data-centric corporation.
1.3 Case Company
Veho Oy Ab is a Finnish downstream automotive industry company established in
1939. It sells, imports, repairs and maintains passenger and commercial vehicles serv-
ing consumers and corporate customers in Finland, Sweden and the Baltic countries.
Mercedes-Benz is the core of Veho and the biggest brand.
Veho’s turnover in 2016 was 1.2 billion euros, from which around 80 % came from Fin-
land. Veho employs 1890 people, of whom 150 work in administration. The organiza-
tion is split into commercial vehicles, passenger cars and common functions such as
Digital services, Finance and HR. Veho is a customer focused company and it values
sustainable actions, customer satisfaction and employee wellbeing. (Veho Oy Ab,
2016).
The team responsible for developing analytics is the Information management team in
Digital services. The team is developing more into a Data and Analytics team and will
have a major role in implementing analytics into the whole corporation.
1.4 Objective and Scope
The objective of this study is to create a framework for management to increase Data
and Analytics maturity. Getting better use of Data and Analytics will support strategic
targets, gain competitive advantage and generate business value. The maturity frame-
work will be used in further long- and short-term action planning.
Growing analytics maturity depends on several factors such as organization with sup-
porting roles, technologies and tools and operating model. The thesis views Data and
Analytics more in broad level than deep level which means that it will include the most
suitable maturity dimensions for Veho but will not go into details such as data sources

3 (62)
or models. The data scope of this thesis is in product and customer Data and Analytics
for sales and marketing organizations.
Outcome of the study will be a Data and Analytics maturity framework designed espe-
cially for Veho’s business culture. It will have a five-level assessment scale with Veho’s
current and target states included.
1.5 Key terms/Concepts
Business Intelligence (BI) refers to gathering, utilizing and analysing business infor-
mation. In some cases BI is used as a term to describe reporting or analytics solutions.
Enterprise Data Warehouse (EDW) refers to a system used for storing data from mul-
tiple sources that is used for reporting and analytics.
Data and Analytics refers to the field that includes business intelligence solutions,
data analytics, data science and data management.
Data Science is a concept that uses methods like statistics, algorithms, machine learn-
ing and scientific processes to get knowledge and insights from data.
CDO can be a Chief data officer or a Chief digital officer. In Veho’s case it means “digi-
tal”. Gartner uses it for “data”.
1.6 Thesis Outline
The research was done by using qualitative methods; interviews, internal documenta-
tion and workshops. Literature used to support the research is mostly academic jour-
nals and papers published by consulting companies.
The thesis is organized as follows. Firstly, the importance of Data and Analytics maturi-
ty is studied, and different existing maturity models are researched. Different aspects
and dimensions of maturity most closely related to Veho are selected and researched.
Secondly the current state of Data and Analytics related to chosen dimensions is re-
searched by doing interviews among different levels of stakeholders. Thirdly the pro-

4 (62)
posal of for the framework is built and the targets are set. Finally, a maturity framework
will be finalized based on three-level validation by the project team, by using it on prac-
tise and by Veho management team.

5 (62)
2 Research Design
This section introduces the research approach and design used in this thesis as well as
an overview on data collection and validity.
2.1 Research Approach
This research is an applied empirical research and it is done using the gate model. The
research is constructed from seven gates.
Figure 1. Gate model used in Metropolia University of applied sciences in the Business Infor-matics MBA programme (2018)
With the first two gates the business problem, objective and the thesis outcome are
described, and the research design is built. The third gate focuses on existing
knowledge and the fourth gate on analysing the current state in the case organization.
The fifth gate is about building the proposed solution which is the outcome of the the-
sis. The sixth gate will be the validation of the proposal, and the outcome of the final,

6 (62)
seventh gate is going to be the finished Data and Analytics Maturity Framework. The
progress between gates is evaluated in gate seminars after gates 1, 2, 3, 4 and 7 by
thesis supervisors.
The study itself will start with the existing knowledge. This approach was chosen be-
cause it is better to first understand why Data and Analytics are important for an organ-
ization and what aspects an organization needs to consider when building a culture for
mature Data and Analytics usage. There are existing maturity models designed for or-
ganizations to help in long- and short-term action planning and target setting. From
these the most relevant dimensions are chosen to further study the best practises.
These dimensions are used for the current state analysis and proposal building. After
the existing knowledge has been studied, data collection for the current state can be
more precise and the interview questions and workshops can be designed based on
relevant matters from existing frameworks.
The research method used is qualitative through a set of interviews, observations and
documentation. This is because the collected data is more about people’s thoughts and
views than hard statistics. The interviews are conducted in semi-structured manner,
with room left for discussion.
2.2 Research Design
Research design is based on the gate model and it introduces data collection and out-
comes as well (Figure 2).

7 (62)
Figure 2. Research design
The first part of the research phase is conceptual framework, where analytics as a
competitive advantage, maturity thinking, existing maturity models and dimensions are
researched from external sources. This part includes the first phase of the proposal
building when dimensions found from existing models are chosen for Veho. These di-
mensions are studied more thoroughly to find the best practises. The objective is to
learn about maturity models and different stages and dimensions affecting analytics
maturity in order to later compare the current state to the these. Literature in this study
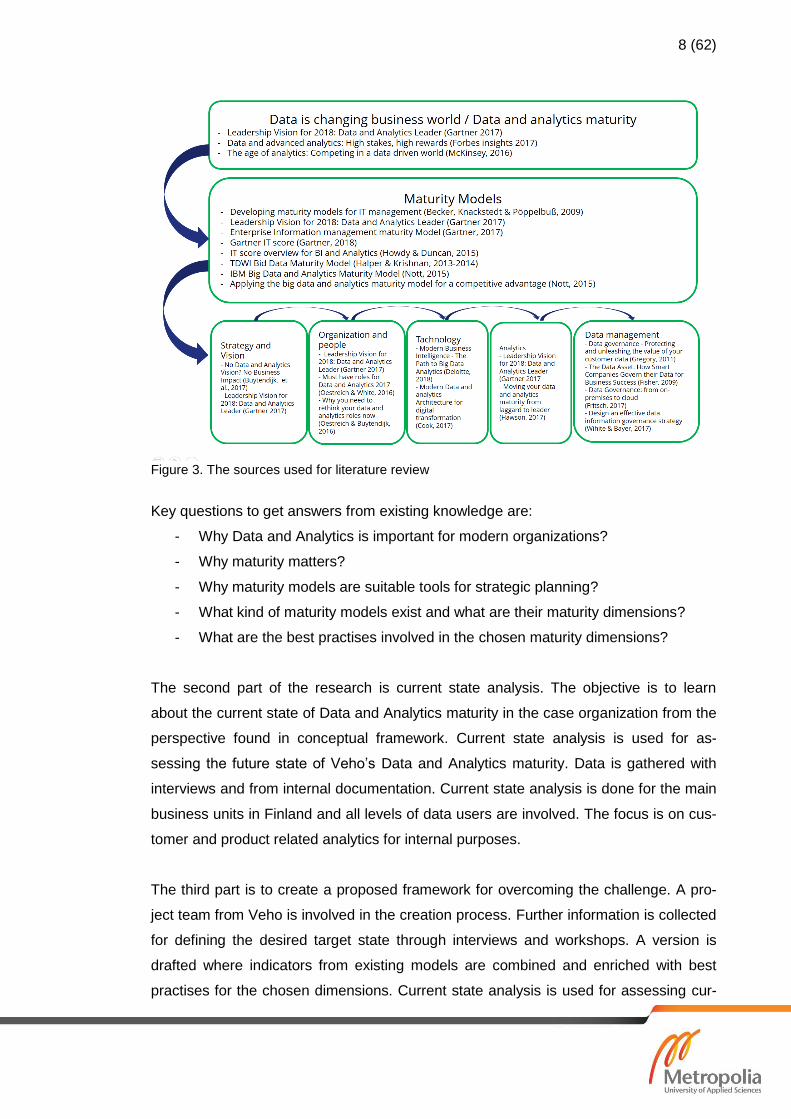
is mostly gathered from journals and papers published by consulting companies, field
specialists and analysts, many of them related to Gartner (Figure 3). It is a challenge to
find up-to-date information about Data and Analytics maturity since the industry is
evolving constantly. Gartner is regarded as one of the leading Data and Analytics con-
sulting company giving guidelines for management.
8 (62)
Figure 3. The sources used for literature review
Key questions to get answers from existing knowledge are:
- Why Data and Analytics is important for modern organizations?
- Why maturity matters?
- Why maturity models are suitable tools for strategic planning?
- What kind of maturity models exist and what are their maturity dimensions?
- What are the best practises involved in the chosen maturity dimensions?
The second part of the research is current state analysis. The objective is to learn
about the current state of Data and Analytics maturity in the case organization from the
perspective found in conceptual framework. Current state analysis is used for as-
sessing the future state of Veho’s Data and Analytics maturity. Data is gathered with
interviews and from internal documentation. Current state analysis is done for the main
business units in Finland and all levels of data users are involved. The focus is on cus-
tomer and product related analytics for internal purposes.
The third part is to create a proposed framework for overcoming the challenge. A pro-
ject team from Veho is involved in the creation process. Further information is collected
for defining the desired target state through interviews and workshops. A version is
drafted where indicators from existing models are combined and enriched with best
practises for the chosen dimensions. Current state analysis is used for assessing cur-

9 (62)
rent maturity score for different dimensions. The proposal will include a five-stage ma-
turity framework suitable for Veho’s culture with chosen maturity dimensions, current
stage and target stage.
The proposal is validated first with the core project team involved. The second part of
the validation is to use it in practise as a framework for long- and short-term action
planning done in summer 2018. Third validation is done by presenting it to the leader-
ship team to get the support for defined target state. Based on feedback, the frame-
work is developed and finalized.
2.3 Data Collection and Analysis
Data is collected in this research to get evidence for the current state analysis, building
the proposal and validating it. The data collection plan is presented in Appendix 1.
The first round of data gathering is done for current state analysis. Data is gathered
with 42 interviews with key stakeholders from three purpose focuses: 10 with high-
level, 16 with mid-level and 16 with root-level experience. High-level experience in-
cludes executives, directors and other leaders who have more strategic view on the
subject. People with mid-level experience include people who are usually in managerial
positions and who could be seen as data users and consumers. People who have a
root-level experience are involved in Data and Analytics development or are super us-
ers in the current solutions provided. The objective of the interviews is to gather
knowledge about current state of Data and Analytics for chosen dimensions. Interviews
are recorded, and questions are asked based on the experience level (Figure 4). The
question framework is presented in Appendix 2 and works as a basis for the conversa-
tion. Interview sessions last from 30 minutes to an hour. Customers or other outside
stakeholders are not involved since the focus is on internal analytics. Internal docu-
mentation is studied to further understand the current organization, strategies and pro-
cesses around Data and Analytics.

10 (62)
Figure 4. Interview framework for different stakeholder groups
The proposal is build based on the best practises and maturity indicators found from
existing knowledge and current state at Veho. Current state analysis is used for choos-
ing the indicators most suitable for Veho’s culture and assessing the current maturity
score. Veho is given a score from one to five for each indicator. The score is summed
up to dimension level score and eventually to overall maturity score. At this stage data
gathering is focusing on workshops and interviews with key stakeholders to define a
target state for each dimension.
The third data round, the validation, is done in three levels. Firstly, data is gathered
from the project team group interview and a separate interview with the project spon-
sor, the CDO. Secondly data is gathered and used for alterations from the practical
validation done with strategy planning. Thirdly data is gathered from the management
team in the final validation stage.
2.4 Validity and Reliability
The basis of the conceptual framework is concluded from existing maturity models and
industry best practises from variety of sources. The framework is enriched with the in-
formation gathered from Veho employees. All the interviews are documented, and
notes taken from workshops. Nothing is based on assumptions and can be traced back
to either existing knowledge and current state analysis or other data gathered from
case company. The outcome of the thesis has gone through a three level validation
process.

11 (62)
3 Conceptual framework
Conceptual framework first looks at how data is changing the business world. The Data
and Analytics maturity and why it is important are addressed in the second section. The
third section looks at the existing maturity models and the last section focuses on the
chosen maturity dimensions and best practises found from existing knowledge.
3.1 Data is changing the business world
Digital era has entered the business life. More and more operational work takes place
through systems, and data is collected along the way. Data and new technologies have
enabled organisations to find new ways to utilize their existing markets, to find new
business models and to even create new markets. For early adopters of this idea it can
open significant opportunity to gain competitive advantage. (Gartner, 2017a) Gartner’s
(2017a) assumption states that ‘By 2018, more than half of large organizations globally
will compete using advanced analytics and proprietary algorithms, causing the disrup-
tion of entire industries.’ (p.10).
According to Gartner there is a division seen in IT where IT-word is being divided into
Technology and Information, meaning that information including Data and Analytics will
be separated from traditional IT-operations and getting closer to business. This can be
seen as the biggest paradigm shift in the way business is done in the age of technolo-
gy. Therefore, IT and business need to start working closer together to find ways to
operate in the digital world. Data and Analytics should be made part of the organisa-
tional culture by everyday decision making, guiding business operations toward better
results. (Gartner, 2017a)
The rapid growth of data volumes is disrupting business. According to McKinsey (2016)
the amount of data doubles every three years. The change is getting bigger when Data
and Analytics reach the big masses. Most of the companies are able to capture only a
fraction of the benefits Data and Analytics can offer. The difficulty lies in turning the
organizations into data driven in practise. (McKinsey Global Institute, 2016)
Organizations are using data and advanced analytics to be more competitive, increase
profit and reduce risk. New less traditional organizations are using data as a strategic

12 (62)
asset and getting advances from that. These organizations leverage data to deliver
better products and services. According to Forbes Insights (2017) it is the key for an
organization to understand the value of data in order to make it a core of their business
strategy. (Forbes Insights, 2017)
The information is more connected than ever. There are endless opportunities to utilize
data and generate value for business. There are also many obstacles in the way of
getting the best out of it. Budgets are tight, skills are lacking, and leadership is missing.
To be able to utilize technologies and data, it is important to have right organizational
and cultural elements in place. Data and Analytics programs need to be embedded in
all parts of the organization since the need for analytics is everywhere. (Gartner,
2017a)
3.2 Data and Analytics maturity
In the recent study of Forbes(2017) it is stated that Data and Analytics maturity can’t be
bought just with money. They surveyed more than 1500 global executives to get insight
on the needed maturity aspects around analytics and to understand how the maturity
relates to business success. The study states that only 7% of the enterprises belong to
the leading category of analytics maturity. By Forbes (2017) ‘leading’ means that ‘Their
analytics strategy is well-established and central to the overall business strategy. Their
current state of competitive ability in Data and Analytics is market-leading.’ (p.6). Most
belong to the challenging or developing categories where analytics strategy is estab-
lished but still not fully aligned with the enterprise strategy or starting to be seen as a
key strategy. Figure 5 shows that the organizations leading in analytics maturity are the
ones that have most likely increased revenue growth, operating margin and improved
risk management. (Forbes insights, 2017)

13 (62)
Figure 5. Why maturity matters? (Forbes insights, 2017:p.6)
The research compares different industries and geographic areas and ranks them
against each other. Finland shows an average score, when for example Sweden and
Norway are above average. When comparing eleven different industries from tele-
communications to healthcare and technology, automotive industry is ranked in the last
place. Automotive industry was seen as one of the most impacted sectors when the
specific question business tried to solve with Data and Analytics was related to in-
crease in customer satisfaction or retention and developing new products or services.
(Forbes insights, 2017)
The study scores maturity levels by industry using percentages. Automotive industry
was scoring 58 % which means that it is half way on the journey when the leading in-
dustry, telecommunications, is scoring 73 %. In other words, automotive industry is the
most immature industry studied in this research. Only 15% of automotive industry lead-
ers see Data and Analytics central to their business strategy. The leaders are strug-
gling with advanced analytics methods and processes more than leaders from other
industries. The insights and analysis based on the data are not well integrated to pro-
cesses. From positive side the trust in data is higher than in other industries. (Forbes
insights, 2017)

14 (62)
3.3 Maturity models
Maturity models have become important tools for IT management. These models have
been developed to position organizations against others and to find solutions to gain
desired maturity. Maturity models offer organizations a possibility to compare their cur-
rent status against a scale, to better prioritize the actions for improvements and to con-
trol the progress. The models consist of different maturity levels that show a typical
evolution path to gain the desired stage. To be able to move one stage up, the organi-
zation needs to fulfil needed criteria and characteristics. (Becker, Knackstedt & Pöp-
pelbuß, 2009)
Figure 6. Maturity model hierarchy
There are many maturity models out in Data and Analytics market. Many consultancy
companies and associations have their own models. The idea of these models is the
same as with other IT maturity models. The hierarchy of a typical maturity model pre-
sented in Figure 6 shows that dimensions have indicators that have individual charac-
teristics and criteria. Different maturity models related to Data and Analytics are pre-
sented in the next three chapters.
3.3.1 Gartner’s Enterprise Information Model (EIM) and IT Score Overview for BI and Analytics
Gartner has two maturity models that can be associated with Data and Analytics; the
Enterprise Information model and IT Score for BI and Analytics maturity.

15 (62)
3.3.1.1 Enterprise Information Model (EIM)
The idea behind Gartner’s Enterprise Information Model is to utilize Data and Analytics
for getting the best business outcomes. It is developed for Data and Analytics leaders
to enable establishing a roadmap to support continuous development. (Gartner, 2017a)
Gartner sees that Enterprise information management can’t be implemented as a pro-
ject but more as a program. It is seen to be transformational, taking several years to
reach the desired target. The EIM is supporting assessment and planning of the EIM
journey. With the maturity model, the leaders can identify the stage of maturity and
actions for reaching the next stage. (Laney, 2016)
EIM has seven building blocks that are assessed with five levels. (Laney, 2016)
• Level 1 (10%): The organization is aware of the challenges but lacks the need-
ed resources and/or leadership.
• Level 2 (30 %): The organization operates reactively and addresses problems
as they come.
• Level 3 (40%): The organization works proactively in some information related
topics and starts to think in the enterprise level. Programs are not aligned but
some are effective.
• Level 4 (15 %): Organizations that are industry leaders in aligned information
management. The decided approach makes sure people, processes and tech-
nologies are coordinated appropriately.
• Level 5 (< 5 %): Organizations have optimized ways of acquiring, administrating
and applying information as an asset and having high-functioning organization,
talent and technologies at hand.
(Laney, 2016)

16 (62)
Figure 7. Enterprise information management building blocks (Gartner, 2017a:p.13)
EIM identifies seven building blocks: Vision, Strategy, Metrics, Information Govern-
ance, Organization and roles, Information life cycle and Enabling infrastructure. The
building block or dimensions are not hierarchical, but all linked to each other like pre-
sented in Figure 7. (Gartner, 2017a)
The suggestion is that the maturity is assessed periodically to follow up improvements
in these capabilities over time. The information strategy should be aligned with these
capabilities and aimed to reach a few steps higher maturity than in the existing situa-
tion. It is recommended to have the maturity of different dimensions on similar level to
make sure the waste of resources is minimized. (Gartner, 2017a)
3.3.1.2 IT Score Overview for BI and Analytics
Gartner IT score is a maturity model designed for leaders. It gives them opportunity to
assess maturity in IT organizations in the five dimensions: people, practises and pro-
cesses, value and financial management, technology and relationships. (Gartner,
2018a). It is addressing overall landscape and as one element the BI and Analytics
maturity aspects, giving ways for leaders to build a roadmap for improvements in order
to reach the desired target. Gartner sees that there is a need for organizations to in-
crease their maturity since new methods, concepts and technologies are emerging.

17 (62)
The model they offer helps the organizations to take a strategic approach in business
intelligence (BI) and analytics. (Howdy & Duncan, 2015)
Gartner BI and Analytics maturity model is looking at dimensions like people, skills,
processes and technologies when assessing the maturity. It has five stages: unaware,
opportunistic, standards, enterprise and transformative. The assessment is done with a
questionnaire and the results should be utilized to create a road map for next steps to
increase the maturity. (Howdy & Duncan, 2015)
Figure 8. BI and Analytics Maturity Model (Howdy & Duncan, 2015)
The model consists of 5 stages presented in Figure 8 (Howdy & Duncan, 2015)
1. Unaware – BI and analytics is needed in ad hoc basis. There are no infrastruc-
ture, processes or performance metrics.

18 (62)
2. Opportunistic – BI and analytics projects are handled in separate business units
that have their own tools, infrastructure, specialists and metrics. Analytics appli-
cations are mainly reports and dashboards and have domain specific content.
3. Standards – Enterprise co-ordination starts to emerge through BICCs (Business
intelligence competence centres). Technology standards including architecture,
BI platforms and data warehouses are emerging. Yet only few processes share
data models.
4. Enterprise – Executives are sponsoring BI and analytics projects. The business
strategy is guided by common performance metrics and BI supports decision
making. Corporate wide rules and practises are applied to Data and Analytics
initiatives.
5. Transformative – BI and analytics has become a strategic initiative sponsored
by executive level. Business and IT is working together and focusing on busi-
ness value. Data is seen as a strategic asset and it is trusted.
3.3.2 IBM Big Data and Analytics maturity Model
IMB’s Big Data and Analytics maturity model is developed for taking the business and
technological factors into account when laying out a path to success through analytical
investments. The model is based on six dimensions which are assed with five stages of
maturity. These are: Business Strategy, Information, Analytics, Culture and Operational
execution, Architecture and Governance. (Nott, 2015a)
Figure 9. Big Data and Analytics maturity model (Nott, 2015b)

19 (62)
Figure 9 illustrates the integration between all dimensions and the inputs and outputs to
and from the assessment. The detailed criteria are presented in Table 1.
Table 1. IBM Big Data and Analytics maturity model (Nott, 2015a)
The maturity assessment starts with identifying business goals, analytics use cases
and details about existing skills, culture and processes related to analytics. Under-
standing these from the as-is situation leads into action plan and pilot projects. IBM
states that conducting a maturity assessment helps organizations to identify prioritized
cases, make better decisions related to architecture or organization and take strategy
into account. (Nott, 2015b)
20 (62)
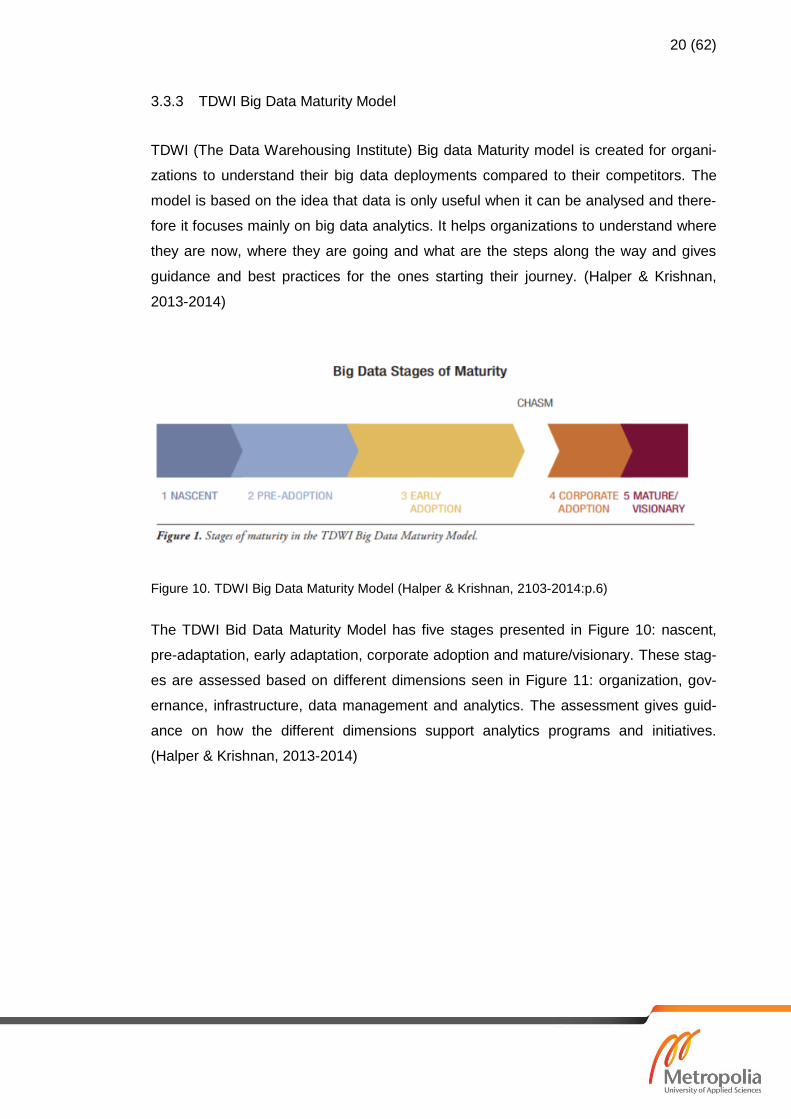
3.3.3 TDWI Big Data Maturity Model
TDWI (The Data Warehousing Institute) Big data Maturity model is created for organi-
zations to understand their big data deployments compared to their competitors. The
model is based on the idea that data is only useful when it can be analysed and there-
fore it focuses mainly on big data analytics. It helps organizations to understand where
they are now, where they are going and what are the steps along the way and gives
guidance and best practices for the ones starting their journey. (Halper & Krishnan,
2013-2014)
Figure 10. TDWI Big Data Maturity Model (Halper & Krishnan, 2103-2014:p.6)
The TDWI Bid Data Maturity Model has five stages presented in Figure 10: nascent,
pre-adaptation, early adaptation, corporate adoption and mature/visionary. These stag-
es are assessed based on different dimensions seen in Figure 11: organization, gov-
ernance, infrastructure, data management and analytics. The assessment gives guid-
ance on how the different dimensions support analytics programs and initiatives.
(Halper & Krishnan, 2013-2014)

21 (62)
Figure 11. TDWI Big Data Maturity assessment criteria (Halper & Krishnan, 2013-2014)
Five stages of maturity (Halper & Krishnan, 2013-2014)
1. Nascent – Most companies are unaware of big data and its value. There is a
lack of support from leadership. People interested in big Data and Analytics are
scattered around the organization. The governance is more IT specific and the
exploration of analytics and big data has just begun.
2. Pre-adoption – The interest in big Data and Analytics is rising. There are plans
on implementing big data solutions in the near future. The support comes usual-
ly from IT side instead of business.
3. Early adoption – Few Proof of Concept (PoC) -projects have been implement-
ed. Executive level sponsorship is emerging, and more people are involved
throughout the organization. The analytics projects are mostly descriptive, but
some predictive solutions are tested.
Between the early adaptation and corporate adaptation is the chasm. It de-
scribes the time-consuming obstacles an organization needs to overcome.
There are open questions about e.g. data ownership and gaining a common vi-
sion for big Data and Analytics.
4. Corporate adaption – End users are involved, and the way business is driven is
changing. Data infrastructure supports business strategy.

22 (62)
5. Mature/Visionary – Big Data and Analytics programs are executed fluently, in-
frastructure is highly tuned. The organization is excited about Data and Analyt-
ics and the initiatives arise from business. Only a few organizations are at this
level.
(Halper & Krishnan, 2013-2014)
3.4 Chosen maturity dimensions
Based on the existing maturity models, five dimensions were chosen for more detailed
viewing and are described in the following sub paragraphs. These dimensions were
chosen because of their importance to the holistic view. Most of the dimensions men-
tioned in existing models can be linked to these (Table 2). Without any one of these
dimensions maturity is not able to grow.
Table 2. Chosen maturity dimensions versus existing models.
Chosen for more detailed viewing Dimension in existing models Maturity Model
Strategy and vision Business strategy IBM Data and Analytics
Vision Gartner's EIM
Strategy Gartner's EIM
Organization and people Organization TDWI Big Data
Culture and Execution IBM Data and Analytics
Organization and Roles Gartner's EIM
Technology Infrastructure TDWI Big Data
Architecture IBM Data and Analytics
Infrastructure Gartner's EIM
Data Management Governance TDWI Big Data
Data Management TDWI Big Data
Governance IBM Data and Analytics
Information IBM Data and Analytics
Life cycle Gartner's EIM
Governance Gartner's EIM
Analytics Analytics TDWI Big Data
Analytics IBM Data and Analytics
Metrics Gartner's EIM
Without the support from strategy and vision there will be difficulties in getting enough
human and monetary resources and needed weight in action planning. Without suitable
skills and roles, the organization is not able to develop needed solutions or use them.
The trust in data builds up from people understanding it. Technologies are quite often
seen as the main barrier when trying to increase analytics in organization. It is a factor

23 (62)
but not the main issue. The analytics use cases need to be highlighted, since they are
driven by needs and business value that are the reason why business is willing to in-
vest in the journey. The implementation of different analytics types can benefit organi-
zation in more ways than traditional BI solutions. The solutions implemented will raise
the awareness and commitment in the organization. The last dimension chosen was
data management since analytics is based on data and good quality of it. The stage
criteria for all chosen dimensions combined from existing models is listed in Appendix
3.
3.4.1 Strategy and vision
Since organizations are led by a strategy, it is important that Data and Analytics is em-
bedded in it. Gartner analysts state that if a leader is not able to convert their Data and
Analytics vision on the first page of their strategy, there is a likelihood for failure (Buy-
tendijk et al., 2017).
Building a Data and Analytics strategy starts from the vision. Since all organizations are
different they should have their own vision for Data and Analytics appropriate to their
business and needs. Data and Analytics vision should be created so that all key stake-
holders have the same expectations. The vision should explain the value adding aspect
of Data and Analytics. (Buytendijk et al., 2017)
Commonly a vision can be divided into three types; Data and Analytics as a utility, as
an enabler or as a driver. According to Gartner information surveys (2017), 80 % sees
Data and Analytics as an enabler, meaning that Data and Analytics is used mainly for a
specific business goal. The approaches can be different but the ultimate target of ena-
bling business success is the same. According to Gartner analysts the vision is a com-
bination of these types and organization’s value discipline. The three value disciplines
are operational excellence, product innovation and customer intimacy (Buytendijk et al.,
2017)
When there is a clear vision, a strategy to implement it should be created. Gartner em-
phasises the role of CDO (Chief Data Officer) in building Data and Analytics strategy.
The strategy is needed for turning the demand into actionable and measurable objec-
tives to deliver business value. One key message is that these should be aligned with

24 (62)
business strategy, create business value and focus on new innovations. (Gartner,
2017a)
3.4.2 Organization and people
There are multiple ways and best practises for building an organization to support the
growth of Data and Analytics maturity. There is a high demand for Data and Analytics
professionals who master the technical, business and data science skills of Data and
Analytics. The traditional data modelling has become more mainstream and new inno-
vations in artificial intelligence, Internet of things, machine learning and advanced ana-
lytics are coming. To support the demand from business and development with new
technologies, new skills and a new organizational structure are often required.
3.4.2.1 Organization
Gartner sees that organizations need both central and distributed analytics functions.
The role of central function is to describe and optimize the analytics landscape across
domains to improve productivity and governance and to harmonize the decentralized
analytics into a leveraged strategic discipline. The actual analytics is then carried out
under various labels across business domains. (Gartner, 2017a)
Gartner’s strategic planning assumption (2016) is that ‘By 2019, 50% of centrally orga-
nized analytics programs will be replaced by a hybrid organizational model that shares
power with local domain analytics leaders’(Oestreich & White, 2016; p.2). Data and
Analytics is used across the organization and therefore multiple individual teams or a
single centralized team can be identified. According to Gartner there is a shift towards
the office of the CDO that will lead the analytics strategy, practises and development of
use cases and manage information assets by delivering insights as described in Figure
12. The idea is that the centralized team works together with domain teams. (Oestreich
& White, 2016)

25 (62)
Figure 12. Example of a distributed Data and Analytics practise. (Oestreich & White, 2016:p.4)
To be able to move from BI application and reporting development to enabling organi-
zations, Gartner is proposing to evolve technically oriented BI competency centres into
analytics centres of excellence that have a wider set of capabilities and understanding
of business. These centre units (ACE) should focus on five capability types: organiza-
tion, project, education, data and technology. ACE would be responsible for enabling
Data and Analytics for business more than executing it. (Gartner, 2017a)
3.4.2.2 Skills
Gartner’s study from 2016 proposed that ‘in 10 years, the skills and knowledge in your
organization will have little resemblance to the skills and knowledge you have today.’
(Gartner, 2017a:p.6.) and 77% of the 149 IT and business executives who responded
to the survey agreed. This means a huge impact on the skills needed. Digital business
leaders such as Amazon and Alibaba find that data and analytical skills would be their
first priority. A shift from technical specialists to more business-focused generalists is
seen to take place. Still there is a need for both of these groups and Gartner finds that
there is often a lack of shared understanding and a set of common approaches be-
26 (62)
tween BI and data management people and the new generation of users and practi-
tioners. (Gartner, 2017a)
According to Gartner analysts, algorithmic business is developing and therefore new
kinds of skills are required to utilize advanced analytics. When analytics is turning more
into prescriptive and predictive, algorithms are a skill that is needed besides the tech-
nical and business knowledge. (Oestreich & Buytendijk, 2016)
New skills are not only for IT and business analysts. Gartner sees that the cultural
change will create citizen data stewards and scientists who will have an important role
in the organisation and as part of the change. The responsibility for data management
and quality will be shared with business functions and the tools used will have self-
service capabilities to get more diverse insights faster. Real-time analytics can only
take place if the people running the processes are able to obtain their own insights.
This will require new skills and will be a huge change for an organisation. (Gartner,
2017a)
3.4.2.3 Roles
Gaining maturity in Data and Analytics needs new roles. Often these roles are a hybrid
between IT and business, some working in centralized team and some in business.
According to Gartner it is important to recognize these roles and a virtual team should
be established. The role of this team is to collaboratively execute the Data and Analyt-
ics strategy and governance model. This will be to avoid having too many analytics use
cases in silos and to help develop the needed competencies all over the organization
with training. (Oestreich & Buytendijk, 2016)
The strategic importance of Data and Analytics is led by digitalization and there is a
need for an executive level leader. In the past the leaders of data management, inte-
grations, business intelligence and analytics have been middle management roles. The
problem is that these roles have not had the needed power to drive the strategic im-
portance of Data and Analytics on corporate level. According to Gartner, an increasing
number of organisations are creating the role of CDO to underline the importance of
the matter. CDO is an executive level leader who is responsible for information assets
and leading the cultural change. (Oestreich & White, 2016)

27 (62)
There are multiple types of analyst roles in an organisation depending on the use cas-
es. Analytics consumers are the ones using ready-built interactive reports and dash-
boards. Data analysts and statisticians develop reports and interactive visualizations
and work with data warehouses, modelling and integrations. Citizen data scientists use
technological tools such as smart data discovery tools to derive advanced insights.
Data scientists have understanding of the end-to-end process and can extract various
types of knowledge from the data. (Oestreich & White, 2016)
There are other important roles that are needed to make sure that Data and Analytics
can be utilized. Facilitators ensure that stakeholder requirements are identified in the
best possible way. Facilitators are responsible for increasing data-driven thinking and
stakeholder participation in data-driven culture and making sure that initiatives are fo-
cused on business needs. Data engineers make the data available for analytical use.
They help in preparing data, enable access to data and are part of establishing guide-
lines regarding data management. Information architects are responsible for discover-
ing Data and Analytics requirements for all information use cases. They work with
leadership and give strategic, information-based recommendations on how to utilize
data and to make sure current solutions are operating. Information stewards are re-
sponsible for making sure information governance policies are executed in all functions
of the organization. They monitor, implement and resolve issues related to the policies.
(Oestreich & White, 2016)
One way of making sure algorithms are experimented and developed is to establish a
data science laboratory. The possible roles needed for this are data analysts, data sci-
entists and statisticians. (Oestreich & Buytendijk, 2016). For bigger enterprises, there
are several other roles that would enrich the skillset from Chief Analytics Officer to data
visualists.
3.4.3 Technology
Technological solutions are an essential part of Data and Analytics. The traditional BI
solutions have been offering users the ability to analyse historical data by ad-hoc and
static reporting. These solutions are usually built on top of an enterprise data ware-
house (EDW). There data is cleaned, structured and handled for reporting purposes.
There has been a change in user needs and today the users need a more direct ac-

28 (62)
cess to data without IT specialists involved. Deloitte (2018) lists three challenges relat-
ed to traditional BI solutions pointed out by agencies:
1. Lack of on-demand analysis capabilities: Users want free access to data when
they need it and for their specific purposes.
2. Need for predictive analyses: Traditional BI is focusing on historical analysis
and the demand is for predictive and future-looking. Using predictive models,
businesses want to base their actions on data.
3. Analysis of mixed data types: Traditional BI is focusing on structured data. The
demand is for unstructured and new data sources connected to existing struc-
tures.
Figure 13. Example of needed analytics solutions (Cook, 2017:p.30)
Gartner analyst Henry Cook (2017) presents the needs for modern analytics (Figure
13). It consists of three tiers: Information portal with reports and dashboard, analytics
workbench with data discovery and data science laboratory with data mining and ad-
vanced analytics. (Cook, 2017:p.30) Data discovery answers to the need of on-demand
analysis and data science to the need of predictive analytics.
29 (62)
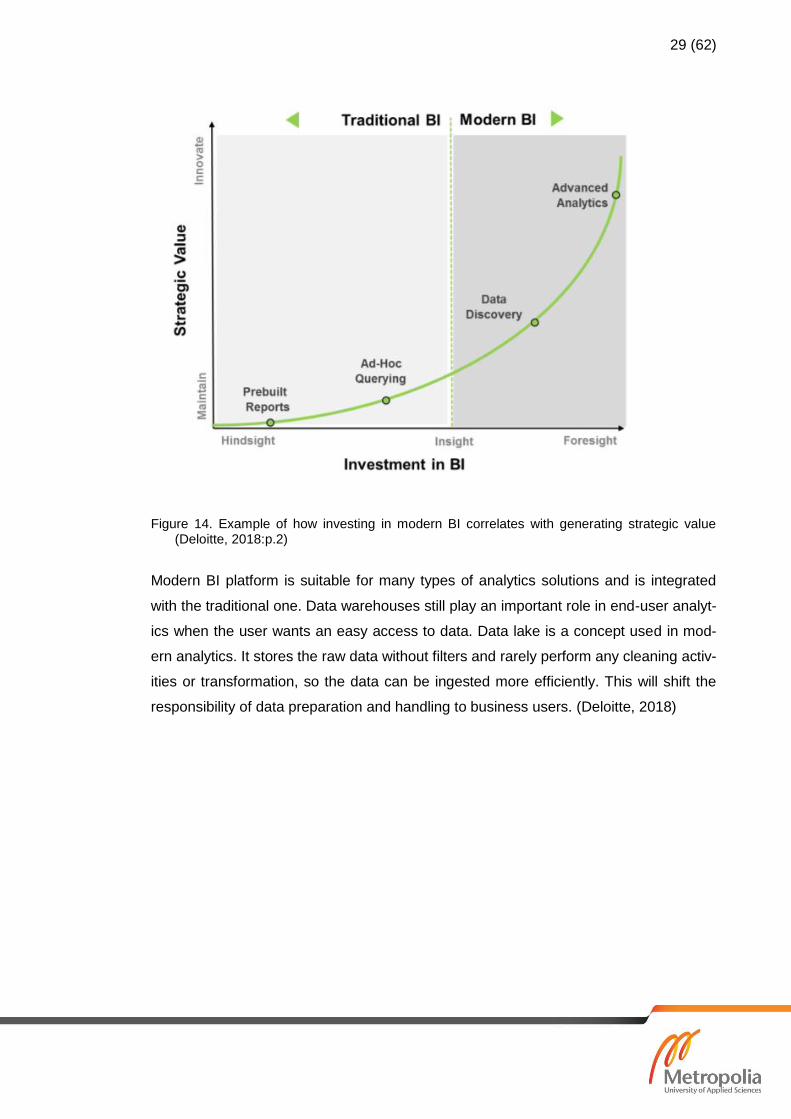
Figure 14. Example of how investing in modern BI correlates with generating strategic value (Deloitte, 2018:p.2)
Modern BI platform is suitable for many types of analytics solutions and is integrated
with the traditional one. Data warehouses still play an important role in end-user analyt-
ics when the user wants an easy access to data. Data lake is a concept used in mod-
ern analytics. It stores the raw data without filters and rarely perform any cleaning activ-
ities or transformation, so the data can be ingested more efficiently. This will shift the
responsibility of data preparation and handling to business users. (Deloitte, 2018)

30 (62)
Figure 15. Example of a modern Data and Analytics architecture (Deloitte, 2018:p.4)
Data warehouses are often used for more accurate metrics and financial data. They
are visualized with dashboards or list reports. Data discovery tools can be connected to
a data warehouse or a data lake. These tools are used for analysing the data through
summary statistics, visualizations and what-if analysis. The users are usually business
analysts or more advanced business users. (Deloitte, 2018)
Data lake platforms support tools that are needed for advanced analytics. Advanced
analytics refers to techniques used for gaining deeper insights, data driven actions and
analysis from diverse set of data. Methods used are usually the same used in statistics
or artificial intelligence scene like machine learning algorithms or regressions. (Deloitte,
2018) Models created for advanced analytics need huge sets of data and therefore the
more efficient way is to use cloud-based data lakes. The use of advanced analytics and
data lake requires special skills and experience and the tasks are performed usually by
data scientists, data analysts or IT specialists. Outcomes of the models such as the
predictions can be inserted into data discovery tools, reports or end user systems.

31 (62)
Figure 16. An example of a documented modern BI and analytics architecture (Cook, 2017:p.10)
Data and Analytics architecture needs planning and experiments. The architecture
should be well-documented, and a road map crafted for upcoming years.
3.4.4 Analytics
Gartner divides analytics into four different capabilities. They categorise analytics
based on the questions answered, what kind of tools and techniques are used and
what is the level of human input until actions can be taken based on the data. Organi-
zation’s Data and Analytics maturity rises when they are able to use these different
capabilities. (Gartner, 2017a)
32 (62)
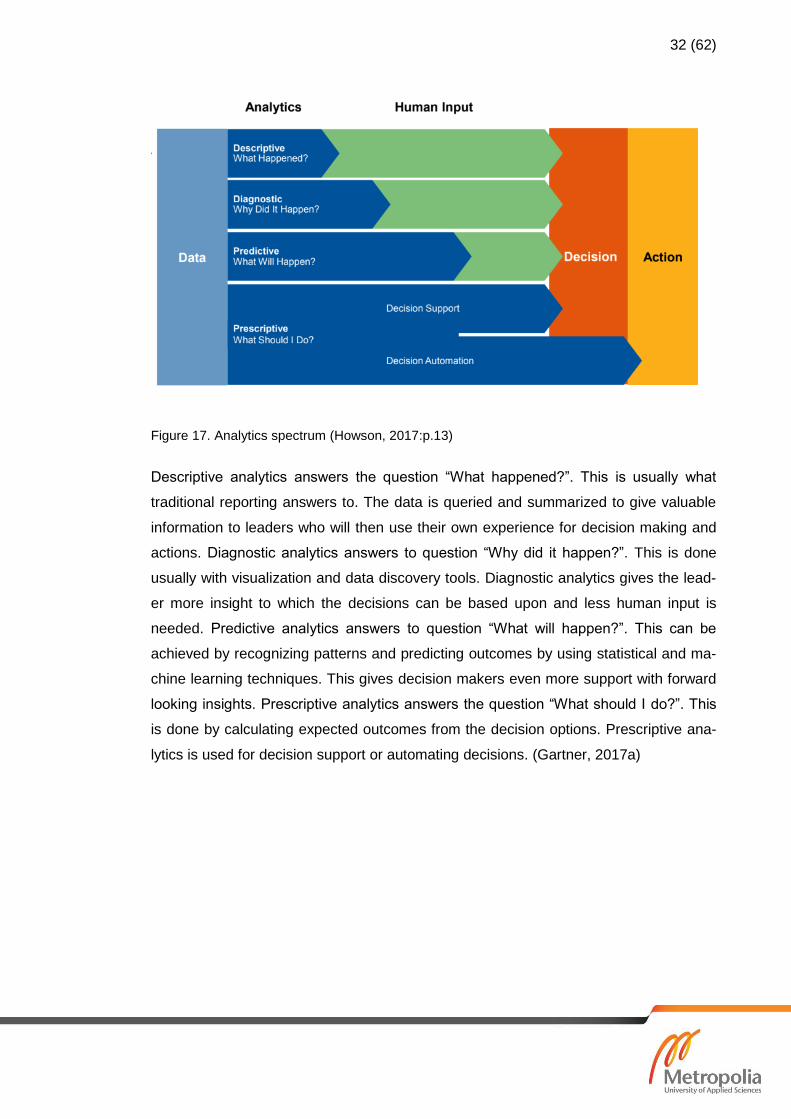
Figure 17. Analytics spectrum (Howson, 2017:p.13)
Descriptive analytics answers the question “What happened?”. This is usually what
traditional reporting answers to. The data is queried and summarized to give valuable
information to leaders who will then use their own experience for decision making and
actions. Diagnostic analytics answers to question “Why did it happen?”. This is done
usually with visualization and data discovery tools. Diagnostic analytics gives the lead-
er more insight to which the decisions can be based upon and less human input is
needed. Predictive analytics answers to question “What will happen?”. This can be
achieved by recognizing patterns and predicting outcomes by using statistical and ma-
chine learning techniques. This gives decision makers even more support with forward
looking insights. Prescriptive analytics answers the question “What should I do?”. This
is done by calculating expected outcomes from the decision options. Prescriptive ana-
lytics is used for decision support or automating decisions. (Gartner, 2017a)

33 (62)
Figure 18. How organizations are doing analytics (Hawson, 2017:p.13)
Most of the organizations are not doing advanced meaning predictive and prescriptive
analytics. Figure 18 illustrates that majority of organizations are doing only descriptive
analytics. (Hawson, 2017) All of these analytical capabilities should be combined and
used in the right content. This will help organizations to address a larger amount of
problems, base decisions on facts found from data and to optimise processes (Gartner,
2017a)
3.4.5 Data management
Data is only important if it can be trusted. Data management supports all processes
alongside analytics. To be able to process e.g. transactions, the data quality, integra-
tions, metadata, master data and application management should be practiced. (Gart-
ner, 2017a) Data should be seen as an asset that needs governance. It is an invest-
ment that has impact on business profit and growth. It will help in creating more value
to customers and reducing errors when processes that demand manual work will be
automated. (Gregory, 2011)
Governance consists of privacy and regulatory compliance, security and data quality.
The role of data governance is growing in organizations. It has been defined as ‘the
exercise of decision-making and authority for data related matters’ by Gwen Thomas
from The Data Governance Institute (2010) cited by Gregory (2011:p.235). It also has
been described to be ‘the business practice that defines and manages strategies for

34 (62)
people, processes, and technologies to ensure that valuable data assets are formally
protected and managed throughout the organization’ (Gregory, 2011:p.235). Data gov-
ernance can be seen as a methodology for maximizing the value of organization’s data
assets instead of ways to fix the data (Fisher, T. 2009).
Gartner introduces the concept of Effective Information strategy. Many organizations
have hard time in categorizing and prioritizing their data. It is for the Data and Analytics
leaders to gradually improve information governance, sharing and managing. It is im-
portant to understand the different use cases for data and the importance of it. (White &
Beyer, 2017)
Figure 19. Local, regional and centralized governance (Fritsch, 2017:p.16)
A part of data governance is the organizing of it. Like seen in Figure 19 data govern-
ance can be local, regional or centralized (Fritsch, 2017:p.16). This means that there
will be a need for different roles such as data owners and data stewards that need to
be organized accordingly and the responsibility should be in business. IT is responsible
for technological solutions, not the data itself.
According to Adrian Gregory’s paper, poor data quality has a risk of leading up to pos-
sible data thefts, data privacy breaches or poor quality. Poor quality of data is very

35 (62)
common and leads into failing development programs and not reaching business tar-
gets. In an organization that manages their data assets optimally data helps in optimiz-
ing business processes and personalizing customer relationships. The governance
related processes such as life cycle management, quality monitoring and housekeep-
ing are automated. The governance strategy is corporate wide when the goal is to en-
force the best practises throughout. The internal data itself is enriched with external
data. (Gregory, 2011)
36 (62)
4 Current state analysis
42 people were interviewed at Veho for current state analysis. The questions are based
on conceptual framework and the analysis compares Veho to best practises.
Veho is willing to invest in Data and Analytics and the leaders see the importance. The
maturity concept is unfamiliar, and the current focus seems to be on data quality and
traditional BI solutions. A vast amount of effort has been put to customer data man-
agement and it has gained support from the leaders. The quality issues seem to be on
everyone’s mouth despite the actions taken. Technology is seen as the answer to the
problems while other factors play a smaller role.
Since hiring a CDO (Chief digital officer) in 2017, Data and Analytics has gained more
strategic visibility as one of the core elements of digital strategy. The CDO sees that
there are lots of possibilities for improving efficiency and customer experience, the cor-
ner stones of Veho, with data. He sees that there is a long road ahead but highlights
the support from him and from other members of the management team. One of the
practical embodiments of the support is that a development manager for Data and Ana-
lytics has been hired in early 2018.
Analytics as a concept seems to be unfamiliar. When asked about how data is utilized,
most of the interviewees relate data to contacting customers or operational or financial
reporting. Most of the directors interviewed stated that data should be used more but
yet many of the interviewees asked about the meaning of analytics. When explained,
most of them said that currently reporting is focusing on historical data and it is up to
the readers how they interpret the information. It is recognized that analysis based on
data is done and that information is used for decision making.
Veho as an organization is willing to invest in analytics and most of the leaders recog-
nize the importance of it in the current and future business world. Still the means of
building a data driven culture are missing. In many cases analytics is seen to come as
a side product of projects and technological solutions. It is seen as a something gener-
ated in the digital services department. One of the managers who was interviewed
asked for a tool to get analytics. This is a good example of not understanding that the
change needs maturity in other aspects as well, such as skills, strategy and data man-
agement.

37 (62)
These observations support the holistic cultural approach needed for taking next steps
on building the maturity. There is excitement and enthusiasm about Data and Analytics
and the opportunities that it can give, but hesitation regarding the efforts it needs to
reach the level that will bring the advantages. The dimensional analysis is opened
more in next chapters.
4.1.1 Strategy and vision
In a mature organization Data and Analytics is a visual part of business strategies. As
part of the new strategy Veho has listed four main changes that will affect the business.
Under one of those it is stated that ‘one way to increase the customer centricity is to
increase operational and profitable transparency by developing and utilizing analytical
capabilities’ (Veho, 2017:p.13). Analytics is a part of actions to be taken when reacting
to the changes, but it is not a top priority is business strategy. Customer data has been
lifted up on business road maps in the last years. According to one of the controllers
the focus is on data quality and later enabling the use of data for further analysis. As a
conclusion from the interviews it seems that the leaders from business side feel that
Data and Analytics is important, but they don’t fully recognize the benefits or the efforts
it needs.
Veho has an ICT and Digital strategy (2017) with a statement about Data and Analytics
saying ‘Veho will have a competitive advantage from its advanced internal analytics
services and high-quality, up to date customer and product information. We will have
the needed competencies and resources for it“. This could be seen as the vision for
2021. The digital strategy is a guideline for the organization of digital services but in-
volves the whole organization. The digital strategy lists the elements and the target
state for analytics with focus on data management, data utilization and organization.
Business leaders are not familiar enough with the content to commit to the targets.
CDO (Chief Digital Officer) oversees and supports Data and Analytics transformation.
He is a part of Veho’s management team. Discussion around Data and Analytics has
accelerated during past years and interest in it is growing among leaders, management
and some specialist groups. The sales and maintenance managers interviewed still
don’t see the importance of future oriented analytics and are mainly focusing on the

38 (62)
floor-level operations and historical performance. In many occasions the focus is in
technology and data management instead of a holistic view of the culture.
4.1.2 Organization and people
A mature organization can be organized in different ways. Veho currently has a central
data team inside digital services formerly known as ICT. The team is responsible for
business intelligence, ETL, data warehousing and reporting related development and
maintenance. The team is technically oriented and distant from business. Team cre-
ates all BI solutions such as reports for business and is focused on execution rather
than enablement. There is a chronic recourse shortfall that is transformed into occa-
sional inefficiency.
Organization and people is seen by the interviewees as the dimension having most
issues. When asked the finance organization the roles were quite clear, and the main
challenges were on gaining more skills and competences. From business side the roles
were not that obvious and the need for analysts was bigger. In business there are peo-
ple who use reporting solutions, some who manage their own data and some who do
analysis based on the data but there are no full-time roles for Data and Analytics relat-
ed tasks. Some business people are participating in small enhancement activities done
related to BI and reporting but not the actual development. Because this involves a
limited amount of people and does not cover all parts of the organization, the maturity
level is uneven and is more ad-hoc than planned in long term. It is difficult to find re-
sources from business side due to the initiatives not being part of business road map.
The co-operation between the central data team and business is not working well and
there are issues with prioritizing and defining the projects and in communication.
The role of a business analyst does not exist, and it is not fully understood what it is
needed for. The controllers perform tasks related to business analytics but a person
who is searching for use cases and developing analytics is missing. Business and fi-
nance controllers are acting as BI key users in some business areas and they are do-
ing analysis to support leadership mainly from financial perspective. There are no data
stewards, coordinators or data scientists. Skills needed for advanced analytics are
missing in the whole organization. The centralized team is lacking business skills be-
cause pf being far from the daily business operations. According to a BI specialist there
is a need for reporting and data discovery developer. These skills are outsourced even

39 (62)
though they are seen as part of much needed business skills for the central team.
Business is lacking know-how from basic reporting, BI and data handling skills. Accord-
ing to the head of development, the need for basic and advance training exists.
CDO is overseeing that the vision for Data and Analytics comes to life. A development
manager for Data and Analytics is driving the transformation. There is support from
business leaders, but a lack of commitment. This is seen in the organization as there
are no analysts, data owners or BI responsible in business.
4.1.3 Technology
Veho does not have any plan for the future or documentation for the current Data and
Analytics architecture or tools. The current data warehouse has been built from 2012
until now and is evolving all the time. It uses mainly batching data from internal sources
through ETL processes and sends the data to reporting solutions and CRM system
(Figure 20). The data is not organized based on any known model but is more evolved
from the need when new layers and data are added on top of the old structures. There
are many issues with performance and the time spent on maintenance is huge. Data is
in siloes since all the major business units have their own database. Veho’s data ware-
house specialist states that data integrity can be seen as the biggest challenge.
Figure 20. Current BI architecture. (Veho, 2018)
The reporting tools that Veho is using are not modern analytics tools, but more suited
for static reporting. There are several reporting solutions built that give users answers
to various questions with historical data, but the usage is not versatile enough for ad-
vanced users who would need a wider access to data. One of the controllers stated
that current reporting solutions don’t address all their needs for visualization and data
discovery. The problem according to the head of development is that the business end
users don’t know how to use and utilize the tools. Currently there are about 250 active
users and 800 in total. The performance of the reporting tools is in reasonable state
40 (62)
and the data is trusted. Generally, the key users are satisfied with reporting and think
that they are sufficient enough.
Data is not real-time but refreshed daily. Open data is not used at all. According to a BI
specialist there could be more opportunities to utilize the current data and to enrich it
by buying more data outside. The problem has been that there is no place or tools for
storing and utilizing all different data source types that can be used for advanced ana-
lytics. Advanced analytics needs experimenting, and the possibility for that is missing.
Tools for advanced analytics typically use data stored in a cloud-based data lake. Veho
has no existing cloud solutions for analytics and the cloud strategy for that is unclear.
Azure has been tested but is not in use.
There are no self-service options, visualization capabilities are very limited, and the
mobility and sharing options are non-existent. There are no data discovery tools avail-
able except for an external olap cube used by a very limited number of users. Visuali-
zation and presenting results are done by Power Point and are based on manually up-
dated Excel sheets. This needs a lot of effort and resources and there is a high risk of
mistakes.
4.1.4 Analytics
The director of commercial vehicle sales has been an advocate of data quality and
management in his organization. He sees that the financial reporting and analytics is
on a good level but to actually lead sales and marketing with data more efforts are
needed. In some business units, data is analysed and even predictions made based on
it. That’s why there is a need to identify the difference between analytics and analysis.
Analytics means the answers data gives the user and analysis describes the part from
data analytics to decision done usually by a human. For people analysing data, analyt-
ics gives more effectiveness and accuracy and possibilities to use much bigger and
versatile data masses.
Descriptive analytics explaining what happened is in good shape and done using Qlik-
View reporting. Dashboards and metrics are defined for main business processes to
support leaders and operational data is available for management. Sales people and
technical specialists don’t have any access to summarised data related to them, expect
for what is shared with them by their managers. Traditional BI solutions exist in all

41 (62)
business areas and are answering the questions of most reporting needs. One of the
main functions of descriptive analytics according to the CFO is to keep track of the
quality and monitor processes. He also highlights that a lot of time is spent currently on
creating the information for the business users when the time should be used more on
creating additional value. The people reading reports are not necessarily analysing the
information and their decisions and actions are not always based on it. Current BI ven-
dors offer help to traditional BI solutions related to descriptive analytics. There is an
ongoing discussion about using outside help for cases needing advanced analytics.
Diagnostic analytics asking why it happened is done mostly by controllers and some
business managers. It is based on data, but the answers are mostly gathered and gen-
erated manually in Excel. There are some drill-down capabilities in the current reporting
solution but no data discovery possibilities. It was also clear that diagnostic analytics
does not take place in all business areas. There are needs to be able to track deviation
and even automate tasks based on the findings.
Predictive analytics asking what will happen is not used. Controllers are forecasting
performance and financial figures based on data but are not using predictive analytics
or models supporting their work. The analysis is based on combination of business
knowledge and numbers from previous periods. There is some development done that
could be continued with adding predictive models. According to the CFO there is a
need to predict losses and prevent them within operations.
Prescriptive analytics does not exist at Veho except for few experiments with marketing
automation. Some automated messages are sent to customers based on their mainte-
nance history. These are not complex or very accurate and are not based on large data
sets.
4.1.5 Data management
Veho did a data governance study in 2014 and as a result of that launched a customer
data governance model including organization, quality and monitoring related aspects.
The material is versatile and also precise. Data concepts and standards were defined,
and data was systematically monitored. It was done with the help of a consulting com-
pany. When the project ended the material was not updated. The data concepts are
unclear, and the principles are forgotten.

42 (62)
The organization defined in the governance model is not in place. Data owners are
missing, there are no data stewards. The group managing the governance still exists
and meets once a month, but the purpose is unclear. System users don’t understand
the current priciples and they are not committed to feeding the necessary and correct
data. User guides are outdated, and open questions arise from the same issues. There
is an eminent need for more training for users to understand the current principles.
Most of the data initiatives done concern customer data. Other aspects of master or
meta data are not handled systematically. Data architecture exists on some levels due
to the implementation of a master data system and semantic layers used for reporting.
Still the architecture is not documented or in place for all areas.
Support from C-level and leadership is gained when communicating data related issues
and tasks. Data quality is monitored monthly, but the metrics need updating to suit cur-
rent purposes. Due to GDPR data life cycle management work has been started, but
implementation is slow. According to the specialist responsible for customer data quali-
ty, systematic housekeeping activities are done with the data both manually and auto-
matically. The head of development highlights that much more could be done with the
data if it was in a better shape. As a summary, the IT personnel who have experience
from other data environments say that there are a lot of activities done but business
people say that not enough. The truth lies somewhere between. More could be done
and one of the main challenges is to get the users understand why and how data
should be handled.
43 (62)
5 Building the proposal
Building of the framework is conducted in three stages
1. The maturity indicators and best practises given by Gartner and other sources
are collected for chosen dimensions and adjusted for Veho’s business culture
2. Current state is analysed and compared to existing knowledge and an assess-
ment score of the current stage is given
3. The target state is defined and a target stage set.
The maturity indicators found from the models and best practices for different dimen-
sions are assessed in tables found in subchapters. Veho is given a score for all of
these stages based on current state analysis and an overall score is calculated based
on the average.
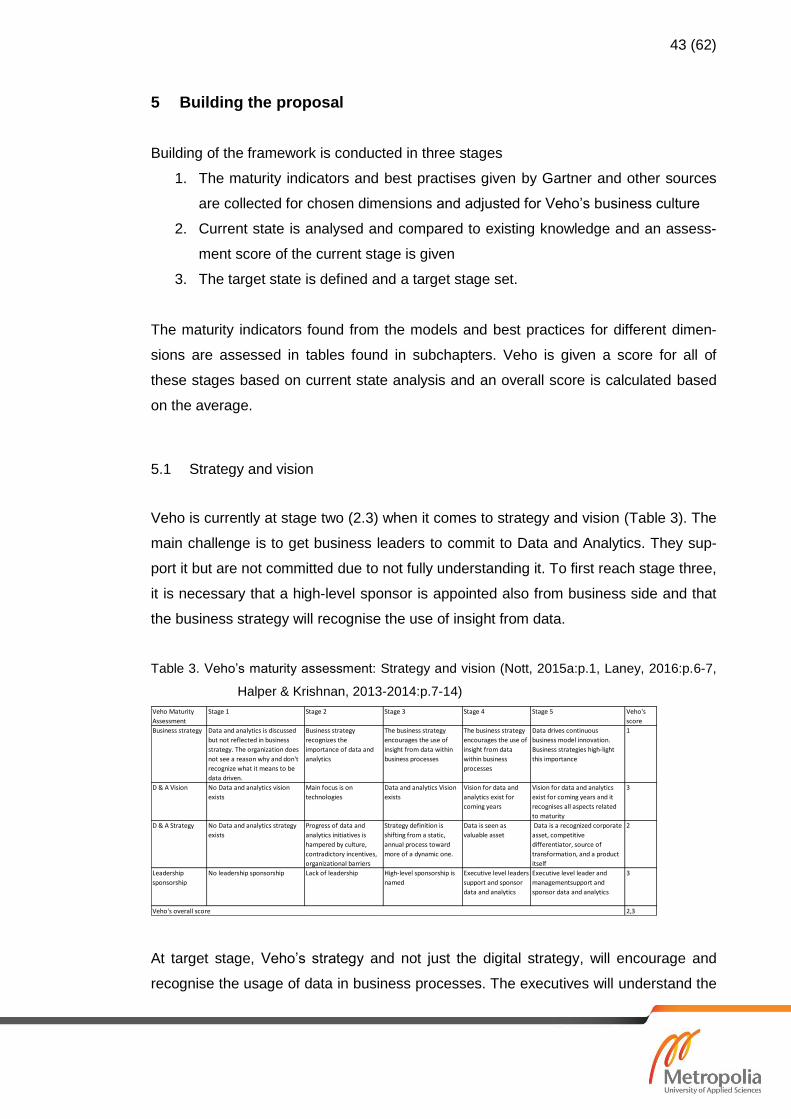
5.1 Strategy and vision
Veho is currently at stage two (2.3) when it comes to strategy and vision (Table 3). The
main challenge is to get business leaders to commit to Data and Analytics. They sup-
port it but are not committed due to not fully understanding it. To first reach stage three,
it is necessary that a high-level sponsor is appointed also from business side and that
the business strategy will recognise the use of insight from data.
Table 3. Veho’s maturity assessment: Strategy and vision (Nott, 2015a:p.1, Laney, 2016:p.6-7,
Halper & Krishnan, 2013-2014:p.7-14)
At target stage, Veho’s strategy and not just the digital strategy, will encourage and
recognise the usage of data in business processes. The executives will understand the
Veho Maturity
Assessment
Stage 1 Stage 2 Stage 3 Stage 4 Stage 5 Veho's
score
Business strategy Data and analytics is discussed
but not reflected in business
strategy. The organization does
not see a reason why and don't
recognize what it means to be
data driven.
Business strategy
recognizes the
importance of data and
analytics
The business strategy
encourages the use of
insight from data within
business processes
The business strategy
encourages the use of
insight from data
within business
processes
Data drives continuous
business model innovation.
Business strategies high-light
this importance
1
D & A Vision No Data and analytics vision
exists
Main focus is on
technologies
Data and analytics Vision
exists
Vision for data and
analytics exist for
coming years
Vision for data and analytics
exist for coming years and it
recognises all aspects related
to maturity
3
D & A Strategy No Data and analytics strategy
exists
Progress of data and
analytics initiatives is
hampered by culture,
contradictory incentives,
organizational barriers
Strategy definition is
shifting from a static,
annual process toward
more of a dynamic one.
Data is seen as
valuable asset
Data is a recognized corporate
asset, competitive
differentiator, source of
transformation, and a product
itself
2
Leadership
sponsorship
No leadership sponsorship Lack of leadership High-level sponsorship is
named
Executive level leaders
support and sponsor
data and analytics
Executive level leader and
managementsupport and
sponsor data and analytics
3
2,3Veho's overall score

44 (62)
benefits of Data and Analytics maturity. Instead of seeing data now more as part of
technology, in 2021 it should be seen as a valuable asset. Data and Analytics strategy
and vision exists for upcoming years. The stage Veho is targeting to reach at 2021 is
four.
5.2 Organization and people
Veho is lacking the needed defined organizational structure, roles and some core skills
to be able to grow Data and Analytics maturity and therefore is at stage two (2.3) like
seen in Table 4. The organization and people dimension was seen as the most chal-
lenging one since it needs more resources and the change takes place slowly. To
reach stage three, Veho needs to have a Data and Analytics organization defined and
to have first business analysts and data analysts or scientists named. Executive level
sponsorship needs to emerge.
Table 4. Veho’s maturity assessment: Organization and people (Laney, 2016:p.11, Halper &
Krishnan, 2013-2014:p.7-14).
The stage Veho is targeting to reach in 2021 is four. The aim is to have a hybrid organ-
ization where a centralized team is enabling analytics, governing Data and Analytics
initiatives and managing data policies. As a result of a workshop with relevant business
Veho Maturity
Assessment
Stage 1 Stage 2 Stage 3 Stage 4 Stage 5 Veho's
score
Organization Data and analytics
related
responsibilities are
resourced based on
applications and
business people
manage their own
data
Business is involved in
resolving data related
issues but not in
development or
planning. IT and
business are far from
each other.
Data and analytics
organization is established
Data and analytics moves
away from IT as a separate
unit closer to Business.
Former data team is turned
into a competency center
which is doing less but
enabling more of what
business is doing.
Collaboration
between centralized
team and business
functions is part of
the culture. Data and
analytics initiatives
are more business
centric and driven.
2
Skills No data and
analytics skills or
training
Technical skills exist
in the IT team.
Business is does not
have needed skills.
No training organized
for employees
Implementation of data
and analytics related
projects is difficult due to
finding needed resources
from business side. POCs
are helping to gain more
interest and engagement
from business
Skills start to emerge in
business. On going training
is organized
Business executives
see data and
analytics as an
essential part of their
operations.
2
Roles The organization
does not have any
devoted people
handling data and
analytics
IT based data related
roles exist and are
handling data
administrative and
modelling related
tasks
Business unit-based data
analyst and data scientists
start to emerge.
Data scientists,
coordinators and analysts
are prevalent part of
business.
Data scientists,
coordinators and
analysts are
prevalent part of
business in all
business units
2
Leader No leader IT leader is
sponsoring data
activities. Business
leaders are involved
but not fully
committed
Executive level
sponsorship exist
CDO is leading and
supporting data and
analytics initiatives and
cultural change
CDO leads the data
and analytics
organization that
support the data and
analytics lifecycle
3
2,3Veho's overall score

45 (62)
managers and other key persons, the target model for analytics organization was built.
Business was divided into process-based units where there would be analysts and data
stewards doing the activities inside business. The central team that is now more tech-
nologically oriented and has projects related skills would be working with all these
business processes seamlessly. As a whole Data and Analytics are in the core of busi-
ness and the central team supports it closely. CDO’s role is going to continue but it has
to be made sure that Data and Analytics is of high priority and as close to the man-
agement team as possible or that there will be another high-level position appointed to
lead the transformation.
At target stage, training of the staff needs to be ongoing, especially for the key users.
Others should have good know-how on the tools they are using, the data they handle
and how they could get benefits from these. For key users this means learning new
skills related to data science, for IT personnel learning business skills, and for business
personnel learning IT skills.
5.3 Technology
Currently Veho is at stage two (1.6) in Data and Analytics technology (Table 5). This is
because the current architecture does not support adding new data sources and ad-
vanced analytics. Old data warehouse is siloed and not performing well. There are tra-
ditional BI tools in use, but the ability to do data discovery is missing.
To reach stage three in technological maturity, it is necessary that the architecture is
defined and applied in certain areas. New data technologies and tools are also needed.

46 (62)
Table 5. Veho’s maturity assessment: Technology (Nott, 2015a:p.1, Halper & Krishnan, 2013-
2014:p.7-14)
The target stage for 2021 is four and it means having the architecture defined and ap-
plied to maturity of business functions.
Figure 21. Suggestion for Data and Analytics architecture for 2021 (Veho, 2018)
The target state for 2021 in terms of Data and Analytics architecture was outlined with
specialists (Figure 21). It covers most of the needs for Data and Analytics including all
three types: information portal, data discovery and data science. It is necessary to have
Veho Maturity
Assessment
Stage 1 Stage 2 Stage 3 Stage 4 Stage 5 Veho's
score
Information
architecture
There is no
coherent
information
architecture
Data and analytics
architecture exis
Best-practice data
and analytics -
architecture is
defined and applied
in certain areas.
Information
architecture is
defined and applied
Information
architecture fully
support all data and
analytics initiatives and
business strategy
related projects and on-
going activitie
1
Data handling It is not
understood how
big data masses
should be
handled
Does not support
adding new data
sources
Various data
technologies are in
use
Ability to use
structured and
unstructured data
and different sources
Fully supported 2
Information
portal tools
Some reporting
tools, no
dashboards
Traditional BI
working in ok level.
Traditional Bi
support multiple
business needs
Traditional Bi
support multiple
business needs and is
performing well
Fully supported 3
Data discovery
tools
No data
discovery tools
Some experiments
are done with cloud-
based solutions
regarding big data.
Some echnologies
in use
Most needs covered Fully supported 1
Data science
tools
No data science
tools
Does not support
advanced analytics
Not well managed
analytics
Most needs covered Fully supported 1
1,6Veho's overall score

47 (62)
a possibility to use structured and unstructured as well as external and internal data. A
cloud environment where tools for advanced analytics are available is set up. A tool for
super user’s data discovery, data visualization and agile needs has been chosen and
implemented.
5.4 Analytics
As a summary of the assessment, Veho is at stage two (1.8) regarding analytics (Table
6). Veho is doing mostly descriptive analytics meaning backword-looking reporting and
traditional BI. There is a need to gain better access to data in order to have the oppor-
tunity to analyse it. To reach stage three there must be ways to understand from data
why something happened and what will happen next. This will mean managing large
data masses and being able to utilize them in some business questions.
Table 6. Veho’s maturity assessment: Analytics (Nott, 2015a:p.1, Halper & Krishnan, 2013-
2014:p.7-14)
The target stage for 2021 is level four and this means optimal decision making based
on predictive analytics. Analytics should be integrated into processes and some busi-
ness decisions and actions automated. During 2019-20121 this means implementing
analytics solutions of all four levels: descriptive, diagnostic, predictive and prescriptive
in all business units. From user perspective this means more analytics solutions for key
Veho Maturity
Assessment
Stage 1 Stage 2 Stage 3 Stage 4 Stage 5 Veho's
score
Descriptive Analytics is used to
understand what has
happened. Traditional
BI and reporting
solutions exist for e.g.
financial and other
regulatory purposes.
Data is mostly used
for reporting
purposes
Reporting is
versitile and suits
many needs
Reporting has
changed to analytics
and is used in most
business units
Fully functioning 3
Diagnostic Does not exist Analytics is used to
understand why
something has
happened
Diagbostic
analytics is part of
daily operations in
some business
units
Diagnostic analytics
is part of daily
operations in most
business units
Fully functioning 2
Predictive Does not exist Interest in analytics
has grown inside the
organization and
some outside
partners are used to
do some experiments
even with advanced
analytics.
Analytics is used to
predict the
likelihood of what
will happen to
some business-
related questions
Predictive analytics is
used to optimize
decision making to
enable optimal
actions for better
business value
Fully functioning 1
Prescriptive Does not exist Interest in analytics
has grown inside the
organization and
some outside
partners are used to
do some experiments
even with advanced
analytics.
A company might
be able to manage
large data masses
but not able to
utilize it through
predictive models
or other advanced
ways.
Analytics supporting
the organization by
integrating it into
business processes
and automating
some decision
making and actions.
Analytics is used in
optimizing business
processes and is
automated where
possible. All kind of
data is used in
integrated way for
analytic
1
1,8Veho's overall score

48 (62)
users, and for other users integrated models in their everyday work e.g. optimized
sales activities for sales people based on data models, segmenting customers and
predicting their behaviour. The maturity in analytics will help growing the maturity in
other dimensions, since building the solutions are the way to bring analytics into reality.
It will increase the skills and need for new roles, gain support from executives and high-
light the importance of data management when the actual business benefits are real-
ized monetarily or effort-wise.
5.5 Data Management
Veho is at maturity stage two (1.8) regarding data management (Table 7). There are
several data management and governance activities done on customer data, but Veho
is missing a comprehensive view of all data, updated policies and a governance organ-
ization.
Table 7. Veho’s maturity assessment: Data management (Nott, 2015a:p.1)
It was discovered during the current state analysis that a customer data governance
model has been created a few years ago, but not implemented fully. To gain level
three, Veho needs to update the governance model and expand it to cover other mas-
ter and metadata. The issues at hand have to be covered in data policies and proce-
Veho Maturity
Assessment
Stage 1 Stage 2 Stage 3 Stage 4 Stage 5 Veho's
score
Management Manual information
governance for
regulatory purposes is
done. No overall data
strategy or plan for
lifecycle management.
End state data
architecture such as
semantic layer might
exist. No overall data
strategy or plan for
lifecycle
management.
MDM programs are
started but focus is
on subsets of data
Data life cycle
management exist.
Data management is
part of business culture
2
Quality handling Ad-hoc, data not trusted Upstream data quality
is performing well
enough
A company is
aware of data
issues and
monitoring is for
the most parts
Data quality
monitoring is mostly
automated.
Data quality monitoring
is automated and part
of business culture
3
Definitions,
policies,
procedures
Few policies Some reactive
policies for data
management has
been established but
are not monitored
Policies and
procedures are
started to be
implemented to
manage core data
through its lifecycle
Full set of policies
are communicated
and enforced, and
the governance is
prioritized based on
business needs.
Fully functioning 1
Data
management
organization
Does not exist Understanding of
data and establishing
ownership is
emerging. Data
owners are assumed.
Policies are
monitored through
information
stewards with
limited authority
Data governance
organization exists.
Data stewards are
acting as information
advocates focusing on
value generation
1
1,8Veho's overall score

49 (62)
dures to be able to manage data through its life cycle. Data stewards are monitoring
the policies in business.
In 2021 Veho is targeting to reach stage four. This means a fully functioning data gov-
ernance organization. The policies are communicated and enforced, and the prioritiza-
tion is done based on business needs. Now data quality monitoring is a manual task
and in 2021 the target is to get it automated in the same way as the activities needed
for data life cycle management.
5.6 Summary
When the assessments are combined, Veho is at level two. When looking at the di-
mensions separately (Figure 22), the most immature by the assessment is technology
and most mature are strategy and vision and organization and people. This does not
indicate the efforts needed to be made for the changes, but more that there is a lot to
be done in all of them. Level two can feel as a low number, but like presented earlier
through the study done by Forbes Insights, most of the companies are beginning their
journey and especially the automotive industry is not mature on Data and Analytics.
Only few are leaders or on level four or five, but the ones that are there are seeing the
benefits.
Figure 22. Maturity assessment done for Veho
The proposed maturity framework was built based on the assessment and combined
maturity indicators for each dimension (Appendix 4). The current stage is highlighted
with red lining and the target stage with green lining.
012345
Strategy andVision
Organizationand people
TechnologyAnalytics
DataManagement

50 (62)
6 Validation of the proposal
This section introduces the validation process and the final outcome of the thesis. It
addresses the issues of what has been done and what should be done next.
6.1 Validation overview
The purpose of a maturity framework is to be able to assess the current state of Data
and Analytics compared to other organizations and best practises. After defining the
target state, it works as a framework for building a road map and helping in prioritizing
decisions and actions. Veho’s maturity framework has gone through a three-level vali-
dation.
6.1.1 Project team validation
The first level of validation was done together with the project team involved and the
executive level sponsors. There were some minor modifications done mostly to the
conclusions of the current state assessment and to some indicators that needed to be
highlighted.
6.1.2 Practical validation
The second level validation was done in practise by using the framework for strategic
action planning for 2019-2021 and creating a short-term road map for 8/2018-6/2019.
Veho carried out the strategic planning for 2019-2021 during summer 2018. The Data
and Analytics framework was used to create a strategic action plan to reach the strate-
gic target for Data and Analytics.
The strategic targets were assessed against the maturity stages, and a schedule was
drawn. The maturity framework works as metrics for the upcoming transformation pro-
gram. Figure 23 shows the target schedule for increasing maturity level for each di-
mension.

51 (62)
Figure 23. Target schedule for gaining maturity (Veho, 2018)
A short-term plan for autumn 2018 and spring 2019 were drawn from the strategic plan
and aligned with the framework and target state 2021 (Figure 24).
Figure 24. Next steps for H2/2018-H1/2019. (Veho, 2018)
The framework suited the purpose and supported the planning. Organizing and priori-
tizing actions was fairly easy and the drawn schedule more realistic than without the
framework. From validation perspective the framework did work in practical use in long-
and short-term action planning.

52 (62)
6.1.3 Executive level validation
The target state summary (Figure 25) was presented to the management team and
they gave their approval for the transformation program aiming to achieve the targets.
Figure 25. Target state summary
6.2 Final proposal: Maturity framework for Veho
Previously presented maturity indicators from existing knowledge for chosen dimen-
sions have been combined with current state analysis and a desired target state. As a
result, a maturity framework suitable for Veho’s business culture has been created
(Table 8).

53 (62)
Table 8. The Maturity framework for Veho
Veho Maturity
Assesment
Stage 1 Stage 2 Stage 3 Stage 4 Stage 5
Strategy and
Vision
Data and analytics is
discussed but not
visual in business
strategy. The
organization does
not see a reason why
and don't recognize
what it means to be
data driven. No Data
and analytics vision
exists nor is there
leadership
sponsorship.
Digital strategy
recognizes the
importance of data and
analytics. Progress of
data and analytics
initiatives is hampered
by culture,
organizational barriers
and lack of leadership.
Main focus is on
technology. High-level
sponsor from ICT is
named.
Business strategy recognizes
and encourages the use of
analytics within business
processes. Strategy
definition is shifting from a
static, annual process
toward more of a dynamic
one. High-level sponsor
from business is named and
other leaders understand
the benefits of data and
analytics maturity.
Business strategy realizes
competitive advantage
from customer-centric
analytics and well
managed data. Data is
seen as valuable asset.
Vision for data and
analytics exist for coming
years.
Data drives continuous
business model
innovation. Business
strategies highlight this
importance. Data is a
recognized corporate
asset, competitive
differentiator, source
of transformation, and
a product itself.
Organization and
people
Data and analytics
related
responsibilities are
resourced based on
applications and
business people
manage their own
data. The
organization does
not have any
devoted people
handling data and
analytics or have a
leader to manage it.
ICT based data related
roles exist and are
handling data
administrative and
modelling related tasks.
Business is involved in
resolving data related
issues but not in
development or
planning. ICT leader is
sponsoring data
activities. Business
leaders are involved but
not fully committed.
Data and analytics
organization exists.
Business unit-based analysts
and central data analysts
and data scientists start to
emerge. Implementation of
data and analytics related
projects is difficult due to
finding needed resources
from business side.
Executive level sponsorship
exists. POCs are helping to
gain more interest and
engagement from business.
Data and analytics moves
away from IT as a
separate unit closer to
Business. Data scientists,
coordinators and analysts
are important part of
business. Former data
team is turned into a
competency center which
is doing less but enabling
more of what business is
doing. CDO is leading and
supporting data and
analytics initiatives and
cultural change. Training is
on-going.
CDO leads the data and
analytics organization
that supports the data
and analytics lifecycle.
Data and analytics
initiatives are business
driven. Business
executives see data
and analytics as an
essential part of their
operations.
Collaboration between
centralized team and
business functions is
part of the culture.
Technology There is no coherent
information
architecture. It is not
understood how big
data masses should
be handled.
Data and analytics
architecture exist but
does not support
advanced analytics or
variety of data sources.
Some experiments are
done with cloud-based
solutions regarding big
data. Tradition BI-tools
are in use, but modern
data discovery is
missing.
Best-practice data and
analytics -architecture
including data discovey
tools is defined and applied
in certain areas. Various
data technologies are in use
but may not be well
managed or used in
analytics.
Information architecture is
defined and applied and
cover most of the data
and analytics needs using
structured and
unstructured data.
Information
architecture fully
support all data and
analytics initiatives and
business strategy
related projects and on-
going activities.
Analytics Analytics is used to
understand what has
happened.
Traditional BI and
reporting solutions
exist for e.g.
financial and other
regulatory purposes.
Analytics is used to
understand why
something has
happened. Data is
mostly still used for
reporting purposes.
Interest in analytics has
grown inside the
organization and some
outside partners are
used to do some
experiments even with
advanced analytics.
Analytics is used to predict
the likelihood of what will
happen. A company might
be able to manage large
data masses but not able to
utilize it through predictive
models or other advanced
ways in all business needs.
Predictive analytics is used
to optimize decision
making to enable optimal
actions for better business
value. Analytics supporting
the organization by
integrating it into business
processes and automating
some decision making and
actions.
Analytics is used in
optimizing business
processes and is
automated where
possible. All kind of
data is used in
integrated way for
analytics.
Data Management Manual information
governance for
regulatory purposes
is done based on few
policies. Lack of data
definitions and
handling quality ad-
hoc can be seen as
data not being
trusted or used. No
overall data strategy
or plan for lifecycle
management.
Understanding of data
and establishing
ownership is emerging.
Some reactive policies
for data management
have been established
but are not monitored.
Data owners are
assumed, and upstream
data quality is
performing well enough.
No data lifecycle
management. End state
data architecture such
as semantic layer might
exist.
A company is aware of data
issues and therefore
policies and procedures are
started to be implemented
to manage core data
through its lifecycle. Policies
are monitored by
information stewards with
limited authority. MDM
programs are started but
focus is on subsets of data.
Data governance
organization exists. Full set
of policies are
communicated and
enforced, and the
governance is prioritized
based on business needs.
Data quality monitoring is
mostly automated and
data life cycle
management exists.
Data quality monitoring
is automated and part
of business culture.
Data stewards are
acting as information
advocates focusing on
value generation.

54 (62)
When adding all the scores for different dimensions together Veho is at stage 2.
Veho’s strategic statement from digital strategy (2018) is: ‘Veho will have a competitive
advantage from its advanced internal analytics services and high-quality, up to date
customer and product information. We will have the needed competencies and re-
sources for it.’ To be able to realize this statement maturity needs to grow year by year.
Target is set and validated by the management team to gain stage four maturity in
2021.
6.3 Implementation
The maturity framework has been presented throughout the organization and imple-
mented for action planning during autumn 2018. Data and Analytics transformation
program will start in early 2019 and the framework will be used as a compass for the
program members and the project manager. It will be used in ongoing action planning,
prioritization and measuring the progress. Now that the target stage has received the
approval of the executive level, the programme can start with full speed.

55 (62)
7 Discussion and conclusions
This section will summarize the thesis from objective to outcome and evaluate the work
from research and personal perspectives.
7.1 Summary
Veho is storing huge amounts of data related to customers, products and transactions.
The data is currently used in backward-looking reporting purposes. New digital strategy
for 2018 states that ‘Veho will have a competitive advantage from its advanced internal
analytics services and high-quality, up to date customer and product information. We
will have the needed competencies and resources for it“. In a way this could be seen
as the vision for Data and Analytics. It is recognized that Veho is not mature in data
driven business and is missing some key elements for gaining more maturity such as
roles, technologies and use cases.
The objective of the study was to create a Data and Analytics maturity framework to
help management to achieve the vision. There are several maturity models out in the
market. Their purpose is to evaluate organization’s current state against other organi-
zations. When a target level is set, it is easier for organizations to build their road map
to achieve the target. The existing models are generic and don’t apply in all levels to
Veho business. This study combines the chosen dimensions from existing models, best
practices found from existing knowledge and current state analysis to create a frame-
work suitable for Veho’s business.
The maturity dimensions chosen and combined with existing models are strategy and
vision, organization and people, technology, analytics, and data management. It is
seen that without any one of these, the increase in maturity is not possible. If the strat-
egy does not support the transformation project and use of data, there will be signifi-
cant obstacles in getting the needed resources and actions in place. If the skills and
roles are lacking, the analytics solutions are impossible to be built and trusted. A few
people in IT can’t do this by themselves since the need of analytics must come from
business and the result must benefit business. Technology is an important enabler but
not the main focus. Technology without appropriate data, correct cases or right users is
useless. Analytics use cases have an important role in the upcoming transformation

56 (62)
program. One stream of the program will lay the basis of maturity by setting up the ar-
chitecture or getting right people involved, and the other is about executing analytics
projects in all levels; descriptive, diagnostic, predictive and prescriptive. With success-
ful outcomes, the pace of the program will increase. The last dimension chosen was
data management. Without data being managed, the trust in analytics is hard to
achieve. Data management includes data quality monitoring and security policies, func-
tioning governance organization and common procedures. There have to be rules set
for inserting, handling and transforming data and an organization to support it.
When analysing the current state by interviews done with different types of data users,
it was quite clear from the start that the maturity level is not very high. This is common
in all industries and automotive industry especially. Even though the digital strategy
highlights Data and Analytics, it is not seen clearly enough in business strategy or in
strategic actions. The CDO and CFO support the change, but it seems that the busi-
ness leaders are not yet fully committed to the efforts needed.
The organization is interested in Data and Analytics but is still missing the needed skills
and roles for it. A centralized team operates from digital services and includes IT-
minded specialists. The team is not cooperating with business in a way the best prac-
tices describe. In business side there are no analysts, which is a key role when driving
data driven culture. People analysing data are looking at it from historical perspective
from static reports and using lots of time for analysis and data massaging.
The current technology landscape is built to suit the needs of traditional BI. The archi-
tecture is not documented and a road map to get to the next level does not exist. There
is a need of data discovery tools for super users to enable them an easier access to
data and visualizations. New data sources, such as open data or IoT(Internet of
Things) -data and advanced analytics need new architectural components such as a
cloud-based data lake and tools.
Veho is mainly doing descriptive analytics which is backward looking and needs a lot of
human input to generate decisions and actions. To gain maturity in analytics there
needs to be data discovery and advance analytics implemented.

57 (62)
Data management activities have been ongoing at Veho for several years. There was a
data governance project done in 2014 including mainly customer data. The results of
that project need updating and spreading throughout all data components.
Maturity framework combining the best practices from existing knowledge and current
state analysis was built. A target maturity stage for all the five dimensions was set to
grow from two to four by 2021.
The proposed framework was validated first together with the project team involved
and with the CDO. After minor changes were done, the framework was tested in prac-
tice during the strategic action planning period in summer 2018. It needed minor altera-
tions but at the end the final framework was built, and it is presented in section 6.2. The
final validation was done to the target state by getting it accepted by the Veho man-
agement team.
7.2 Practical implications
The framework is designed to support leaders and management when making deci-
sions regarding future development projects, resource planning, tool selection and
strategy work regarding Data and Analytics. There will be a Data and Analytics trans-
formation program started in the beginning of 2019 and this framework will help in set-
ting the action plan and prioritizing the tasks.
Here are recommendations that should be taken into consideration when Veho starts
the program:
1. Integrate Data and Analytics into business strategy during next strategy period
2. Increase understanding in Data and Analytics throughout the organization
3. Find key users and add analytics in their job description
4. Hire a data analyst who has skills and understanding of advanced analytics
5. Start building an architecture that enables advanced analytics and data discov-
ery
6. Start searching for use cases and business problems that could be solved with
advanced analytics. Start implementing solutions first through PoCs and then
gradually start implementing solutions to all business units
7. Refresh the data governance model done previously concerning customer data
and expand to other master and meta data

58 (62)
8. Appoint needed roles for data management
It is important to carry out the transformation program and to involve all relevant stake-
holders. The change will take time and it will affect the whole business. It is especially
important to have support from the highest level.
7.3 Evaluation of the thesis
The thesis is evaluated by assessing whether the outcome meets the objective. A per-
sonal reflection on the thesis is the final part with learnings, successes and challenges.
7.3.1 Outcome vs objective
The objective was to create a framework for management to increase Data and Analyt-
ics maturity. The outcome of the thesis met the objective. With the framework Veho will
be able to address the challenge they have with data and utilizing it. Managers have a
tool to make needed decisions and take action to fulfil the digital strategy statement
‘Veho will have a competitive advantage from its advanced internal analytics services
and high-quality, up to date customer and product information. We will have the need-
ed competencies and resources for it’. The framework can be used for measuring the
progress and steering along the way.
7.3.2 Reflection & Afterword
Final section of the thesis is my own reflection on the study and the process. The chal-
lenge addressed in this study seems to be very common in companies: everyone has
heard of analytics but is not sure how to address the matter and Veho is no exception.
The research method of using the gate model worked well to the case company’s
schedule and the subject. There was a need to have a strategic action plan ready right
after summer and the gates made it possible to have the first proposal ready to be vali-
dated in practise. The model also gave enough time for a wide assessment done with
42 employee interviews.
59 (62)
The maturity model thinking to address the business challenge was a clear path from
the start. There are several different models out in the market and the ones chosen all
represent different types of providers. As a Data and Analytics professional I have en-
countered challenges regarding all chosen dimensions in my career and this was a
good opportunity for me to study these more thoroughly.
One of the hardest things when doing the research was to find reliable and up to date
information about the best practises of Data and Analytics. Since the industry is con-
stantly evolving, the books written can be outdated in a very short period of time. This
is the reason why I used a lot of papers from Gartner analysts. Among analytics pro-
fessionals Gartner is the main consulting company giving guidance on Data and Ana-
lytics from managerial perspective.
I learned a lot from the interviews done in the case company. They gave me a wide
perspective on the matter, the pain points and the successes. With those I was able to
draft a holistic view on the status in the organization and to find the current stage of
maturity from existing models. When building the proposal for Veho’s framework some
dimensions needed more attention. The organization and people dimension was seen
internally and by me the hardest one and needed most work in defining the target. It
was great to see the support the organization was giving to this thesis and especially
the project team, CDO and CFO were supporting it along the way. Like presented in
the validation, the framework has already proven to be useful in action planning and I
have fully adapted it to my work as the development manager of Data and Analytics.
The built framework has already benefitted the case company, and at the same time it
has also been a great learning experience for myself. I have got a strategic perspective
for Data and Analytics instead of doing daily operations regarding traditional BI. I have
had the opportunity to widen my network and to be acquainted with business directors
and management. I believe that this framework will change the way I do my work and it
will form the steps that Veho will take to reach the target state that it is now committed
to.

60 (62)
References
Becker, J., Knackstedt, R. & Pöppelbuß, J. (2009) Developing maturity models for IT
management – a procedure model and its applications. Business & Information Sys-
tems engineering. 7(3), 213-222.
Buytendijk, F., Rollings, M., Judah, S. & Moran, M. (2017) No Data and Analytics Vi-
sion? No Business Impact! Gartner. Report number: G00313740.
Cook, H. (2017). Modern Data and Analytics Architecture for digital transformation. In:
Gartner (ed.) Gartner catalyst conference 2017, 25-29 Sept 2017, London, UK. pp. 9,
30.
Deloitte. (2018) Modern Business Intelligence - The Path to Big Data Analytics. Availa-
ble from: https://www2.deloitte.com/content/dam/Deloitte/tr/Documents/deloitte-
analytics/Modern%20Business%20Intelligence.pdf [Accessed 15th June 2018].
Fisher, T. (2009) The Data Asset. How Smart Companies Govern their Data for Busi-
ness Success. New Jersey, John Wiley and Sons.
Forbes insights, (2017) Data and advanced analytics: High stakes, high rewards.
Forbes.
Fritsch, J. (2017) Data Governance: from on-premises to cloud. In: Gartner (ed.) Data
and Analytics summit 2017, Gartner 22-23 March 2017, London, UK. pp. 6-16.
Gartner. (2017a) Leadership Vision for 2018: Data and Analytics Leader. Gartner. Re-
port number: 333902.
Gartner. (2018) Gartner IT score. Available from:
https://www.gartner.com/en/research/methodologies/itscore [Accessed 12th Jan 2018].
Gregory, A. (2011) Data governance -- Protecting and unleashing the value of your
customer data assets: Stage 1: Understanding data governance and your current data
management capability. Journal of Direct, Data and Digital Marketing Practice. 12 (3).
230-248.
61 (62)
Halper, F. & Krishnan, K. (2013-2014) Big data maturity model guide – interpreting your
Assessment score. TDWI Research.
Howdy, C. & Duncan, A. (2015) IT score overview for BI and Analytics. Available from:
https://www.gartner.com/doc/3136418/itscore-overview-bi-analytics[Accesed 21st Jan
2018].
Howson, C (2017) Moving your Data and Analytics maturity from laggard to leader. In:
Gartner (ed.) Gartner data & analytics summit 2017, 22-22 March 2017, London, UK.
pp. 3, 13.
Laney, D. (2016) Enterprise Information management maturity Model. Gartner.
Report number: G00289832.
Nott, C. (2015a) Big Data and Analytics Maturity Model. Available from
http://www.ibmbigdatahub.com/blog/maturity-model-big-data-and-analytics [Accessed
3rd Feb 2018].
Nott, C. (2015b) Applying the big Data and Analytics maturity model for a competitive
advantage. Available from:
https://www.ibm.com/developerworks/community/blogs/bigdataanalytics/entry/Applying
_the_big_data_and_analytics_maturity_model_for_a_competitive_advantage?lang=en
[Accessed 5th Feb 2018].
Oestreich & Buytendijk, 2016. Gartner Why you need to rethink your Data and Analyt-
ics roles now. Gartner 2016
Oestreich, W. & White, A. (2016) Must have roles for Data and Analytics 2017. Gartner.
Report number: G00309273.
McKinsey Global Institute. (2016) The age of analytics: competing in a data driven
world. McKinsey.
White, A. & Beyer, M. A. (2017) Design an effective data information governance strat-
egy. Gartner. Report number: G00338329.

62 (62)
Veho Oy Ab. (2016) Veho Oy Ab Vuosikatsaus 2016. Available from:
https://www.veho.fi/globalassets/veho/veho_vk2016_fin_low.pdf [Accessed 26th De-
cember 2017].
Veho Oy Ab. (2017) Veho yrityksenä. Available from:
https://www.veho.fi/autoliikkeet/veho-yrityksena/ [Accessed 26th December 2017].
Veho Oy Ab. (2018) Konserni- ja digistrategia.
Veho Oy Ab. (2014) Loppuraportti: Liiketoimintakriittisen tiedon hallintamalli, Vaihe 1.

Appendix 1
1 (1)
Appendix 1: Data collection plan
Data round Data type Data Source Date Recording Purpose focus
Business Controller 25.1.2018 Yes Root level experience
Field manager 29.1.2018 Yes Mid level experience
Manager, spare parts 29.1.2018 Yes Mid level experience
Manager, spare parts 29.1.2018 Yes Mid level experience
Development manager 29.1.2018 Yes Root level experience
CFO 29.1.2018 Yes High level experience
Business Controller 30.1.2018 Yes Root level experience
Development manager 5.2.2018 Yes Root level experience
Head of Development 5.2.2018 Yes High level experience
Business Controller 6.2.2018 Yes Root level experience
Quality manager 13.2.2018 Yes Root level experience
Pricing manager 14.2.2018 Yes Mid level experience
Ledger manager 21.2.2018 Yes Root level experience
CDO 20.2.2018 Yes High level experience
Maintenance manager 22.2.2018 Yes Mid level experience
Head of Development 23.2.2018 Yes High level experience
Sales manager 23.2.2018 Yes Mid level experience
Director, commercial vehicles 28.2.2018 Yes High level experience
Customer service manager 7.3.2018 Yes Mid level experience
Field manager 7.3.2018 Yes Mid level experience
Product manager 15.3.2018 Yes Mid level experience
Sales manager 16.3.2018 Yes Mid level experience
Warranty manager 16.3.2018 Yes Mid level experience
Business Controller 19.3.2018 Yes Root level experience
Business Controller 19.3.2018 Yes Root level experience
BI Specialist 27.3.2018 Yes Root level experience
Head of financial services 28.3.2018 Yes High level experience
Marketing manager 12.4.2018 Yes Mid level experience
Maintenance manager 16.4.2018 Yes Mid level experience
Business Controller 16.4.2018 Yes Root level experience
Marketing manager 19.4.2018 Yes Mid level experience
Head of maintenance 23.4.2018 Yes High level experience
Director, passenger cars 2.5.2018 Yes High level experience
IT Manager 8.5.2018 Yes Mid level experience
Head of Sales 8.5.2018 Yes High level experience
Integration architect 9.5.2018 Yes Root level experience
Integration architect 15.5.2018 Yes Root level experience
Datawarehouse specialist 16.5.2018 Yes Root level experience
Development manager 30.5.2018 Yes Mid level experience
Data specialist 4.6.2018 Yes Root level experience
Director, IT and information security 12.6.2018 Yes High level experience
Development manager 20.6.2018 Yes Root level experience
Internal
documentation
Strategy, corner stones, organization
chart, Company presentations
May-October,
collection of
documents
To gather knowledge about the
current state of organizational
hierarchies and strategy.
Group interview Project team May 2018 Notes
To go through the findings from
current state and build an
approach for target state
creation.
Interviews CDO June 2018 Notes
To validate the curent state
analysis. To define target state for
strategy and vision
Data team June 2018 Notes
To define target state for
technologies, analytics and data
management
Project team, business members June 2018 Notes
To define target state for
organization and people
Project team August 2018 Notes To validate the proposed model
Board of executives August 2018 Notes To validate the target state
Data 1 Current
state analysis
Face to face
interview
Data 2
Building the
proposal
Data 3
Validation
Group interview
Workshop

Appendix 2
1 (1)
Appendix 2. Base questions for current state interviews
Base questions for
stakeholder interviews
High-level experience Mid-level experience Root-level experience
Basic questions - Name
- Title
- Data user time
- Domain
- Work experience
- Organization's responsibilities
- Personal responsibilities
- Name
- Title
- Data user time
- Domain
- Work experience
- Organization's responsibilities
- Personal responsibilities
- Name
- Title
- Data user time
- Domain
- Work experience
- Organization's responsibilities
- Personal responsibilities
Strategy and vision - What is the business startegy?
- What are the strategic actions?
- Is data and analytics part of
strategy?
- How do you see the role of
Data and analytics in Veho?
- Is Data and analytics part of your
action planning?
- What is the meaning of data and
analytics?
- What is data used for?
- Why is data important?
- Is there a clear data and analytics
strategy?
- What is data used for?
- Why is data important?
Organization and people - How is your organization
organized?
- Are there people doing
analytics?
- Are there data owners?
- How does the co-operation
between It and business work?
- Do you have analysts in your
organization?
- Has there been any training
organized related to data and
analytics?
- How are key contacts related to
data and analytics?
- How does the co-operation
between It and business work?
- Has there been any training organized
related to data and analytics?
- How are key contacts related to data and
analytics?
- How does the co-operation between It
and business work?
- How much time do you use for data and
analytics related tasks?
Technology - How do you see the current
situation of data and analytics
tools?
- What kind of tools are you
using?
- How are the tools performing?
- For what purpose are the tools
used for?
- What kind of tools are you using?
- How are the tools performing?
- For what purpose are the tools used for?
- What kind of architecture exists?
- What kind of development is done related
to tools?
- What is missing?
- What data sources are used?
- Other data sources available?
Analytics - What kind of analytics happen
in your organization?
- What kind of decisions are
made?
- Is analytics utiliced in decision
making and action planning
- What kind of analytics happen in
your organization?
- What kind of decisions are
made?
- Is analytics utilized in decision
making and action planning
- What kind of analysis do you
make based on the data available?
- What is missing?
- What kind of analytics applications are
available?
- What kind of development has been done
related to data and analytics?
- Is there a road map for further
development?
- What kind of analysis do you make based
the data available?
- What is missing?
Data management - What are the biggest problems
with data management?
- What do you think causes the
problems?
- How important is data in your
organization?
- Are there people responsible
for data?
- What are the biggest problems
with data management?
- What do you think causes the
problems?
- How important is data in your
organization?
- Do you trust the data?
- How is data management done currently?
- How is the housekeeping and quality
moniotoring operated?
- What are the biggest problems with data
management?
- What do you think causes the problems?
- Are there existing policies, best practises
or standards defined?

Appendix 3
1 (5)
Appendix 3: Maturity dimensions from Gartner Enterprise Information Model,
TDWI Big Data maturity model and IBM Big Data and Analytics maturity model
Dimension 1 2 3 4 5 Source
Organization
and people
Information-
related respon-
sibilities are
resourced on an
application-by-
application and
project-by-
project basis.
Business people
typically are
resigned to
source and
manage their
own data or
must join the IT
backlog.
Pooled or centralized database
administrators, data administrators
and data modeling resources emerge,
all of whom are strictly part of the IT
department. IT also houses business
intelligence analysts and data integra-
tion specialists. Business users are
engaged in information-related
activities mostly to resolve issues,
rather than in upfront design and
planning
Formal information and
content management
organizations materialize
within IT and governance
councils and stewardship
bodies in the business. At
least one data scientist is
hired by a business unit.
Projects are set up and
staffed one at a time but
tend to lack a plan for
organizational continuity or
intraenterprise synergy.
EIM and analytics move
outside of IT as a CDO is
installed to lead a separate
enterprise information ser-
vices organization. Specialty
roles — such as big data
infrastructure/architecture
specialists, data scientists,
information strategists,
information architects,
information product manag-
ers, and data curators —
become prevalent. Infor-
mation-related competency
centers emerge under the
CDO for core analytics, data
modeling, metadata and
master data.
The CDO oversees
and has authority and
budget for most
aspects of the
information life cycle.
This information
services organization
supports the entire
LOB-customer-
partner-supplier
information ecosys-
tem. Data-related
meetings have
become business-
centric. An information
product management
function develops and
facilitates new
revenue stream
Gartner EIM
(Laney, 2016:p.11)
Organization
and people
In this stage, the organization is just
beginning its big data journey. In
traditional companies, typically, one
executive sponsor is on board, but
companywide support can be spotty.
Often the sponsor is in the CIO
organization and not in the business.
The mindset is generally around
experimentation. The team charged
with exploring big data is trying to
determine the top business problems
to solve and may have brought in
some business partners to help with
this. They realize that identifying the
right business problem is critical for
success. The company typically
utilizes analytics as part of its deci-
sion-making process in various
departments, but the company itself
isn’t necessarily analytics driven. In
some companies at this stage, there
may even be scepticism around big
Data and Analytics. In Internet-based
companies, where the mindset might
be to get it done as quickly as possi-
ble, the goal might be to get the first
application up and running and worry
about the rest later. Typically, the CIO
team might be working with a busi-
ness sponsor who is the driver behind
the effort, but who may not yet be
totally engaged.
At this point, there is
generally at least one
executive sponsor involved.
However, it is also at this
stage when more execu-
tives might start to become
interested in the program
as companies show some
wins in the POCs. As the
organization gets excited
about the prospects of big
data, more people start to
come on board. This often
means that a team is
established to start to plan
and strategize for a wider
big data scope. This also
means that politics may
start to kick in, especially in
cases where the goal of the
big data project is cost
containment rather than
competitive advantage.
At this stage, the company
has usually come to realize
that analytics is a competitive
differentiator. Innovation in
data and data analysis is a
core value, and an analytics
culture prevails. The business
strategy is generally top-down
and bottom-up, with a data
infrastructure that can support
this. The funding process is
secured, and an ROI is in
place for big data analytics.
The visionary compa-
ny exhibits several
characteristics. First,
executives have
bought into analytics
and big data analytics
and view it as critical,
de facto standard for
how to do business.
Analytics is seen as a
competitive weapon
and the mindset is
creative. Second,
analytics is not simply
used to drive strategy
or insight; instead, the
business is always
looking for opportuni-
ties to use analytics in
new ways. In fact, a
key characteristic of a
visionary company is
that it is continuously
determining new ways
to use and create
value from analytics.
Finally, collaboration
is a big part of the
culture.
TDWI (Halper &
Krishnan, 2013-
2014:p.7-14)

Appendix 3
2 (5)
Strategy and
Vision
Big Data is
discussed but
not reflected in
business
strategy in which
use of data
extends financial
and regulatory
reporting
The business strategy recognizes that
data can be used to generate busi-
ness value and return on investment
(ROI) through realization that is
largely experimental
The business strategy
encourages the use of
insight from data within
business processes
The business strategy realizes
competitive advantage in
client-centric insight
Data drives continu-
ous business model
innovation
IBM (Nott,
2015a:p.1).
Vision Information is a
source of power
but managed in
silos. People
spend time
arguing about
whose data is
correct and who
owns it instead
of seeking
uniform availabil-
ity. There is
general ac-
knowledgment
that information
management (or
lack thereof) is a
serious problem.
Reactive IT attempts to formalize
objectives for information availability
to achieve targeted operational needs.
Progress is hampered by culture,
contradictory incentives, organization-
al barriers and lack of leadership.
Proactive Business man-
agement encourages
cross-functional information
accessibility to improve
responsiveness to the
business, customers and
marketplace. Different
content types still are
treated and managed
separately. Data fiefdoms
begin to disband. Exoge-
nous data sources begin to
be integrated for enhanced
analytics.
Managed Senior business
executives champion and
communicate information-
related best practices.
Information is viewed as an
indispensable fuel for enter-
prise performance and
innovation to be shared
seamlessly. Customers and
partners influence information
vision. Information assets are
linked and leveraged across
several programs.
Information is a
central component of
business strategy and
architecture. Infor-
mation is a recognized
corporate asset,
competitive differen-
tiator, source of
transformation, and
even as a product
itself. Necessary,
valued and prioritized
information is lever-
aged across all
programs and invest-
ments.
Gartner EIM
(Laney, 2016:p.6)
Strategy Information is
hoarded by
departments and
individuals as a
source of power
and influence or
is unknown
altogether.
Information is
seen merely as
application-
specific. An
information
management
organization may
be in formative
stages, but
sponsorship is
nonexistent.
Business units recognize the broader
value of information and begrudgingly
share it on cross-functional projects.
An EIM organization emerges to
establish and control standards, and
improve information availability while
reducing expenses, but the main
focus is on technology.
A high-level sponsor (e.g.,
CDO) is named to define
an enterprise wide infor-
mation strategy and
coordinate a broad agenda,
including funding and
roadmap. Information
management resources
and technologies start to
become pooled and shared
across projects. Strategy
definition is shifting from a
static, annual process
toward more of a dynamic
"living document."
A well-funded and well-led
information program address-
es most enterprise needs
(current and planned).
Business units are committed
and involved. Most compo-
nents and resources are in
place and functioning. The
office of the CDO is empow-
ered to drive EIM vision in
support of the business
needs.
Data and Analytics
leadership has a say
in corporate strategy
as information is
deemed an actual
corporate asset.
Information is defined
primarily by the value
it brings, not by its
structure or other
characteristics.
Business information-
al needs and risks are
met proactively. The
information strategy
considers the organi-
zation's extended
ecosystem of part-
ners, suppliers and
customers. Infor-
mation strategy is no
longer a separate
work task but is
embodied in how the
business operates.
Gartner, EIM
(Laney, 2016:p.7)

Appendix 3
3 (5)
Strategy and
Vision
Nascent organi-
zations are also
often not that far
along in terms of
an overall unified
data strategy,
nor do they see
a reason to have
one. These
organizations
may not yet have
thought about
what it means to
be data driven.
TDWI (Halper &
Krishnan, 2013-
2014:p.7-14)
Technology The organization
does not have
single, coherent
information
architecture
An information architecture framework
exists but does not extend to new data
sources or advanced analytics
capabilities
Best-practice information
architectural patterns for
big Data and Analytics are
defined and have been
applied in certain areas
Information architecture and
associated standards are well
defined and cover most of the
volume, variety, velocity and
veracity capabilities and
structured and unstructured
data consumption needed for
differentiation
Information architec-
ture fully underpins
business strategies to
enable complete
market disruption with
volume, variety,
velocity and veracity
specifications applied.
IBM (Nott,
2015a:p.1)
Technology A key piece of
the enterprise
and its infor-
mation man-
agement
standards lies
with the infra-
structure of the
corporation. Big
data manage-
ment requires an
in-depth under-
standing of the
new infrastruc-
ture to support
critical big data
components
such as data
types, data
volume, user
and data
security, access
to information,
processing
requirements,
and information
storage. The
nascent organi-
zation often
misunderstands
the need to
differentiate
between infra-
In this stage of maturity, the company
may be trying out Hadoop or some
other big data technologies as part of
the experimentation phase leading to
a proof of concept. The installation,
configuration, and maintenance are
defined, and there is a level of
compliance to an enterprise standard,
although the class of infrastructure
may not be close to production ready
or may utilize a basic use case. For
example, some companies may stand
up a Hadoop cluster or invest in a
NoSQL database, but this is likely only
supporting one kind of workload to
support a single initiative or depart-
ment.
During the early adoption
stage, there may be various
kinds of big data technolo-
gy in place. This might
include an appliance or a
Hadoop cluster. NoSQL
databases might be in
place. However, the notion
of a unified architecture or
ecosystem is not yet
widespread, and these
technologies are not
operationalized. A typical
infrastructure is a tier 2
production-class cluster
that is installed and
maintained in the compa-
ny’s data center or even in
the cloud. The installation,
configuration, and mainte-
nance are defined per
enterprise standard. If a
NoSQL database is in
place, its use is generally
offline and not part of the
operational infrastructure.
In some companies where
cost savings are para-
mount, Hadoop may be
used to take advantage of
growing data volumes
without expanding the data
warehouse. Although this is
In this stage of maturity, the
typical company infrastructure
is a tier 1 production class
cluster that is installed and
maintained in the data center,
which might include the cloud.
A range of technologies might
be used, including enterprise
NoSQL databases, Hadoop,
and appliances or a data
warehouse, but the infor-
mation architecture is unified
in a way that underpins the
analytics. A Hadoop cluster
might include 50 to 100 nodes
at this phase (although cluster
size is not always tied to
maturity). This might also be a
commercial distribution
because as the company
moves out of early adoption, it
is actually concerned about
managing the clusters.
Another sign of operational
maturity is that the company
can perform multiple work-
loads on a cluster. The
installation, configuration, and
maintenance of the infrastruc-
ture are defined per enterprise
standards. The deployment is
driven at an enterprise level in
the organization with the
The way you manage
complexity is key to
big data maturity. The
visionary company
has deployed a
coherent analytics
infrastructure that is
fully operational and
can be used in the
mission-critical
aspects of the
business. Part of the
infrastructure includes
the ability to integrate
new sources of data
for analytics, whether
they are internal or
external to the
company. The
infrastructure leverag-
es commercial
Hadoop and enter-
prise NoSQL data-
bases and there is
security, disaster
recovery, backup and
recovery, performance
management, and
proactive infrastruc-
ture monitoring in
place—even if the
public cloud is used.
The program is
TDWI (Halper &
Krishnan, 2013-
2014:p.7-14)

Appendix 3
4 (5)
structure and
data, leading to
short-lived
success in their
big data journey.
a valid hybrid approach, it
may not be well managed,
and the data may not be
used yet for meaningful
analysis.
complete support of IT teams
and line-of-business participa-
tion. The infrastructure and
architecture of the big data
ecosystem comply with
backup and recovery or
disaster recovery procedures,
which are in place. A unified
architecture that takes an
ecosystem approach is also in
place.
treated as mission
critical and given the
right amount of
staffing and skills.
Data is shared across
the organization.
Analytics Analytics has is
limited to
describing what
has happened
Analytics is used to inform decision
makers why something in the busi-
ness has happened
Analytical insight is used to
predict the likely hood of
what will happen to some
current business activity
Predictive analytics is used to
help optimize an organiza-
tion's decision making so that
the best actions are taken to
maximize business value
Analytical insight
optimizes business
processes and is
automated where
possible
IBM (Nott,
2015a:p.1)
Analytics A key piece of
the enterprise
and its infor-
mation man-
agement
standards lies
with the infra-
structure of the
corporation. Big
data manage-
ment requires an
in-depth under-
standing of the
new infrastruc-
ture to support
critical big data
components
such as data
types, data
volume, user
and data
security, access
to information,
processing
requirements,
and information
storage. The
nascent organi-
zation often
misunderstands
the need to
differentiate
between infra-
structure and
data, leading to
short-lived
success in their
big data journey.
Typically, the organization has
explored some kind of advanced
analytics. There may be some groups
of individuals, especially at traditional
companies, who are adept at predic-
tive modeling or example, but they
may be aligned at the department or
line-of-business level. These statisti-
cians or business analysts may be
part of the overall voice of the organi-
zation that sees the need for a big
data implementation because they
see the value. There may also be
some outside organizations helping to
set the analytics strategy or involved
with performing some kind of ad-
vanced analytics.
The organization may be
utilizing descriptive or even
predictive analytics in its
projects. In early adoption,
the kind of analytics tools
will depend on the problem
that the company is trying
to solve. Typically, organi-
zations are still using one
kind of data, although that
may vary among organiza-
tions in this phase. For
example, some companies
in early adoption are
utilizing large volumes (i.e.,
more than 10 TB) of
structured data that is
stored in an appliance. The
company may be running
some sort of predictive
model on this data. This is
an established and produc-
tion-ready implementation,
but it still may be depart-
mental in scope and has
not moved on to other
forms of data. Alternately, a
company (e.g., a publisher)
might be mature in manag-
ing and utilizing large
amounts of content but not
strong analytically. Some
companies might be
utilizing different kinds of
data but not in an integrat-
ed fashion. For instance,
some organizations may be
primarily utilizing internal
structured data but making
use of unstructured social
media data in another part
of the company. In addition,
sometimes one department
in a company has a specific
use for big data analytics.
Any company might collect a
lot of data but not make use of
it. It’s a sign of maturity when
new data coming into the
organization can be analyzed
quickly and made part of the
logical infrastructure. In this
stage, analytics supports the
organization. Typically, a
company at this stage also
has a center of excellence
(COE) in place that serves
different parts of the organiza-
tion. The COE includes the
data science team, which
might even train other groups
in the use of analytics in
different forms. The COE is
generally also tasked with
evangelizing big data, and its
members might also be
looking for commonalities in
analytic needs to determine
what might be reusable in
other parts of the company. At
this point, analytics might be
operationalized as part of a
business process. In other
words, analytics might be
automated or integrated with
the business process. An
example of this might be using
machine-generated data
together with other data about
customers to determine a next
best offer. These companies
are typically using new
capabilities and not just
existing BI infrastructure.
In the visionary
company, the mindset
is to continually
develop analytics.
Typically, this kind of
company makes use
of all kinds of data,
including real-time
data, and uses this as
part of its decision
making and incorpo-
rates into business
processes. The
visionary company
can connect the dots
between new data
and existing assets.
The business can tap
into this to enhance
product offerings and
bring new products to
market. The infra-
structure, data, and
analytics are com-
pletely intertwined.
There are COEs in
place, and teams are
working to deliver new
and exciting forms of
analytics. Some
visionary organiza-
tions build an innova-
tion team consisting of
business and IT that
innovates on the
technologies, brings
them back to the
business, and takes
them into production.
TDWI (Halper &
Krishnan, 2013-
2014:p.7-14)
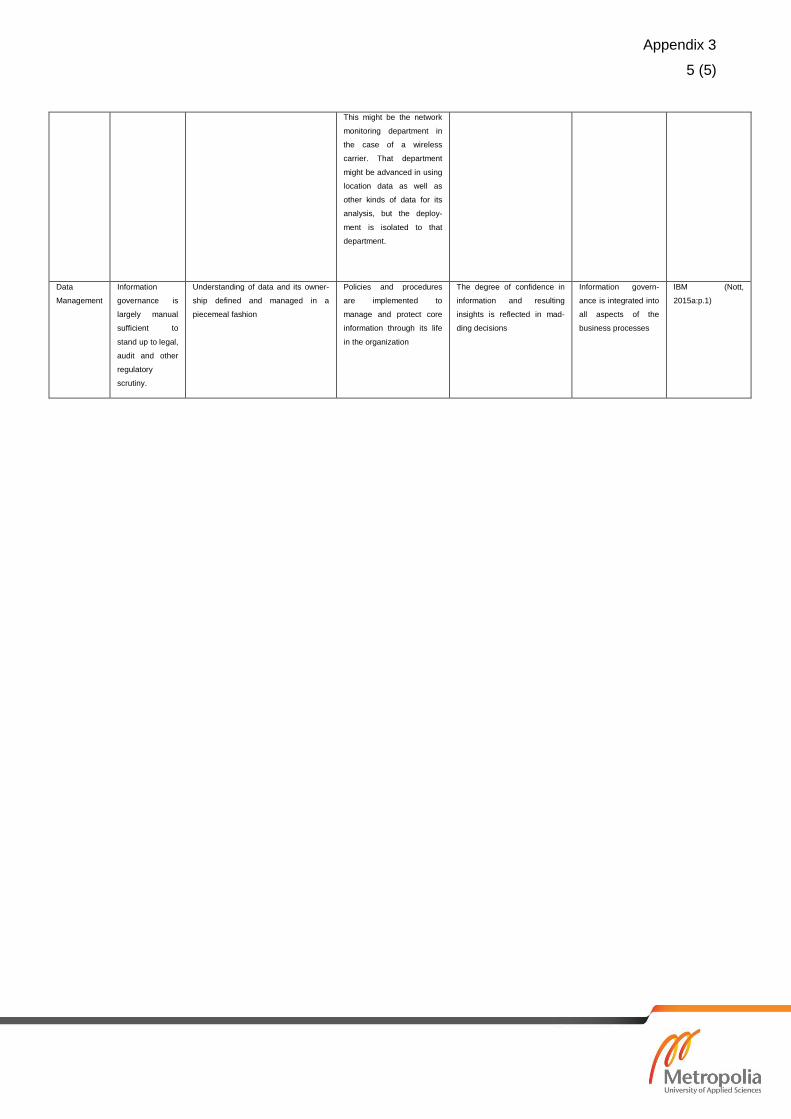
Appendix 3
5 (5)
This might be the network
monitoring department in
the case of a wireless
carrier. That department
might be advanced in using
location data as well as
other kinds of data for its
analysis, but the deploy-
ment is isolated to that
department.
Data
Management
Information
governance is
largely manual
sufficient to
stand up to legal,
audit and other
regulatory
scrutiny.
Understanding of data and its owner-
ship defined and managed in a
piecemeal fashion
Policies and procedures
are implemented to
manage and protect core
information through its life
in the organization
The degree of confidence in
information and resulting
insights is reflected in mad-
ding decisions
Information govern-
ance is integrated into
all aspects of the
business processes
IBM (Nott,
2015a:p.1)

Appendix 4
1 (1)
Appendix 4: Proposed maturity framework for Veho
Veho Maturity
Assessment
Stage 1 Stage 2 - Current state Stage 3 Stage 4 - Target state Stage 5
Strategy and
Vision
Data and analytics is
discussed but not reflected in
business strategy. The
organization does not see a
reason why and does not
recognize what it means to
be data driven. No Data and
analytics vision exists nor is
there leadership sponsorship.
Business strategy recognizes
the importance of data and
analytics. Progress of data
and analytics initiatives is
hampered by culture,
contradictory incentives,
organizational barriers and
lack of leadership. Main
focus is on technology
The business strategy
encourages the use of
insight from data within
business processes. Strategy
definition is shifting from a
static, annual process
toward more of a dynamic
one. High-level sponsor is
named.
The business strategy
realizes competitive
advantage from customer-
centric analytics and well
managed data. Data is
seen as valuable asset.
Vision for data and
analytics exist for coming
years.
Data drives continuous
business model innovation.
Business strategies high-light
this importance. Data is a
recognized corporate asset,
competitive differentiator,
source of transformation,
and a product itself.
Organization
and people
Data and analytics related
responsibilities are resourced
based on applications and
business people manage their
own data. The organization
does not have any devoted
people handling data and
analytics or have a leader to
manage it.
IT based data related roles
exist and are handling data
administrative and modelling
related tasks. Business is
involved in resolving data
related issues but not in
development or planning. IT
leader is sponsoring data
activities. Business leaders
are involved but not fully
committed.
Data and analytics
organization is established.
Business unit-based data
analyst and data scientists
start to emerge.
Implementation of data and
analytics related projects is
difficult due to finding
needed resources from
business side. Executive
level sponsorship exists.
POCs are helping to gain
more interest and
engagement from business.
Data and analytics moves
away from IT as a
separate unit closer to
Business. Data scientists,
coordinators and analysts
are prevalent part of
business. Former data
team is turned into a
competency center which
is doing less but enabling
more of what business is
doing. CDO is leading and
supporting data and
analytics initiatives and
cultural change.
CDO leads the data and
analytics organization that
supports the data and
analytics lifecycle. Data and
analytics initiatives are more
business centric and driven.
Business executives see data
and analytics as an essential
part of their operations.
Collaboration between
centralized team and
business functions is part of
the culture.
Technology There is no coherent
information architecture. It is
not understood how big data
masses should be handled.
Data and analytics
architecture exists but does
not support adding new data
sources or advanced
analytics. Some experiments
are done with cloud-based
solutions regarding big data.
Best-practice data and
analytics -architecture is
defined and applied in
certain areas. Various data
technologies are in use but
may not be well managed or
used in analytics.
Information architecture
is defined and applied and
covers most of the data
and analytics needs using
structured and
unstructured data.
Information architecture
fully support all data and
analytics initiatives and
business strategy related
projects and on-going
activities.
Analytics Analytics is used to
understand what has
happened. Traditional BI and
reporting solutions exist for
e.g. financial and other
regulatory purposes.
Analytics is used to
understand why something
has happened. Data is mostly
still used for reporting
purposes. Interest in
analytics has grown inside
the organization and some
outside partners are used to
do some experiments even
with advanced analytics.
Analytics is used to predict
the likelihood of what will
happen to some business-
related questions. A
company might be able to
manage large data masses
but not able to utilize it
through predictive models or
other advanced ways.
Predictive analytics is
used to optimize decision
making to enable optimal
actions for better
business value. Analytics
supporting the
organization by
integrating it into business
processes and automating
some decision making and
actions.
Analytics is used in
optimizing business
processes and is automated
where possible. All kinds of
data is used in integrated
way for analytics.
Data
Management
Manual information
governance for regulatory
purposes is done based on
few policies. Lack of data
definitions and handling
quality ad-hoc can be seen as
data not being trusted or
used. No overall data
strategy or plan for lifecycle
management.
Understanding of data and
establishing ownership is
emerging. Some reactive
policies for data
management have been
established but are not
monitored. Data owners are
assumed, and upstream data
quality is performing well
enough. No data lifecycle
management. End state data
architecture such as
semantic layer might exist.
A company is aware of data
issues and therefore policies
and procedures are started
to be implemented to
manage core data through
its lifecycle. Policies are
monitored by information
stewards with limited
authority. MDM programs
are started but focus is on
subsets of data.
Data governance
organization exists. Full
set of policies are
communicated and
enforced, and the
governance is prioritized
based on business needs.
Data quality monitoring is
mostly automated and
data life cycle
management exists.
Data quality monitoring is
automated and part of
business culture. Data
stewards are acting as
information advocates
focusing on value
generation.