developing eor screening methodologiesc196108.r8.cf1.rackcdn.com/maggiethompson.pdf ·...
TRANSCRIPT
Developing EOR Screening Methodologies
Developing EOR Screening Methodologies
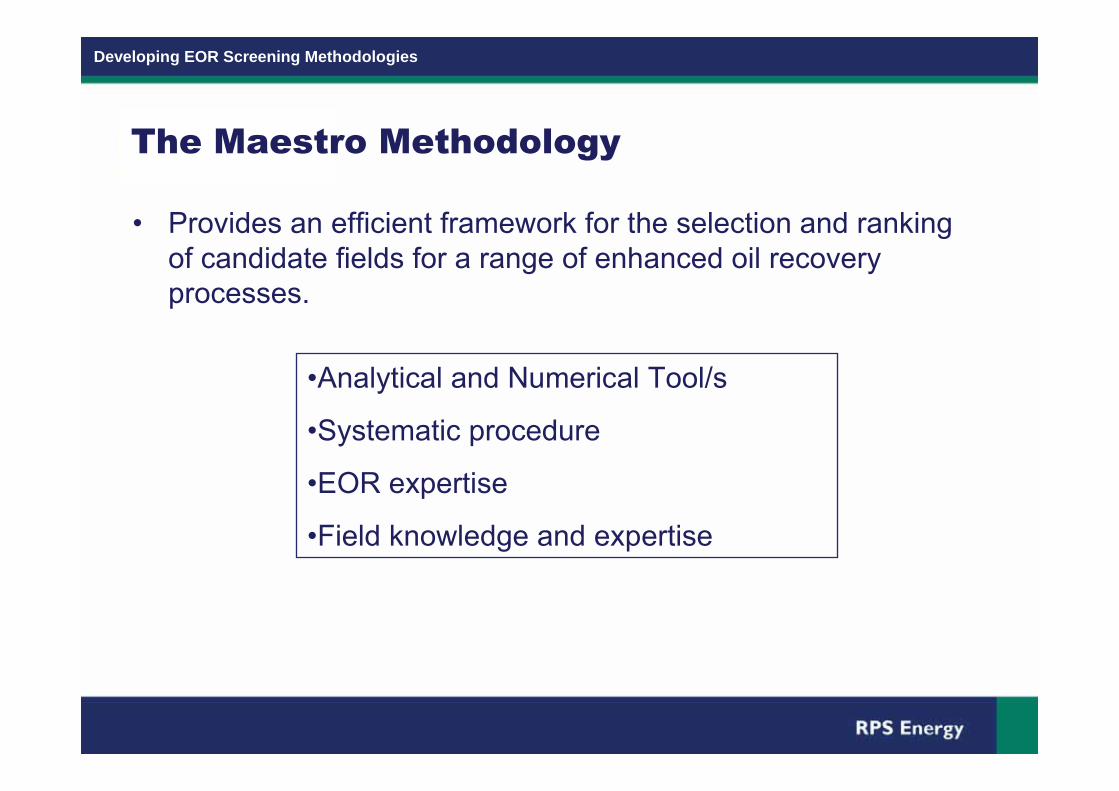
The Maestro Methodology
� Provides an efficient framework for the selection and rankingof candidate fields for a range of enhanced oil recoveryprocesses.
�Analytical and Numerical Tool/s
�Systematic procedure
�EOR expertise
�Field knowledge and expertise

Developing EOR Screening Methodologies
Maestro Development
Developed by Subsurface group at Winfrith Dorset (Currently theSpecialist Reservoir Engineering Group of RPS)
� 1970s � 1990s � Extensive research into EOR projects, theoreticaland experimental
� 1989 � Development of METEOR I � DTI/NPD� 1989 � 1992 EOR Screening of all UKCS oil fields � 100%success rate in identifying successful UKCS gas injection projects
� 1996 � MAESTRO� developed to enable commercial projects tobe undertaken
� 2000 � 2002 � MAESTRO� re-development �PerformanceIndicators� � �Rapid Simulation�
� 2010 � 2011 � Review of methodology in light of new EORchemicals / processes. Collaboration with BP Institute, Cambridge.
Developing EOR Screening Methodologies
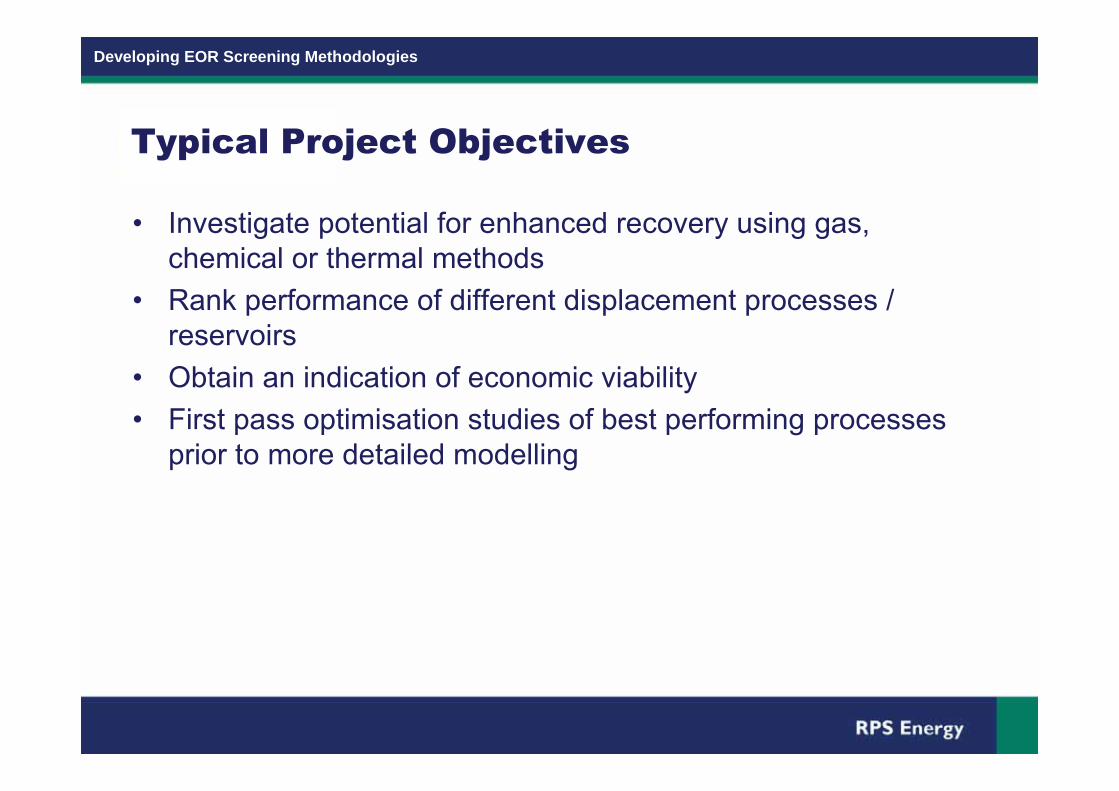
Typical Project Objectives
� Investigate potential for enhanced recovery using gas,chemical or thermal methods
� Rank performance of different displacement processes /reservoirs
� Obtain an indication of economic viability� First pass optimisation studies of best performing processesprior to more detailed modelling

Developing EOR Screening Methodologies
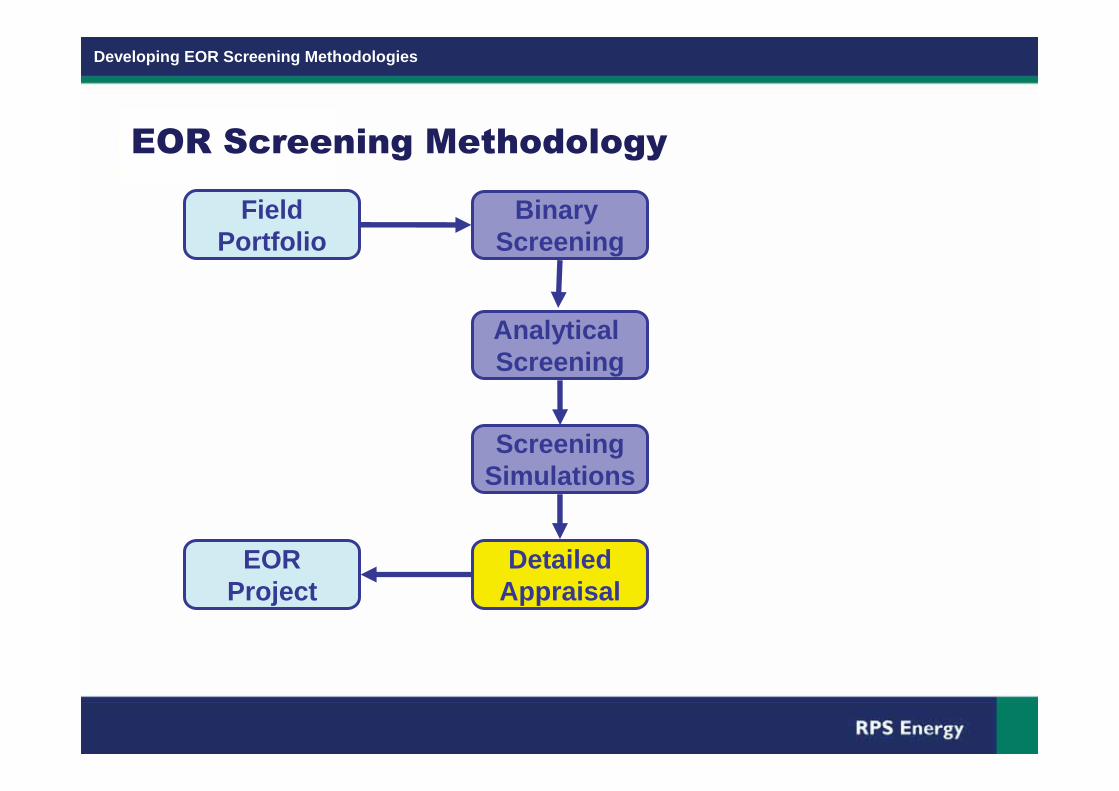
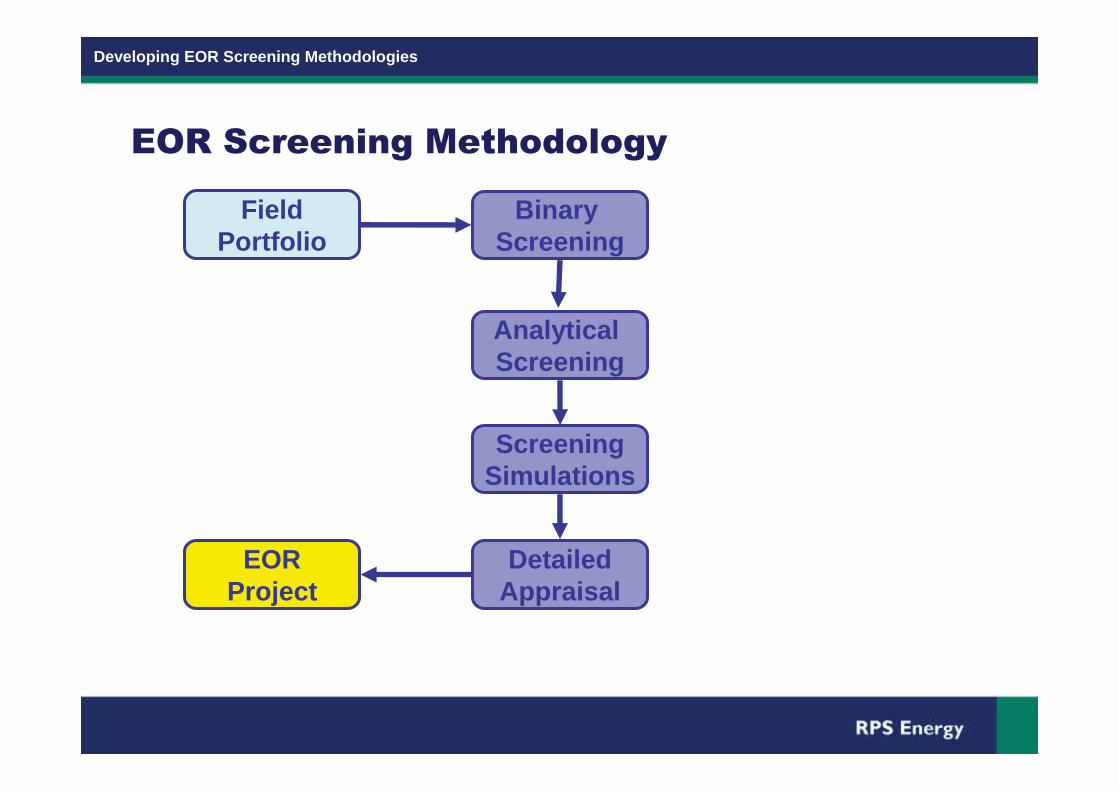
FieldPortfolio
AnalyticalScreening
DetailedAppraisal
ScreeningSimulations
BinaryScreening
EORProject
Hours
Days
Weeks
Months
Minutes
100
10
1
1000
Effort / Res. ReservoirsField
PortfolioBinary
Screening
EOR Screening Methodology

Developing EOR Screening Methodologies
Succ.
0.1
1
10
100
1000
10000
0 50 100 150 200 250 300 350
Vis
cosi
ty, c
p
CO2 miscCO2 immiscHC miscHC immiscN2 miscN2 immiscPolymerCombSteam
Reservoir Temperature, °F
Oil
Visc
osity
, cp
Gas
Chemical
Thermal
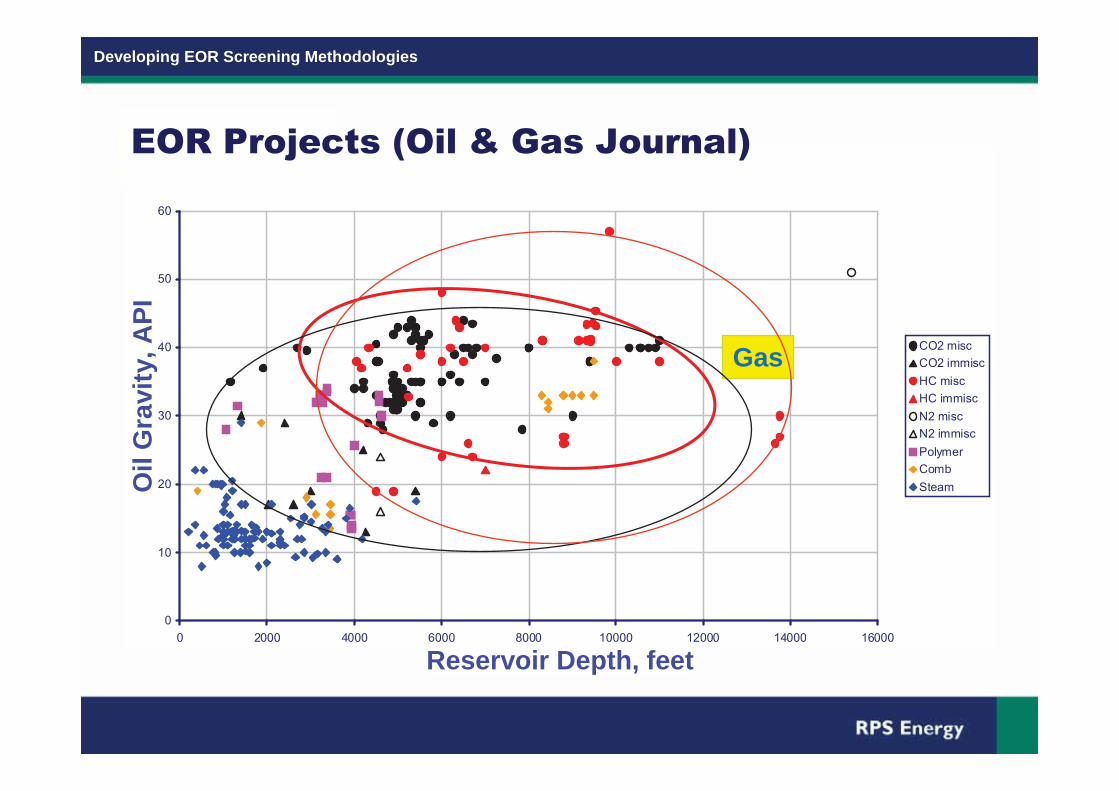
EOR Projects (Oil & Gas Journal)

Developing EOR Screening Methodologies
ALL
0
10
20
30
40
50
60
0 2000 4000 6000 8000 10000 12000 14000 16000
Gra
vity
, API
CO2 miscCO2 immiscHC miscHC immiscN2 miscN2 immiscPolymerCombSteam
Reservoir Depth, feet
Oil
Gra
vity
, API
Gas
Chemical
Thermal
EOR Projects (Oil & Gas Journal)
Developing EOR Screening Methodologies
ALL
0
10
20
30
40
50
60
0 2000 4000 6000 8000 10000 12000 14000 16000
Gra
vity
, API
CO2 miscCO2 immiscHC miscHC immiscN2 miscN2 immiscPolymerCombSteam
Reservoir Depth, feet
Oil
Gra
vity
, API
Gas
EOR Projects (Oil & Gas Journal)
Developing EOR Screening Methodologies
Binary Screening Criteria Developments
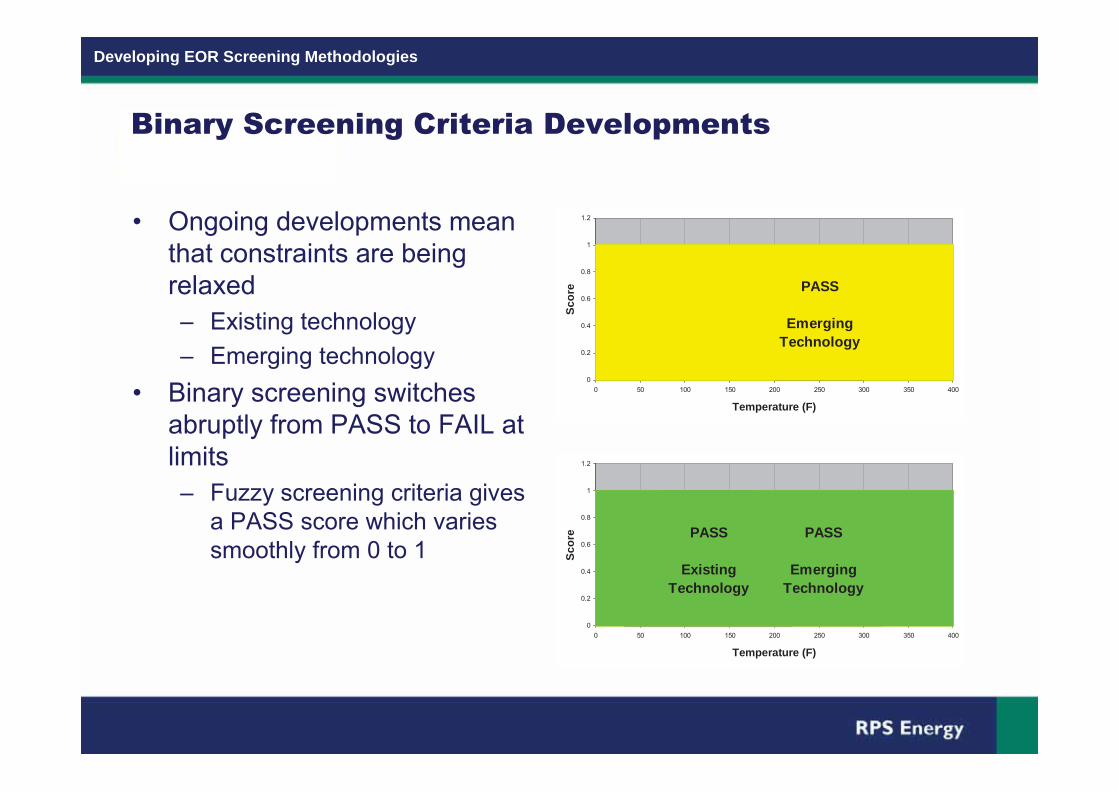
� Ongoing developments meanthat constraints are beingrelaxed� Existing technology� Emerging technology
� Binary screening switchesabruptly from PASS to FAIL atlimits� Fuzzy screening criteria givesa PASS score which variessmoothly from 0 to 1
0
0.2
0.4
0.6
0.8
1
1.2
0 50 100 150 200 250 300 350 400
Temperature (F)
Scor
e PASS
ExistingTechnology
PASS
EmergingTechnology
0
0.2
0.4
0.6
0.8
1
1.2
0 50 100 150 200 250 300 350 400
Temperature (F)
Scor
e PASS
ExistingTechnology
PASS
EmergingTechnology

Developing EOR Screening Methodologies
ALL
0
10
20
30
40
50
60
0 2000 4000 6000 8000 10000 12000 14000 16000
Gra
vity
, API
CO2 miscCO2 immiscHC miscHC immiscN2 miscN2 immiscPolymerCombSteam
Reservoir Depth, feet
Oil
Gra
vity
, API
Gas
EOR Projects (Oil & Gas Journal)
Developing EOR Screening Methodologies
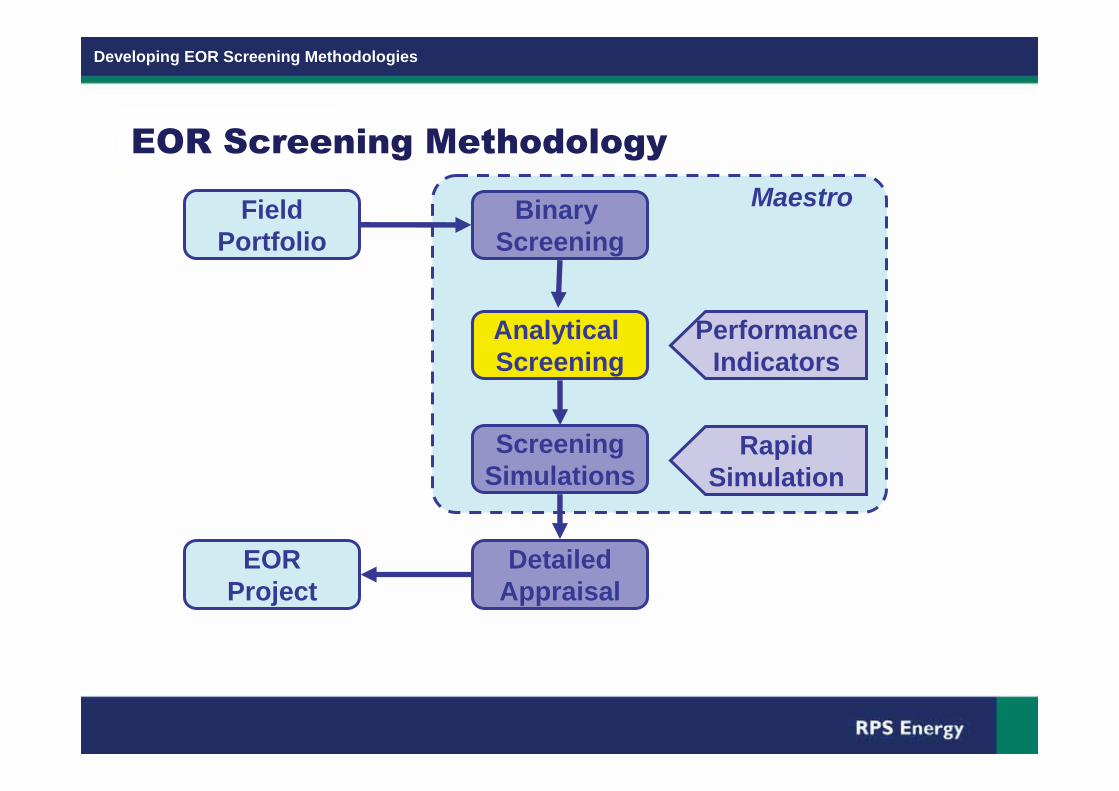
FieldPortfolio
Maestro
RapidSimulation
PerformanceIndicators
AnalyticalScreening
DetailedAppraisal
ScreeningSimulations
BinaryScreening
EORProject
EOR Screening Methodology

Developing EOR Screening Methodologies
Analytical Screening
� Key performance indicators� Viscous/gravity ratios
� Stone�s, Crane�s, Dietz etc
� Displacement Efficiency� Microscopic displacement
� Buckley-Leverett theory� MMP correlations
� Volumetric sweep� Areal sweep� Vertical sweep� Sweepable volume
Volumetric Sweep
Microscopic Displacement
Distance
Satu
ratio
n
Distance
Satu
ratio
n

Developing EOR Screening Methodologies
Assessing Viability
� Stability� Estimated incrementalrecovery (cf waterflood)� Displacement Efficienciescombine to estimateIncremental Recovery
� Performance Indicators� Economic Indicators� Sensitivity to uncertainty
Developing EOR Screening Methodologies
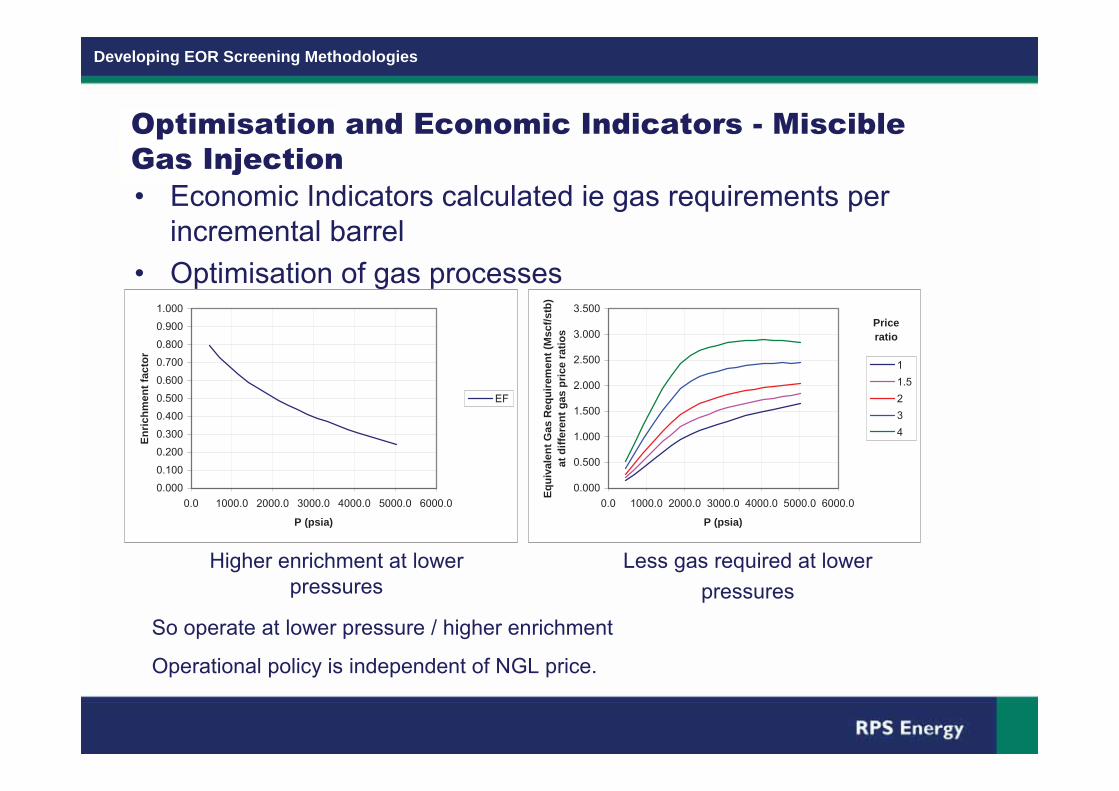
Optimisation and Economic Indicators - MiscibleGas Injection� Economic Indicators calculated ie gas requirements perincremental barrel
� Optimisation of gas processes
0.000
0.500
1.000
1.500
2.000
2.500
3.000
3.500
0.0 1000.0 2000.0 3000.0 4000.0 5000.0 6000.0
P (psia)
Equi
vale
nt G
as R
equi
rem
ent (
Msc
f/stb
) at
diff
eren
t gas
pric
e ra
tios
11.5234
Priceratio
0.000
0.100
0.200
0.300
0.400
0.500
0.600
0.700
0.800
0.900
1.000
0.0 1000.0 2000.0 3000.0 4000.0 5000.0 6000.0
P (psia)
Enric
hmen
t fac
tor
EF
Higher enrichment at lowerpressures
Less gas required at lowerpressures
So operate at lower pressure / higher enrichment
Operational policy is independent of NGL price.
Developing EOR Screening Methodologies
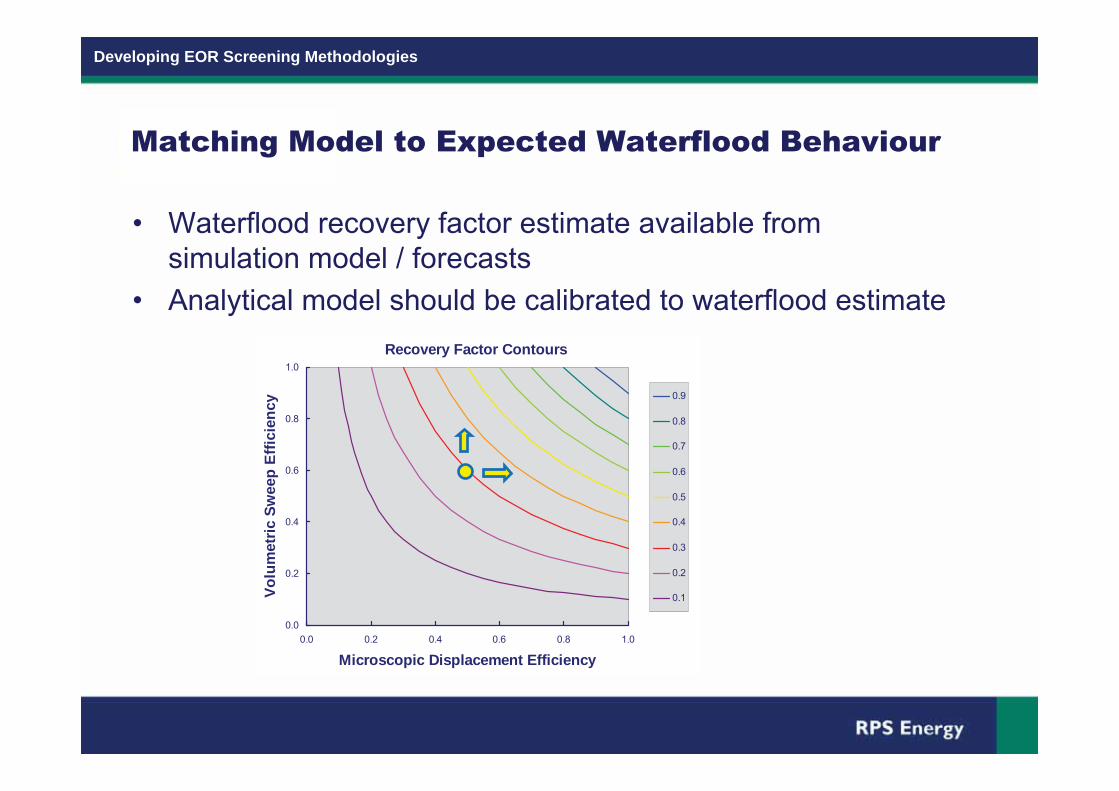
Matching Model to Expected Waterflood Behaviour
� Waterflood recovery factor estimate available fromsimulation model / forecasts
� Analytical model should be calibrated to waterflood estimateRecovery Factor Contours
0.0
0.2
0.4
0.6
0.8
1.0
0.0 0.2 0.4 0.6 0.8 1.0
Microscopic Displacement Efficiency
Volu
met
ric S
wee
p Ef
ficie
ncy 0.9
0.8
0.7
0.6
0.5
0.4
0.3
0.2
0.1
Developing EOR Screening Methodologies
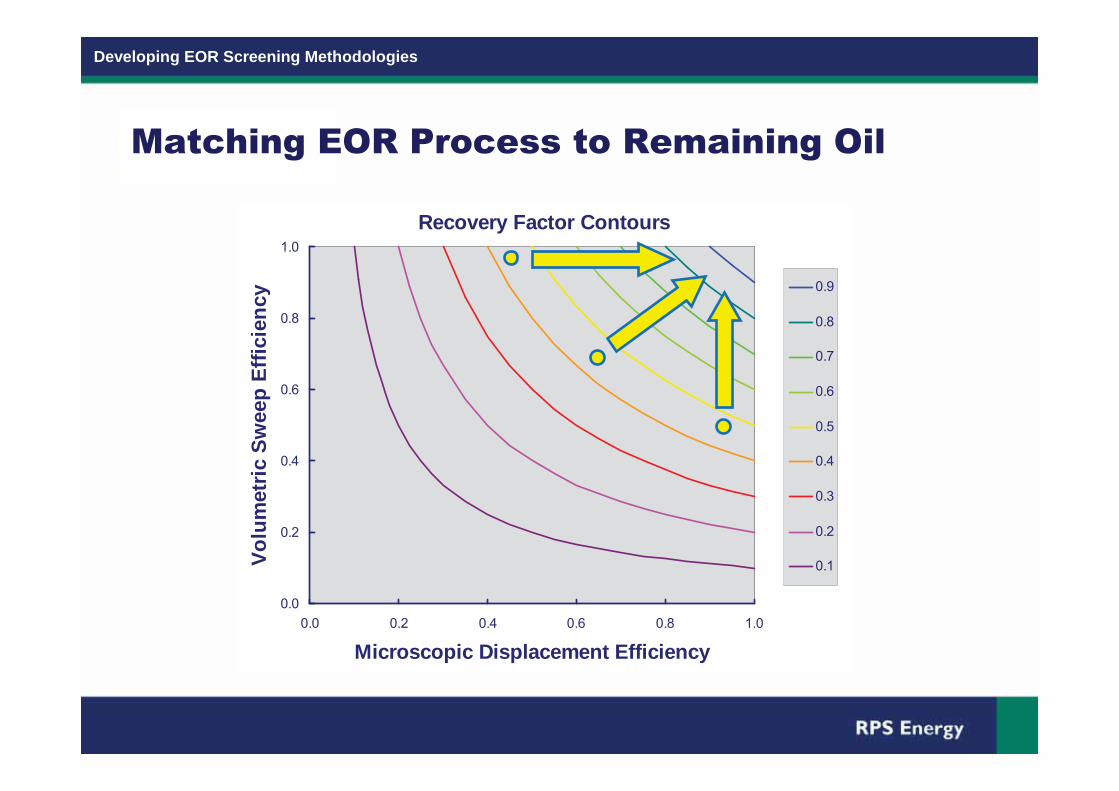
Recovery Factor Contours
0.0
0.2
0.4
0.6
0.8
1.0
0.0 0.2 0.4 0.6 0.8 1.0
Microscopic Displacement Efficiency
Volu
met
ric S
wee
p Ef
ficie
ncy 0.9
0.8
0.7
0.6
0.5
0.4
0.3
0.2
0.1
Matching EOR Process to Remaining Oil

Developing EOR Screening Methodologies
FieldPortfolio
RapidSimulation
PerformanceIndicators
AnalyticalScreening
DetailedAppraisal
ScreeningSimulations
BinaryScreening
EORProject
EOR Screening MethodologyMaestro
Developing EOR Screening Methodologies
Assess and Quantify Viability
� Include lateral and vertical heterogeneity� Include new well technologies� Generate production and injection profiles (Input toeconomics)
� Sensitivities to identify/confirm critical data� First pass optimisation
Developing EOR Screening Methodologies
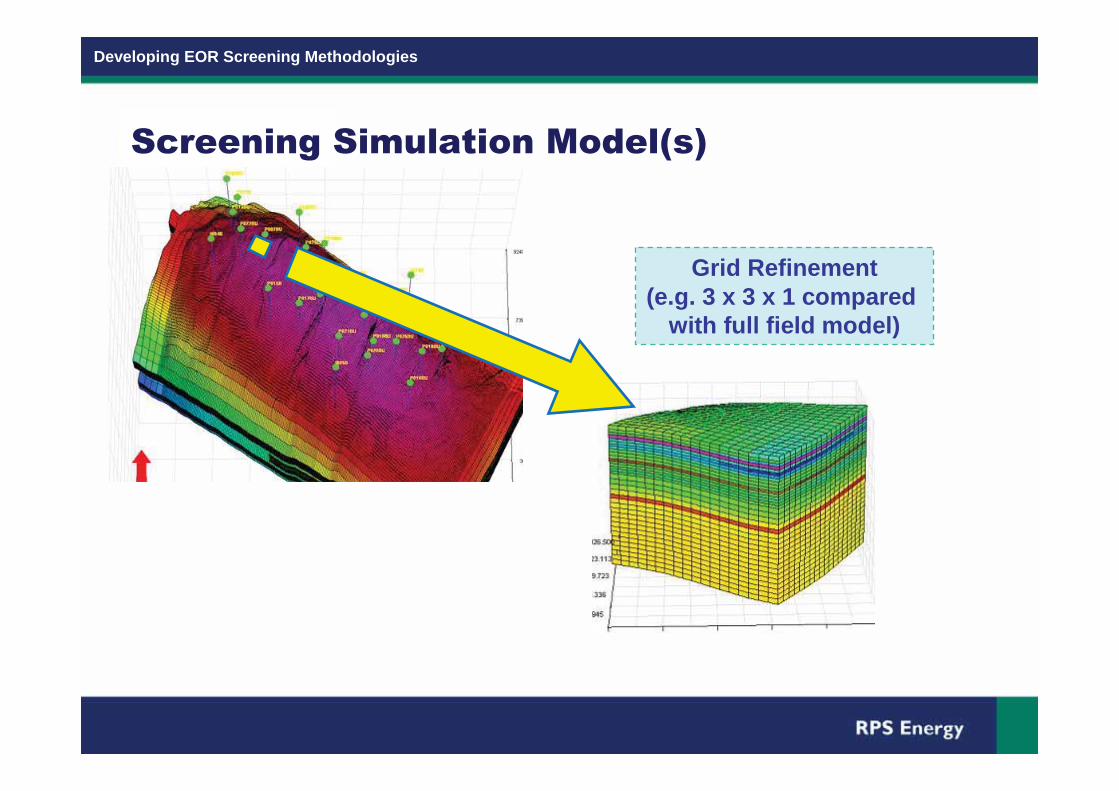
Grid Refinement(e.g. 3 x 3 x 1 compared
with full field model)
Screening Simulation Model(s)
Developing EOR Screening Methodologies
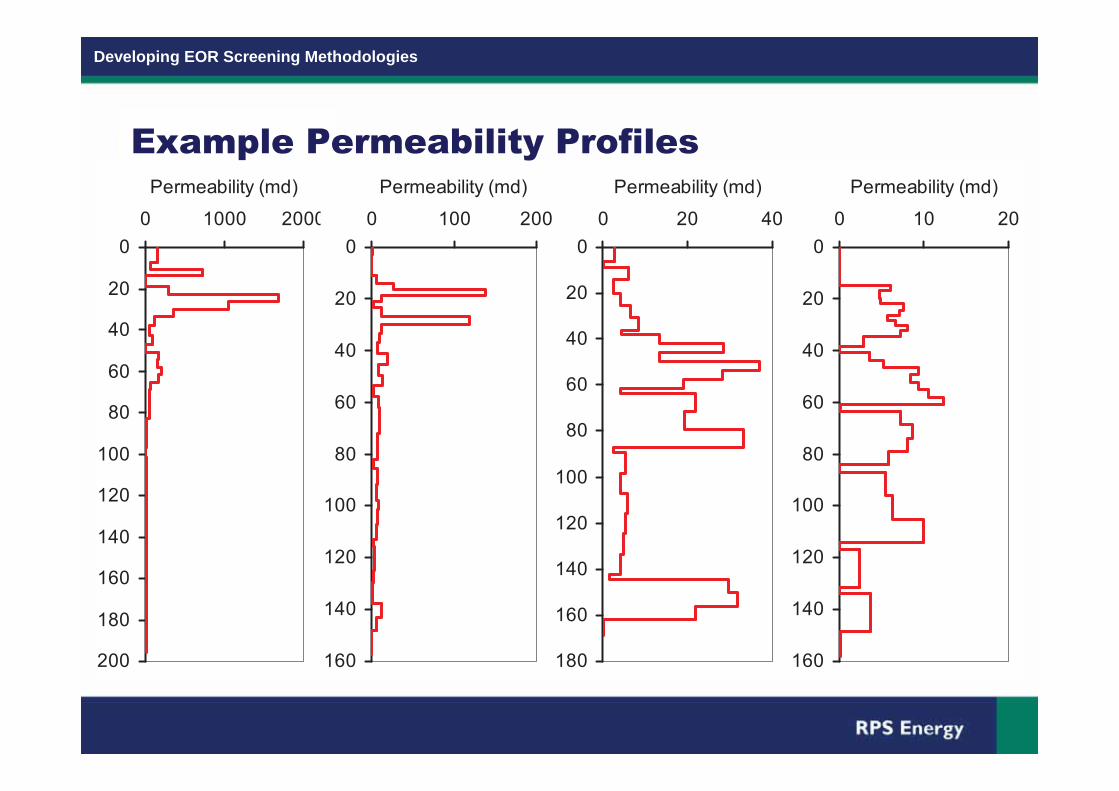
0
20
40
60
80
100
120
140
160
180
200
0 1000 2000
Permeability (md)
0
20
40
60
80
100
120
140
160
0 100 200
Permeability (md)
0
20
40
60
80
100
120
140
160
180
0 20 40
Permeability (md)
0
20
40
60
80
100
120
140
160
0 10 20
Permeability (md)
Example Permeability Profiles

Developing EOR Screening Methodologies
Viability of WAG Displacements
NecessaryPartial overrideTotal overrideSimulationScreening
Takes no accountof the position ofthe highpermeability layers
Segregation of gas/ water
Segregation of gas/ water
AnalyticalScreening
Does not considerverticalheterogeneity
Score = 1Score = 1BinaryScreening
CommentField 3Field 1
Developing EOR Screening Methodologies
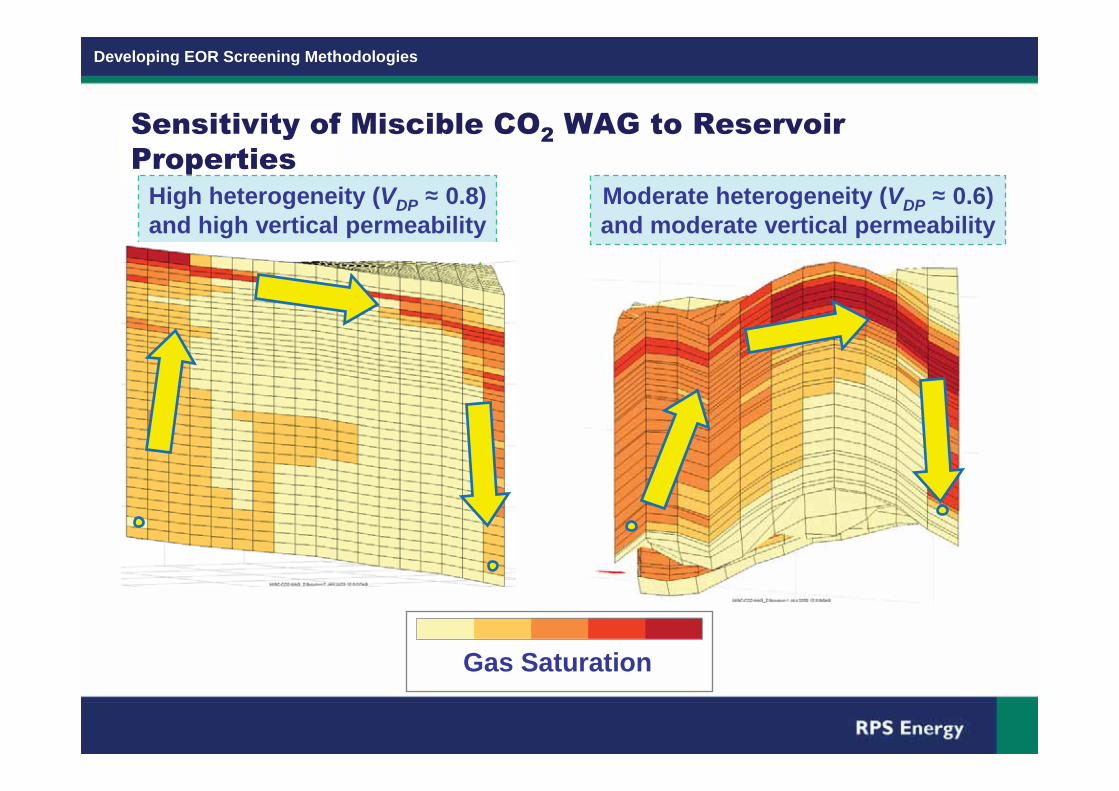
High heterogeneity (VDP 0.8)and high vertical permeability
Moderate heterogeneity (VDP 0.6)and moderate vertical permeability
Gas Saturation
Sensitivity of Miscible CO2 WAG to ReservoirProperties
Developing EOR Screening Methodologies
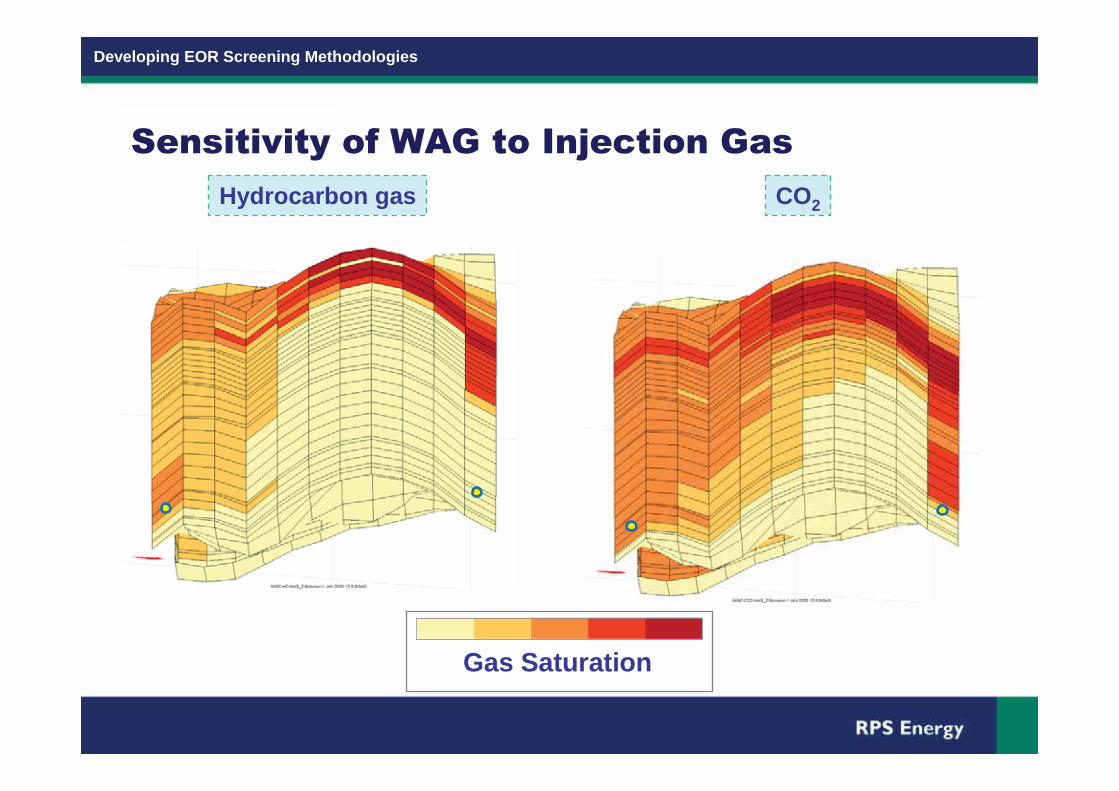
Hydrocarbon gas CO2
Gas Saturation
Sensitivity of WAG to Injection Gas
Developing EOR Screening Methodologies
FieldPortfolio
AnalyticalScreening
DetailedAppraisal
ScreeningSimulations
BinaryScreening
EORProject
EOR Screening Methodology
Developing EOR Screening Methodologies
FieldPortfolio
AnalyticalScreening
DetailedAppraisal
ScreeningSimulations
BinaryScreening
EORProject
EOR Screening Methodology

Developing EOR Screening Methodologies
Developing Analytical/Simulation Screening
� Chemical flooding (Surfactant/Polymer)� Wider range of applicability ( ie new chemicals stable at moreextreme conditions) eg high temperatures, low permeability,high viscosity, high salinity
� New flow mechanisms, eg Bright water, Low molecular weightpolymers
� New processes (ASP, Foams, low salinity waterflood)
� WAG� Improving accuracy of analytical methods� Effect of heterogeneity (High/Low K layers / Baffles)

Developing EOR Screening Methodologies
Hele-Shaw Cell Experiments � BP InstituteCambridge

Developing EOR Screening Methodologies
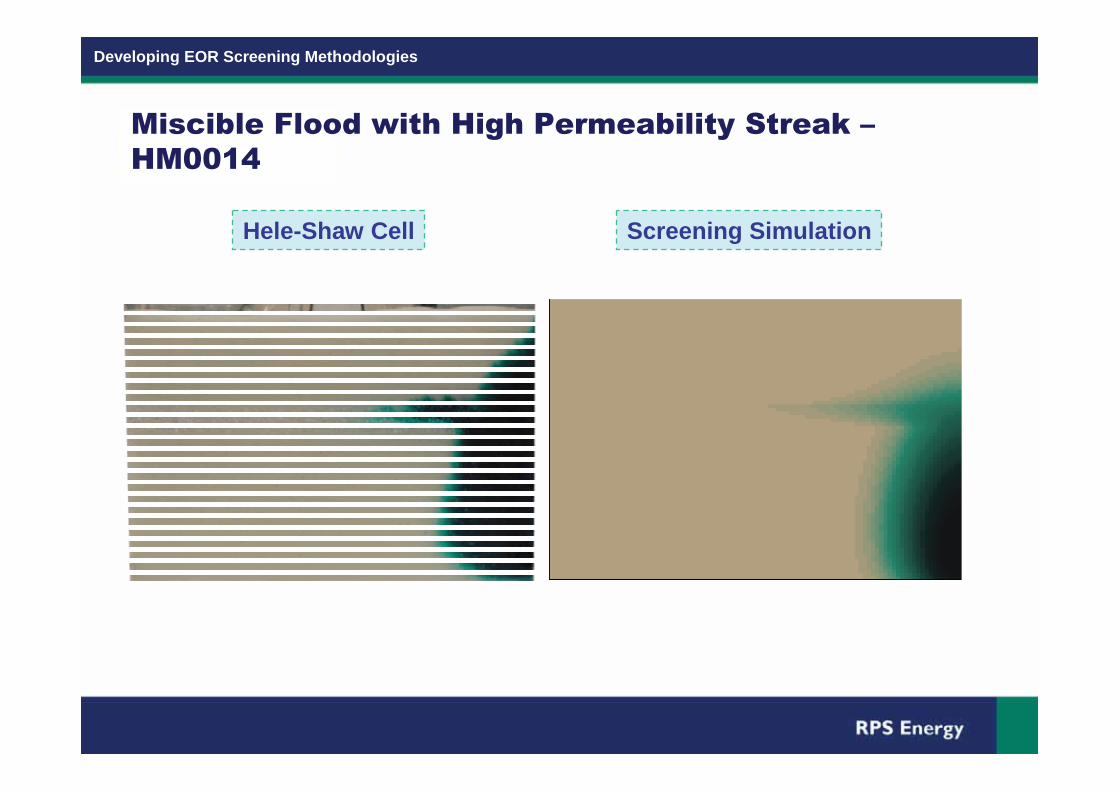
Miscible Flood with High Permeability Streak �HM0014
Hele-Shaw Cell Screening Simulation
Developing EOR Screening Methodologies
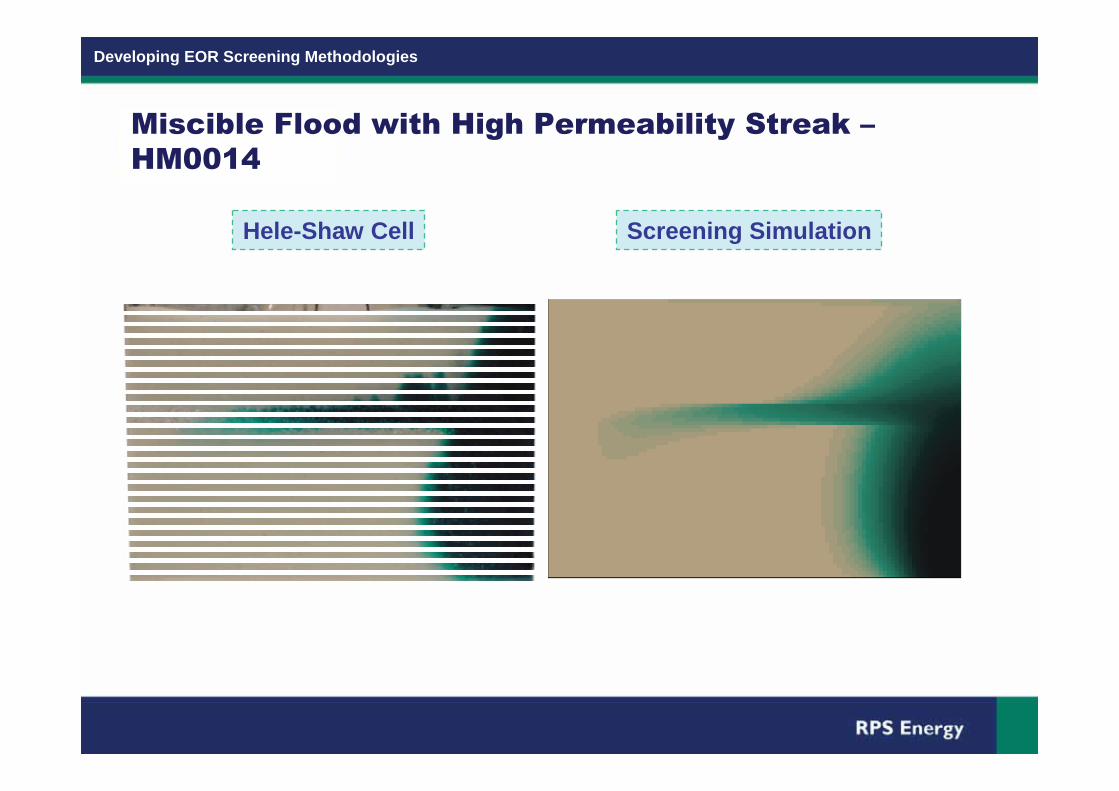
Miscible Flood with High Permeability Streak �HM0014
Hele-Shaw Cell Screening Simulation
Developing EOR Screening Methodologies
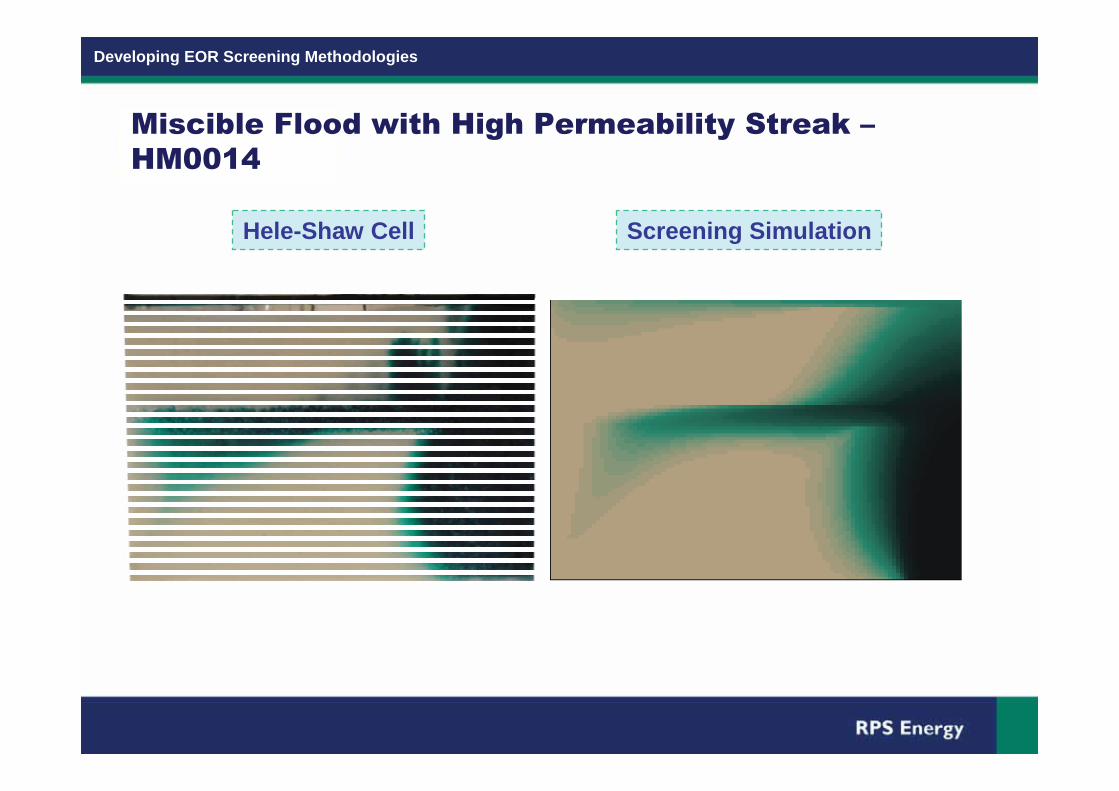
Miscible Flood with High Permeability Streak �HM0014
Hele-Shaw Cell Screening Simulation
Developing EOR Screening Methodologies
Miscible Flood with High Permeability Streak �HM0014
Hele-Shaw Cell Screening Simulation

Developing EOR Screening Methodologies
Miscible Flood with High Permeability Streak �HM0014
Hele-Shaw Cell Screening Simulation

Developing EOR Screening Methodologies
Summary
� Maestro is an established methodology providing an efficientframework for selection and ranking of candidate fields forEOR processes by focusing on most promising processes atan early stage
� The methodology continues to be relevant for today�s EORscreening requirements
� New chemicals and processes require developments to themethodology
� Research ongoing to improve analytical methods for WAGprocesses
Thank You
Developing EOR Screening Methodologies
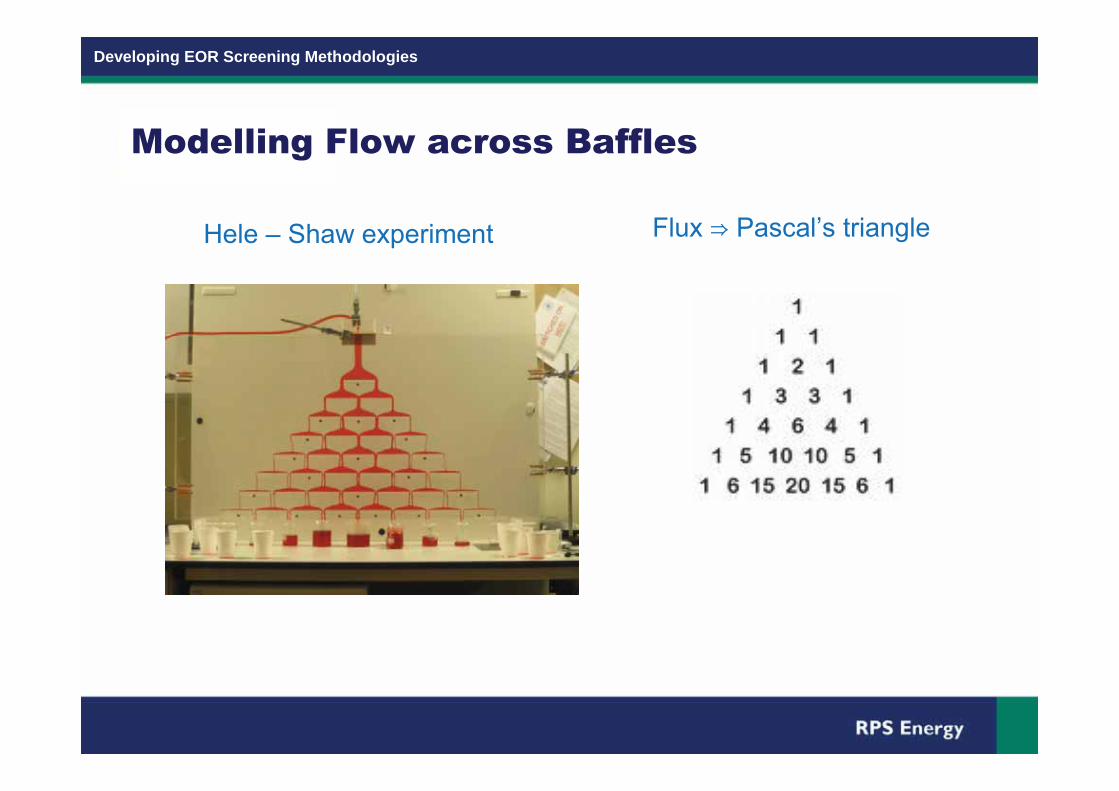
Modelling Flow across Baffles
Flux Pascal�s triangleHele � Shaw experiment