developing guidelines and methodologies for socio … august24.2016.pdfmatrix ranking, focus group...
TRANSCRIPT

Indi
an A
gric
ultu
ral R
esea
rch
Inst
itute
, New
Del
hi
Rabindra Padaria
ICAR-Indian Agricultural Research Institute New Delhi-110012, India
Developing guidelines and Methodologies for Socio-Economic
Assessment of LMOs

Indi
an A
gric
ultu
ral R
esea
rch
Inst
itute
, New
Del
hi
Reference crops and traits
S.N. Crop Trait
1 Cotton Resistant to American bollworm
2 Wheat Herbicide tolerant
3 Mustard Aphid resistant
Locale : Punjab and Haryana

Indi
an A
gric
ultu
ral R
esea
rch
Inst
itute
, New
Del
hi
Sampling framework
Punjab
Bhatinda Mansa
Haryana
Fatehabad Sirsa Hissar
•Districts and Blocks were selected purposively based on acreage of cotton
•Farmers were selected with simple random selection procedure
•Sample size: 220 farmers
•Scientists/scholars /Media representative selected randomly

Indi
an A
gric
ultu
ral R
esea
rch
Inst
itute
, New
Del
hi

Indi
an A
gric
ultu
ral R
esea
rch
Inst
itute
, New
Del
hi
Stakeholders’ Workshop at PAU, Ludhiana May 26, 2015
Above 100 participants including farmers, scientists, extension professionals, NGO professionals, input dealers, seed agencies, media persons Result of Focus Group Discussion Lack of understanding about GM technology Bt cotton successful Other biotech crops acceptable if profitable Scientists’ verdict about safety Openness in experimentations Public awareness and Educational campaign Deployment through govt agencies Reasonable cost of seed
Indi
an A
gric
ultu
ral R
esea
rch
Inst
itute
, New
Del
hi
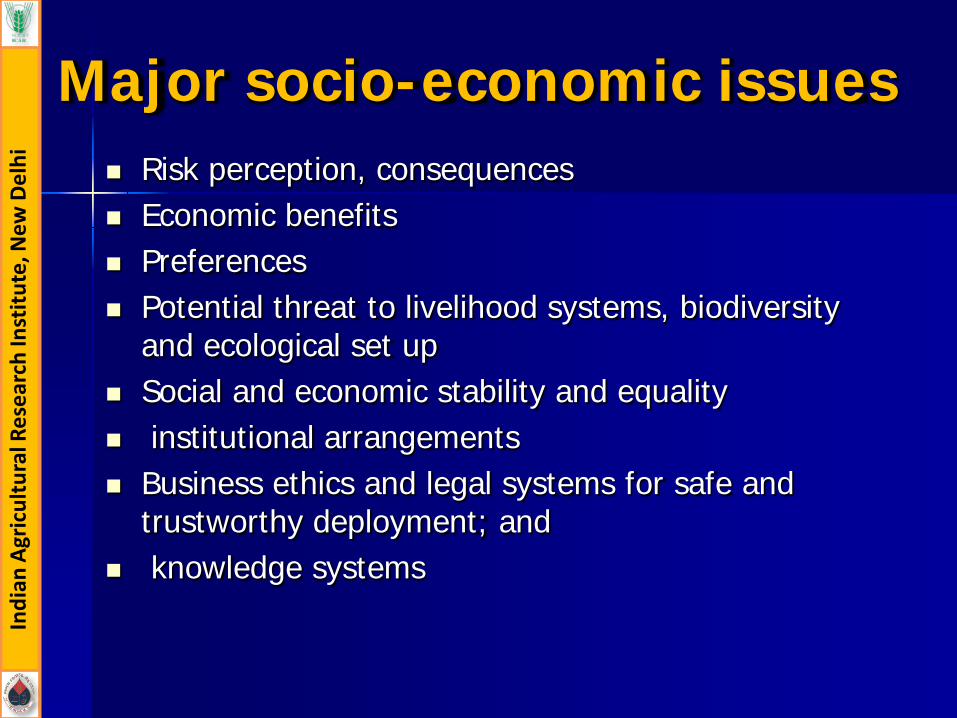
Major socio-economic issues Risk perception, consequences Economic benefits Preferences Potential threat to livelihood systems, biodiversity
and ecological set up Social and economic stability and equality institutional arrangements Business ethics and legal systems for safe and
trustworthy deployment; and knowledge systems
Indi
an A
gric
ultu
ral R
esea
rch
Inst
itute
, New
Del
hi
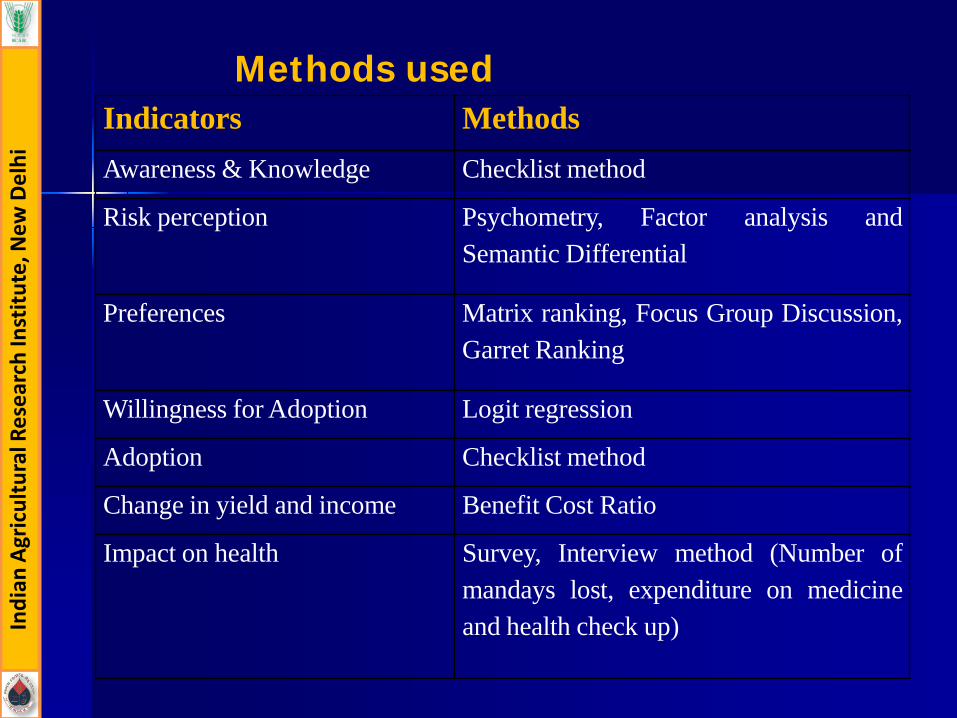
Indicators Methods Awareness & Knowledge Checklist method
Risk perception Psychometry, Factor analysis and Semantic Differential
Preferences Matrix ranking, Focus Group Discussion, Garret Ranking
Willingness for Adoption Logit regression
Adoption Checklist method
Change in yield and income Benefit Cost Ratio
Impact on health Survey, Interview method (Number of mandays lost, expenditure on medicine and health check up)
Methods used

Indi
an A
gric
ultu
ral R
esea
rch
Inst
itute
, New
Del
hi
Socio-economic profile Age
Age group (Years)
Percentage
20-40 38.2
40-60 49.1
Above 60 12.7
Size of holding
Size of holding group
Percentage
Less than 5 acres 26.40
5-10 acres 30.00
10-25 acres 31.80
More than 25 acres 11.80
Annual Income
Income group Percentage
Less than 2.5 lakh 25.5
2.5-5 lakh 29.5
5-10 lakh 24.1
More than 10 lakh 20.9
Level of Education
Education group Percentage
UP to primary 50.9
Secondary 15.9
Intermediate 22.7
College and above 10.5
Indi
an A
gric
ultu
ral R
esea
rch
Inst
itute
, New
Del
hi
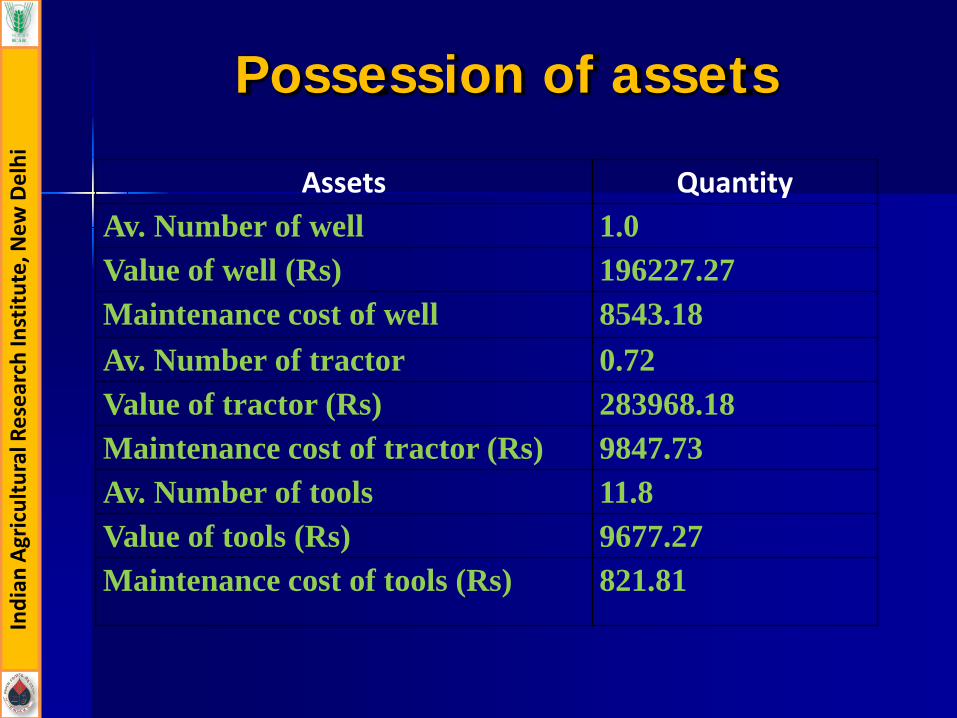
Possession of assets
Assets Quantity Av. Number of well 1.0 Value of well (Rs) 196227.27 Maintenance cost of well 8543.18 Av. Number of tractor 0.72 Value of tractor (Rs) 283968.18 Maintenance cost of tractor (Rs) 9847.73 Av. Number of tools 11.8 Value of tools (Rs) 9677.27 Maintenance cost of tools (Rs) 821.81

Indi
an A
gric
ultu
ral R
esea
rch
Inst
itute
, New
Del
hi
Av. Number of cows 0.74 Value of cows (Rs) 21527.27 Maintenance cost of cows (Rs) 3693.18
Av. Number of buffalo 1.66 Value of buffalo (Rs) 110802 Maintenance cost of buffalo (Rs) 12118.18
Av. Number of cattle shed 0.9636 Value of cattle shed (Rs) 109636.36
Maintenance cost of cattle shed (Rs)
6656.36

Constraints Garret score Rank
High cost of input 69.6 I
High incidence of Pests 66.46 II
Climatic risks 51.92 III
Lack of availability of quality input 50.2 IV
Shortage of water 44.7 V
Weed menace 42.28 VI
Unavailability of labour 39.82 VII
Lack of availability of quality Seed 36.44 VIII
Constraints in agriculture

S.N. Criteria Mean Score (MS)
1. Yield 9.67 2 Efficacy in problem solving
(pest management) 9.67
3 Germination potential 8.67 4. Cost of seed 8.50 5 Size of ball and plant
(cotton) 8.43
6. Inputs requirement 8.33 7. Suitability to farm 8.13 8. Safety to human and cattle 7.66 9. Irrigation intensiveness 7.33 10. Crop duration 6.67
Understanding Farmers’ Decision criteria for selection of varieties

Why farmers adopted Bt. cotton?
• Average Number of sprays reduced by 32.72% • Average Yield increased by 35.55 % • Increase in BCR by 22.22% • Perceived advantage of improved quality of
ecosystem and reduced health hazards due to pesticides
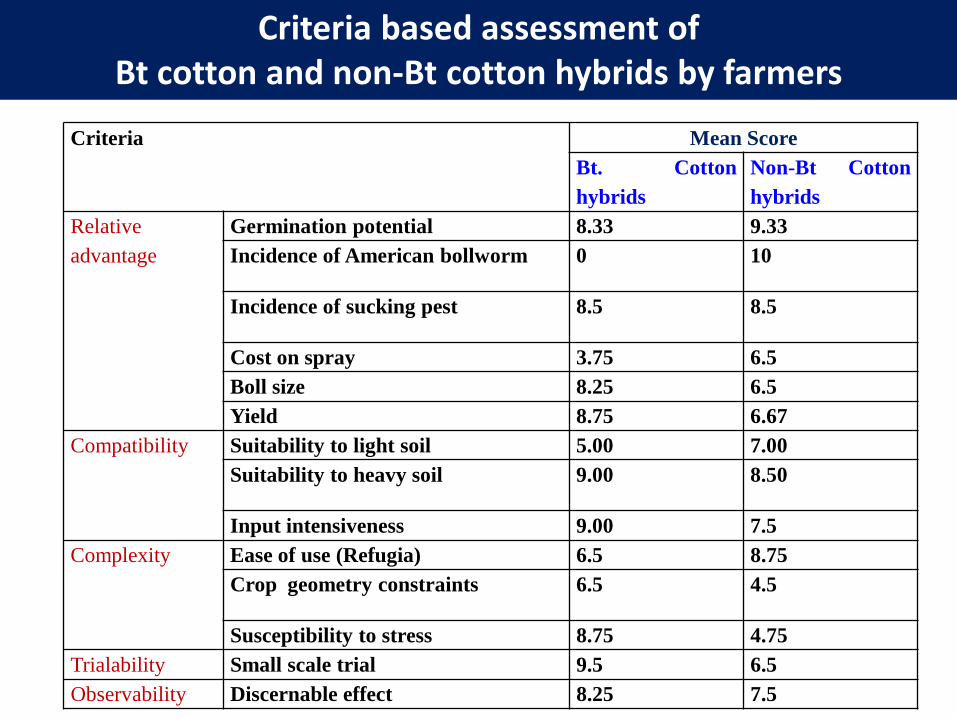
Criteria Mean Score Bt. Cotton hybrids
Non-Bt Cotton hybrids
Relative advantage
Germination potential 8.33 9.33 Incidence of American bollworm 0 10
Incidence of sucking pest 8.5 8.5
Cost on spray 3.75 6.5 Boll size 8.25 6.5 Yield 8.75 6.67
Compatibility Suitability to light soil 5.00 7.00 Suitability to heavy soil 9.00 8.50
Input intensiveness 9.00 7.5 Complexity Ease of use (Refugia) 6.5 8.75
Crop geometry constraints 6.5 4.5
Susceptibility to stress 8.75 4.75 Trialability Small scale trial 9.5 6.5 Observability Discernable effect 8.25 7.5
Criteria based assessment of Bt cotton and non-Bt cotton hybrids by farmers

Parameters Mean
t-value P-value Bt Cotton Non-Bt cotton
Land preparation 1342.28 1350.91 -0.241 0.809 Seed cost 1630.23 601.59 61.637 0.01 Sowing charge 492.73 495.45 -0.490 0.625 Irrigation cost 2300.50 1559.64 11.263 0.01 Weeding cost 2043.18 1945.23 2.104 0.04 Fertilizer cost 2498.90 2550.84 -2.999 0.01 Number of spray 4.73 7.03 -24.304 0.01 Cost of spray 3260.00 3994.55 -10.447 0.01 Harvest 4077.50 2959.55 26.339 0.01 Bagging cost 922.05 926.59 -0.296 0.767 Total cost 18080.50 16384.34 12.615 0.01 Yield 8.16 6.02 20.450 0.01 Gross income 35900.00 26500.00 20.450 0.01 BCR 1.98 1.62 17.398 0.01
Bt. cotton vis-à-vis non-Bt cotton: Have farmers gained?
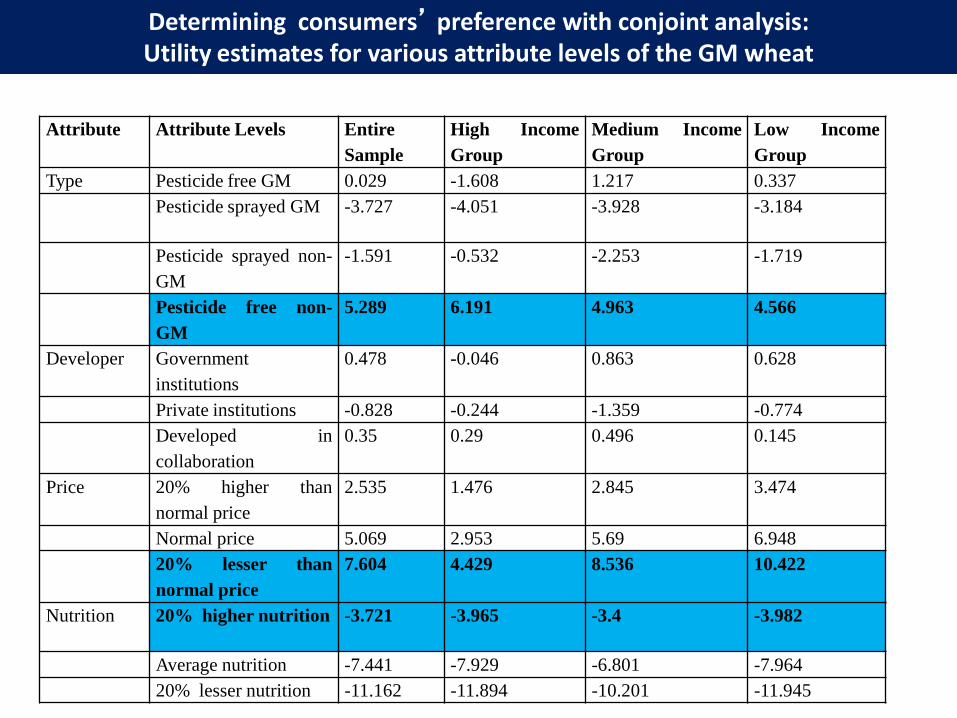
Attribute Attribute Levels Entire Sample
High Income Group
Medium Income Group
Low Income Group
Type Pesticide free GM 0.029 -1.608 1.217 0.337 Pesticide sprayed GM -3.727 -4.051 -3.928 -3.184
Pesticide sprayed non-GM
-1.591 -0.532 -2.253 -1.719
Pesticide free non-GM
5.289 6.191 4.963 4.566
Developer Government institutions
0.478 -0.046 0.863 0.628
Private institutions -0.828 -0.244 -1.359 -0.774 Developed in collaboration
0.35 0.29 0.496 0.145
Price 20% higher than normal price
2.535 1.476 2.845 3.474
Normal price 5.069 2.953 5.69 6.948 20% lesser than normal price
7.604 4.429 8.536 10.422
Nutrition 20% higher nutrition -3.721 -3.965 -3.4 -3.982
Average nutrition -7.441 -7.929 -6.801 -7.964 20% lesser nutrition -11.162 -11.894 -10.201 -11.945
Determining consumers’ preference with conjoint analysis: Utility estimates for various attribute levels of the GM wheat

Cost of cultivation of mustard Items Mustard
Land preparation (Rs) 1525.19
Seed cost (Rs) 279.31
Sowing charge (Rs) 437.40
Irrigation cost(Rs) 748.63
Fertilizer (Rs) 2112.29
Weeding charge (Rs) 982.06
Pesticide (Rs) 855.73
Harvesting (Rs) 2406.11
Bagging+Transport (Rs) 405.34
Total cost (Rs) 9752.06
Yield (qtl/acre) 7.04
Price (Rs/qtl) 3500
Gross return (Rs) 24633.59
BCR 2.53
Scenario Lowest yield (Qtl/acre)
Highest yield (Qtl/acre)
In absence of aphid
5.29 7.18
In presence of aphid
2.95 3.86
aphid+ management
3.92 6.01
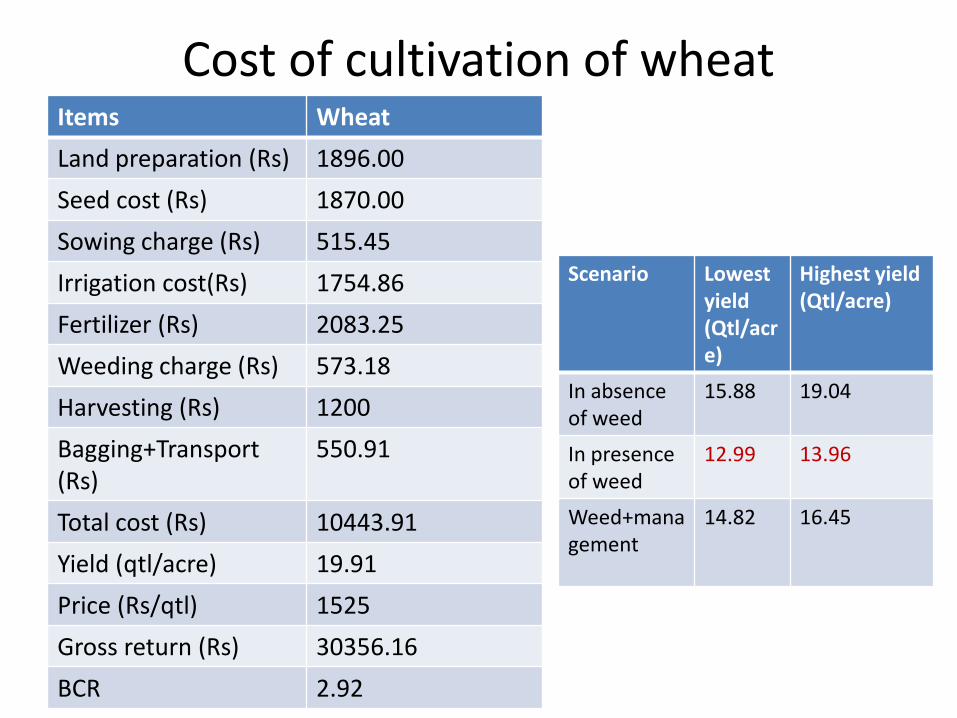
Cost of cultivation of wheat Items Wheat Land preparation (Rs) 1896.00 Seed cost (Rs) 1870.00 Sowing charge (Rs) 515.45 Irrigation cost(Rs) 1754.86 Fertilizer (Rs) 2083.25 Weeding charge (Rs) 573.18 Harvesting (Rs) 1200 Bagging+Transport (Rs)
550.91
Total cost (Rs) 10443.91 Yield (qtl/acre) 19.91 Price (Rs/qtl) 1525 Gross return (Rs) 30356.16 BCR 2.92
Scenario Lowest yield (Qtl/acre)
Highest yield (Qtl/acre)
In absence of weed
15.88 19.04
In presence of weed
12.99 13.96
Weed+management
14.82 16.45
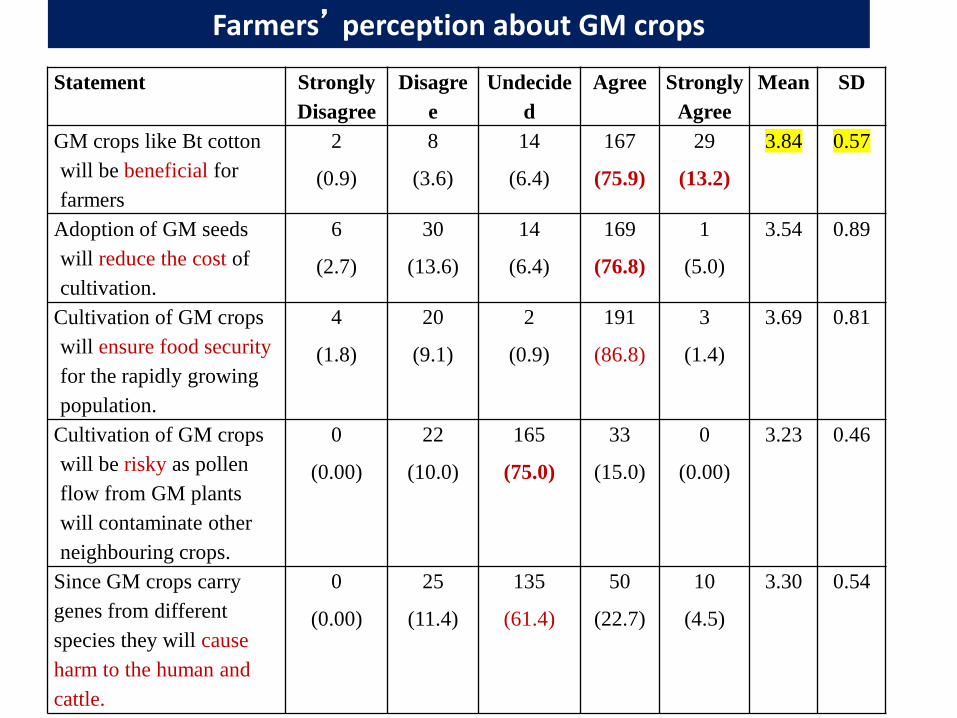
Statement Strongly Disagree
Disagree
Undecided
Agree Strongly Agree
Mean SD
GM crops like Bt cotton will be beneficial for farmers
2
(0.9)
8
(3.6)
14
(6.4)
167
(75.9)
29
(13.2)
3.84 0.57
Adoption of GM seeds will reduce the cost of cultivation.
6
(2.7)
30
(13.6)
14
(6.4)
169
(76.8)
1
(5.0)
3.54 0.89
Cultivation of GM crops will ensure food security for the rapidly growing population.
4
(1.8)
20
(9.1)
2
(0.9)
191
(86.8)
3
(1.4)
3.69 0.81
Cultivation of GM crops will be risky as pollen flow from GM plants will contaminate other neighbouring crops.
0
(0.00)
22
(10.0)
165
(75.0)
33
(15.0)
0
(0.00)
3.23 0.46
Since GM crops carry genes from different species they will cause harm to the human and cattle.
0
(0.00)
25
(11.4)
135
(61.4)
50
(22.7)
10
(4.5)
3.30 0.54
Farmers’ perception about GM crops

Entry of GM food in food chain should be stopped as they will lead to abnormality in body growth.
0
(0.00)
26
(11.8)
103
(46.8)
85
(38.6)
6
(2.7)
3.56 0.65
Cultivation of GM crops will harm agro- biodiversity.
10
(4.5)
25
(11.4)
107
(48.6)
75
(34.1)
3
(1.4)
3.48 0.62
The production and trade of GM seeds will increase the monopoly of big companies in the seed market.
26
(11.8)
104
(47.3)
7
(3.2)
76
(34.5)
7
(3.2)
2.57 1.16
GM technology is required for few crops.
19
(8.6)
93
(42.3)
59
(26.8)
47
(21.4)
2
(9)
3.08 0.81
Rigorous scientific testing is done prior to release of GM crops.
12
(5.5)
13
(5.9)
18
(8.2)
164
(74.5)
13
(5.9)
3.88 0.62
Genetic engineering scientists tend to conceal data about harmful effects of GMOs.
67
(30.5)
74
(33.6)
63
(28.6)
16
(7.3)
0
(0.00)
2.24 1.01
Only the large farmers will be benefitted by genetic engineering technology.
22
(10.0)
69
(31.4)
8
(3.6)
119
(54.1)
2
(9)
3.51 0.86

Promotion of GM technology will cripple indigenous knowledge system.
14
(6.4)
34
(15.5)
20
(9.1)
150
(68.2)
2
(0.9)
3.93 0.31
Promotion of GM crops should be banned as it will pose a serious threat to GI marked high value crops (eg Basmati rice).
12
(5.4)
25
(11.4)
22
(10.0)
160
(72.9)
1
(5.0)
3.71 0.69
Genetically modified foods should be labelled for the benefit of consumers.
0
(0.00)
0
(0.00)
93
(42.3)
107
(48.6)
20
(9.1)
3.70 0.53
Information on biotechnology provided by mass media sources is trustworthy
0
(0.00)
11
(5.0)
93
(42.3)
100
(45.5)
16
(7.3)
3.59 0.59
Deployment of GM crops will increase the cost of cultivation.
19
(8.6)
68
(30.9)
91
(41.4)
32
(14.5)
10
(4.5)
2.84 0.77
Prevalence of secondary pests will increase due to
1
(5.0)
33
(15.0)
87
(39.5)
89
(40.5)
10
(4.5)
3.41 0.64

Identification of Risk Perception Domains A set of 18 statements were Administered to •Farmers •Scientists & Scholars •Media representatives •NGO representatives •Input dealers •Consumers
farmers
Scientists

Component Initial Eigen values Extraction Sums of Squared Loadings
Rotation Sums of Squared Loadings
Total % of
Variance Cumulati
ve % Total % of
Variance Cumulativ
e % Total % of
Variance Cumulative
% Threats 5.21 28.98 28.98 5.22 28.980 28.980 3.784 21.024 21.024
Regulatory arrangements
3.218 17.879 46.859 3.218 17.879 46.859 3.527 19.595 40.619
Seed systems 1.793 9.959 56.818 1.793 9.959 56.818 2.637 14.648 55.267
Openness in innovation process
1.538 8.544 65.362 1.538 8.544 65.362 1.817 10.095 65.362
Risk Perception domain among the farmers

Variables Rotated Component Matrixa Threats Regulatory
arrangements Seed systems Openness in
innovation process
Cost effectiveness of GM seed
.858
GM seedsFood security
.706
Health unfriendly foreign genes in GM seed
-.619
Seed Monopoly -.646
Gene flow- risk .663
Food chain risk .728
Loss of biodiversity .817
Resource rich biasness
.752
Loss of ITK .629
Increased threat (pests)
.561

Threats Regulatory arrangements
Seed systems
Openness in innovation process
Limited application
.770
Closed science -.623
Scientific rigour .657
Threat to GI products
.846
Right to options
( labeling)
-.761
Trust in information source
-.797
Increased cost .634

Scientists & Scholars’ Risk Perception domain
Factors Initial Eigen values Rotation Sums of Squared Loadings
Total % of
Variance Cumulative
% Total % of
Variance Cumulative
%
Threats 4.124 22.913 22.913 4.124 22.913 22.913
Relative advantage
2.301 12.784 35.697 2.301 12.784 35.697
Innovation process
1.594 8.857 44.554 1.594 8.857 44.554
Regulation (monopoly, autonomy, labeling)
1.274 7.079 51.633 1.274 7.079 51.633
Trust of information
1.076 5.976 57.609 1.076 5.976 57.609

Statement Strongly Disagree
Disagree Undecided Agree Strongly Agree
GM crops like Bt cotton will be beneficial for farmers
6.7 46.7 20 26.7 0
Adoption of GM seeds will reduce the cost of cultivation.
13.3 46.7 20 20 0
Cultivation of GM crops will ensure food security for the rapidly growing population.
0 33.3 40 20 6.7
Cultivation of GM crops will be risky as pollen flow from GM plants will contaminate other neighbouring crops.
0 26.7 53.3 20 0
Since GM crops carry genes from different species they will cause harm to the human and cattle.
0 13.3 33.3 46.7 6.7
Media’s perception about GM crops

Entry of GM food in food chain should be stopped as they will lead to abnormality in body growth.
0 13.3 40 46.7 0
Cultivation of GM crops will harm agro- biodiversity.
0 6.7 40 53.3 0
The production and trade of GM seeds will increase the monopoly of big companies in the seed market.
0 6.7 73.3 20 0
GM technology is required for few crops.
0 0 60 33.3 6.7
Rigorous scientific testing is done prior to release of GM crops.
0 0 20 33.3 46.7
Genetic engineering scientists tend to conceal data about harmful effects of GMOs.
0 13.3 60 26.7 0
Only the large farmers will be benefitted by genetic engineering technology.
6.7 6.7 40 40 6.7

Capturing Co-existence of knowledge systems: Managing white fly with Dr Dalal Mixture
•Improve plant health and manage pests with biological systems •Understanding the life cycle of insects • Knowing the pest dynamics in nature: Helpful and
Harmful insects •Regular monitoring of ETL • Spray of 2.5 kg urea, 2.5 Kg DAP, 0.5 Kg Zn with
100 litres of water •Social learning and Dissemination through Mahila Keet Pathshala
Safety, Sovereignty, Sustainability, satisfaction

BENEFICIAL
SUCCESSFUL
POISONOUS
RELIABLE
COSTLY
DURABLE
ESSENTIAL
EXCEPTIONAL
VALUABLE
COMPATIBLE
DESTROYER
SAFE
FARMER-FRIENDLY
SUPPORTIVE
NATURAL
NON-BENEFICIAL
UNSUCCESSFUL
NON-POISONOUS
UNRELIABLE
CHEAP
UN-DURABLE
NON-ESSENTIAL
ORDINARY
WORTHLESS
UN-COMPATIBLLE
CONESTRUCTIVE
DEADLY
UNFRIENDLY
NON-SUPPORTIVE
UNNATURAL
MOST 11 10 9 8 7 6 5 4 3 2 1 LEAST
FARMERS’ PERCEPTION: SEMANTIC DIFFERENTIAL Sishupal Ender Balbir Malkit Shankr Vishnu Chunia Krparam Subhas Bhimse Sunil Manhor Vinod Nathu
ram Harpal

BENEFICIAL
SUCCESSFUL
POISONOUS
RELIABLE
COSTLY
DURABLE
ESSENTIAL
EXCEPTIONAL
VALUABLE
COMPATIBLE
DESTROYER
SAFE
FARMER-FRIENDLY
SUPPORTIVE
NATURAL
NON-BENEFICIAL
UNSUCCESSFUL
NON-POISONOUS
UNRELIABLE
CHEAP
UN-DURABLE
NON-ESSENTIAL
ORDINARY
WORTHLESS
UN-COMPATIBLLE
CONESTRUCTIVE
DEADLY
UNFRIENDLY
NON-SUPPORTIVE
UNNATURAL
MOST 11 10 9 8 7 6 5 4 3 2 1 LEAST
FARMERS’ PERCEPTION: SEMANTIC DIFFERENTIAL

Variable B Standard error Wald df Significance P-value
Exp (B)
Education -.228 .163 1.957 1 .162 .796
Family size .871 .253 11.878
1 .001 2.389
Annual Income .000 .000 7.112 1 .008 1.000
Farming Experience -.046 .024 3.618 1 .057 .955
Size of holding -.072 .033 4.836 1 .028 .930
Social participation .960 .483 3.957 1 .047 2.612
Social network 1.462 .542 7.260 1 .007 4.313
Risk orientation .465 .512 .824 1 .364 1.591
Constant -3.140 1.526 4.231 1 .040 .043
Variable(s) entered on step 1: Education, Famsize, Income, farmgexp, szeholding, socialpart, Socialnetwrk, Riskorient
Determinants of adoption decision :Logit regression model
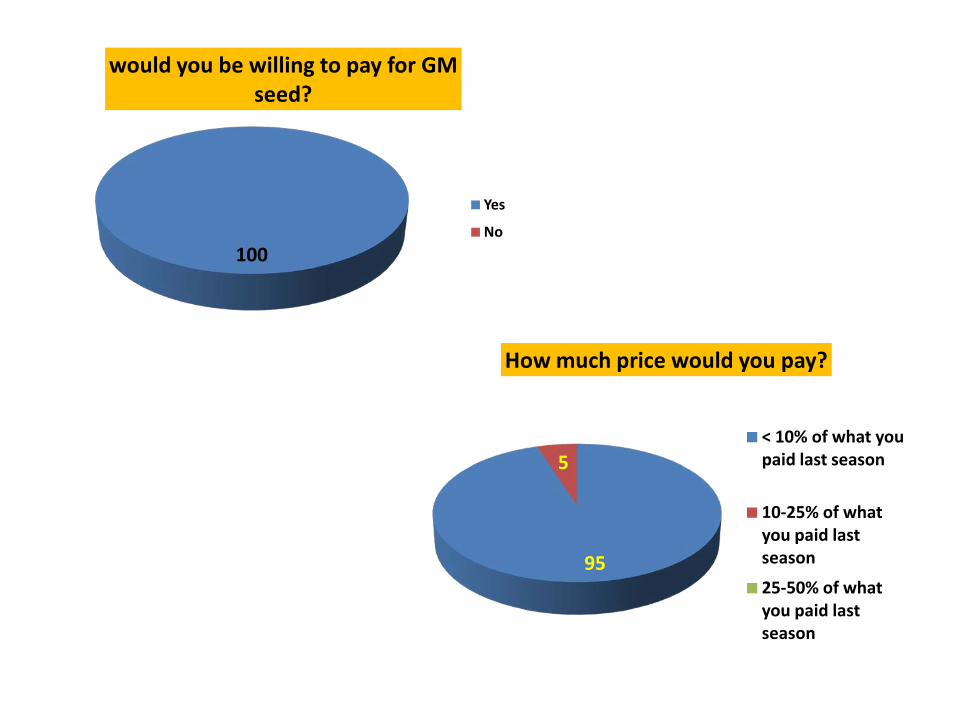
100
would you be willing to pay for GM seed?
Yes
No
95
5
How much price would you pay?
< 10% of what you paid last season
10-25% of what you paid last season
25-50% of what you paid last season
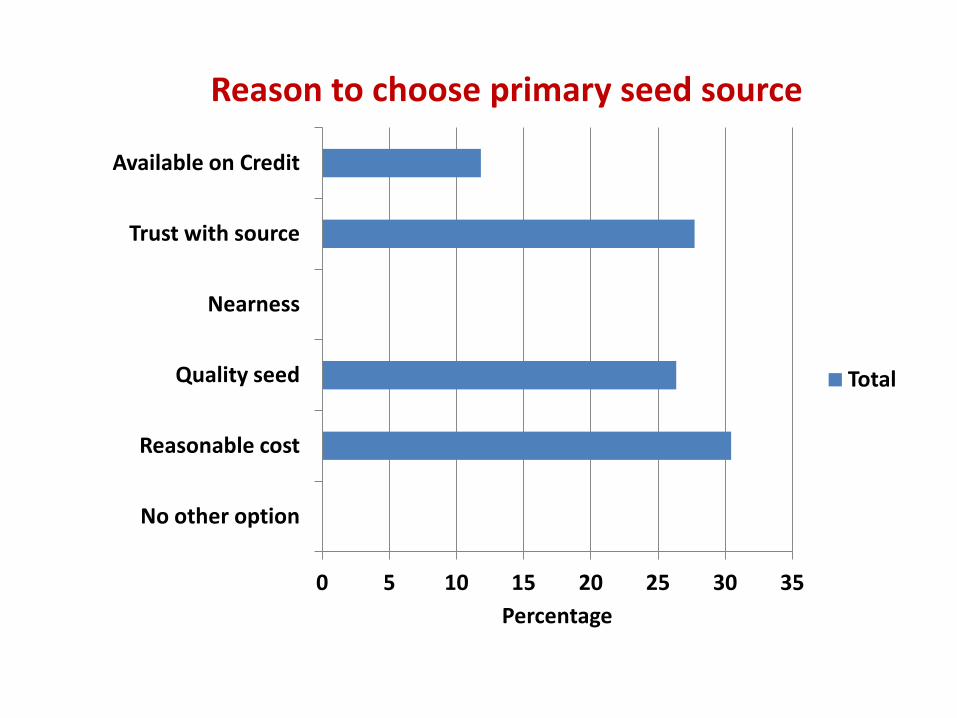
0 5 10 15 20 25 30 35
No other option
Reasonable cost
Quality seed
Nearness
Trust with source
Available on Credit
Percentage
Reason to choose primary seed source
Total

0 20 40 60 80 100 120
Received training on how to use pesticides or herbicides?
Use gloves, cover mouth and nose when applying?
Wear protective clothing when applying?
Wear boots when applying chemicals?
Wear spectacles?
Follow wind direction while spraying?
Eat while applying chemicals?
Drink water while applying chemicals?
Smoke while applying chemicals?
Wash hands/ bath after applying chemicals?
Percentage
Knowledge about handling and use of pesticides
No
Yes

65.45
34.54
Experience of any health problem during or after insecticide sprays
No
Yes
81.36
15.91 2.73
Ways of treatment when affected due to insecticide sprays
No treatment
Self
Doctor
79.09
17.27 3.6
Loss of work due sickness and treatment
No loss
Partial
Full day

87.3
12.7
Having received any advice/training in the past two seasons
NO
YES

0% 10% 20% 30% 40% 50% 60% 70% 80% 90%
100% Percentage
Information sources
Frequency of contact with information sources
Never
Sometimes
Often
Always

80
72.3
100
20
27.7
0
0 20 40 60 80 100 120
Do you seek information about market prices before you
plant?
Do you seek information about market preferences before you
plant?
Are you aware of any LMO crop grown in your area?
Percentage
N0
Yes

100
100
85
90.8
100
4.2
0
0
15
9.2
0
95.8
0 20 40 60 80 100 120
If yes, did GM cotton give higher yield than other hybrids?
If yes, did GM cultivation led to increase in your income or profit?
If yes, did GM cotton need higher inputs?
Will you adopt GM mustard or GM wheat?
Have you ever cultivated Bt cotton (GMO)?
Do you know about genetic modification of crops?
Percentage
No
Yes
Awareness among farmers
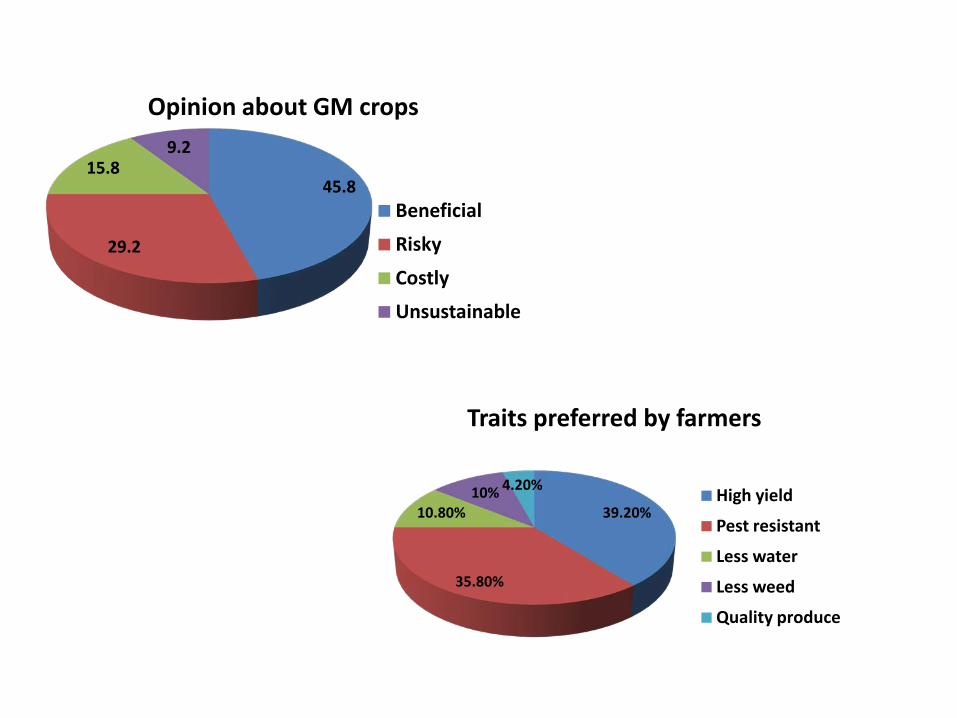
45.8
29.2
15.8 9.2
Opinion about GM crops
Beneficial
Risky
Costly
Unsustainable
39.20%
35.80%
10.80% 10% 4.20%
Traits preferred by farmers
High yield
Pest resistant
Less water
Less weed
Quality produce

0.00%
5.00%
10.00%
15.00%
20.00%
25.00%
30.00%
35.00%
40.00%
45.00%
50.00%
Yes No Donot know
Percentage
Will GM crops cause harm to livestock and human?
Livestock
Human
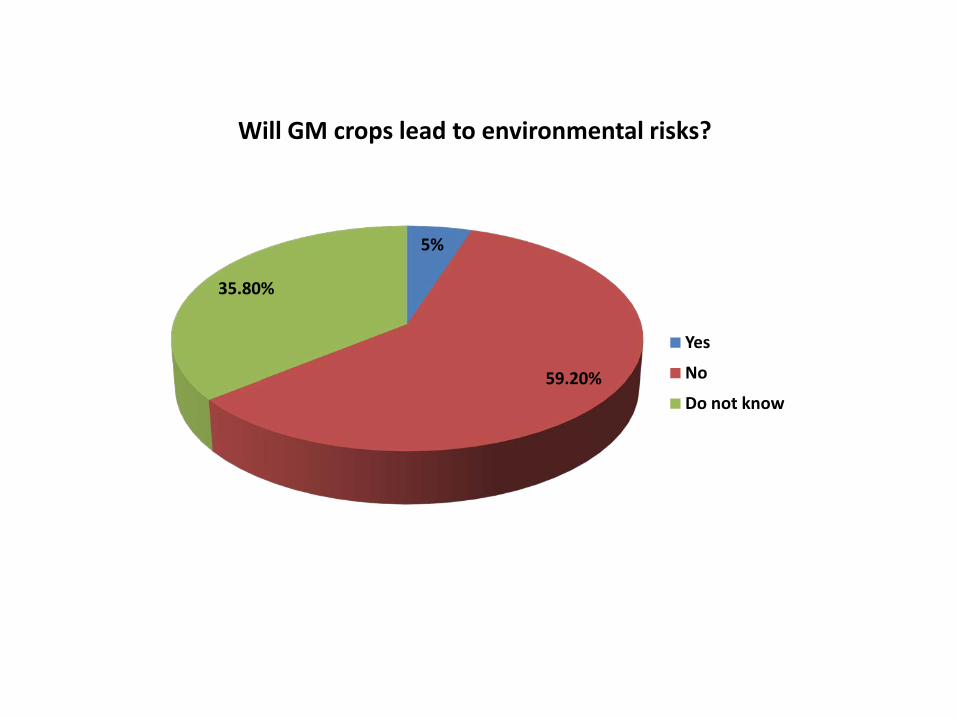
5%
59.20%
35.80%
Will GM crops lead to environmental risks?
Yes
No
Do not know
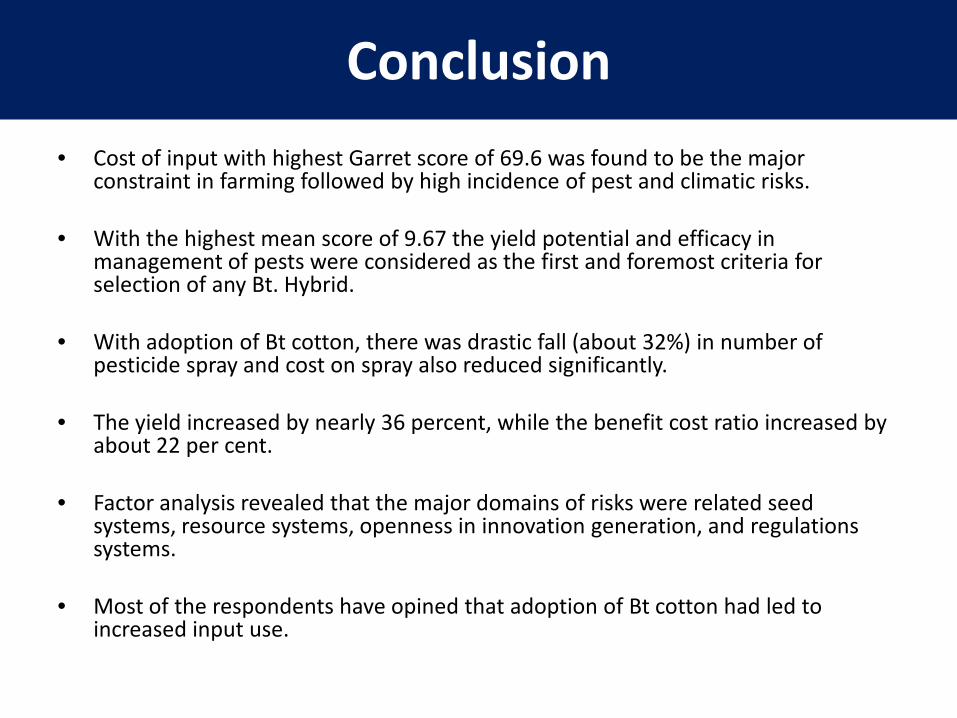
Conclusion • Cost of input with highest Garret score of 69.6 was found to be the major
constraint in farming followed by high incidence of pest and climatic risks. • With the highest mean score of 9.67 the yield potential and efficacy in
management of pests were considered as the first and foremost criteria for selection of any Bt. Hybrid.
• With adoption of Bt cotton, there was drastic fall (about 32%) in number of
pesticide spray and cost on spray also reduced significantly. • The yield increased by nearly 36 percent, while the benefit cost ratio increased by
about 22 per cent. • Factor analysis revealed that the major domains of risks were related seed
systems, resource systems, openness in innovation generation, and regulations systems.
• Most of the respondents have opined that adoption of Bt cotton had led to
increased input use.

Conclusion • Many of the respondents have pointed out higher yield and pest
resistance as major traits required. • Very few respondent have opined that GM crops are harmful to
human (12.5% in Punjab and 3% in Haryana) and animals (11.7% in Punjab and 18% in Haryana).
• A majority of the farmers purchased seeds every year and travelled
4 to 8 Km for seed procurement. • Seed sellers also influenced seed purchase decision of farmers. • Fellow farmers are the major source of information for farmers. • A majority of respondents of both states did not have knowledge
about genetic modification of the crop.

Suggestions for enhanced understanding about socio-economic considerations related to Living Modified Organisms
– Conduction of stakeholders’ workshops at block level
– Intensive extension or outreach programmes for enhanced public awareness
– Dialogue between scientists and social as well as media groups
– Publication and distribution of literature and videos, related to LMOs
– Involvement of farmers’ representatives/Panchayati raj Institutions in regulatory process
– Promotion of inter-disciplinary research and ex-ante studies on LMOs

THANK YOU