developing medicare competitive bidding: a study of
TRANSCRIPT
Developing Medicare Competitive Bidding A Study of Clinical Laboratories
Thomas] Hoerger PhD and Ann Meadow ScD
Competitive bidding to derive Medicare fees promises several advantages over administered fee systems The authors show how incentives for cost savings quality and access can be incorporated into bidding schemes and they report on a study of the clinical laboratory industry conducted in preparation for a bidding demonstration The laboratory industry is marked by varishyable concentration across geographic marshykets and among firms themselves by social and economic heterogeneity The authors conclude that these conditions can be accomshymodated by available bidding design options and by careful selection ofbidding markets
IN1RODUCOON
Since 1983 when Medicare adopted hosshypital prospective payment the program has moved from retrospective reimburseshyment to prospective fee schedules in the fee-for-service (FFS) sector Dissatisfaction with cost increases under retrospective payment led policymakers to adopt fee schedules for laboratory services and durable medical equipment in the midshy1980s and the Medicare physician fee schedule in 1992 The 1997 Balanced Budget Act (BBA 1997) further reinforced the movement away from cost-based payshyment by mandating prospective payment for hospital outpatient services skilled nursing facility days home health agency services and rehabilitation hospitals All of
Thomas j Hoerger is with the Center for Economics Research Research Triangle Institute Ann Meadow is with the Office of Strategic Planning Health Care Financing Administration The views expressed are those of the authors and do not neceamp sarily reflect those of the Research Triangle Institute or the Health Care Financing Administration
these recent and forthcoming systems are examples of administered fee-setting
The administered fee-setting systems appear to have moderated cost growth But administered prospective fees are not very flexible in the face of changing market conshyditions In the ideal-a perfectly competishytive market-optimal prices result from market participants myriad decisions in response to changes in preferences income technology input prices and other factors The essential problem for adminisshytrators in setting optimal prices is obtain~ ing adequate information about the direcshytion and magnitude of market forces-par~ ticularly production costs or the economic and technological forces driving them This problem is complicated by producers reluctance to reveal information helpful to the administrators (Hoerger Waters and Sloan 1991) Without detailed market information administered prices are unlikely to adequately reflect cost-decreasshying or ~increasing trends
Thus an administered fee schedule may quickly become outdated This is especialshyly true in industries marked by technologishycal innovation and flexible labor markets Adoption of cost-reducing technology may not translate into lower prices in a timely manner- or ever If prices are rigid and initially above cost increasingly inefficient producers may enter the market until costs rise to equal price whereas entry should normally lead to lower prices Nor can rel~
In principle no Medicare service category is immune from the problem of obtaining adequate and timely information to update administered fees It has been suggested for example that Medicare could benefit from using competitive bidding to revise physician payment rates (McCombs 1989)
HEALTII CARE FINANCING REVIEWFall 1997Volume 19 Num~r1 59
ative prices move freely in response to changes in costs This may create incenshytives to over- or undersupply particular sershyvices causing an inappropriate overall mix of services
These disadvantages of administered fee schedules warrant Medicares considerashytion of a more market-based approach to fee-setting Competitive bidding is one potential market-based approach It motishyvates producers to engage in direct market competition in exchange for increased volshyume The bidding itself can reveal the lowshyest price that producers are willing to accept-the essential summary of market forces needed by fee administrators
A particularly attractive feature of bidshyding is the dynamism and flexibility it can introduce Frequent bidding allows for timely incorporation in prices of either cost-reducing or cost-increasing trends thus assuring a competitive rate of return to capital This contrasts with the blunt tool of market-basket indexing often used in prospective payment systems In general competitive bidding obviates the need for administrative proceedings intended to adjudicate whether and how much costs are changing Under competitive bidding if fees are initially set too high new supplishyers will participate in subsequent competishytions and prices will fall Prices resulting from competitive bidding should reduce incentives to supply excessive services or the wrong mix of services
Medicare has long recognized these potential advantages of competitively derived pricing In the mid-1980s the Health Care Financing Administration (HCFA) began to plan a bidding demonshystration for laboratory services and durable medical equipment From the start however the initiative was highly controversial The supplier laboratory and medicine communities voiced fears that competitive bidding would cause unacceptshy
able quality losses As a result in 1987 Congress imposed a multiyear funding moratorium on the activities
HCFA resumed planning for the projects in 1995 By that time the climate seemed more favorable Competitive bidding was being successfully and widely used by prishyvate managed care organizations (MCOs) and others including government agencies to purchase laboratory and other health sershyvices at reduced fees Further the Clinton Administration and Congress included comshypetitive bidding provisions for Medicare in their respective 1995 budget proposals
The developmental work begun a decade earlier left a foundation on which to rebuild the projects (Mennemeyer et al 1987 Mennemeyer and Reardon 1989 Hoerger Waters and Sloan 1991 Hoerger and Waters 1993) The groundwork included analysis of options for the bidding scheme to promote incentives for cost savshyings and quality Options concerned such elements as the choice of services to put up for bidding the unit and scope of bidshyding pricing approaches and winner selection procedures The analysis showed how certain properties of the services in question such as unit cost might support a given option to promote cost or quality objectives Administrators choices might also consider values in the sociopolitical culture such as the freedom to choose ones provider An important general implishycation was that Medicare should probably avoid adopting the winner-take-all approach typical of many commercial and governmental bidding competitions
With the bidding principles basically established in late 1995 HCFA set out to translate them into a workable operational
Subsequently in 1997 the Balanced Budget Act explicitly manmiddot dated demonstrations of competitive bidding for Medicare Part B services excluding physician services The selection of se-rmiddot vices was left to the discretion of the Secretary of Health and Human Services Congress also legislated a demonstration of competitively priced rates for Medicare health maintenance organization (HMO) contracts
HEALTH CARE FINANCING REVIEWFall 1997Volume 19 Number 1 60
plan for laboratory services The implicashytions of Medicares theoretical options needed investigation in the context of the laboratory industry of the 1990s Thus it was necessary to explore the laboratory environment further The research issues addressed in this article however are generic to launching Medicare competi~ tive bidding for a range of services in the FFS sector These issues confront Medicare whether bidding is conducted experimentally or routinely as part of the Medicare program
The first research issue concerned the extent to which the industrys current organization can comfortably accommoshydate competitive bidding-a question sepashyrate from the conceptual one of the suitshyability of laboratory services per se As we framed it this issue concerned the indusshytrys potential for engaging in meaningful competition as well as topical questions of current business conditions We pursued this from several perspectives reviewing the laboratory industrys general organizashytion recent developments in antitrust regshyulation examples of relevant public- and private-sector payment arrangements and current financial status A second issue concerned the scope of bidding-that is deciding on a manageable group of proceshydures to put up for bidding one whose conshystituents do not seriously violate principles laid out in the developmental work Given the tests currently used in Medicare and their interrelationships could we find a cohesive parsimonious set for which comshypetitive prices could have a large impact on Medicares expenditures A third issue concerned the selection of market venues
A demonstration of competitive bidding for durable medical equipment was launched separately At this writing HCFA has made no final decisions on the location effective date and final design of the laboratory and durable medical equipment demonstrations Any future national implementation of competshyitive bidding if authorized will undoubtedly be informed by the demonstration experiences but may not necessarily use their same specific designs
for bidding Laboratory markets with the exception of the market for esoteric tests are local or regional Our findings from the inquiry into national industrial organizashytion suggest that not all areas would be equally well suited to host a successful competition Thus for an area that appeared promising from preliminary data we wanted to assess in detail the competishytive potential of the firms in the market We examined the markets size the number of potential bidders their role in the market their product mix their Medicare market shares and their market service areas within the broader geographic unit The information in toto would allow inferences on a local industrys potential for engaging in competition leading to lower prices withshyout adverse impact on service quality or access to care
In the following section of this article we review several key options for the bidding scheme and show why certain choices appear justifiable in the case of laboratory services These choices must take into account Medicares uniqueness as a payer Medicare is the single largest health care payer with extraordinary market power It is supposed to be an impartial government bureaucracy adhering to equity principles in dealing with providers as well as beneficiashyries It also embodies a social contract with the American people We explain why some options are harder for Medicare to ignore compared with other purchasers such as private managed care companies We also comment on the suitability of laboratory sershyvices per se for competitive bidding
In the next section we describe the data and methods we used to study industry conditions research the scope of bidding and perform the market analysis It is folshybull Esoteric tests are relatively uncommon non-standardized proshycedures that tend to be very dependent on interpretation skill making results more variable across laboratories than other classes of tests Examples include most cytogenetic tests (eg chromosome analysis) and tumor markers for breast cancer using polymerase chain reaction
HEALTII CARE FINANCING REVIEWFaD 1997Volumet9Numbrt 61
lowed by the research findings The final section discusses the implications of the research for implementing competitive bidding in the laboratory arena Only through the specific industry knowledge gained in the study is it possible to draw implications in view of Medicares unique needs and purposes
DECISIONS FOR CONDUCTING MEDICARE COMPETITIVE BIDDING
From a purchasers perspective key decisions in formulating an approach to competitive bidding concern the exclusivishyty of the outcome the selection of other incentives to motivate attractive bids and the unit and scope of bidding An additionshyal practical consideration is whether to exempt some suppliers from bidding
Exclusivity of the Outcome
Important bidder incentives stem from the purchasers decision about how many suppliers will remain after the competition is concluded Fundamentally the decision involves a tradeoff of Medicare fee reducshytions against quality and access gains Potentially the decision may have broader economic and sociopolitical implicationsshyimpacts that can threaten competitive bidshyding as a policy endeavor unless they are considered in the decisionmaking
The most restrictive outcome-a single supplier-offers the strongest incentive to bid low prices because the winning bidder can assume growth in market share and the firm may be able to realize economies of scaie An additional advantage for the buyer is the possible benefit from structurshying an exclusive relationship with the winshyner catering to the buyers unique needs Further administering the payment funcshytion is apt to be simplified with a single supshyplier potentially saving the government
resources Because of Medicares huge size-it accounts for about one-third of the market for many health services-a single supplier would need unusually large capacshyity Nevertheless for some services such an arrangement is conceivable With laboshyratory services for example several extremely large firms each may have the capacity individually to meet Medicare supshyply needs in many markets
A multiple-supplier outcome implies weaker incentives to bid low prices because market-share growth is not guarshyanteed Rather the suppliers would have to compete for market share after the conclushysion of the bidding As the number of supshypliers grows not only does the incentive for aggressive bids tend to weaken but also the range of acceptable price offers tends to expand at the high end causing increases in the competitively derived fees Administering payments also becomes more complicated with multiple suppliers
However competition for market share can result in quality enhancement beyond the minimum established for purposes of conducting the bidding (Hoerger and Waters 1993) If a single supplier is selectshyed this mechanism to ensure quality is unavailable The problem of quality assurshyance can be particularly serious if Medicare cannot easily establish a desired level of quality measure it and enforce it For example the quality of broad or comshyplex services such as office visits for physishycian services is difficult to characterize objectively A single winning supplier for such complex services is probably inapshypropriate because of the risk to quality In contrast with durable medical equipment and clinical laboratory services quality measurement appears feasible For examshyple measures of laboratory-test accuracy
In some schemes market share could be allocated to multiple suppliers but this arrangement is not advantageous for the buyer as the discussion makes clear
HEAL1H CARE FINANCING REVIEWFa111997Volumet9Numhert 62
are available and measures of service such as the timeliness of test results can be colshylected and verified
When the costs of quality monitoring are considered a multiple-supplier outcome might have a more favorable impact on administrative costs than a single winner This is because quality-monitoring costs with a single supplier might be high relashytive to prices With laboratory services for example unit prices are among the lowest paid by Medicare By obliging suppliers to compete over quality some monitoring expenditures can be saved Because of Medicares large size the savings are potentially significant
It can be argued that a multiple-supplier scheme is always preferable if only to ensure the more subjective aspects of quality (Mennemeyer et al 1987) Medicare may wish to depend on physishycians and beneficiaries to exercise their judgment over these aspects at the point of sale For example physicians someshytimes request informal consultations from laboratories about testing decisions The perceived competence and responsiveshyness of the laboratory personnel can vary among physicians The role of physician and beneficiary judgment means that Medicare has less to gain than a typical commercial buyer from an exclusive partshynership that is finely tailored to meeting the purchasers needs Moreover protectshying the discretion of physicians and beneshyficiaries to the greatest practical extent has value in and of itself Medicare is now seeking to broaden beneficiary choices among delivery systems as well as to preshyserve patients market decisionmaking within the confines of more restrictive but higher efficiency systems A single-winshyner outcome would tend to undermine these patient prerogatives
bull Routine tests currently cost Medicare about$10 each and very few exceed $25
Medicares decision on the number of suppliers should also take into account the industrys long-term viability As the largest single payer of health services Medicare is perceived to have market power capable of altering the fundamental structure of health industries To the extent that scale-related efficiencies mean lower bids competitive bidding payment policies might be perceived as favoring large well-financed producers to the detriment of small ones with fewer finanshycial resources More so than with other payers the long-term impact of a decision by Medicare to restrict the number of supshypliers could be to reinforce a pre-existing trend toward increasing concentration-a trend now evident in numerous indusshytries including laboratories (Pearlstein 1995 Hoerger et al 1997) Given the labshyoratory industrys relatively low cost of entry such an effect is likely to be shortshylived (Mennemeyer et al 1987) Nevertheless adopting multiple suppliers is conservative given possible concern that industries could be pushed further in the direction of concentration
Aside from such policy considerations sociopolitical realities also tend to favor a non-exclusive arrangement It is widely believed that government spending should benefit not only the populations served but also the producers of services A sharp reduction in suppliers under competitive bidding might be seen as politically and socially damaging
A multiple-supplier bidding outcome can be varied in accordance with the weight Medicare places on savings incentives In one variation Medicare can exclude high bidders from supplier status and rely on competition among those remaining-the winning bidders-to promote quality pubshylic acceptance and other values In another variation Medicare can maintain an open list of suppliers by admitting even high-
HEALTH CARE FINANCING REVlEWFall 1997Volume t9Number 1 63
bidding firms to the market Admitting this segment upholds another important value historically associated with Medicare freedom of choice Maintaining an open list of suppliers may also mitigate concerns about competitive biddings impact on industry structure
Obviously admitting high bidders threatens to nullify incentives to bid aggressively To restore these incentives at least in part Medicare must pay highshybidding firms prices below those paid the winning firms This approach can free up market share for the winners in two ways (Hoerger and Waters 1993) Providers whose costs exceed the final price will tend to leave the market thereby allowing winshyners to increase their volume and earn higher profits Providers left with lower margins will tend to reduce their marketshying expenditures again with advantageous results for winning suppliers in terms of higher profits and market share
Other Bidding Incentives
Assuming that in some instances Medicare competitive bidding arrangeshyments adopt multiple winners and allow high-bidding firms to continue in the marshyket Medicare can institute incentives for attractive bids through another mechashynism-the method of finding prices from the winning bids The method has signifishycance in terms of fostering an incentive to bid marginal cost Because the puepose of Medicare competitive bidding is to set market-based prices an incentive to bid marginal cost is preferred Hoerger and Waters (1993) show that mechanisms that weaken the relationship between the firms
To realize the benefits of market-based competition the new fee schedule would be derived from the prices offered by the winning bidders (Mennemeyer et al 1987) Fees fur the highshybidding finns could be pegged to the new fee schedule but with some discount Medicare may also make other distinctions in favor of the lowmiddotbidding firms such as labeling them preferred providers and listing them as such in informational materials
bid and the price received if the firm wins can increase firms incentives to bid fees close to their marginal cost These authors also show that if a laboratorys bid does not directly determine the price it receives the laboratorys optimal strategy will be to set its bid equal to marginal cost
Medicare can also build in incentives to counteract threats to access under competshyitive bidding-a particularly prominent issue for Medicare because of its disproshyportionately large rural and sick enrolled population and its social-contract origins Access concerns arise whenever price pressures impinge on suppliers as could occur under competitive bidding For example rural areas and inner cities often cost suppliers more to serve because of factors such as smaller scale of production and greater complexity of patient needs For laboratory services rural areas are often problematic Longer travel distances to collect specimens from physicians patients or drawing stations mean higher production costs Local rural providers may not all be price-competitive To proshyvide incentives for winners to serve these areas the volume and geographic covershyage offered by the laboratory can be explicitly introduced into the bid evaluashytion along with the bid prices (Hoerger Eggleston and Lindrooth 1997)
Unit and Scope of Bidding
Another decision facing buyers in conshyducting competitive bidding is the unit and scope of bidding With laboratory tests for example the unit may be a covered life or a procedure HCFA is now focusing on pricing for specific procedures with the intent of testing bidding in the FFS sector Regarding scope limiting bidding to one or a few specific procedures in a service bull Alternatively if the resulting bids are judged too high after incorporating rural costs these areas can be carved out for paymiddot ment under administratively based pricing
HEAL11I CARE FINANCING REVIEWFall 1997Volume 19 Numbec 1 64
category limits the savings potential although this effect may be mitigated by targeting high-cost high-profit proceshydures Expanding bidding to broader sets of services should produce more savings Also if the outputs within a category are jointly produced so that economies of scope are possible then excluding certain procedures within the category might be counterproductive It could distort pricing and production decisions for the carvedshyout procedures
Bidding for multiple procedures introshyduces additional complexity into the process Typically a single system of weights derived from expected service freshyquencies is used to average a bidders offered prices for comparison with other bids Bidding for multiple procedures may induce bidders to game the bidding-typishycally by bidding low prices for procedures that have a low expected demand for that bidder relative to the weights used for averaging This is called unbalanced bidshyding Although this strategy can result in higher profits for the bidder and improve its probability of winning it interferes with marginal-cost bidding Another conseshyquence may be a perception that some firms are unfairly advantaged simply because of the market niche they happen to occupy In this instance Medicare as an impartial government bureaucracy faces unusual pressures to correct the potential inequity-pressures that private buyers can more safely ignore
Unbalanced bidding is more likely to the extent that the provider can ensure its indishyvidualized distribution of procedures-pershyhaps by placing marketing emphasis on the more profitable procedure Not all health services are separately marketable in this way For example within certain broad categories of laboratory tests physishycians are probably unwilling to split their orders on behalf of a single patient among
multiple laboratories Thus one way to preshyvent unbalanced bidding would be to conshyduct separate bidding competitions for families of procedures with economies of scope in production andor marketing However a major drawback of separate competitions is reduced administrative simplicity especially in industries-such as clinical laboratories-that contain many firms offering a broad spectrum of sershyvices Separate competitions could lead to different groups of suppliers for the varishyous families of services Given the freshyquency of Medicare transactions in the market the result could be a confusing multiplicity of laboratory provider statuses and of fee schedules for market particishypants to use maintain and disseminate A second option is to evaluate bids for the presence of unbalanced bidding and use that information in selecting winners For example possible unbalanced bidding strategies may be identified by comparing the laboratorys composite bid calculated using the competitions weights to a comshyposite bid calculated using a set of weights based on actual historical data on the laboshyratorys distribution of tests
Exemptions from Bidding
One remaining practical issue is whether to require all providers to bid Normally only providers who bid are eligishyble to win or in an arrangement admitting high bidders are eligible to receive payshyment at all Intuitively this ensures more competition in bidding leading to lower prices These considerations should be weighed against the overa11 cost of conshyducting bidding If as with laboratory sershyvices the health care industry is heterogeshyneous with many different sizes of supplishyers then focusing bidding on the larger providers limits the total industrywide costs of preparing bids while diluting the
HEALTH CARE F1NANCING REVIEWFall 1997Volume 19 Number 1 65
cost impact This is because for larger providers the fixed cost of bidding can be spread among larger numbers of services At the same time competition at the level of larger providers can be strong and potenshytially result in low prices Because large proshyducers may be presumed to have lower marshyginal costs if they tie their bids to marginal costs then Medicares resulting prices will be pegged to the costs of an efficient indusshytry segment (Pauly et al 1991)
The extent to which smaller producers will find the resulting prices unprofitable causing market exit and straining access cannot be predicted in advance Some providers may decide to continue laborashytory services even if the services-viewed alone-become unprofitable9 Medicare can reduce access impacts of market exit either by setting conditions for winner participation that ensure supply to the market-for example by establishing mmtmum volume commitments to require of bidders-)r by giving additionshyal weight in bid evaluation to access-relatshyed components of the bid-such as the volume of services offered and the geoshygraphic coverage offered
An additional consideration for buyers is the administrative burden of evaluating a multitude of bids If the number of bids is limited this cost in time and resources is obviously lower For Medicare a national program operating in a large number of markets limiting the number of bids for cost-saving purposes alone may prove highly attractive if competitive bidding is adopted across those markets or some subshyset of them Finally to help address equity concerns that arise when exempting some providers from bidding (ie non-bidders that avoid bidding risks may be unfairly positioned for rapid growth) the buyer can
bull For example physicians who perceive a competitive advantage from conducting tests in their offices may decide to continue testing even if their laboratory operations-taken separatelyshybecome unprofitable
adopt a volume ceiling for those providers for the duration of the pricing period This may induce bidding from otherwise exempt providers who expect to grow
Suitability of Laboratory Services for Bidding
In this section we have touched on sevmiddot era considerations in favor of paying for Medicare laboratory services under a comshypetitive-bidding scheme First we noted that it is relatively easy to observe and conshytrol key quality attributes of numerous labshyoratory services Many common tests are highly automated and standardized Moreover the Clinical Laboratory Improvement Amendments of 1988 (CLIA) expanded the reach of national regulation Since passage of CLIA all laboratories hanshydling human test specimens must be eLlAshycertified (or CLIA-waived if testing is not complex) As a result generally accepted levels of analytic test quality are assumed to pre-exist among the providers in the marmiddot ket Given the current regulatory and techshynological environment which is unlikely to regress competitive bidding would not be expected to affect significantly this aspect of quality If it does then regulatory strucshytures in place should detect this quickly Moreover to the extent that some tests are more vulnerable to operator variation (eg Pap smears) these procedures can be excluded from bidding Other aspects of quality primarily pre-analytic (eg courier reliability) and post-analytic (eg reporting timeliness) would be relatively easy to specshyify incorporate in the bidder requirements and monitor Second regarding the vulnershyability of bidding to gaming we noted that laboratories generally are not in a good position to fragment their major product lines for marketing purposes
This selective approach however may have its limitations in terms of the unit and scope of bidding
HEALTH CARE FINANCING REVIEWFaR 1997Volu= 19 Number 1
Two additional factors favor selecting laboratory services for competitive bidshyding First the industrys organization and modes of operation indicate that entry is relatively easy As our data below suggest numerous entities of various types provide laboratory services and significant nummiddot hers of these are sizable Within certain limits functional barriers to firms expanshysion into new markets are mild In general skilled labor and capital requirements are not extremely demanding These characshyteristics suggest that bidding competitions will attract new contestants if the winners of previous competitions are being paid too much Second under FFS payment creamshyskimming of low-cost patients by providers is not a concern to the extent that creamshyskimming opportunities result from health-status differences with laboratory tests the patients health status seldom affects the cost of a laboratory procedure
A less favorable factor is that unless Medicare opts for highly exclusive bidshyding outcomes volume guarantees to reinforce incentives for low bids are not possible Short of exclusive-winner arrangements it seems unlikely that Medicare could do much to influence sershyvice allocation Ordinarily changes in benshyeficiary liability offer a possible mechamiddot nism through copayments and deductibles preferential coinsurance rates for winning bidders could be used to influence beneficiary choice But current payment law exempts beneficiaries from liability for laboratory services
The conservative multiple-winner bidshyding scheme we described implies certain conditions for successfully mounting Medicare competitive bidding First Medicare needs enough contestants to preshysent a realistic threat that given its intenshytion to name multiple winners some will be However the location ofpatients with respect to the laboratorys service network particularly rural location could be a basis for a different type of cream-skimming based on patient accessibility
disadvantaged by bidding too high Obviously a competition among a handful of firms would not meet this condition for even if price-competitive firms clearly emerged they might be too few to guaranshytee post-bidding competition on quality Second the industry should not be experimiddot encing serious financial difficulties given Medicares potentially significant impact on industrial organization
Third if the industry is very heterogeshyneous with firms highly variable in size or experience or some other economic or social characteristic Medicare might have difficulty conducting a competition permiddot ceived as equitable Laboratory services are provided by differing sizes and types of firms ranging from large multinational companies to small rural hospitals and solo physician officesY Whether Medicare should be concerned about laboratories perceptions of equity is arguable If current laboratory fees are too high efficiently managed laboratories are earning positive economic profits and inefficient laboratoshyries may be supplying Medicare Thus it is possible that the current fee schedule may be a source of some of the heterogeneity of firms in the laboratory industry Under such a scenario Medicare could improve economic efficiency by using competitive bidding to lower fees As a result ineffi dent laboratories might exit the market for Medicare services
Despite the theoretical argument for economic efficiency Medicare might still be concerned about laboratory percepshytions of equity for pragmatic reasons Some firms may claim that bidding imposshyes an unfair burden and seek relief from the obligation They may even demand exemption from the competitively derived prices Remaining firms might resent being singled out to take the risk of bidshy This aspect of laboratory industrial organization contrasts with durable medical equipment suppliers which are mostly small private for-profit businesses
HEAL1H CARE FINANCING REVIEWFall 1997Volume 19 Nurnber 1 67
ding Given this situation it may be pragshymatic for HCFA to seek either a leveling principle or a characteristic that fairly difshyferentiates firms able to bear the cost of bidding with little financial strain from firms that cannot If not the pressures on politically sensitive segments such as physician office laboratories (POls) and small rural hospitals might be perceived as an unacceptable cost of the fee rationaiizashytion promised by competitive bidding
It also follows that Medicare needs a fairly streamlined bidding process to remain receptive to contestants of varying degrees of sophistication and experience IfMedicare imposes many complicated conditions on bidders its attempt to realize the benefits of competitive bidding without seeming to stack the deck in favor of large well-financed providers will not be credible Our study of the laboratory industry reveaied the extent to which these conditions could be met
DATA AND RESEARCH METIIODS
We used primarily qualitative research methods to learn about the industrial orgashynization general competitive status prishyvate payment arrangements and financial status of the laboratory industry We used mainly quantitative analyses of Medicare claims to devise a feasible and appropriate scope of bidding and to study a potential laboratory-bidding market in detail
The methods for the qualitative research included fact-finding interviews with laboshyratory industry experts review of selected documents such as generai- and tradeshypress articles professional association journals company stockholder reports Securities and Exchange Commission filshyings and government studies tracking of government procurements for laboratory services in the Commerce Business Daily during a 6-month period and attendance at several industry meetings We conducted
interviews with approximately 25 laborashytory experts The interviews typically lasted about an hour and followed an unstructured format with extensive folshylowup questions Questions were varied between interviews to capitalize on the specific expertise and experience of the respondent For example respondents in areas with high managed care penetrashytion were asked how managed care has affected laboratories and hospital laborashytory managers were asked about hospital laboratory operations
We include in our qualitative findings descriptive data on the USlaboratory indusshytry from HCFNs 1996 Provider of Service (POS) Fde For laboratories records on the file are derived from CUA certification applishycations and records of surveys POSCLIA provider records yield essentially a census of the industrys facilities and allow tabulations of the industrys facility base and estimated operating volumes by location ownership and speciaities
The quantitative research on the scope of bidding relied primarily on summaries of Medicare claims from the Part B PhysicianSupplier Procedure Summary file for 1992-94 The summary record reports service volume and charges by year procedure code physiciansupplier specialty Medicare carrier (a proxy for geoshygraphic area) and several other administrashytive variables These data were used for examining the national distribution of allowed charges by laboratory test proceshydure to select tests for bidding For the most common tests we compared test-procedure rankings over time to anaiyze the stability of the test mix Further we compared test mixes among carrier areas using as our measure of test mix the fraction of allowed charges associated with tests proposed for bidding The results helped us assess genshyeralizability of the bidding project from a single geographic area in time
HEALTII CARE FINANCING REVIEWFall 1997Volnme 19 Nombee 1 68
The detailed analysis of a market area used 1994 Tennessee National Claims History claims from Medicare Part B physicians and suppliers and from hospital outpatient departments (HOPDs) We selected claims for analysis if the test refershyral originated with a Tennessee physician or in the case of hospital claims if the test was performed by a Tennessee hospilal For this analysis we created firm-level sumshymaries of Medicare laboratory services by linking claims with the POSCLIA file conshytaining firm names The finn-level sumshymaries were the building block for examinshying the industry composition market shares test mixes and other characterisshytics reported later A similar analysis was performed on North Carolina laboratory services claims with less extensive examishynation of HOPD services In Technical Note A we present further information on the definitions used for variable construcshytion and on the linking variables
FINDINGS
Qualitative Findings on Laboratory Industry Conditions
Industrial Organization
The POSCLIA file provided descriptive data illustrating the breadth and heteroshygeneity of the US laboratory industry There is a POSCLIA record for each laboshyratory facility Record counts from the file showed that there were 157793 laboratory facilities in 1996 classifiable into one of four major types hospital laboratories indepenshydent laboratories POLs and other laboratoshyries There were 8896 hospital-based aboshy
Tennessee was selected under the assumption that it is a viable candidate for siting the project pending a final decision later The residual category other includes laboratories in a wide variety of settings such as ambulatory surgery centers comshymunity clinics home health agencies health maintenance orgashynizations insurance companies health fairs and so on
ratories in the country accounting for only 56 percent of laboratory facilities but more than one-half of the testing volume (Figure 1) Data from a proprietary source on hosshypital and integrated health system laboratoshyries suggest that about 60 percent of hospishytal volume is inpatient testing (Portugal 1996) Data for 100 percent of claims from Tennessee and North Carolina suggest that slightly less than one-half of the remaining hospital activity is non-patient (ie for patients not seen by the hospital) as opposed to outpatient testing
A total of 5798 independent laboratory facilities were in operation about 37 pershycent of the tolal but the number of laborashytory firms is much smaller For example the 10 largest independent laboratory comshypanies account for 1540 CLIA-certified facilshyities The share of test volume for this sector is about one-quarter Independent laboratoshyries receive specimens on referral from physicians and transport the specimens to central facilities where large batches of tests can be processed efficiently
POLs were the most common type of laboratory numbering 89769 units and accounting for more than one-half of the facilities The average POL is relatively small POLs accounted for only 9 percent of the test volume with an average annual volume per unit of only 5800 tests POLs typically serve their physician-owners practice and are designed to provide quick and convenient test results Most POLs perform a limited menu of low- or moderate-complexity tests sending out specimens to hospital or independent laboratories for more complex proceshydures Laboratories in the category other accounted for one-third of the facilities and resemble POLs in their volshyume and test mix
Although the small scale of production in many POLs may suggest that unit costs are relatively high a recent study of 100
HEALTH CARE FINANCING REVJEWFall 1997Vcent1ume 19 Number 1 69
Figure 1 Comparison of US Laboratory Market Shares of Facilities and Tests 1996
60
bull Certified 50 Laboratories
0 Tests
40
~ bull (j 30 1 amp
~ 0
20
10
0 Hospital Independent Physician Office
Laboratory Industry Sector
SOURCE Health Care Financing Administra~on 1996 Provider of Service File
POLs found that profits were usually good and cost was surprisingly low-in many cases below that of small community hosshypitals and in some cases comparable to large regional laboratories (Root 1996 Root undated) Similarly some industry sources told us POL costs are not necesshysarily high despite common understandshying to the contrary
A significant recent development in laboshyratory industrial organization has been a move to form networks fostered largely by managed care incentives Networks posishytion local providers to compete for largeshyarea MCO contracts Definitive data on netshywork frequency do not exist but a recent survey suggests it is growing The survey of members of the Clinical Laboratory
Management Association (CLMA) drew responses mostly from hospital laboratory managers It found that 29 percent were involved in networking in 1995 and a conshysiderably higher percent believed they would be involved in such an arrangement in 1996 (Pomerantz and LoSciuto 1996)
Accompanying networking has been downsizing and facility consolidation drishyven by the need to meet buyer demands for lower cost services Some laboratory experts believe there is an excess of laboshyratory facilities and within them an excess of capacity Industry consultants advise their clients to streamline by such methods as decommissioning rarely used backup equipment joining purchasing cooperashytives introducing flexible staffing and
HEALTH CARE FiNANCING REVIEWFaU 1997Volume 19 Number 1 70
culling test menus of marginally useful tests One-half of the CLMA survey respondents engaged in downsizing in 1995 Typically consolidation involves a multilaboratory system rationalizing proshyduction by eliminating duplication centralshyizing batch testing to improve economies of scale and specializing facilities to serve quick-turnaround or other needs
Competitive Environment
Since 1990 there has been substantial ownership consolidation in the indepenshydent laboratory sector By 1996 large mergers and acquisitions left three nationshyal firms dominant with an estimated 57 percent of the independent laboratory market whereas a trade publication estishymated that the top eight firms accounted for 47 percent in 1989 (Southwick 1990) According to news reports reasons for the mergers include economies of scale cost savings from eliminating duplicated sershyvices in common areas expansion into new markets and acquisition of new techshynology National-firm size rankings derived from the POSCLIA file are fairly close to the rankings in trade reports (Hoerger et a 1997)
To examine the implications of these findings for market concentration on a subnational basis we analyzed State-level concentration in nine States from the POSCLIA file under the assumption that competitive bidding could be feasibly conshyducted in statewide markets By linking multiple facility records for a single firm firm-level volume estimates can be genershyated We used the volume data to estimate roughly the market shares of independent laboratories with at least 1 percent of the volume in a State In addition to studying
The dominant laboratories are SmithKline Beecham Laboratory Corporation of America and Quest Diagnostics forshymerly Corning Clinical Diagnostics until it was spun off from Corning
the extent of industry consolidation this analysis also served to assess the candishydacies of two States Tennessee and North Carolina as competitive bidding project sites
It is common for laboratory specimens to be transported across State lines for testshying Thus these results on State market shares are treated with caution because data based on facility location do not necshyessarily correspond to data based on a firms market service area16 A State-byshyState claims analysis would better define market shares based on actual service area and would isolate Medicare market shares specifically but such an effort is prohibishytively expensive
The results suggested that the indepenshydent sector can be quite concentrated in some States The shares of independent laboratory tests for the single dominant laboratories in Alabama Georgia Kentucky North Carolina and Virginia all exceeded 65 percent By comparison marshykets in Arkansas Missouri Mississippi and Tennessee appeared more competishytive The three largest national laboratory companies had a notable market share in each State At least one of the three largest firms had the highest or second-highest share in each State However regional independent laboratory companies had sizshyable market shares in Alabama Arkansas Mississippi Tennessee and Virginia When all sectors of the laboratory industry were considered the concentrations appeared much lower In Tennessee for example the market share of the leading independent laboratory equaled 296 pershycent of independent laboratory tests but only 66 percent of all tests in the State including inpatient tests In North Furthennore when considering volume across all segments ofthe laboratory industry the CLIA data do not permit isolation of the inpatient testing volumes within th~ hospital segment Thus estimates of market concentration from these data pertain to all testing not just the ambulatory testing in which we were interested
HEALTH CARE FINANCING REVIEWFall 1997Volume I9Numbecl 71
Carolina the market share of the largest independent laboratory was 907 percent of independent testing compared with 280 percent for all tests
These results help explain why despite the substantial merger activity and growshying concentration among independent labshyoratories antitrust regulators have not been concerned enough about possible anticompetitive effects to oppose the mergers The Department of Justices (DOJ) understanding of the industrys competitive status was revealed in a docu~ ment approving the formation of a California laboratory network in 1995 (Bingaman 1995) The DOJ recognized a pro-competitive potential for the network because it would raise the number of bidshyders qualified to compete for large-area contracts The DOJ letter also indicated that it views hospital laboratories and independent laboratories located within 30 minutes as competitors for stat tests (ie tests the results of which are needed as soon as possible) It sees hospitals and independent laboratories as serving sigshynificantly overlapping segments of the routine-testing market The market for esoteric tests is considered much broadshyer because laboratories face significant competition for esoteric tests from other laboratories in a State and nationwide As for POLs the DOJ does not consider them to be serious competitors to hospital and independent laboratories
Medicare laboratory competitive bidshyding is likely to involve the stat- and roushytine-testing markets Claims data from Tennessee and North Carolina suggest a potentially strong role for hospitals in comshypetitions within such markets In 1994 hosshypital laboratories allowed charges accountshyed for about one-third of the Part B tests Data from these States also suggest that independents Medicare share is between 34 and 44 percent (based on allowed
charges) and POLs account for most of the remainder
Private Payment Arrangements
Developments in the private sector sugshygest that in recent years managed care has helped pave the way for Medicare competshyitive bidding by familiarizing laboratories with competitive auctions by motivating them to understand their actual testing costs and by fostering efficiencies through downward pressure on fees and on capitatshyed rates Further reports of fee reductions attained under MCO competitive contractshying highlight the possibility that Medicares administered fees are in need of realignment
For their part at least some MCOs believe competitive bidding resulted in sigshynificantly lower laboratory payments-60 percent lower in one instance-than would have been obtainable without it Two intershyview respondents described to us two manshyaged care bidding competitions These competitions involved very large laboratoshyries competing by invitation to cover in one case part of Tennessees Medicaid population and in the other case the entire national HMO and preferred provider organization (PPO) enrollments of the firm These competitions resulted in an exclusive contract for a single winner to provide all needed tests In one competishytion bidding was for a capitated rate and in the other competition capitated rates were bid for HMO plans and fees were bid for PPO plans The contractual arrangements also call for utilization monitoring data to be supplied by the laboratory quality assurance provisions and other services such as training physician office staff in specimen preparation
The impact of managed care has been controversial from the perspective of the laboratories For examplelarge-area comshy
HEAL1H CARE FINANCING REVIEWFall1997Volume 19 Number 72
petitions highlight a serious perceived disadvantage for small- and medium-sized laboratories Although networks joint ventures and other such arrangements are possible solutions to this problem some laboratories appear unsure of how to operate in the zone between indepenshydence and affiliation partly for fear of antitrust violations
Industry Financial Status
At this writing the recent financial pershyformance of the large national laboratories has been poor The Big Three national laboratories recently posted losses or reduced margins A large California firm declared bankruptcy in 1996 The financial difficulties appear to be the result of the combined effects of declining fees includshying Medicare and Medicaid payments the after-effects of the mergers which were costly and incurred large debts and overly aggressive pricing in competing for M CO laboratory contracts Many observers believe the larger laboratories miscalculatshyed the benefits of aggressive bidding for MCO clients So-called pull-through busishyness-in which the laboratory in the course of servicing M CO physicians is able to generate testing volume from their non-MCO patients-apparently has not materialized perhaps because much of the typical physicians caseload may already be committed to using a laboratory chosen by the insurer or HMO Some industry observers predict that firms will attempt to adjust upward their capitated payment rates and fees as current contracts expire and are replaced with new ones
Scope of Bidding
An issue central to the conduct of comshypetitive bidding concerns the scope of bidshyding In studying which tests might be
appropriate for competitive bidding we conshysidered the criteria mentioned earlier These included parsimony test standardizashytion economies of scope substitution and test-list stability across time and space
For this analysis we used the PhysicianSupplier Procedure Summary file for 1992-94 The claims summaries exclude outpatient hospital laboratory services Hospital-test bills are not roushytinely summarized by HCFA However to partially validate the results we compared the Tennessee 1994 hospital test mix with the State and national physiciansupplier test mix17
Figure 2 illustrates the concentration of Medicare laboratory allowed charges among a relatively small number of proceshydure codes in 1994 The top 25 tests account for 63 percent of the charges the top 50 procedures for 78 percent the top 75 for 86 percent and the top 100 for 90 percent Table 1 shows the top 25laboratoshyry procedures ranked by allowed charges The most common test an automated mulshytichannel profile of 19 clinical chemistry tests accounted for $2544 million paid by Part B carriers or 86 percent of the allowed charges Volume rankings were similar to the charge rankings
The list of common laboratory proceshydures has remained fairly constant in recent years Nineteen bloodurine tests and automated hemograms ranked as the first and second most common procedures throughout the 1992-94 period Seven of the top 10 procedures in 1994 ranked in the top 11 procedures in each of the previous years Of the top 100 procedures in 1994 68 were in the top 100 in the 2 preceding r We generated the test mixes for Tennessee hospital laboratoshyries and all other Tennessee laboratories from the Tennessee claims The national test-mix data came from the Part B PhysicianSupplier Procedure Summary file The comparisons showed that the distribution of hospital laboratory procedures is similar to that for other Part B testing the correlation coefficient of the test procedure rankings for hospital versus other Part B testing in the State was 067 and for hospital versus national Part B testing was 065 (Joerger et al 1997)
HEALTH CARE FINANCING REVIEWFall 1997Volume 19 Num~r 1 73
Figure 2
Cumulative Percent of Total Laboratory Allowed Charges by Test Rank 1994
100
90
80
- 70
0 ~
if 60
oti
H 50
~ 40
30 i -
20 C
10
o 10 ro ~ 40 50 eo m eo eo a Rank for Top 100 Tests Based
on Allowed Charges
NOTES Excludes clinical pathology consultations anatomic pathology postmortem examinationscytogenetiC studies anti s-gieal pathology Includes venipuncture and trip fees
SOURCE Health Care Financing AdminiSifation 1994 PhysicianSUpplier Procedure Summary File
years and of the 32 that were not in the top 100 in preceding years 19 were ranked between 70 and 100 in 1994 where a relashytively small change in allowed charges was enough to move a procedure into or out of the top 100 list
The list of the top 100 high-expenditure tests includes some procedures in cytopathology (eg Pap smears) microbishyology (eg cultures) and other areas (eg cell marker study) that are not automated are more complex or require significant interpretation In keeping with concerns that under price competition such tests may be more vulnerable to quality losses than standardized ones these were
dropped from the recommended list of proshycedures for bidding The technologies used to perform the omitted tests freshyquently differ from those used for the included tests implying that the proposed list does not seriously violate the criterion of economies of scope We also made some additions to the list including several tests that ranked below the top 100 where they were potential substitutes for more comshymonly coded procedures18 In some cases these additions to the list also addressed Consultants to the project reviewed claims summaries to idenmiddot tify for inclusion other automated tests not requiring pretreatshyment that historically have been done in large numbers in indeshypendent laboratories andor POLs as well as automated tests even if requiring pretreatment that have been done in large numbers in POLs
HEAL1H CARE FINANCING REVIEWFall 1997Volume 19 Number 1 74
the scope-economies criterion In Technical Note B we present the resulting list which is comprised almost exclusively of tests from two laboratory disciplines clinical chemistry and hematology Nationally the proposed tests accounted for 83 percent of the carrier-paid aliowed charges and 88 percent of the test volume in 1994
To consider list stability geographicaily we compared the carrier jurisdictions (usushyally States) in terms of the fraction of allowed charges represented by the test procedures proposed for bidding (Hoerger et al 1997) This subset of procedures accounted for at least 70 percent of the allowed charges in every carrier jurisdicshytion and topped 80 percent in all but six jurisdictions The test volume for the subshyset ranged from 81 to 93 percent Thus the data showed relatively little variation in the listed tests share of charges In addition we reviewed the detailed procedure rankshyings for Tennessee and North Carolina19
The results showed that test procedures proposed for bidding accounted for 86 pershycent and 88 percent respectively of allowed laboratory charges and the rankshyings for individual procedures were fairly close to the national rankings
Detailed Analysis of a Local Market
To examine in detail the laboratory industry market in Tennessee we tabushylated the Tennessee allowed charges by laboratory industry sector and by indishyvidual laboratory firm We computed firms market shares from allowed charges We classified the laboratories with high allowed-charge totals by size class and sector and arrayed these indishyvidual laboratories by market share We examined the individual laboratories For these State-specific analyses the claims universes were all earlier-paid claims where the specimen was drawn within the boundaries of the State
ratio of testing proposed for bidding to total testing We also measured the numshyber of counties served by each laboratoshyry based on the county where the specishymen originated
The county location of the physician ordering testing services on behalf of the physicians patients served as the marker for the county origin of the specimen The specimens origin properly locates services in the locale where laboratories are servshying customers and competing Using specshyimen origin departs from Medicares orgashynization of laboratory administrative data as well as from the current payment basis both are organized according to laboratory location But if HCFA is to be able to idenshytify markets suitable for competitive bidshyding based on their competitive potential the laboratory location is irrelevant Claims from hospital laboratories howevshyer have no reliable identifier analogous to the ordering physician when the hospital is effectively functioning as a community labshyoratory taking physician referrals To meashysure hospital service area we used the patients county of residence on the claim as a proxy for specimen origin
Table 2 summarizes the allowed charges and market share for Tennessee laboratoshyries paid at least $100000 in Medicare Part B allowed charges in 1994 and Table 3 proshyvides detailed data on the top 25 Tennessee laboratories ranked by allowed charges In total we estimated that Medicare paid $666 million in 1994 for all Tennessee Part B specimen testing (exclusive of patholoshygy cytogenetic and postmortem proceshydures) of which $548 million or 82 pershycent was spent on the subset of tests proshyposed for bidding Medicare paid 118 laboshyratories $100000 or more for testing Tennessee specimens in 1994 Table 2 shows the sector composition and allowed charges for five charge-based size cateshygories of laboratories These 118 laborato-
HEALTil CARE FINANCING REVIEWFall 1997Volurne 19 Numbec 1 75
Table 1
Allowed Charges and Volume for Top 25 Medicare Laboratory Procedures Ranked by Allowed Charges 1994
Allowed Charges Volume
Rank HCPCS Procedure Name Dollar Amount Percent Number Percent
1 2 3 4 5 6 7 8 9 10 11 12 13 14 15 16 17 18 19 20 21 22 23 24 25
80019 85025 G0001 80092 84443 83718 85024 84153 80061 81000 85610 80162 83550 87086 82728 80016 83036 82947 83540 84436 85023 80018 80091 80007 82378
19 BloOOUrine Tests Automated Hemogram Drawing Blood fOf Specimen Thyroid Panel with Thyroid-Stimulating Hormone Assay Thyroid-Stimulating Hormone Blood Lipoprotein Assay Automated Hemogram Prostate Specific Antigen Lipid Panel Urinalysis Non-automated with Microscopy Prothrombin Time Assay for Digoxin Iron Binding Test Urine Culture Colony Count Assay Ferritin 13-16 BloodUrine Tests Glycated Hemoglobin Test Assat Quantitative Glucose Assay Iron Assay Total Thyroxine Automated Hemogram 17-18 BloodUrine Tests Thyroid Panel 7 Clinical Chemistry Tests Carcinoembryonic Antigen
$254418618 164955013 142936295 117118714 112964524 109648793 105442911 105377003 90906979 81250559 62422306 59457910 46626240 42075766 40075337 38495295 38471090 36663590 35747533 34712217 34622548 32643684 30796066 27307811 25825469
859 557 483 395 381 370 356 356 307 274 211 201 157 142 135 130 130 124 121 117 117 110 104 092 087
17644690 15775378 50605o64
2935232 5065988
10171411 9392220 4768813 4541265
18589319 11235609 3171203 4205972 3911629 2365578 2730400 2959179 6849241 4255416 3840047 3015999 2338780 17572pound7 2630911 1072170
564 5Q4
1618 094 162 325 300 152 145 594 359 101 134 125 076 087 095 219 136 123 096 075 056 084 034
NOTE HCPCS is Heahh Care Financing Administration Common Procedure Coding System
SOUACE Health Care FlaiCiog Administration 1994 PhysicianSupplier Procedure SummafY F~e
c ~
sect
~Qli~~~
Table 2
Laboratory Part B Allowed Charges Market Share and Number of Laboratories by AllowedmiddotCharges Category Tennessee 1994
Allowed Charges Market Share
Allowed-Charges Tests for Category of laboratories All Tests Bidding
Tests for All Tests Bidding IL
Number of Laboratories
HL POL Total
All laboratories Paid Percent at Least $100000 $47498650 $38694691 715 705 15 78 25 118
$10 million or more 18715324 15987140 281 291 4 1 0 5 $400000-999999 10817340 8179745 $300 000-399999 3871491 3013412
162 150 58 55
2 3
14 1 8 0
17
$200000-299999 4747985 3984930 $100000-199999 9346510 7529464
70 73 144 136
0 6
14 5 41 19
19
Paid at least $100000 in Medicare Part 6 allowed charges
NOTES IL is independent laboratory HL is hospital laboratory POLls physician office laboratory
SOURCE Medicare Part 6 Standard Analytical Files of carrier-paid and fiscal-intermediary-paid claims
Table 3
Market Shares and Coverage Areas for the 25 Top-Ranked Laboratories by Laboratory Tennessee 1994
Allowed Charges Market Share Number of Charges for Bid
Laboratory Type Counties Tests for Tests as Percent AJI Tests for Designation of lab Served All Tests Bidding of Total Charges Bidding
Percent Total All laboratories $66649181 $54817427 82 1000 1000 SUbtotal Top 25 Laboratories 30681979 25042060 82 460 457 All Laboratories Paid at Least $100000 47498650 38694691 81 715 705
Lab A I 88 6996255 5862388 84 105 107 LabS I 85 5936251 5257251 88 89 96 LabC I 54 2800564 2382649 85 42 43 LabD I 45 1748761 1508106 86 26 28 LabE H 26 1233493 956546 78 19 17 LabF H 51 961211 720285 73 15 13 labG H 36 980517 605446 62 15 11 LabH I 15 867649 683873 76 13 12 Labl H 78 853607 587686 69 13 11 LabJ H 29 791677 604511 76 12 11 LabK H 28 676242 571010 84 10 10 Labl I 13 651165 617812 95 10 11 LabM H 13 643604 487049 76 10 09 LabN H 14 542997 416202 77 08 08 LabO H 18 538008 442267 82 08 08 LabP H 20 494302 379819 77 07 07 LabQ POL 12 482683 448437 93 07 08 LabR H 48 479453 359433 75 07 07 LabS H 17 479407 312403 65 07 06 LabT H 26 478748 366269 77 07 07 LabU H 12 454274 265186 58 07 05 LabV H 29 421396 309857 74 06 06 LabW H 17 393280 276090 70 06 05 Lab X I 8 385718 317617 82 06 06 LabY H 23 370317 281468 76 06 05
Computed from allowecl charges Number of counties served for hospital laboratories based on proxy measure see text lor details
NOTES 1is Independent H is hOspital POL is physician offiCe laboratory
SOURCE Medicare Part B Slandard Analytical F~es of carrier-paid and liscal-interrnediary-paid claims
ries accounted for about 72 percent of the market for all Tennessee testing as well as 71 percent of the market for the tests proshyposed for bidding Hospital laboratories predominate 78 of the 118 laboratories were hospital-based Twenty-five of the labshyoratories were POLs and 15 were indepenshydent laboratories
The largest size category had charges totaling $187 million This category was composed of four independent laboratories and a single hospital laboratory network each with at least $1 million in allowed charges Charges for tests proposed for bidding were $160 million These five labshyoratories accounted for 28 percent of the Tennessee Part B testing market and a similar percent of the market for tests pnr posed for bidding In the remaining size categories hospital laboratories predomishynate The second-largest category laborashytories billing from $400000 to $999999 contains 17 laboratories having a total marshyket share of about 16 percent Only one POL is large enough to fall into this size range The next two categories were $300000-399999 and $200000-299999 With 11 and 19 laboratories respectively each category accounts for about 6-7 pershycent of the allowed charges The POIs tend to cluster in the smallest class $100000-199999
Table 3 provides a more detailed look at the largest laboratories The allowed charges and market shares of these laboshyratories varied markedly Although we do not identify the laboratories in Table 3 we note that the three largest national laborashytories accounted for the top three Part B Medicare market shares in Tennessee These three firms had a combined share of about 24 percent and their payments ranged from $28 million to $70 million Ten other laboratories had market shares of about 1 percent or higher Hospital and independent laboratories each accounted
for one-half of the top 10 laboratories in payments although independent laboratoshyries tended to cluster in the upper half of the top 10
Table 3 also shows the charges for tests proposed for bidding as a percent of total testing charges and the number of counshyties served by each laboratory The pershycent ranged between 58 percent (one hosshypital laboratory) and 95 percent (one indeshypendent laboratory) with four-fifths of the firms exceeding 70 percent Based on data from independent and physician office labshyoratories breadth of service area roughly paralleled allowed charges The two largest laboratories provided nearly statewide coverage with one serving 88 of Tennessees 95 counties and the other serving 85 The next two laboratories served about one-half of the counties After that only two other laboratories-one POL and one independent-served at least oneshythird of the counties in the State (data not showo) The specimen-origin proxy data suggest that at least three hospitals achieved coverage comparable to some of the largest independent laboratories as measured by the number of counties served Several other hospitals appear to have served at least one-quarter of the counties However no hospitals apparently provide statewide coverage
We associated each county with a count of independent hospital and POIs serving it in 1994 The results suggested that the number of such laboratories serving a county and the share of county payments due to independent laboratories varied widely Unsurprisingly the number of providers was closely related to allowed charges Rural counties-which account for about two-thirds of Tennessee counshyties-generally had low allowed charges and were served by fewer laboratories of all types than urban counties Fifteen counshyties were served by only one independent
HEALTil CARE FINANCING REVIEWFall 1997Volume 19 Number 1 79
laboratory and of these five were served by only one POL Thirteen of the 15 counshyties were rural Almost all counties had at least one hospital laboratory physically present and hospitals appeared to have large market shares in many rural counmiddot ties The data also suggest that rural beneshyficiaries often have laboratory tests drawn in urban counties even when laboratory services are available in their own counshyties This result is consistent with findings for other health services (Bronstein and Morrisey 1990)
DISCUSSION
In this article we have described clinical laboratory industrial organization and the industrys current competitive and finanshycial status delineated an appropriate scope for laboratory competitive bidding and portrayed a local Medicare laboratory marshyket For most areas of inquiry no single source of information can provide a precise answer Some of the available data were impressionistic gathered from industry experts Thus we relied on multiple sources and we qualified our conclusions in the text as necessary
The qualitative findings suggested that notwithstanding recent indications of increased concentration in the indepenshydent sector the industry remains competishytive Hospital laboratories have a greater market share than we initially expected and may be generally viewed as capable of providing price competition leading to lower Medicare fees Large POLs may occasionally enlarge the pool of presumpshytive bidders Moreover firms need not necshyessarily feel constrained by concerns about antitrust violations Extrapolating the DO] antitrust framework to a Medicare competshyitive bidding scenario it seems that in many areas there is an opportunity for labshyoratories especially small- and medium-
size ones to affiliate to bid and deliver Medicare tests without adversely affecting the longer term price-competitiveness of the local market This may mean opportushynities for firms to enhance their attractiveshyness as Medicare bidders on non-price dimensions such as rural coverage
Our POSCLA file analysis of indepenshydent laboratory concentration suggested that not all local environments would be equally suited for mounting bidding pilots or policies In our study we found that Tennessees laboratory services market appears to be among the more competitive ones in its region In contrast another State market North Carolina was more dominated by independent laboratories and exhibited more concentration in the independent laboratory sector
The recent financial difficulties of the largest national laboratories and the evishydence of significant organizational restrucshyturing do not in our view preclude testing Medicare competitive bidding for laboratoshyries Some industry participants think these developments are evidence that the industry structure will change from one dominated by national behemoths to one in which regional firms and networks of hosshypital laboratories or others hold sway over the routine-testing market in more localshyized areas If this is so then the routineshytesting market may offer continuing opporshytunities for purchasers including Medicare to use market rivalries to obtain lower prices and better service Similarly to the extent that trends to consolidate and downsize have lowered laboratories proshyduction costs these trends may be posishytioning many providers favorably for the advent of Medicare competitive bidding It is possible however that the financial diffishyculties associated too with an overall tightshyening of payment policies by Medicare and other payers may presage limited potential for additional Medicare savings Even so
HEALTH CARE FINANCING REVIEWFa111997Volume wNumber 1 80
we believe Medicare may well benefit from a reordering of fees if not a general price reduction It should also be noted that most other sectors of the health care sysshytem have been undergoing major restrucshyturing but this has not dissuaded private and public insurers from seeking additionshyal payment reform
Our study of test procedures to put up for bidding found a highly skewed distribshyution of allowed charges by test This implies that some of the complexity of bidshyding for the full spectrum of nearly 900 difshyferent laboratory procedures can be reduced by limiting the scope to the most common tests For Medicare this parsimoshyny seems attractive Unlike the two largeshyarea invited managed care competitions that covered all tests Medicare may find it prudent to have as open a competition as possible consistent with overall cost effishyciency for reasons of quality and public acceptance discussed earlier This is facilishytated by a simpler bidding procedure Streamlining the test list will have little effect on potential cost savings because the bulk of laboratory allowed charges will still be covered
The State comparisons of test mix as well as the comparison of the national test ranking against rankings for Tennessee and North Carolina suggested that essenshytially the same set of tests could be used perhaps with slight State-specific modificashytion no matter where the laboratory bidshyding is conducted If Medicare were to use several competitions for benchmarking a programwide fee schedule both the timeshyand space-related stability of the test list offer some evidence that the bidding results are generalizable
Our findings from the claims-based study of Tennessee laboratory firms illusshytrate that at least at the statewide level it is possible to have a sizable group of providers from the three major sectors of
the industry as apparently viable contesshytants for Medicare competitive bidding The very largest laboratories are indepenshydent laboratories but hospital laboratoshyries are more common in the top 25 and among the entire list of laboratories paid $100000 or more It appears that HCFA can expect to obtain bids from reasonable numbers of both hospital and independent laboratories-laboratories that account for a substantial share of all Part B specishymen testing-if it requires the largest labshyoratories to bid and if it is willing to evalushyate at least 20 bids The few POLs that rival hospital and independent laboratoshyries in charges can be included as bidders to broaden laboratory representation and generate market information from the POL sector In contrast to the Tennessee results the data from North Carolina indishycate that markets in some States may be fairly concentrated at least in the indeshypendent laboratory sector Thus the results from the two State studies undershyline the importance of carefully selecting sites for bidding competitions
The results of the State studies may also mean that where laboratory market strucshytures resemble Tennessees Medicare for the most part can sidestep the politically sensitive question of POL participation in the bidding With few exceptions the POLs in Tennessee rank among the small laboratories for whom we assume bidding costs are not justifiable This finding may be generalizable to other areas of the United States As for the impact of competshyitively derived prices on POLs that remains to be seen Although the limited data available on POL costs suggests many POLs are profitable expert opinion on the likely impact of competitive pricing is mixed Some experts told us POLs would not necessarily be disadvantaged by pricshying outcomes of Medicare competitive bidshyding but others strongly disagreed
HEALTII CARE FINANCING REVIEWFall 1997Vltgtlume I9Numberl 81
Another implication of the Tennessee study is that requiring laboratories to proshyvide statewide or large-regional coverage is probably not a desirable objective in all potential Medicare bidding arrangements notwithstanding the examples of large-area contracts in the private sector Very few labshyoratories approached statewide coverage in Tennessee If such large-area coverage were required most laboratories would probably have to form alliances to particishypate Their general uncertainty about the antitrust implications may dampen this response and Medicare may wish to avoid requirements with strong structural implishycations Moreover with multiple winners there is little reason to require any single laboratory to provide statewide coverage as long as the winners collectively provide it
The Balanced Budget Act calls for testshying competitive bidding in metropolitan statistical areas (MSAs) or sub-MSA areas rather than statewide areas Mounting the demonstration in MSAs would ease potenshytial concerns about access arising from the low number of laboratories serving some rural counties However future planners of broader competitions should anticipate possible difficulties in finding price-comshypetitive firms to serve some rural areas
In conclusion characteristics of laboratoshyry services per se augur well for deriving market-based prices within the Medicare program The scope of bidding can be narshyrowed to suit Medicares needs while capshyturing the great bulk of laboratory expendishytures Private sector arrangements have laid some groundwork for Medicare to adopt its own brand of competition Our research also revealed conditions in todays laboratoshyry industry that can complicate Medicares effort to add competitive bidding to its repertoire of payment approaches The complicating conditions include the variable industry concentration across geographic markets social and economic heterogeneity
among the firms themselves heightened sensitivity to antitrust issues and indicashytions of uneven financial health across the industry As with other health care services the problems posed by laboratory operashytions in rural areas highlight the issue of the policys impact on access to care Biddingshyscheme design options are available to address various conditions such as those relating to firm heterogeneity and beneficiashyry access Careful selection of bidding marshykets can further enhance Medicares chances of achieving lower priced highshyquality and accessible services through market competition
ACKNOWLEDGMENTS
The authors wish to thank Philip Cotterill for editorial guidance and Teresa DeCaro Jay Bae and two anonymous refshyerees for helpful comments on earlier drafts of this article We also acknowledge Joyce Eng for explaining certain technical aspects of clinical laboratory science and Richard Undrooth and Jennifer Eggleston for data processing assistance
TECHNICAL NOTE A
The following definitions were used in constructing variables for the Tennessee claims analysis
Specimen-origin identifiers For carriershypaid claims we used the claim ordering physician unique physician identification number (UPJN) to determine the specishymens State of origin We obtained lists of UPIN s for Tennessee and North Carolina Medicare physicians from HCFAs UPIN Registry file The carrier code on the UPIN record was sufficient to identify all physicians practicing in each of these two States We searched the 1994 National Claims History (NCH) Standard
HEALTil CARE FINANCING REVIEWFall 1997Volume 19 Number 1 82
Analytical File (SAF) of clinical laboratory services to collect all claims bearing these UPNs in the ordering-physician field For fiscal-intermediary-paid claims we searched the 1994 NCH Outpatient SAF for all outpatient laboratory services from institutional providers in Tennessee and North Carolina The State code embedshyded in the provider number was used as the State identifier
County identifiers To approximate the county of origin for a test specimen the UPIN records business ZIP Code was used on carrier-processed claims The ZIP Code was mapped to a county code For hospital services the hospitals county location from the Provider of Service file Oinked to the claim by the provider numshyber) was used to indicate the specimens origin for outpatient hospital laboratory claims only There is no ordering physishycian on hospital laboratory claims making the county of origin unavailable for hospishytal non-patients (ie patients whose specishymens are sent to the hospital from extershynal sources) Consequently for claims of hospital non-patients we used the benefishyciary county of residence to proxy the specimen origin
Laboratory firm identifiers We linked all CLIA numbers of a given laboratory firm by manually matching the names on the CLIA Provider of Service File CLIA numshybers on claims were then grouped to idenshytify all of a laboratory firms claims
Industry sector identifiers Laboratory claims were aggregated by laboratory industry sector (independent hospital and POLs combined with other) as well as by laboratory firm The claim specialty code was used to identify the sector for carriershypaid claims only For fiscal-intermediaryshypaid claims the sector was assumed to be hospitals in fact these claims are overshywhelmingly from hospitals although other institutional claims are represented
Non-patient claim determination A laboshyratory service was assumed to be pershyformed for a hospital non-patient if there were no service types other than laboratoshyry on the claim (This method was inforshymally validated from data obtained directly from the fiscal intermediary)
Procedure identifiers Laboratory proceshydures were identified using the HCFA Common Procedure Coding System code
HEAL111 CARE FINANCING REVIEWFall 1997Volume 19 Numhltr 1 83
Technical Note B
Preliminary List of Clinical Laboratory Tests Proposed for Bidding Listed by Procedure Code
HCPCS Procedure Code Description
800 19-G0058 20 Clinical Chemistry Tests 800 19-G0059 21 Clinical Chemistry Tests 800 19-G0060 22 Clinical Chemistry Tests G0001 Drawing Blood for Specimen P9604 One-Way Allow Prorated Trip P9605 Routine Venipuncture 80002 1-2 Clinical Chemistry Tests 80003 3 Clinical Chemistry Tests 80004 4 Clinical Chemistry Tests 80005 5 Clinical Chemistry Tests 80006 6 Clinical Chemistry Tests 80007 7 Clinical Chemistry Tests 80008 8 Clinical Chemistry Tests 80009 9 Clinical Chemistry Tests 80010 10 Clinical Chemistry Tests 80012 12 Clinical Chemistry Tests 80016 13-16 BloodUrine Tests 80018 17-18 BloodUrine Tests 80019 19 BloodUrine Tests 80050 General Health Panel 80058 Hepatic Function Panel 80061 Lipid Panel 80091 Thyroid Panel 80092 Thyroid Panel with Thyroid-Stimulating Hormone 80162 Assay for Digoxin 80185 Assay for Phenytoin 80198 Assay for Theophylline 81000 Urinalysis Nonautomated with Microscopy 81002 Urinalysis Nonautomated Without Microscopy 81003 Urinalysis Automated Without Microscopy 81005 Urinalysis 81015 Microscopic Exam of Urine 82150 Assay of Amylase 82172 Apollpoprotein 82250 Assay Bilirubin 82270 Test Feces for Blood 82310 Assay Calcium 82330 Assay Calcium-Ionized 82378 Carcinoembryonic Antigen 82465 Assay Serum Cholesterol 82540 Assay Creatine 82550 Assay CK (Creatine Phosphokinase) 82565 Assay Creatinine 82570 Creatinine Other Source 82607 Vitamin B-12 82728 Assay Ferritin 82746 Blood Folic Acid Serum 82784 Assay Gammaglobulin lgM 82947 Assay Quantitative Glucose 82946 Reagent StripBlood Glucose 82962 Glucose Blood Test 82977 Glutamyltransferase Gamma 82985 Glycated Protein 63036 Glycated Hemoglobin Test 83520 Immunoassay RIA (radioimmunoassay) 83540 Assay Iron 83550 Iron Binding Test 63615 Lactic Dehydrogenase 63690 Assay Lipase 83718 Blood Lipoprotein Assay (High-Density lipoprotein) 83721 Blood lipoprotein Assay (Low-Density Lipoprotein) 83735 Assay Magnesium 83970 Assay of Parathormone 84066 Assay Acid Phosphatase 84075 Assay Alkaline Phosphatase 84100 Assay Phosphorus
84 HEALTH CARE FINANCING REVIEWFall 1997Volume 19 Number I
Technical Note B-Continued
Preliminary List of Clinical Laboratory Tests Proposed for Bidding Listed by Procedure Code
HCPCS Procedure Code Description
84132 84153 84155 84165 64295 84436 84439 84443 84450 84460 84466 84478 84479 84520 84550 85007 85013 85014 85018 85021 85022 85023 85024 85025 85027 85029 85030 85031 85044 85048 85610 85651 85730 86255 86287 86291 86316 86430 86592
Assay Serum Potassium Prostate Specific Antigen Assay Protein Assay Serum Proteins Assay Serum Sodium Assay Total Thyroxine Assay Free Thyroxine Assay Thyroid-Stimulating Hormone Transferase Aspartate Amino Transferase Alanine Amino Transferrin Assay Triglycerides Assay Triiodothyronine (T-3) Assay Urea Nitrogen Assay Blood Uric Acid Differential White Blood Cell Count Hematocrit-Spun Hematocrit-Other than Spun Hemoglobin Automated Hemogram Automated Hemogram Automated Hemogram Automated Hemogram Automated Hemogram Automated Hemogram Automated Hemogram Automated Hemogram Manual Hemogram Complete Blood Count Reticulocyte Count White Blood Cell (WBC) Count Prothrombin Time Red Blood Cell Sedimentation Rate Thromboplastin Time Partial Fluorescent Antibody Screen Hepatitis B Surface Antigen (HBsAg) Hepatitis B Surface Antibody (HBsAb) Immunoassay Tumor Antigen Rheumatoid Factor Test Blood Serology Qualitative
HCPCS is HCFA Common Procedure Coding System
HEALTH CARE FINANCING REVIEWFall 1997Volume 19 Number 1 85
REFERENCES
Bingaman AK Preferred Laboratory Access Network Department of Justice Business Review Letter Washington DC December 7 1995
Bronstein ]M and Morrisey M Determinants of Rural Travel Distance for Obstetrics Care Medical Care 28(9)853-65 September 1990
Hoerger TJ Eggleston ) Lindrooth RC and Basker E Background Report on the Clinical Laboratory Industry Final Report Research Triangle Park NC Research Triangle Institute june 1997 Hoerger T] Eggleston ] and Lindrooth RC Draft Demonstration Plan Report Research Triangle Park NC Research Triangle Institute July 1997
Hoerger T and Waters TM Competitive Bidding for Medicare Services Medical Care 31879-897 1993
Hoerger T] Waters TM and Sloan RA The Use of Market Force Dynamics to Set Medicare Fee Schedules Report prepared under HCFA Contract Number HCFA 99-C-991683-03 to Project Hope September 1991
McCombs JS A Competitive Bidding Approach to Physician Payment Health Affairs 8(1)50-64 Spring 1989
Mennemeyer ST Reardon LB Daviduba D et a Demonstration and Evaluation of Competitive Bidding as a Method of Purchasing Clinical Laboratory Services Demonstration Design Report Report prepared under HCFA Contract Number HCFA 500-85-0052 Cambridge MA Abt Associates Inc February 1987
Mennemeyer ST and Reardon LB Demonstration and Evaluation of Competitive Bidding as a Method of Purchasing Clinical Laboratory Services Common Documents Report prepared under HCFA Contract Number HCFA 500-85-0052 Cambridge MA Abt Associates Inc November 1989
Mennemeyer ST Competitive Bidding for Medicare Outpatient Laboratory Services In Sheffler RM and Rossiter LF eds Advances in Health Economics and Health Services Research Risk-based Payments Under Public Programs Greenwich CT JHI Press Inc 1989
Pauly MV Mennemeyer ST Eisenberg JM and Reardon LB Assessment of the Effects of Reimbursement Policy on the Utilization of Clinical Laboratory Testing and the Propensity of Physicians to Perform In-Office Testing Report prepared under Contract Number HHS-100-89-0017 to the Department of Health and Human Services Office of Health Policy December 31 1991
Pearlstein S Big Retailers Rewrite Rules of Competition Washington PostA1 November 13 1995
Pomerantz P and LoSciuto L Results of the Clinical Laboratory Management Associations Industry Trends Survey Clinical Laboratory Management Review 10(6)597-605 November December 1996
Portugal B Planning Future Hospital Laboratory Services Using Benchmarks to Evaluate Laboratory Operational and Organizational Strategies American Hospital Association Hospital Technology Series 15(5) November 1996
Root C Cost Effective Clinical Testing The Place of Physicians Office Laboratories in a Cost Conscious Health Care Environment Doctors Shopper 6-7 1996
Root C Cost Versus Benefits of Point-of-Care Laboratory Testing in the PhysicianClinic Office An Economic Study of 100 Physician Laboratories Manuscript undated
Southwick K HCFA Regs Expected to Squeeze Out Small labs Health Week September 24 1990
Reprint Requests Ann Meadow ScD Office of Strategic Planning Health Care Financing Administration 7500 Security Boulevard Q-16-26 Baltimore Maryland 21244-1850
HEAL1ll CARE FINANCING REVIEWFall 1997Volume 19 Number I
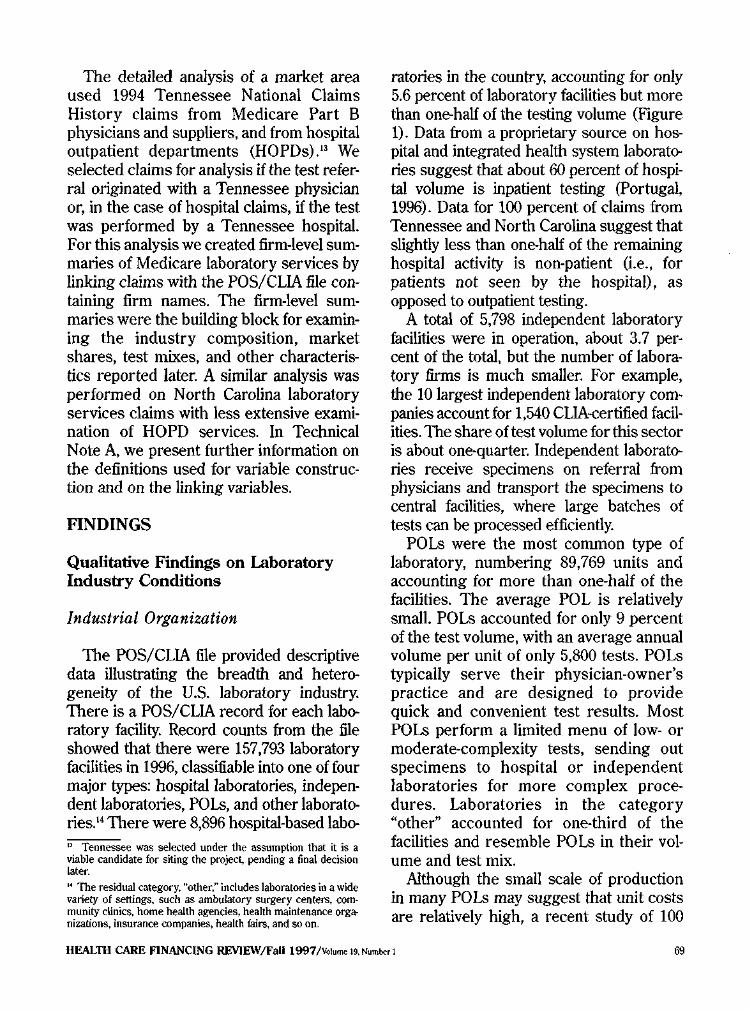
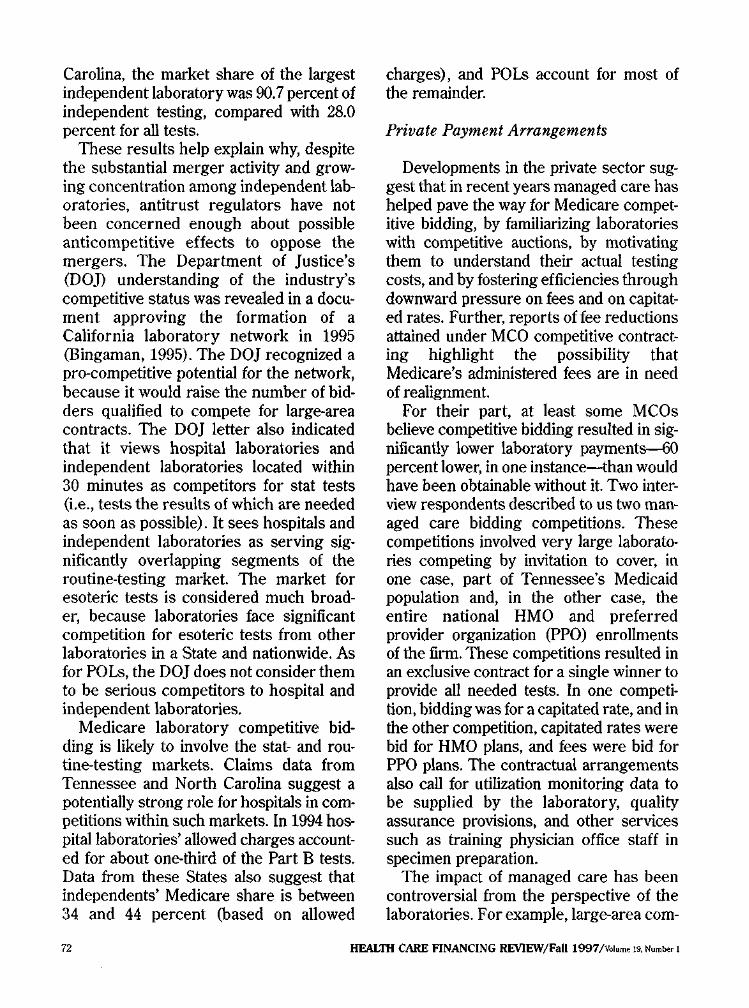
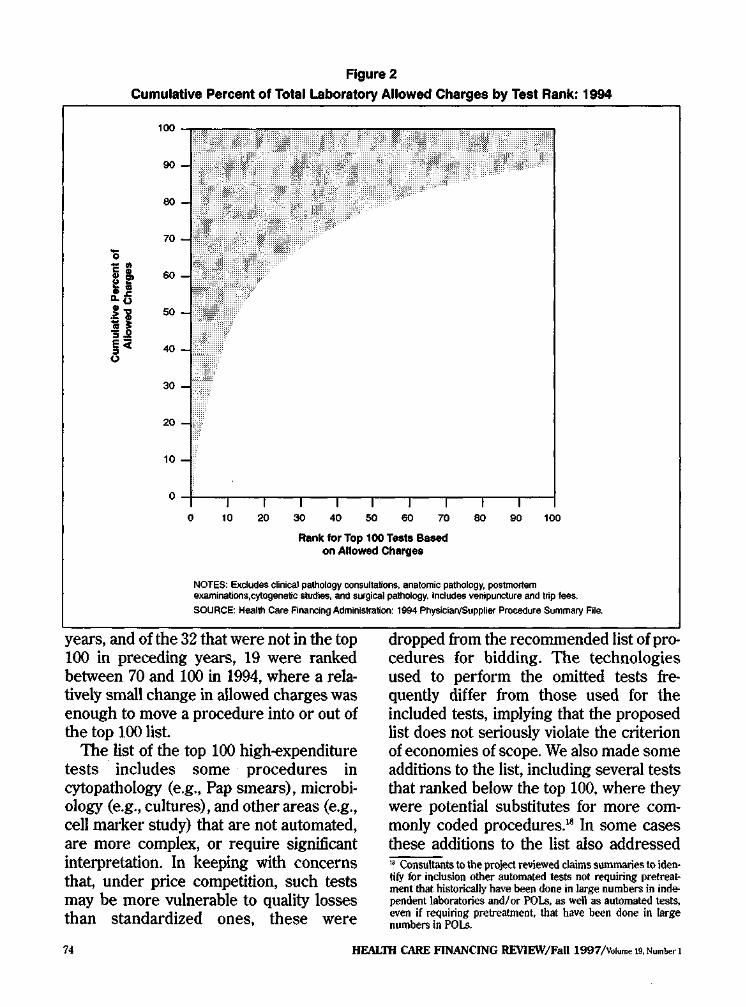
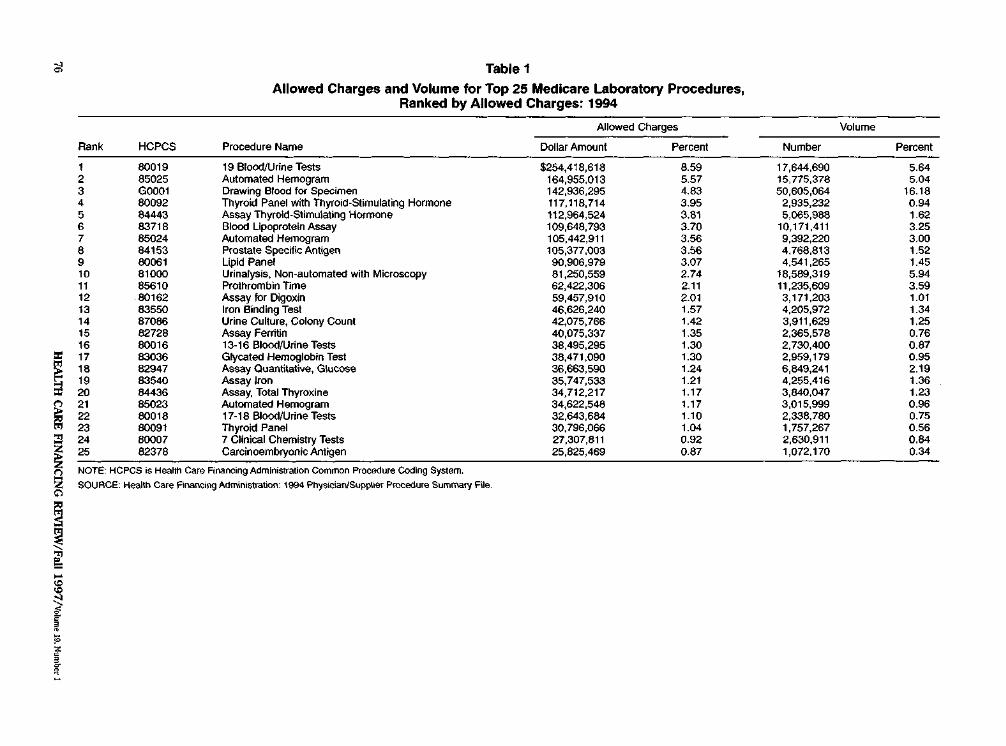
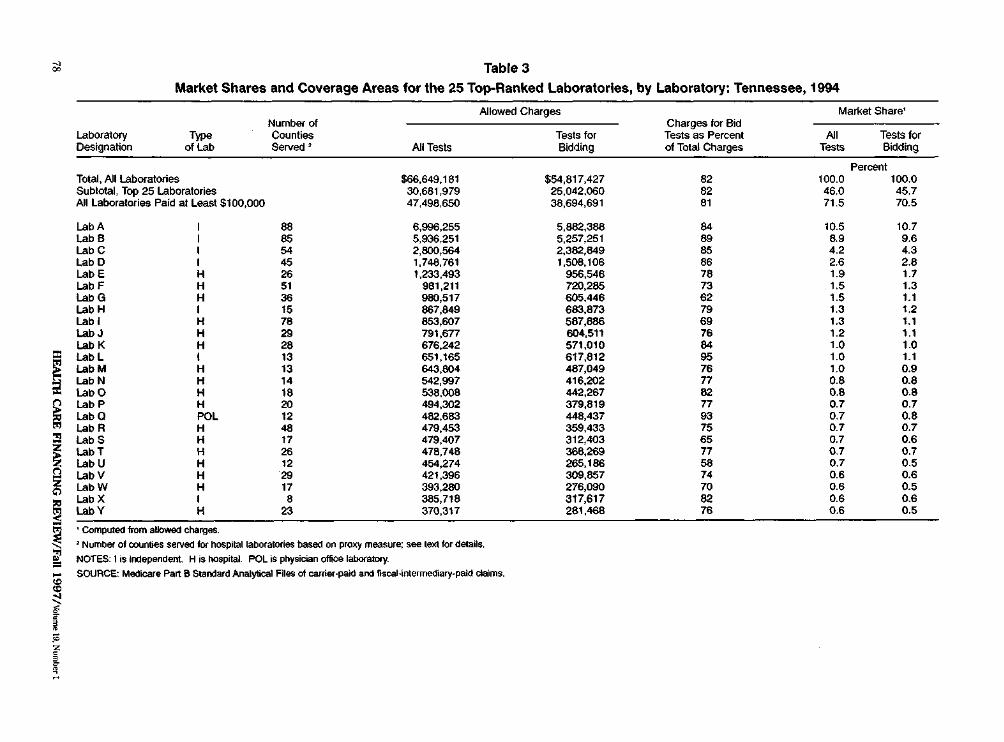
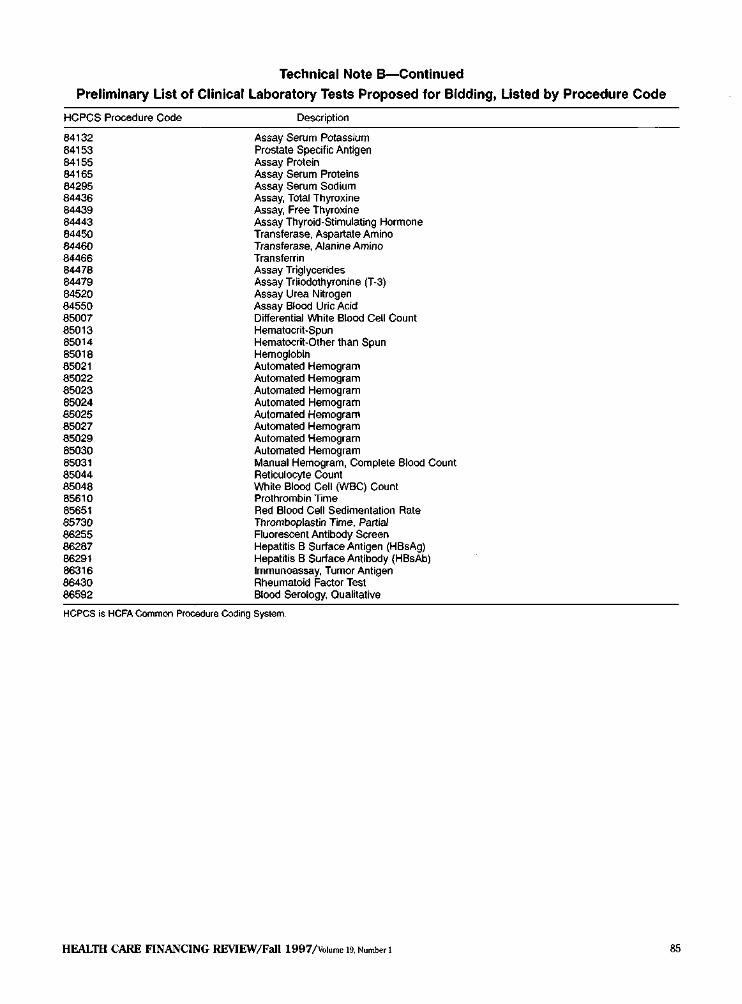