developing new stages for our core businesses
TRANSCRIPT
Annual Report 2004 For The Year Ended March 31, 2004
Developing New Stages for Our Core Businesses

Philosophy & Management Vision
SMM Group Corporate Philosophy
1. Sumitomo Metal Mining Co., Ltd.(“SMM”), in
accordance with the Sumitomo’s Business Spirit,
shall, through the performance of sound corporate
activities, seek to make positive contributions to
society and to fulfill its responsibilities to its stake-
holders, in order to win ever greater trust.
2. SMM shall, based on respect for all individuals and
recognizing each person’s dignity and value, seek to
be a forward-minded and vibrant company.
SMM Group Management Vision
Based on the principles of compliance, environmen-
tal protection and operational safety, the Sumitomo
Metal Mining Group shall pursue maximum corpo-
rate value through the provision, via its global net-
work, of high-quality materials such as non-ferrous
metals and electronics materials.
Contents
Consolidated Financial Highlights ......................................... 1To Our Shareholders ............................................................. 2Special Feature: Profit Growth Strategy through
New Mid-term Management Plan ................ 6Our Approach to Corporate Governance and Compliance ..... 9Review of Operations ............................................................. 10Financial Section .................................................................... 22SMM Group .......................................................................... 53Corporate Data and Investor Information............................... 54Corporate Officers .................................................................. 55
Unless specifically stated otherwise, information in this annualreport is as of August 31, 2004.
Forward-looking StatementsStatements made in this annual report with respect to plans,strategies and future performance that are not historical facts areforward-looking statements. SMM cautions that a number of fac-tors could cause actual results to differ materially from those dis-cussed in the forward-looking statements.
Mineral resources Metals Electronics & advanced materials Construction materials Others
0
500
400
200
100
300
Net Sales
(Billions of yen)
’00 ’01 ’02 ’04’03-10
30
20
0
10
Operating Income (Loss)
(Billions of yen)
’00 ’01 ’02 ’04’03-10
20
0
10
Net Income (Loss)
(Billions of yen)
’00 ’01 ’02 ’04’03
1Consolidated Financial Highlights
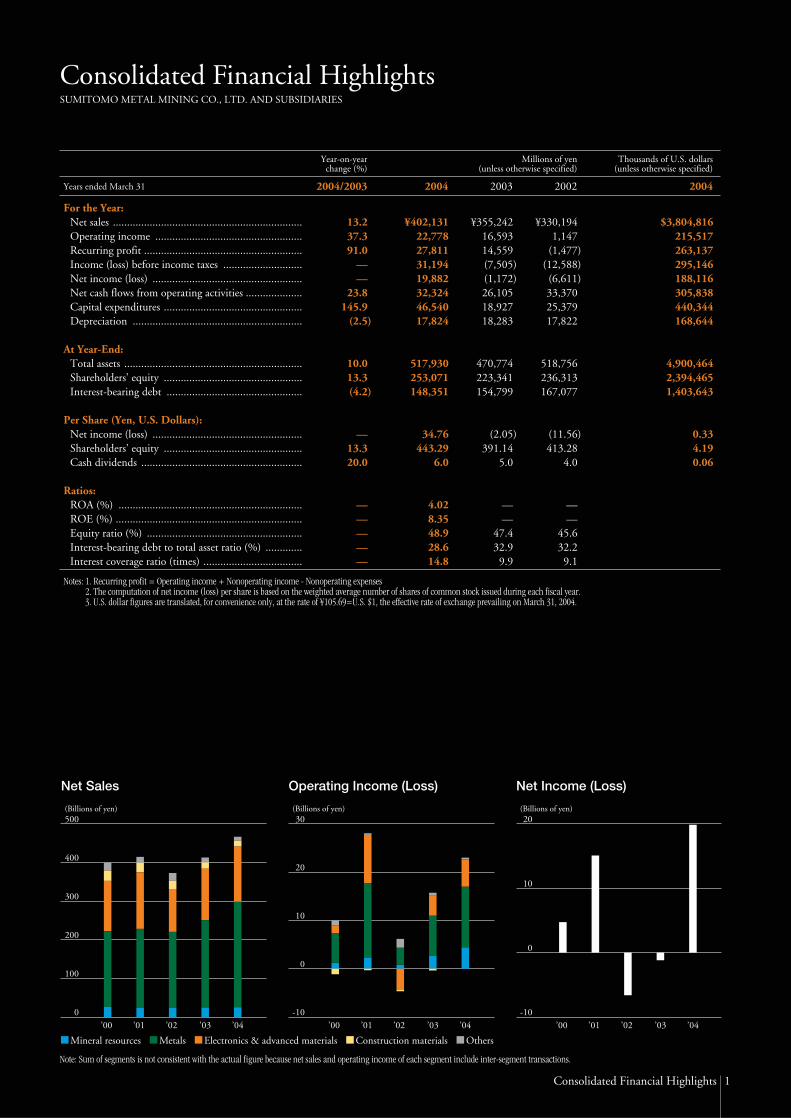
Consolidated Financial HighlightsSUMITOMO METAL MINING CO., LTD. AND SUBSIDIARIES
For the Year:Net sales ...................................................................Operating income ....................................................Recurring profit ........................................................Income (loss) before income taxes ............................Net income (loss) .....................................................Net cash flows from operating activities ....................Capital expenditures .................................................Depreciation ............................................................
At Year-End: Total assets ...............................................................Shareholders’ equity .................................................Interest-bearing debt ................................................
Per Share (Yen, U.S. Dollars): Net income (loss) .....................................................Shareholders’ equity .................................................Cash dividends .........................................................
Ratios:ROA (%) .................................................................ROE (%) ..................................................................Equity ratio (%) .......................................................Interest-bearing debt to total asset ratio (%) .............Interest coverage ratio (times) ...................................
Thousands of U.S. dollars(unless otherwise specified)
Millions of yen(unless otherwise specified)
Year-on-yearchange (%)
20042002200320042004/2003
$3,804,816 215,517 263,137 295,146 188,116 305,838 440,344 168,644
4,900,464 2,394,465 1,403,643
0.33 4.19 0.06
¥330,1941,147
(1,477)(12,588)
(6,611)33,370 25,379 17,822
518,756 236,313 167,077
(11.56)413.28
4.0
——
45.632.2
9.1
¥355,24216,593 14,559 (7,505)(1,172)26,105 18,927 18,283
470,774 223,341 154,799
(2.05)391.14
5.0
——
47.432.9
9.9
¥402,13122,778 27,811 31,194 19,882 32,324 46,540 17,824
517,930 253,071 148,351
34.76 443.29
6.0
4.028.3548.928.614.8
13.237.391.0
——
23.8145.9
(2.5)
10.013.3(4.2)
—13.320.0
—————
Notes: 1. Recurring profit = Operating income + Nonoperating income - Nonoperating expenses2. The computation of net income (loss) per share is based on the weighted average number of shares of common stock issued during each fiscal year.3. U.S. dollar figures are translated, for convenience only, at the rate of ¥105.69=U.S. $1, the effective rate of exchange prevailing on March 31, 2004.
Note: Sum of segments is not consistent with the actual figure because net sales and operating income of each segment include inter-segment transactions.
Years ended March 31
2 To Our Shareholders
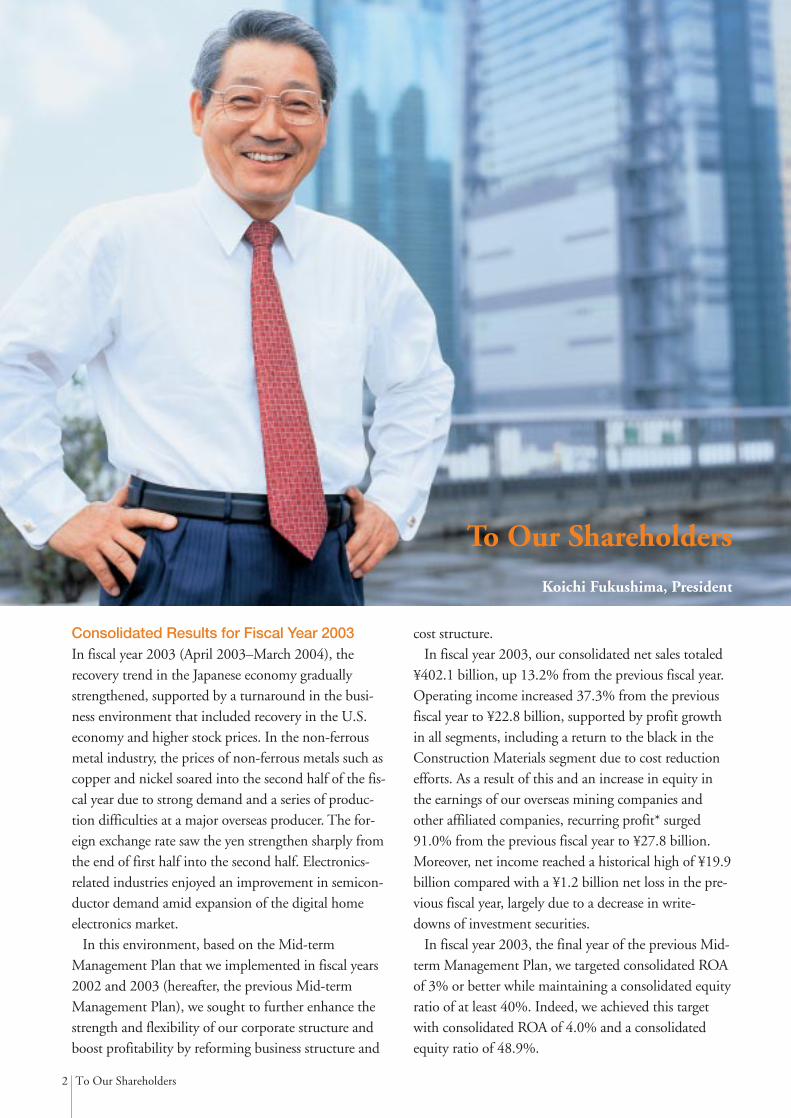
To Our Shareholders
Consolidated Results for Fiscal Year 2003In fiscal year 2003 (April 2003–March 2004), therecovery trend in the Japanese economy graduallystrengthened, supported by a turnaround in the busi-ness environment that included recovery in the U.S.economy and higher stock prices. In the non-ferrousmetal industry, the prices of non-ferrous metals such ascopper and nickel soared into the second half of the fis-cal year due to strong demand and a series of produc-tion difficulties at a major overseas producer. The for-eign exchange rate saw the yen strengthen sharply fromthe end of first half into the second half. Electronics-related industries enjoyed an improvement in semicon-ductor demand amid expansion of the digital homeelectronics market.
In this environment, based on the Mid-termManagement Plan that we implemented in fiscal years2002 and 2003 (hereafter, the previous Mid-termManagement Plan), we sought to further enhance thestrength and flexibility of our corporate structure andboost profitability by reforming business structure and
cost structure.In fiscal year 2003, our consolidated net sales totaled
¥402.1 billion, up 13.2% from the previous fiscal year.Operating income increased 37.3% from the previousfiscal year to ¥22.8 billion, supported by profit growthin all segments, including a return to the black in theConstruction Materials segment due to cost reductionefforts. As a result of this and an increase in equity inthe earnings of our overseas mining companies andother affiliated companies, recurring profit* surged91.0% from the previous fiscal year to ¥27.8 billion.Moreover, net income reached a historical high of ¥19.9billion compared with a ¥1.2 billion net loss in the pre-vious fiscal year, largely due to a decrease in write-downs of investment securities.
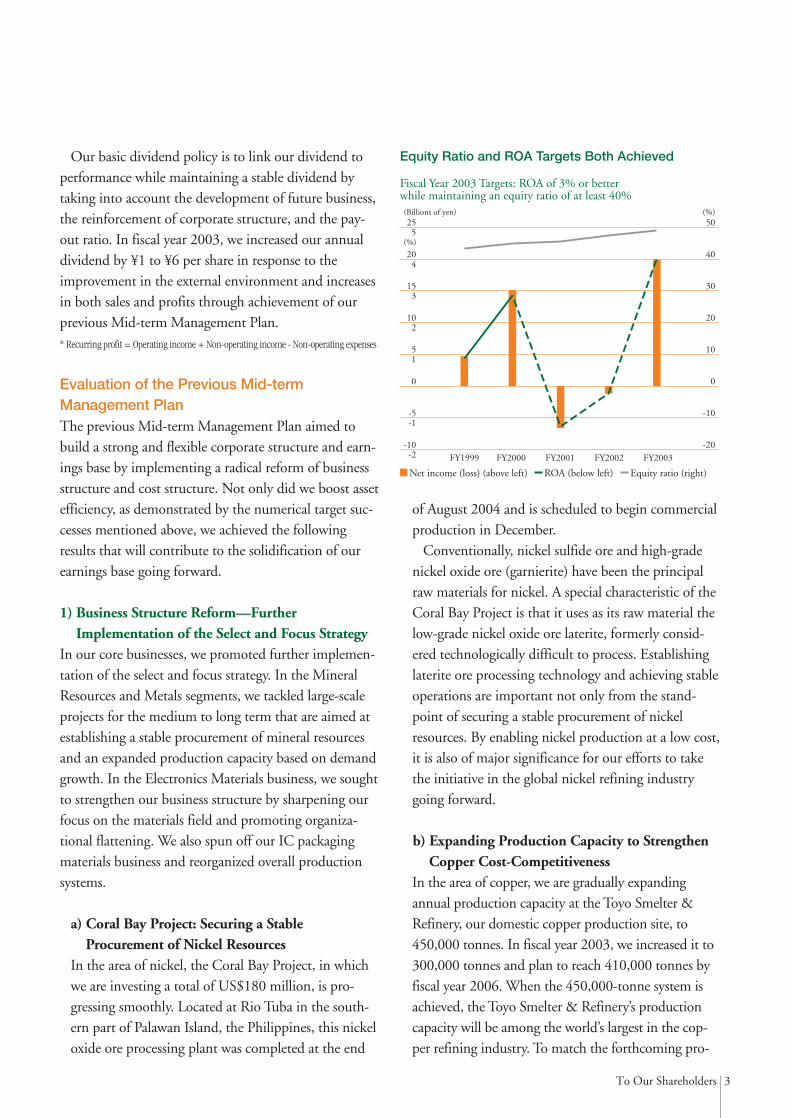
In fiscal year 2003, the final year of the previous Mid-term Management Plan, we targeted consolidated ROAof 3% or better while maintaining a consolidated equityratio of at least 40%. Indeed, we achieved this targetwith consolidated ROA of 4.0% and a consolidatedequity ratio of 48.9%.
Koichi Fukushima, President
3To Our Shareholders
Our basic dividend policy is to link our dividend toperformance while maintaining a stable dividend bytaking into account the development of future business,the reinforcement of corporate structure, and the pay-out ratio. In fiscal year 2003, we increased our annualdividend by ¥1 to ¥6 per share in response to theimprovement in the external environment and increasesin both sales and profits through achievement of ourprevious Mid-term Management Plan.* Recurring profit = Operating income + Non-operating income - Non-operating expenses
Evaluation of the Previous Mid-termManagement PlanThe previous Mid-term Management Plan aimed tobuild a strong and flexible corporate structure and earn-ings base by implementing a radical reform of businessstructure and cost structure. Not only did we boost assetefficiency, as demonstrated by the numerical target suc-cesses mentioned above, we achieved the followingresults that will contribute to the solidification of ourearnings base going forward.
1) Business Structure Reform—FurtherImplementation of the Select and Focus Strategy
In our core businesses, we promoted further implemen-tation of the select and focus strategy. In the MineralResources and Metals segments, we tackled large-scaleprojects for the medium to long term that are aimed atestablishing a stable procurement of mineral resourcesand an expanded production capacity based on demandgrowth. In the Electronics Materials business, we soughtto strengthen our business structure by sharpening ourfocus on the materials field and promoting organiza-tional flattening. We also spun off our IC packagingmaterials business and reorganized overall productionsystems.
a) Coral Bay Project: Securing a StableProcurement of Nickel Resources
In the area of nickel, the Coral Bay Project, in whichwe are investing a total of US$180 million, is pro-gressing smoothly. Located at Rio Tuba in the south-ern part of Palawan Island, the Philippines, this nickeloxide ore processing plant was completed at the end
of August 2004 and is scheduled to begin commercialproduction in December.
Conventionally, nickel sulfide ore and high-gradenickel oxide ore (garnierite) have been the principalraw materials for nickel. A special characteristic of theCoral Bay Project is that it uses as its raw material thelow-grade nickel oxide ore laterite, formerly consid-ered technologically difficult to process. Establishinglaterite ore processing technology and achieving stableoperations are important not only from the stand-point of securing a stable procurement of nickelresources. By enabling nickel production at a low cost,it is also of major significance for our efforts to takethe initiative in the global nickel refining industrygoing forward.
b) Expanding Production Capacity to StrengthenCopper Cost-Competitiveness
In the area of copper, we are gradually expandingannual production capacity at the Toyo Smelter &Refinery, our domestic copper production site, to450,000 tonnes. In fiscal year 2003, we increased it to300,000 tonnes and plan to reach 410,000 tonnes byfiscal year 2006. When the 450,000-tonne system isachieved, the Toyo Smelter & Refinery’s productioncapacity will be among the world’s largest in the cop-per refining industry. To match the forthcoming pro-
-10
25
15
20
-20
50
30
10 20
5 10
0 0
-5
-2
5
3
4
2
1
-1-10
40
Equity Ratio and ROA Targets Both Achieved
Fiscal Year 2003 Targets: ROA of 3% or better while maintaining an equity ratio of at least 40%(Billions of yen)
(%)
(%)
FY2000 FY1999 FY2001 FY2002 FY2003
Equity ratio (right)ROA (below left)Net income (loss) (above left)
4 To Our Shareholders
duction capacity increase, we have sought to partici-pate in a new mine as a means of securing in-housemineral resources. Although we were unable to achievethis during the previous Mid-term Management Plan,we are making every effort to achieve this under thecurrent Mid-term Management Plan.
c) Expanding Profit by Developing a New GoldMine
In the area of gold, we have acquired all the necessarydevelopment permissions for our Pogo Gold Projectin Alaska, the U.S., and have begun construction.Operations are scheduled to begin in March 2006.This project is of great significance for us in that it isthe first overseas mine development project in whichwe have been the lead developer. Applying the minemanagement experience that we have acquired at ourHishikari Mine, we are focusing our efforts on asmooth start of operations.
d) Improving Profits at Affiliated CompaniesWe have made efforts to improve profits at affiliatedcompanies, which included withdrawing fromunprofitable businesses. As a result, the total operatingloss at consolidated subsidiaries in the red shrankfrom ¥5.4 billion in fiscal year 2001 to ¥2.2 billion infiscal year 2003. In addition, total operating incomeat those in the black increased from ¥2.2 billion fiscalyear 2001 to ¥7.9 billion in fiscal year 2003.(For details, please see the graph on page 6.)
2) Cost Structure Reform—Implementation ofShort-term Measures to Strengthen Profit
As short-term measures to strengthen profit, wereformed our cost structure by implementing a varietyof projects to cut expenses and reform procurement sys-tem. As a result, we reduced procurement, personneland other costs by ¥8.2 billion in total in fiscal year2003 compared with fiscal year 2001.
In fiscal year 2004, moreover, we have introducedERP (Enterprise Resource Planning) and the SSC(Shared Service Center) we had been promoting prepa-ration as a means of improving support department effi-ciency. We aim to reduce administrative expenses by
approximately 30% by fiscal year 2005 through stan-dardization and improvement of office procedure effi-ciency and fostering information sharing with ERP aswell as streamlining group companies’ administrativeoperations with SSC.
Formulating the New Mid-term ManagementPlanBased on the Corporate Reform Plan (fiscal years 2000-2001) and the previous Mid-term Management Plan,we made steady progress in establishing a stronger earn-ings base. We have now positioned the three-year Mid-term Management Plan that started from April 2004(hereinafter, the new Mid-term Management Plan) as anew start toward achieving an optimal corporate struc-ture. In order to clarify where that will take us, we havereviewed our corporate philosophy and formulated anew philosophy for the SMM Group that is based onthe Sumitomo Business Spirit. We also formulated anew Management Vision based on this philosophy.(Please refer to “Corporate Philosophy” on the back ofthe front page.)
The basic strategy of our new Mid-term ManagementPlan is to expand and strengthen core businesses anddevelop new products. We aim for this to put ourselvesamong the world’s “non-ferrous majors” in the MineralResources and Metals segments in ten years’ time andgive us “top global shares in each of the products” in ourElectronics Materials and Advanced Materials segment.
1) Further Promotion of Shift to “Mineral Resource+ Refining” Business Model in the MineralResource and Metals Segments
Global demand for copper and nickel is expected toexpand further due to economic development in Chinaand other Asian countries. In order to fully leverage thisgrowth opportunity, expanding production capacity willnot be enough. We must also secure our own supplies ofmineral resources. To that end, we are already makingsteady progress toward completion of the Coral BayNickel Project and the Pogo Gold Project. In addition,we aim to acquire a stake in a new mine at the earliestpossible date in order to boost our in-house copper oreratio from the current 1:2 to 2:3.
5To Our Shareholders
2) Top Class Share and Profit Expansion in theElectronics Materials and Advanced MaterialsSegment
The electronics-related industries should see demandcontinue to expand over the medium to long termthanks to growth in the digital home appliance market.
We aim to give this business a strong presence byachieving a top global share for each of its main prod-ucts while remaining focused on actively developingbusiness in China markets. Specifically, these productsinclude 1) bonding wire, where we will leverage thestrengths of in-house gold procurement and processingtechnologies, 2) nickel paste, where we aim to furtherexpand sales and enter new areas for multilayer ceramiccapacitors, 3) lead frames, where we have achievedstrong cost-competitiveness by restructuring our pro-duction system, and 4) copper-clad polyimide film,where demand is expected to expand to the highest everlevel due to the extension of its use to LCD TVs. In ourresearch and development, moreover, we are working tocreate at least five new products that will each reach¥1.0-¥3.0 billion in annual sales by fiscal year 2006.
3) Financial Targets and Maintaining the FinancialPosition
By implementing the business strategy describedabove, we aim to achieve consolidated recurring profitof at least ¥35.0 billion, a 26% increase comparedwith fiscal year 2003, while maintaining a consolidat-ed equity ratio of at least 40% by fiscal year 2006, thefinal year of the plan. Under the previous Mid-termManagement Plan, we adopted ROA as an indicatorthat attached importance to asset efficiency. Under thenew Mid-term Management Plan, however, we havenarrowed the focus to strengthening profitability as
the next step and have set an absolute recurring profittarget. We are currently in a relatively favorable exter-nal environment that includes rising prices for non-ferrous metals. That, however, is no reason to slackenour efforts. We will continue to steadily implementthe measures laid out in our new Mid-termManagement Plan.
At the same time, we will continue to maintain oursolid financial position. The capital expenditure thatwe have scheduled, mainly for large-scale projects inthe Mineral Resources and Metals segments, will basi-cally be covered by depreciation and income beforeincome taxes. We thereby plan to keep interest-bearingdebt at its current level.
In ClosingAchieving the “maximization of corporate value”called for in our Management Vision is not limited tothe business strategies described above. We are alsoaware of the importance of further strengthening ourmanagement base with making corporate activitiesboth efficient and sound by strengthening corporategovernance, solidly establishing a compliance systemthat incorporates the lessons learned from the JCOcriticality accident, fostering a safety-conscious cul-ture, and reinforcing the risk management systemneeded to achieve it. We hope to fulfill our responsi-bilities to our stakeholders and to contribute to societyby working toward achieving these goals.
All of our management and employees are commit-ted to working in close cooperation to maximize cor-porate value by steadily implementing the new Mid-term Management Plan based on sound business prac-tices. We look forward to your continued support andunderstanding.
August 2004
Koichi FukushimaPresident

Unprofitable companies Profitable companies
-10
10
0
-5
5
Earnings of Consolidated Subsidiaries(Operating Income)
(Billions of yen)
FY2000 FY1999 FY2001 FY2002 FY2003
-7.1
4.6 5.6
2.2
5.4
7.9
-1.4
-5.4
-2.4 -2.2
6 Special Feature
Special Feature: Profit Growth Strategy through New Mid-term Management Plan
1. Progress with Financial Targets
Equity Ratio and ROA Targets Both Achieved
In fiscal year 2003, the final year of the plan, we targeted consolidat-
ed ROA of 3% or better while maintaining a consolidated equity
ratio of at least 40%. As a result of Business Structure Reform based
on a select and focus strategy and Cost Structure Reform, coupled
with our asset streamlining efforts, we achieved consolidated ROA
of 4.0% and consolidated equity ratio of 48.9%, laying the ground-
work for strengthening profitability.
2. The Results of Business Structure Reform
1) Applying Select and Focus Strategy to Core Businesses
We promoted the select and focus strategy in Mineral Resources
and Metals segments and the Electronics Materials and Advanced
Materials segment, which are our core businesses.
In the Mineral Resources and Metals segments, we emphasized
promotion of the large-scale projects outlined below in order to
strengthen profitability in the medium to long term. In the
Electronics Materials and Advanced Materials segment, we concen-
trated management resources in areas such as paste and copper-clad
polyimide film that use the materials technology in which we are
strong, in addition to restructuring businesses.
A) Coral Bay Project
This project is the construction of a low-grade nickel oxide ore
processing plant in the Philippines for producing an intermediate
product of nickel refining. The plan is proceeding smoothly. We
completed construction in August 2004 and commercial produc-
tion will begin in December.
B) Pogo Gold Project
This project is in Alaska, the U.S. In May 2004, we received all
the permissions required to begin construction and are proceeding
with operations scheduled to begin in March 2006. The main ore
deposit is estimated at 152 tonnes of gold reserves and we are tar-
geting annual production of 12 tonnes.
C) Expanding Annual Copper Production to 450,000 Tonnes
We are expanding production facilities at the Toyo Smelter &
Refinery, our domestic copper production site, with the goal of
gradually boosting annual capacity to 450,000 tonnes. We com-
pleted an increase from 270,000 to 300,000 tonnes in fiscal year
2003 and plan to reach 410,000 tonnes by fiscal year 2006.
We also actively considered prospecting and investing in projects
as means of developing new mines for the stable supply of raw
material required by 450,000 tonnes annual copper production
capacity. However, we were unable to make progress in this area
under the 2002-2003 plan. We were also studying participation in
a new nickel oxide ore project that Inco Ltd. (Canada) is promot-
ing in New Caledonia. As Inco is currently reviewing the plan
with the goal of cutting the amount of investment, however, we
will decide whether or not to participate after the review has been
completed.
2) Enhancing Efficiency through Alliances and by
Withdrawing from Unprofitable Areas
We enhanced the efficiency of our zinc and sulfuric acid business-
es by setting up joint ventures with Mitsui Mining & Smelting
Co., Ltd. and Dowa Mining Co., Ltd., respectively. Also, we sold
or withdrew from businesses with less prospect and those with
limited synergy with our core businesses. By the end of fiscal year
2003, we had shut down or sold off 27 of the 94 affiliated com-
panies we had as of April 2000.
As a result, the earnings of consolidated subsidiaries improved
as follows.
Evaluation of Previous Mid-term Management Plan (Fiscal Years 2002-2003)
Under the previous two-year mid-term management plan that started in fiscal year 2002, SMM undertook
Business Structure Reform and Cost Structure Reform aimed at building a strong and sound corporate struc-
ture and improving profitability.

7Special Feature
1. Numerical Targets for Fiscal Year 2006
1) Consolidated Financial Targets
In fiscal year 2006, the final year of the new Mid-term
Management Plan, we are aiming for recurring profit of at least
¥35.0 billion while maintaining the equity ratio at 40% or higher.
Our financial targets are based on the following assumptions.
These are based on a thorough analysis of market trends over the
past ten years.
Essential Features of the New Mid-term Management Plan (Fiscal Years 2004-2006)
Acknowledging the groundwork for strengthening profitability laid by Corporate Reform Plan (fiscal years 2000-2001)
and the previous Mid-term Management Plan, the new Mid-term Management Plan bases its strategy on expanding
and strengthening core businesses and on developing new products. In ten years’ time, we aim for this to put us
among the “non-ferrous majors” in the Mineral Resources and Metals segments and give us “top global shares in
each of the products” in our Electronics Materials and Advanced Materials segment.
In addition, having targeted improvement in supporting depart-
ment efficiency by introducing ERP (Enterprise Resource
Planning) and converting to SSC (Shared Service Center) in fiscal
year 2003, these were launched one year behind schedule in April
2004. ERP will standardize and improve the efficiency of office
procedures and foster information sharing while SSC will integrate
the redundant office procedures of group companies’ supporting
departments. We expect these to reduce supporting department
expenses by approximately 30% in fiscal year 2005 or later.
Billions of yen
FY2003 Targets FY2003 Results(vs. FY2001)
Cost Reduction Project .................... 1.0 1.2 Procurement Innovation Project ...... 5.0 4.4 Personnel Reduction ........................ 2.4 2.6 Total Cost Reduction ...................... 8.4 8.2
Billions of yen
FY2003 Results FY2006 TargetsNet sales .................................... 402.1 480.0 Recurring profit ........................ 27.8 35.0 Net income ............................... 19.9 25.0 Equity ratio (%) ........................ 48.9% 40% or above Interest-bearing debt ................. 148.4 165.0 Interest-bearing debt to
total asset ratio (%) ............... 29% 30% or below
FY2006 Assumptions FY2003 Results
Exchange rate (¥/$) .................. 110 113.06Copper price (¢/lb) ................... 90.7 92.8Nickel price ($/lb) .................... 3.50 5.10Gold price ($/toz) ..................... 320.0 377.6Zinc price ($/ton) ..................... 950 899
3. The Results of Cost Structure Reform
As a result of the measures shown below, we cut costs by ¥8.2 bil-
lion compared with fiscal year 2001 results, which falls slightly
short of the fiscal year 2003 target.
2. Specific Measures for Achieving the Numerical
Targets
1) Essentials of Our Business Strategy
*For details please refer to the Review of Operations.
Mineral Resources and Metals Segments:
With a view to ranking among the “non-ferrous majors” in ten
years’ time, we aim to transition from the “ore purchasing and
refining” type of business model to the “mineral resources +
refining” type by increasing the level of business resources that
we commit to overseas natural resource development. With cop-
per in particular, in order to boost the ratio produced from our
own mines from the current 1/2 to 2/3 in the future, we plan to
participate in at least one new mine development by fiscal year
2006.
Electronics Materials and Advanced Materials Segment:
We aim to turn this business into a major presence by securing
top global shares for each of its products through the active
development of China and other Asian markets. Specifically, the
main products will be bonding wires, paste, lead frames, and cop-
per-clad polyimide film.
Note: Recurring profit = Operating income + Nonoperating income - Nonoperating expenses
Note: Exchange rate represents an average for the fiscal year.

0
600
400
200
Net Sales by Segment
(Billions of yen)
FY2006 (Target)FY2003
Mineral resources Metals Electronics & advanced materialsConstruction materials Others
0
40,000
20,000
10,000
30,000
Operating Income by Segment
(Millions of yen)
FY2006 (Target)FY2003
25
273
1431510
12,567
5,6127391
4,4606,700
12,100
12,6001,300300
34
290
1891525
8 Special Feature
Other Businesses:
We aim to place the Construction Materials business on a prof-
itable footing by implementing radical measures for improving
efficiency with cost cutting effects of ¥1.9 billion in total. In
addition, we plan to boost net sales in our Environmental busi-
ness from ¥18.0 billion in fiscal year 2003 to ¥24.0 billion in fis-
cal year 2006 by actively promoting our environmental improve-
ment business and recycling business.
2) Net Sales and Operating Income by Segment
Comparing fiscal year 2003 results and fiscal year 2006 targets by
segment, the largest planned sales growth is in Mineral Resources
segment (34.4%) and the Electronics Materials and Advanced
Materials segment (32.4%).
The largest increases in operating income are in Electronics
Materials and Advanced Materials segment (225%) and the
Mineral Resources segment (50%). We aim to maintain profitabili-
ty in the Construction Materials segment by further improving
efficiency. As a result, in fiscal year 2006 the Mineral Resources
segment should account for about 20% of earnings and the Metals
segment and Electronics Materials and Advanced Materials seg-
ment should account for 30%-40% respectively.
3) Research & Development
We aim to develop at least five new products worth ¥1.0-¥3.0
billion each in annual sales by fiscal year 2006. Our R&D is
focused on the following Electronics Materials and Advanced
Materials themes from our four core technologies
(separation/refining/crystallization technology, fine powder tech-
nology, surface treatment technology, organic resin technology).
Investment in new product R&D over the three–year period will
be approximately ¥7.0 billion.
• Power storage and generation materials (battery materials, etc.)
• High efficiency energy materials (crystal materials, etc.)
• Thin-film materials (various target materials, etc.)
• Nano materials (upgrading of functional ink, paste, etc.)
• Thin package materials (upgrading of copper-clad polyimide
film, etc.)
4) Investment Plans
Our investment plan for the three-year period is ¥140.0 billion and
is centered on the following major projects in the Mineral
Resources and Metals segments.
• New copper mine development I (¥23.0 billion)
• New copper mine development II (¥11.0 billion)
• Expanding annual copper production to 450,000 tonnes
(¥9.0 billion)
• Pogo gold project (¥13.5 billion)
• Coral Bay project (¥4.0 billion)
• New nickel oxide ore project II (¥11.0 billion)
(As of formulation of 2004-2006 plan)
The investment will be covered by depreciation (¥76.0 billion) and
income before income taxes (¥66.0 billion) over three years with
the difference funded through long-term loans, bonds, and com-
mercial paper. By maintaining interest-bearing debt at the current
level, the investment will be aggressive but within reasonable limits.
Note: Sum of segments is not consistent with the actual figure because net sales and operatingincome of each segment include inter-segment transactions.

9Our Approach to Corporate Governance and Compliance
Our Approach to Corporate Governance and Compliance
Basic Philosophy of Corporate Governance
SMM positions corporate governance as one of the most
important management issues for both maximizing corporate
value and ensuring sound management. We believe that a
statutory auditor system and executive officer system are the
most appropriate approach to creating a governance system
capable of applying the executive and auditing functions to a
business in a way that fits our business characteristics. Based
on these systems, we have put in place a governance system
that enables our directors, statutory auditors, and executive
officers to effectively exercise their functions.
Directors, Board of Directors
We currently have seven directors. We believe this size is
appropriate to ensure the lively discussions and flexible deci-
sion-making in the Board of Directors.
Executive Officer System
We have reinforced the executive function through clarifica-
tion of authority and responsibility and through a broad dele-
gation of authority. There are 17 executive officers (seven of
whom also serve as directors) who carry out their work by
being assigned specific authority for important tasks such as
divisional managers and headquarters office managers.
Remuneration is linked to performance.
Statutory Auditors
There are four statutory auditors, two of whom are from out-
side the Company. The two internal statutory auditors apply
their work experience at SMM to their position as statutory
auditor for the commercial code and present their views at
important meetings such as the Board of Directors and
Management Committee. One of the external auditors is a
university professor and the other is an attorney. They apply
the expertise of their special fields when they present their
views to the Board of Directors. Neither of these auditors has
previously worked for any of the SMM Group companies.
Compliance, Risk Management, and Our
Involvement in the Environment and Society
Taking to heart the lessons of the criticality accident that
occurred in September 1999 at JCO Co., Ltd., one of our
subsidiaries, we designed a Corporate Reform Plan in April
2000 and have attached great importance to compliance in
the conduct of our business.
In April 2004, we established a management philosophy for
the SMM Group and the “SMM Group Code of Conduct” to
help directors and employees implement it. The Code of
Conduct comprises 17 articles whose subjects, centered on
compliance, include safety, risk management, and considera-
tion for the global environment, and we are actively promot-
ing their implementation.
General Shareholders’ Meeting
Organizational Chart of Corporate Governance
Election
Review
Auditing
AuditingAuditing
Election and supervisionBoard of Statutory AuditorsOperation and accounting audit
Board of DirectorsMajor decision and oversight
President & Representative Director, Executive OfficersExecution of business
IndependentRegisteredAccountantAccountingaudit
Management CommitteeDeliberations
Business DivisionOperation of business
HeadquartersDivisionsReview
Auditing DepartmentInternal audit
Review of Operations
Contents
At a Glance ........................................................................ 11
Mineral Resources and Metals ............................................ 12
Electronics Materials and Advanced Materials .................... 17
Other Businesses ................................................................ 21

11Review of Operations
At a Glance
Mineral resources Metals Electronics & advanced materials Construction materials Others Net cash flows from operating activities
Net Sales by Segment
-10
40
30
20
0
10
Operating Income and Net Cash Flows from Operating Activities
(Billions of yen)
FY99 FY00 FY01 FY02 FY030
50
40
20
30
Capital Expenditures (left) and Depreciation (right)
(Billions of yen)
FY99 FY00 FY01 FY02 FY03
10
FY 2003Net Sales:
¥402.1 Billion
4.1
56.2
33.9
3.8 2.0
Note: Percentage of each segment is calculated with net sales to outside customers which does not include inter-segment transactions.
Note: Sum of segments is not consistent with the actual figurebecause operating income of each segment includeinter-segment transactions.
Business ProfileSegmentMineral Resources
Metals
Electronics Materials
Advanced Materials
Other Businesses
Operations• Exploration, development, production, and sales of
non-ferrous metal resources, domestically and overseas• Geological consulting utilizing mineral resource devel-
oping techniques
• Refining and sales of base metals such as copper, nickel,and precious metals
• Manufacturing, processing and sales of IC packagingmaterials, electronics materials, crystal materials, etc.
• Manufacturing and sales of optical communicationmaterials and devices, connectors, switches, electricalcontacts, TV frames, etc.
• Manufacturing, processing, and sales of metal powders(nickel, palladium), circuit board materials, batterymaterials, magnet materials, etc.
• Construction materials and housing business• Environmental business (environmental engineering,
soil remediation, environmental analysis, irradiation)
Main Products and ServicesGold and silver ores, copper concentrates
Copper, nickel, zinc, lead, precious metalssuch as gold, silver, platinum, etc.
Lead frame, tape material, bonding wire,paste, crystal material (GaP: gallium phos-phide, LN: lithium niobate, LT: lithiumtantalate), printed wiring board (PWB),optical components (faraday rotator,optical isolator and high frequency device)
Nickel powder, copper-clad polyimidefilm, materials for rechargeable batteries(nickel hydroxide, lithium cobaltite), rareearth metal bonded magnets
Siporex (ALC: autoclaved lightweightconcrete); design and installation of envi-ronmental protection equipment; designand execution of corrosion preventionconstruction; design and installation relat-ed to assessment and remediation of soiland groundwater contamination; all typesof environmental analysis including waterand soil quality, irradiation sterilization ofmedical equipment, etc.
12 Review of Operations
Mineral Resources and Metals
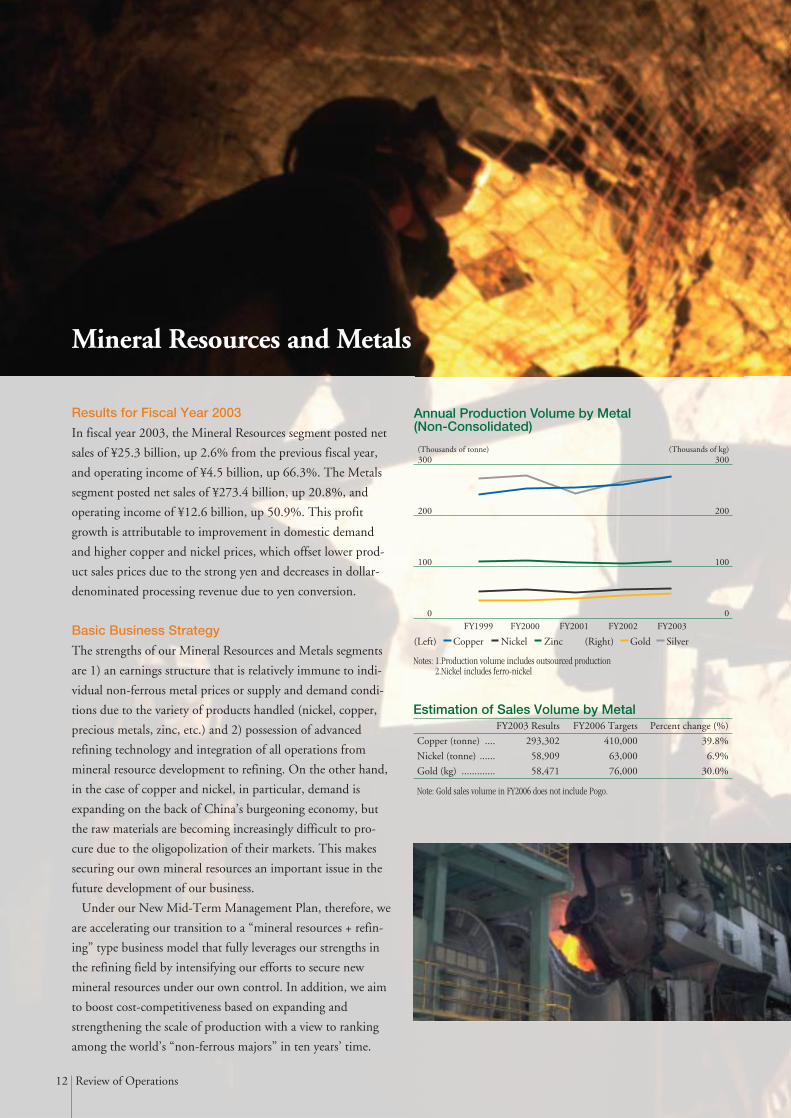
Results for Fiscal Year 2003
In fiscal year 2003, the Mineral Resources segment posted net
sales of ¥25.3 billion, up 2.6% from the previous fiscal year,
and operating income of ¥4.5 billion, up 66.3%. The Metals
segment posted net sales of ¥273.4 billion, up 20.8%, and
operating income of ¥12.6 billion, up 50.9%. This profit
growth is attributable to improvement in domestic demand
and higher copper and nickel prices, which offset lower prod-
uct sales prices due to the strong yen and decreases in dollar-
denominated processing revenue due to yen conversion.
Basic Business Strategy
The strengths of our Mineral Resources and Metals segments
are 1) an earnings structure that is relatively immune to indi-
vidual non-ferrous metal prices or supply and demand condi-
tions due to the variety of products handled (nickel, copper,
precious metals, zinc, etc.) and 2) possession of advanced
refining technology and integration of all operations from
mineral resource development to refining. On the other hand,
in the case of copper and nickel, in particular, demand is
expanding on the back of China’s burgeoning economy, but
the raw materials are becoming increasingly difficult to pro-
cure due to the oligopolization of their markets. This makes
securing our own mineral resources an important issue in the
future development of our business.
Under our New Mid-Term Management Plan, therefore, we
are accelerating our transition to a “mineral resources + refin-
ing” type business model that fully leverages our strengths in
the refining field by intensifying our efforts to secure new
mineral resources under our own control. In addition, we aim
to boost cost-competitiveness based on expanding and
strengthening the scale of production with a view to ranking
among the world’s “non-ferrous majors” in ten years’ time.
Estimation of Sales Volume by MetalFY2003 Results FY2006 Targets Percent change (%)
Copper (tonne) .... 293,302 410,000 39.8%
Nickel (tonne) ...... 58,909 63,000 6.9%
Gold (kg) ............. 58,471 76,000 30.0%
0
300
100
200
0
300
100
200
Annual Production Volume by Metal (Non-Consolidated)
(Thousands of tonne) (Thousands of kg)
FY2000 FY1999 FY2001 FY2002 FY2003
Copper Gold SilverNickel(Left) (Right)Zinc
Notes: 1.Production volume includes outsourced production2.Nickel includes ferro-nickel
Note: Gold sales volume in FY2006 does not include Pogo.
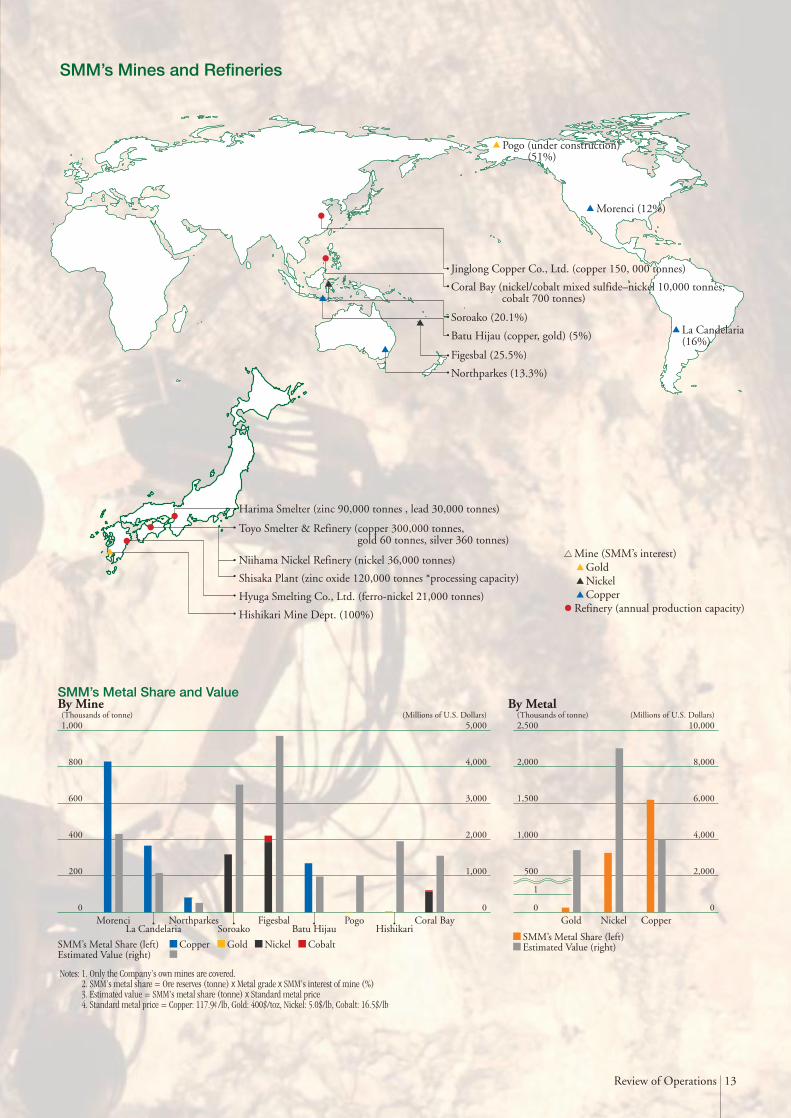
13Review of Operations
Notes: 1. Only the Company’s own mines are covered.2. SMM’s metal share = Ore reserves (tonne) x Metal grade x SMM’s interest of mine (%)3. Estimated value = SMM’s metal share (tonne) x Standard metal price4. Standard metal price = Copper: 117.9¢/lb, Gold: 400$/toz, Nickel: 5.0$/lb, Cobalt: 16.5$/lb
Northparkes (13.3%)
Batu Hijau (copper, gold) (5%)
Coral Bay (nickel/cobalt mixed sulfide–nickel 10,000 tonnes, cobalt 700 tonnes)
Soroako (20.1%)
Jinglong Copper Co., Ltd. (copper 150, 000 tonnes)
Figesbal (25.5%)
La Candelaria (16%)
Morenci (12%)
Pogo (under construction) (51%)
Hishikari Mine Dept. (100%)
Hyuga Smelting Co., Ltd. (ferro-nickel 21,000 tonnes)
Toyo Smelter & Refinery (copper 300,000 tonnes, gold 60 tonnes, silver 360 tonnes)
Harima Smelter (zinc 90,000 tonnes , lead 30,000 tonnes)
Mine (SMM’s interest) Gold Nickel CopperRefinery (annual production capacity)
Niihama Nickel Refinery (nickel 36,000 tonnes)
Shisaka Plant (zinc oxide 120,000 tonnes *processing capacity)
SMM’s Metal Share (left)
0 0
1,000 5,000
4,000
3,000
2,000
1,000
400
600
800
SMM’s Metal Share and Value
(Thousands of tonne) (Millions of U.S. Dollars)
200
MorenciLa Candelaria
NorthparkesSoroako
FigesbalBatu Hijau
PogoHishikari
Coral Bay
CobaltCopperEstimated Value (right)
Gold Nickel
0 0
2,500 10,000
8,000
6,000
4,000
2,000
1,000
1,500
2,000
(Thousands of tonne) (Millions of U.S. Dollars)
500
1
Gold Nickel Copper
SMM’s Metal Share (left)Estimated Value (right)
By Mine By Metal
SMM’s Mines and Refineries
14 Review of Operations
Nickel
We expect demand for nickel, whose principal use is in stain-
less steel, to continue to expand over the medium to long term,
as we estimate that global production of stainless steel will
grow at an annual rate of approximately 5%, supported by the
rapid expansion of demand in China. As nickel producers have
little room to expand production, the nickel price rose to
US$5.10/lb in fiscal year 2003, up 54% from the previous fis-
cal year.
SMM offers a variety of nickel products, including high-
purity electrolytic nickel for electronics materials and ferro-
nickel for stainless steel. Notably, we are the only domestic
producer of electrolytic nickel, for which we use matte chlorine
leach electrowinning (MCLE) process, a high-quality, high-
productivity hydrometallurgical refining process.
Basic Strategy
In order to secure a stable procurement of raw materials, we
have acquired equity in nickel mine operators such as P. T.
Inco (Soroako, Indonesia) and FIGESBAL (New Caledonia).
As demand growth in China and other factors are making raw
materials increasingly scarce, however, we are promoting the
following projects in order to establish a stable supply system
by securing our own mineral resources.
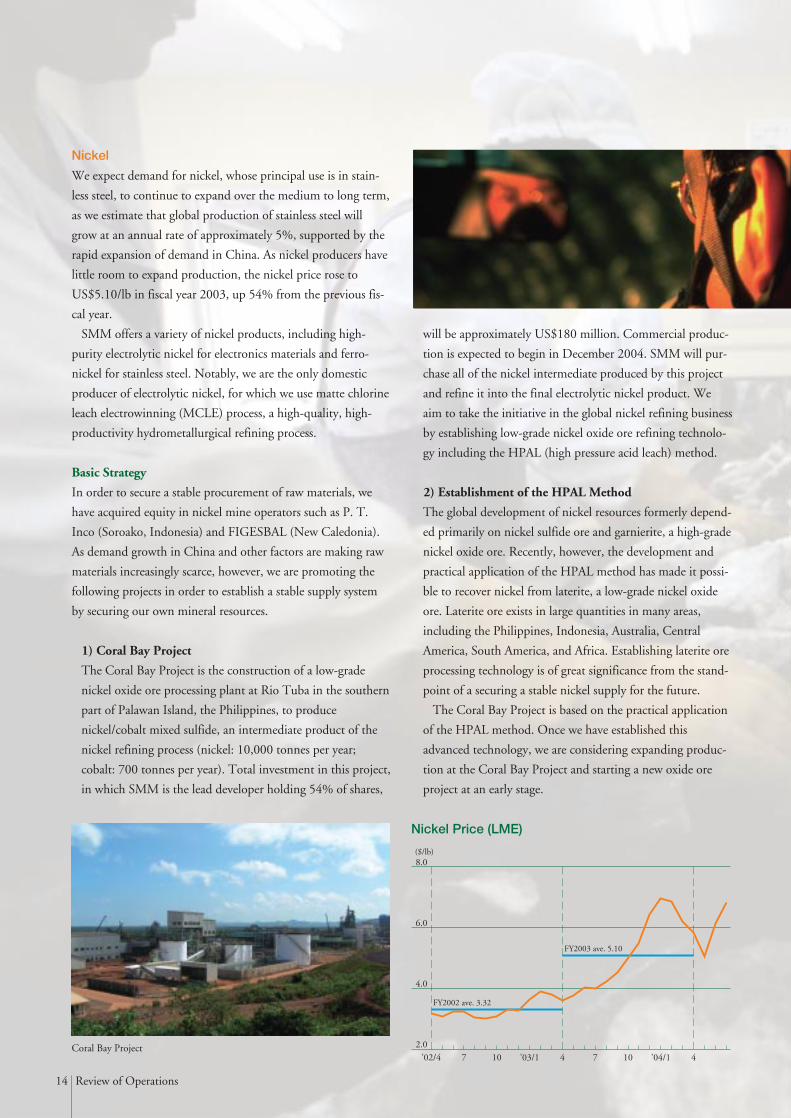
1) Coral Bay Project
The Coral Bay Project is the construction of a low-grade
nickel oxide ore processing plant at Rio Tuba in the southern
part of Palawan Island, the Philippines, to produce
nickel/cobalt mixed sulfide, an intermediate product of the
nickel refining process (nickel: 10,000 tonnes per year;
cobalt: 700 tonnes per year). Total investment in this project,
in which SMM is the lead developer holding 54% of shares,
will be approximately US$180 million. Commercial produc-
tion is expected to begin in December 2004. SMM will pur-
chase all of the nickel intermediate produced by this project
and refine it into the final electrolytic nickel product. We
aim to take the initiative in the global nickel refining business
by establishing low-grade nickel oxide ore refining technolo-
gy including the HPAL (high pressure acid leach) method.
2) Establishment of the HPAL Method
The global development of nickel resources formerly depend-
ed primarily on nickel sulfide ore and garnierite, a high-grade
nickel oxide ore. Recently, however, the development and
practical application of the HPAL method has made it possi-
ble to recover nickel from laterite, a low-grade nickel oxide
ore. Laterite ore exists in large quantities in many areas,
including the Philippines, Indonesia, Australia, Central
America, South America, and Africa. Establishing laterite ore
processing technology is of great significance from the stand-
point of a securing a stable nickel supply for the future.
The Coral Bay Project is based on the practical application
of the HPAL method. Once we have established this
advanced technology, we are considering expanding produc-
tion at the Coral Bay Project and starting a new oxide ore
project at an early stage.
2.0
8.0
4.0
6.0
Nickel Price (LME)
($/lb)
’02/4 7 10 ’03/1 4 7 10 ’04/1 4
FY2002 ave. 3.32
FY2003 ave. 5.10
Coral Bay Project

15Review of Operations
Copper
Due to factors ranging from expansion of the China market
and recovery in domestic demand to production difficulties at
a major overseas producer, in fiscal year 2003 the copper price
rose 29% from the previous fiscal year to US$92.8/lb, hitting a
six-year high.
In 2002, copper consumption in China topped the U.S.’s
2.37 million tonnes to become the highest in the world at 2.68
million tonnes. However, the production capacity of China’s
existing refineries cannot keep up with demand growth, so that
the gap between supply and demand continues to widen.
While the scale of China’s copper market is expected to reach 5
million tonnes in 2010, we estimate that more than half of that
will depend on imports.
Basic Strategy
The Toyo Smelter & Refinery, our domestic copper produc-
tion site, has an in-house ore ratio of about one-half and pur-
chases the remainder from outside. In addition to expanding
our production system to meet demand growth, we are work-
ing to secure a stable supply of mineral resources.
1) Expanding the Production System
Aiming for annual production of 450,000 tonnes at the
Toyo Smelter & Refinery, we plan to gradually increase the
current annual capacity of 300,000 tonnes to 410,000 tonnes
by April 2006. Establishing an annual production system of
450,000 tonnes will give the Toyo Smelter & Refinery top
global class production capacity. In addition, aiming to
establish an annual production system of 210,000 tonnes at
Jinlong Copper Co., Ltd., our joint venture holding 20.95%
of shares in Anhui Province, China, we plan to boost the cur-
rent 150,000 tonnes to 190,000 by fiscal year 2006.
2) Acquiring Stakes in New Mines to Boost Ratio of In-
house Ore
In the area of mineral resource development, going forward
we aim to achieve an in-house ore ratio of two-thirds for our
annual production system of 450,000 tonnes. To that end,
we plan to acquire a stake in at least one new mine by fiscal
year 2006 and to seek further opportunities of this type
from fiscal 2007.
Our sales strategy is to leverage the Toyo Smelter &
Refinery’s geographical proximity to Asian markets to
actively promote sales in China and the surrounding areas.
3) Reinforcing the Sulfuric Acid Business
The copper refining process yields large amounts of sulfuric
acid as a by-product. This means that annual production of
450,000 tonnes of copper will generate 1.2 millions of
tonnes of sulfuric acid. As the profitability of sulfuric acid
sales affects the competitiveness of the copper business, the
sulfuric acid business becomes an important issue when cop-
per production is expanded.
SMM formed an alliance with Dowa Mining Co., Ltd. in
the sulfuric acid business and in February 2003 set up the
sulfuric acid manufacturing and sales company Acids Co.,
Ltd. as a joint venture. Through this alliance, we aim to cut
costs by making production, distribution, and sales more
efficient.
In addition, as the Coral Bay Project will use approximate-
ly 260,000 tonnes of sulfuric acid annually, we will be able
to secure the sales of the amount within the SMM Group.
50
150
75
100
125
Copper Price (LME)
(¢/lb)
’02/4 7 10 ’03/1 4 7 10 ’04/1 4
FY2002 ave. 72.0
FY2003 ave. 92.8
Toyo Smelter & Refinery
16 Review of Operations
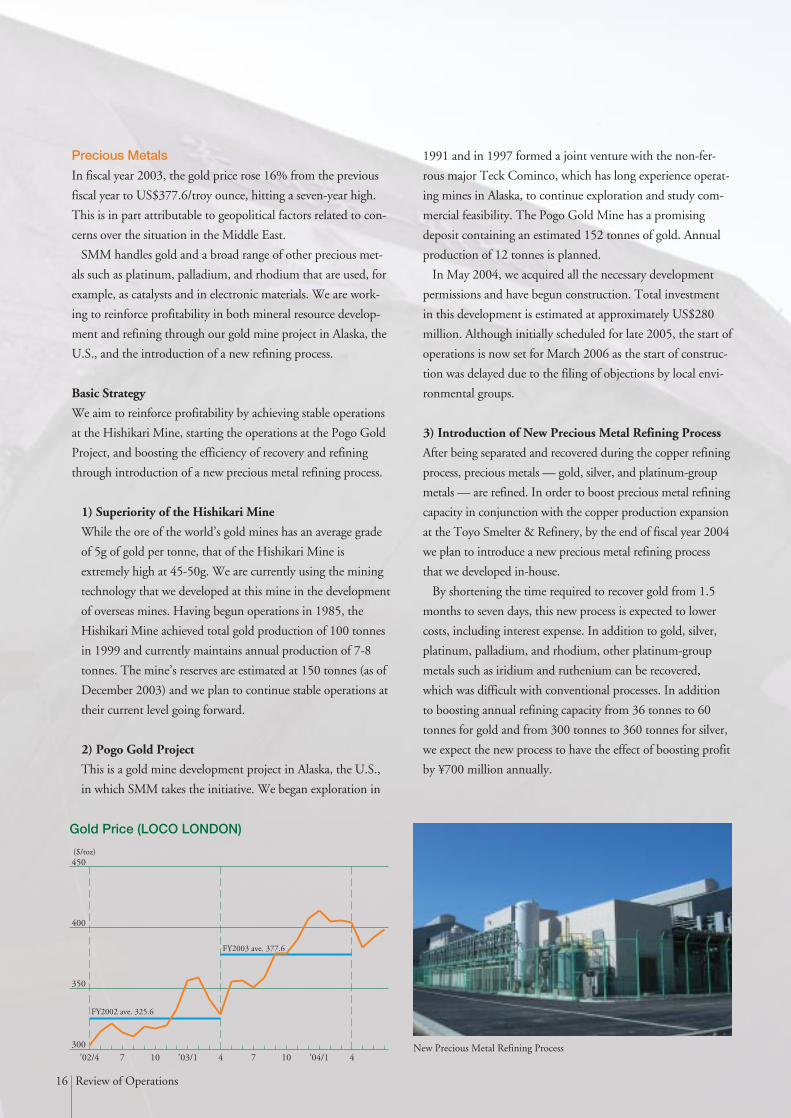
Precious Metals
In fiscal year 2003, the gold price rose 16% from the previous
fiscal year to US$377.6/troy ounce, hitting a seven-year high.
This is in part attributable to geopolitical factors related to con-
cerns over the situation in the Middle East.
SMM handles gold and a broad range of other precious met-
als such as platinum, palladium, and rhodium that are used, for
example, as catalysts and in electronic materials. We are work-
ing to reinforce profitability in both mineral resource develop-
ment and refining through our gold mine project in Alaska, the
U.S., and the introduction of a new refining process.
Basic Strategy
We aim to reinforce profitability by achieving stable operations
at the Hishikari Mine, starting the operations at the Pogo Gold
Project, and boosting the efficiency of recovery and refining
through introduction of a new precious metal refining process.
1) Superiority of the Hishikari Mine
While the ore of the world’s gold mines has an average grade
of 5g of gold per tonne, that of the Hishikari Mine is
extremely high at 45-50g. We are currently using the mining
technology that we developed at this mine in the development
of overseas mines. Having begun operations in 1985, the
Hishikari Mine achieved total gold production of 100 tonnes
in 1999 and currently maintains annual production of 7-8
tonnes. The mine’s reserves are estimated at 150 tonnes (as of
December 2003) and we plan to continue stable operations at
their current level going forward.
2) Pogo Gold Project
This is a gold mine development project in Alaska, the U.S.,
in which SMM takes the initiative. We began exploration in
1991 and in 1997 formed a joint venture with the non-fer-
rous major Teck Cominco, which has long experience operat-
ing mines in Alaska, to continue exploration and study com-
mercial feasibility. The Pogo Gold Mine has a promising
deposit containing an estimated 152 tonnes of gold. Annual
production of 12 tonnes is planned.
In May 2004, we acquired all the necessary development
permissions and have begun construction. Total investment
in this development is estimated at approximately US$280
million. Although initially scheduled for late 2005, the start of
operations is now set for March 2006 as the start of construc-
tion was delayed due to the filing of objections by local envi-
ronmental groups.
3) Introduction of New Precious Metal Refining Process
After being separated and recovered during the copper refining
process, precious metals — gold, silver, and platinum-group
metals — are refined. In order to boost precious metal refining
capacity in conjunction with the copper production expansion
at the Toyo Smelter & Refinery, by the end of fiscal year 2004
we plan to introduce a new precious metal refining process
that we developed in-house.
By shortening the time required to recover gold from 1.5
months to seven days, this new process is expected to lower
costs, including interest expense. In addition to gold, silver,
platinum, palladium, and rhodium, other platinum-group
metals such as iridium and ruthenium can be recovered,
which was difficult with conventional processes. In addition
to boosting annual refining capacity from 36 tonnes to 60
tonnes for gold and from 300 tonnes to 360 tonnes for silver,
we expect the new process to have the effect of boosting profit
by ¥700 million annually.
300
450
350
400
Gold Price (LOCO LONDON)
($/toz)
’02/4 7 10 ’03/1 4 7 10 ’04/1 4
FY2002 ave. 325.6
FY2003 ave. 377.6
New Precious Metal Refining Process

17Review of Operations
Electronics Materials and Advanced Materials
Results for Fiscal Year 2003
In fiscal year 2003, Electronics Materials and Advanced
Materials businesses benefited from the increase in sales vol-
ume as expansion of the digital home appliance market sup-
ported recovery in the semiconductor market. Net sales rose
7.3% from the previous fiscal year to ¥142.7 billion and oper-
ating income grew 36.3% to ¥5.6 billion.
Sales of the principal electronics material products were up
overall, supported by increases in bonding wire exports to
Taiwan and growth in electric paste and crystal materials sales.
Sales of advanced material products also increased mainly
because we reinforced copper-clad polyimide film production
capacity to meet the rapid growth in demand.
Basic Business Strategy
Under our previous Mid-term Management Plan, we sharp-
ened the focus of our core products, concentrating on the
materials field where we can leverage our strengths, and
improved our business structure by spinning off our IC pack-
aging materials business.
Products in this segment are exposed to severe price compe-
titions and short life cycles. In recognition of the difficulty of
surviving without a constant commitment to large market
shares, our new Mid-term Management Plan aims to achieve a
top-class global share for each of our products and to approxi-
mately double fiscal year 2003 consolidated operating income
to ¥12.6 billion by fiscal year 2006.
In the Electronics Materials business, we will aggressively
develop our business in the markets of Southeast Asia and
China, concentrating on core products such as bonding wire,
electric paste, and lead frames.
In the Advanced Materials business, while maintaining cop-
per-clad polyimide film as a mainstay, we will focus efforts on
Main Product by Product LinePackaging Materials Lead frame, tape materials etc.
Crystal Materials GaP, faraday rotator, optical isolator etc.
PWB Printed wiring board etc.
Electronics Materials Bonding wire, nickel paste etc.
Powder Materials Metal powder etc.
Circuit Board Materials Copper-clad polyimide film etc.
0
200
150
50
100
Net Sales by Product
Electronics Materials(Billions of yen)
FY2000 FY1999 FY2001 FY2002 FY2003
Packaging materials Crystal materials PWBElectronics materials Others
0
15
5
10
Advanced Materials(Billions of yen)
FY2000 FY1999 FY2001 FY2002 FY2003
Powder materials Functional materials Battery materialsCircuit board materials Magnet materials Others
Note: Net sales of electronics materials include in-house transactions.
18 Review of Operations
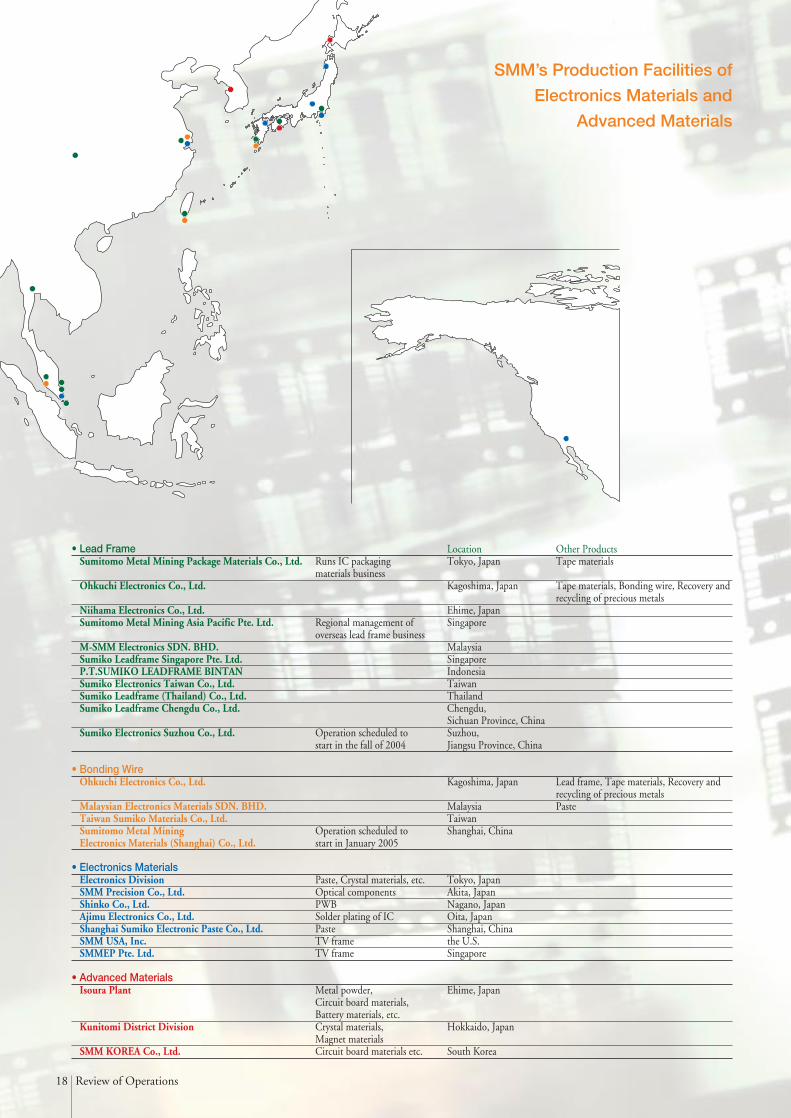
• Lead Frame Location Other ProductsSumitomo Metal Mining Package Materials Co., Ltd. Runs IC packaging Tokyo, Japan Tape materials
materials businessOhkuchi Electronics Co., Ltd. Kagoshima, Japan Tape materials, Bonding wire, Recovery and
recycling of precious metalsNiihama Electronics Co., Ltd. Ehime, JapanSumitomo Metal Mining Asia Pacific Pte. Ltd. Regional management of Singapore
overseas lead frame businessM-SMM Electronics SDN. BHD. MalaysiaSumiko Leadframe Singapore Pte. Ltd. SingaporeP.T.SUMIKO LEADFRAME BINTAN IndonesiaSumiko Electronics Taiwan Co., Ltd. TaiwanSumiko Leadframe (Thailand) Co., Ltd. ThailandSumiko Leadframe Chengdu Co., Ltd. Chengdu,
Sichuan Province, ChinaSumiko Electronics Suzhou Co., Ltd. Operation scheduled to Suzhou,
start in the fall of 2004 Jiangsu Province, China
• Bonding WireOhkuchi Electronics Co., Ltd. Kagoshima, Japan Lead frame, Tape materials, Recovery and
recycling of precious metalsMalaysian Electronics Materials SDN. BHD. Malaysia PasteTaiwan Sumiko Materials Co., Ltd. TaiwanSumitomo Metal Mining Operation scheduled to Shanghai, ChinaElectronics Materials (Shanghai) Co., Ltd. start in January 2005
• Electronics MaterialsElectronics Division Paste, Crystal materials, etc. Tokyo, JapanSMM Precision Co., Ltd. Optical components Akita, JapanShinko Co., Ltd. PWB Nagano, JapanAjimu Electronics Co., Ltd. Solder plating of IC Oita, JapanShanghai Sumiko Electronic Paste Co., Ltd. Paste Shanghai, ChinaSMM USA, Inc. TV frame the U.S.SMMEP Pte. Ltd. TV frame Singapore
• Advanced MaterialsIsoura Plant Metal powder, Ehime, Japan
Circuit board materials, Battery materials, etc.
Kunitomi District Division Crystal materials, Hokkaido, JapanMagnet materials
SMM KOREA Co., Ltd. Circuit board materials etc. South Korea
SMM’s Production Facilities of
Electronics Materials and
Advanced Materials

19Review of Operations
expanding sales of battery materials to reinforce our solid posi-
tion in the Hybrid Electric Vehicle (HEV) market and of our
light-blocking materials, which are attracting attention for
their property of cutting infrared light.
While the Electronics Materials and Advanced Materials
segment is forecast to benefit from expanding markets, sales
price declines and rapid changes in market and technology
trends are also possible. In setting the numerical targets in our
new Mid-term Management Plan, therefore, we took into
account these risk factors as well as previous product perform-
ances.
Bonding Wire
Bonding wire is used to connect the electrodes of semiconduc-
tor chips to lead frames. In high-density ICs, gold wire is gen-
erally used because of its superior workability and conductivi-
ty. While leveraging our advantage of being able to procure
gold in-house, we offer products that combine the high
strength and superior bonding characteristics required by
increasingly multi-pin, narrow-pitch ICs.
While the bonding wire market is expected to maintain an
annual growth rate of around 10%, prices are expected to fall
amid the competition with other manufacturers. To reinforce
our cost-competitiveness, we plan to shift production from
Japan to Malaysia and Taiwan and expand production capaci-
ty, mainly in Malaysia. To keep up with the expansion of the
China market, moreover, we are building a production base in
Shanghai, which we aim to bring on stream in January 2005.
By implementing these measures, we are aiming for a net
sales increase of 40% and an increase in global share from
25% to 30%in fiscal year 2006 compared with fiscal year
2003.
Electric Paste
Electric paste is widely used in the chip components installed
in electronic equipment such as mobile phones, personal com-
puters, and home appliances.
The nickel paste that we originated for the internal elec-
trodes of multilayer ceramic capacitors (MLCC) has been
especially well received by the market and has secured a large
share. By expanding sales of internal electrode paste and fully
entering the market for external electrode paste, we aim to
increase unit sales volume by 70% in fiscal year 2006 com-
pared with fiscal year 2003. In addition, we plan to launch
new high value-added products such as paste for plasma dis-
play panels (PDP), for which demand is expected to expand,
Bonding Wire Electric Paste

20 Review of Operations
and paste for white LEDs (light-emitting diodes).
By implementing these measures, we aim to increase net
sales by 50% in fiscal year 2006 compared with fiscal year
2003.
Lead Frames
Lead frames are metal frames that form the external leads for
semiconductor devices such as ICs and transistors. SMM has a
top 14% share of the global market.
IC packaging materials, including lead frames and tape
materials for film are handled by Sumitomo Metal Mining
Package Materials Co., Ltd., which takes responsibility for
operations at eight production sites in Japan and overseas
under its integrated management to supply the semiconductor
industries in Japan, South Korea, Taiwan, and China.
In China, in particular, the market is estimated to almost
triple in a few years, as many semiconductor assembly-related
businesses have, in rapid succession, moved into Shanghai and
the surrounding Huadong region. To cope with this demand,
we are building our second production site in China, in
Suzhou, Jiangsu Province. It is scheduled to come on stream
in the fall of 2004. In addition, we plan to expand sales by
focusing on commodity lead frames and high value-added
products such as lead-free products.
By implementing these measures, we aim to further solidify
our top global shares in lead frames and increase net sales by
35% in fiscal year 2006 compared with fiscal year 2003.
Copper-clad Polyimide Film
Copper-clad polyimide film is a flexible board material whose
main usage is in the chip-on-film (COF) boards that package
the ICs that drive LCDs. As their use expanded to LCD TVs
in fiscal year 2003, we expect demand to continue to grow
rapidly.
Our global share of copper-clad polyimide film in the COF
field for large-scale LCDs exceeds 90%. Going forward we
will enter the market for double-sided boards, whose usage in
mobile phones is expected to expand, and aim to achieve a
global share of at least 50%.
In fiscal year 2003, we doubled existing production capacity
to 1.2 million m2 in order to meet growth in orders received.
By introducing high-efficiency facilities, we plan to further
expand production capacity to 4.0 million m2 by fiscal year
2006.
By implementing these measures, we aim to triple net sales
by fiscal year 2006 compared with fiscal year 2003.
Lead Frames Copper-clad Polyimide Film
21Review of Operations
Other Businesses
Construction Materials Business
Radical Restructuring
In fiscal year 1999, we spun off our construction materials busi-
ness, whose main product is autoclaved lightweight concrete
(ALC), as Sumitomo Metal Mining Siporex Co., Ltd. We also
endeavored to improve its business structure by integrating its
five production sites into two by the end of fiscal year 2002.
Due to the impact of the prolonged construction slump, how-
ever, the Construction Materials segment posted a ¥400 million
operating loss in fiscal year 2002. In response to such situation,
in fiscal year 2003 Siporex radically restructured itself to make
its business sustainable by targeting a total cost reduction of
¥1.9 billion, which consists mainly of personnel reductions and
salary cuts. As a result, operating income of the Construction
Materials segment returned to the black (¥7 million) in fiscal
year 2003.
The full contribution from the effects of this radical restruc-
turing is expected to come through from fiscal year 2004.
Siporex will continue its efforts to improve profitability.
Environmental Business
Basic Strategy
While the environmental business is expected to enjoy market
growth, competition is also likely to become increasingly harsh
as many companies from various industries enter the market in
rapid succession. Given this context, we are promoting the recy-
cling business and the environmental improvement business
including the remediation of soil and groundwater contamina-
tion, where we can leverage the technologies that we have devel-
oped in our mineral resources and metals businesses over a peri-
od of many years. We are targeting net sales of ¥24.0 billion
from our environmental businesses overall in fiscal year 2006,
up 30% compared with fiscal year 2003.
Recycling Business
As part of our metals business, we recover zinc from the electric
arc furnace dust generated in steel production, copper and nickel
from the effluent produced by the plating process, and precious
metals from scrapped electronics materials.
Moreover, our group company Nippon Catalyst Cycle Co.,
Ltd. recovers valuable metals such as molybdenum and vanadi-
um from the used desulfured catalyst generated when oil is
refined. In fiscal year 2003, this company enhanced its annual
processing capacity from 12,000 tonnes to 15,000 tonnes,
achieving the equivalent of approximately 50% of the desulfured
catalyst generated domestically.
Environmental Improvement Business
Group companies under the integrated control of our Energy &
Environment Business Division and in collaboration with our
research laboratories are developing our environmental improve-
ment business. These group companies include Sumicon
Certech Co., Ltd, which provides assessment and remediation
services for soil and groundwater contamination; Sumiko Eco-
engineering Co., Ltd., which provides environment-related engi-
neering for fuel-gas treatment facilities and corrosion prevention
for harbor facilities; Sumiko Techno-Research Co., Ltd, which
focuses on environmental research and analysis; and Japan
Irradiation Service Co., Ltd., which provides radiation process-
ing for the sterilization of food packaging materials and medical
devices and for use in the modification of industrial materials.
Leveraging our catalyst technology, we developed a technology
for rendering nitrate-nitrogen and ammonium-nitrogen in plant
effluents harmless and marketed it as “N-free.” As stricter efflu-
ent processing regulations have heightened the market needs, we
are endeavoring to expand business by extending the application
of this technology to other substances such as fluorine.

Financial Section
Contents
Management’s Discussion and Analysis .................. 23
Eleven-Year Financial Summary ............................. 30
Consolidated Balance Sheets .................................. 32
Consolidated Statements of Operations ................. 34
Consolidated Statements of Shareholders’ Equity ... 35
Consolidated Statements of Cash Flows ................. 36
Notes to Consolidated Financial Statements .......... 37
Independent Auditor’s Report ................................ 52

23Management’s Discussion and Analysis
Management’s Discussion and Analysis
Overview of Businesses
In addition to itself, the businesses of Sumitomo Metal
Mining Co., Ltd. (SMM) include 66 subsidiaries and 14 affili-
ated companies. The three core segments of operations are:
1) Mineral Resources, which mines gold, silver, and copper;
2) Metals, which consists of the smelting business, centered on
gold, copper, nickel, and zinc, and the metal process busi-
ness, which manufactures copper elongation products; and
3) Electronics Materials and Advanced Materials, whose elec-
tronics materials business manufactures electronic compo-
nents such as IC packaging materials, crystal materials, and
printed circuit boards, and whose advanced materials busi-
ness manufactures nickel, palladium, and other metal pow-
ders and battery and magnetic materials.
In addition to these three core businesses there are the
Construction Materials segment, which manufactures Siporex
(autoclaved lightweight concrete, or ALC) and builds residen-
tial housing, and the Others segment, which runs a nuclear
power engineering business and an environmental business.
This Annual Report presents the consolidated results of the
Company, 40 domestic and overseas consolidated subsidiaries,
and six affiliates accounted for by the equity method.
Consolidated Statement of Income
Net Sales
Net sales in fiscal year 2003 (from April 1, 2003 to March 31,
2004) increased ¥46,889 million (13.2%) from the previous
fiscal year to ¥402,131 million (US$3,805 million). The
Metals segment accounted for 68.0% of net sales.
In fiscal year 2003, the non-ferrous metal industry was char-
acterized by higher prices into the second half for non-ferrous
metals such as copper and nickel thanks to strong demand and
production difficulties at major overseas producers. Although
the foreign exchange rate was stable in the first half, the yen
rapidly strengthened from late in the first half into the second
half. The electronics-related industry, meanwhile, enjoyed
strength in the digital home appliance market and in semicon-
ductor-related demand.
As a result, Mineral Resources segment sales increased ¥643
million to ¥25,315 million (US$ 240 million) from the previ-
ous fiscal year, due to higher overseas copper and gold prices
despite the decrease due to the strong yen impact. Metals seg-
ment sales grew ¥47,044 million to ¥273,387 million (US$
2,587 million) from the previous fiscal year, supported mainly
by higher prices for and sales growth in nickel and copper.
Electronics Materials and Advanced Materials sales rose
¥9,753 million to ¥142,676 million (US$ 1,350 million)
from the previous fiscal year on the back of overall growth in
sales of its main products.
0
500
100
200
300
400
Net Sales
(Billions of yen)
FY2000 FY1999 FY2001 FY2002 FY2003
402.1
355.2330.2
375.4360.3
0
5
10
15
20(%)
Gross Margin (right)
0
80
20
40
60
Gross Profit
(Billions of yen)
FY2000 FY1999 FY2001 FY2002 FY2003
45.1
12.5
16.9
11.6
14.613.463.4
38.2
51.8 53.7
0
2.5
5.0
7.5(%)
Operating Margin (right)
0
30
10
20
Oparating Income
(Billions of yen)
FY2000 FY1999 FY2001 FY2002 FY2003
9.0
2.5
7.2
0.3
4.7
5.7
26.9
1.1
16.6
22.8
-10
0
20
10
Net Income (Loss)
(Billions of yen)
FY2000 FY1999 FY2001 FY2002 FY2003
4.7
15.1
-6.6
-1.2
19.9
24 Management’s Discussion and Analysis
Cost and Expenses
Cost of sales in fiscal year 2003 increased ¥44,939 million
(14.8%) from the previous fiscal year to ¥348,417 (US$3,297
million). The gross margin decreased from 14.6% to 13.4%.
Sales, general, and administrative (SG&A) expenses
decreased ¥4,235 million from the previous fiscal year to
¥30,936 million (US$293 million). This is mainly attributa-
ble to a ¥3,458 million (34.0%) decrease in sales, transporta-
tion, and overhead expenses to ¥6,719 million.
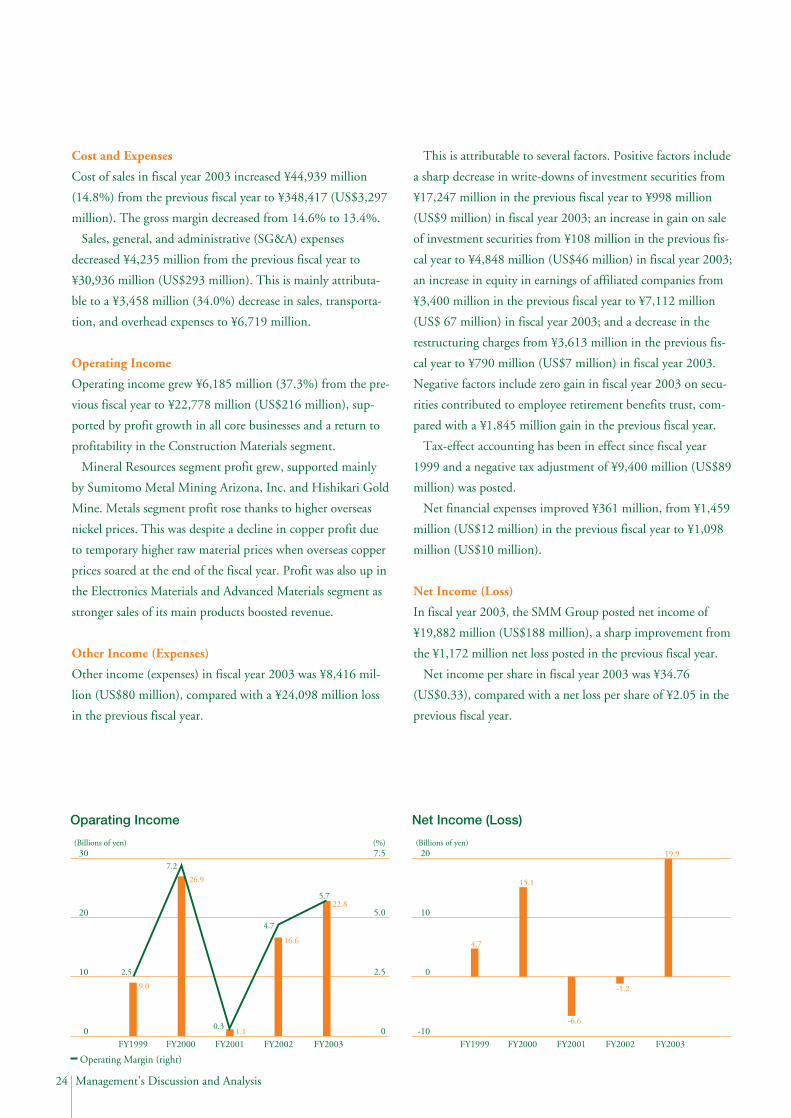
Operating Income
Operating income grew ¥6,185 million (37.3%) from the pre-
vious fiscal year to ¥22,778 million (US$216 million), sup-
ported by profit growth in all core businesses and a return to
profitability in the Construction Materials segment.
Mineral Resources segment profit grew, supported mainly
by Sumitomo Metal Mining Arizona, Inc. and Hishikari Gold
Mine. Metals segment profit rose thanks to higher overseas
nickel prices. This was despite a decline in copper profit due
to temporary higher raw material prices when overseas copper
prices soared at the end of the fiscal year. Profit was also up in
the Electronics Materials and Advanced Materials segment as
stronger sales of its main products boosted revenue.
Other Income (Expenses)
Other income (expenses) in fiscal year 2003 was ¥8,416 mil-
lion (US$80 million), compared with a ¥24,098 million loss
in the previous fiscal year.
This is attributable to several factors. Positive factors include
a sharp decrease in write-downs of investment securities from
¥17,247 million in the previous fiscal year to ¥998 million
(US$9 million) in fiscal year 2003; an increase in gain on sale
of investment securities from ¥108 million in the previous fis-
cal year to ¥4,848 million (US$46 million) in fiscal year 2003;
an increase in equity in earnings of affiliated companies from
¥3,400 million in the previous fiscal year to ¥7,112 million
(US$ 67 million) in fiscal year 2003; and a decrease in the
restructuring charges from ¥3,613 million in the previous fis-
cal year to ¥790 million (US$7 million) in fiscal year 2003.
Negative factors include zero gain in fiscal year 2003 on secu-
rities contributed to employee retirement benefits trust, com-
pared with a ¥1,845 million gain in the previous fiscal year.
Tax-effect accounting has been in effect since fiscal year
1999 and a negative tax adjustment of ¥9,400 million (US$89
million) was posted.
Net financial expenses improved ¥361 million, from ¥1,459
million (US$12 million) in the previous fiscal year to ¥1,098
million (US$10 million).
Net Income (Loss)
In fiscal year 2003, the SMM Group posted net income of
¥19,882 million (US$188 million), a sharp improvement from
the ¥1,172 million net loss posted in the previous fiscal year.
Net income per share in fiscal year 2003 was ¥34.76
(US$0.33), compared with a net loss per share of ¥2.05 in the
previous fiscal year.

106.15
123.90
133.25
120.20
105.69
100
140
110
130
120
Yen-Dollar Exchange Rate (Year-End)
(Yen / Dollar)
FY2000 FY1999 FY2001 FY2002 FY2003
25Management’s Discussion and Analysis
Impact of Exchange Rate Fluctuations
Non-ferrous metal profit is closely linked to foreign exchange
rates, which affect all phases of operations, from procurement
of ores to sales of finished products.
In general, a strong yen is a negative factor for SMM’s earn-
ings on a net basis. Although a strong yen has the advantage of
making ore procurement prices lower for SMM, it also leads
to lower finished product prices and a decrease of smelting
margins, which are usually denominated in U.S. dollars.
Although the foreign exchange rate was stable in the first
half, the yen rapidly strengthened from late in the first half
into the second half. As a result, the exchange rate for fiscal
year 2003 was US$1=¥105.69, compared with
US$1=¥121.94 in the previous fiscal year.
A strengthening of the Japanese currency by one yen against
the U.S. dollar therefore deteriorates non-consolidated gross
profit and operating income by ¥300 million.
Results by Business Segment
The following sections are based on segment data. Net sales
and operating income for each area include inter-segment
transactions.
Mineral Resources
Net sales in this segment increased ¥643 million (2.6%) from
the previous fiscal year to ¥25,315 million (US$240 million).
This is attributable to increased sales at Sumitomo Metal
Mining Arizona, Inc. due to higher overseas copper prices and
at our Hishikari Mine due to higher overseas gold prices,
despite the decrease resulting from the stronger yen.
Operating income increased ¥1,778 million (66.3%) from
the previous fiscal year to ¥4,460 million (US$42 million).
This is attributable to the profit growth at Sumitomo Metal
Mining Arizona, Inc. due to higher overseas copper prices and
the foreign exchange translation impact and at our Hishikari
Gold Mine due to higher gold prices.
Metals
Net sales in this segment increased ¥47,044 million (20.8%)
from the previous fiscal year to ¥273,387 million (US$2,587
million). This is mainly attributable to higher overseas prices
and increased sales volumes for copper, which benefited from
a recovery in domestic demand from the wire industry and the
copper elongation industry, and for nickel, which enjoyed vig-
orous demand for stainless and other special steels and strong
demand for semiconductor-related electronics materials.
Operating income increased ¥4,241 million (50.9%) to
¥12,567 million (US$119 million). This is attributable to
profit growth due in large part to higher overseas nickel prices,
despite a decline in copper profit due to temporary higher raw
material prices when overseas copper prices soared at the end
of the fiscal year.
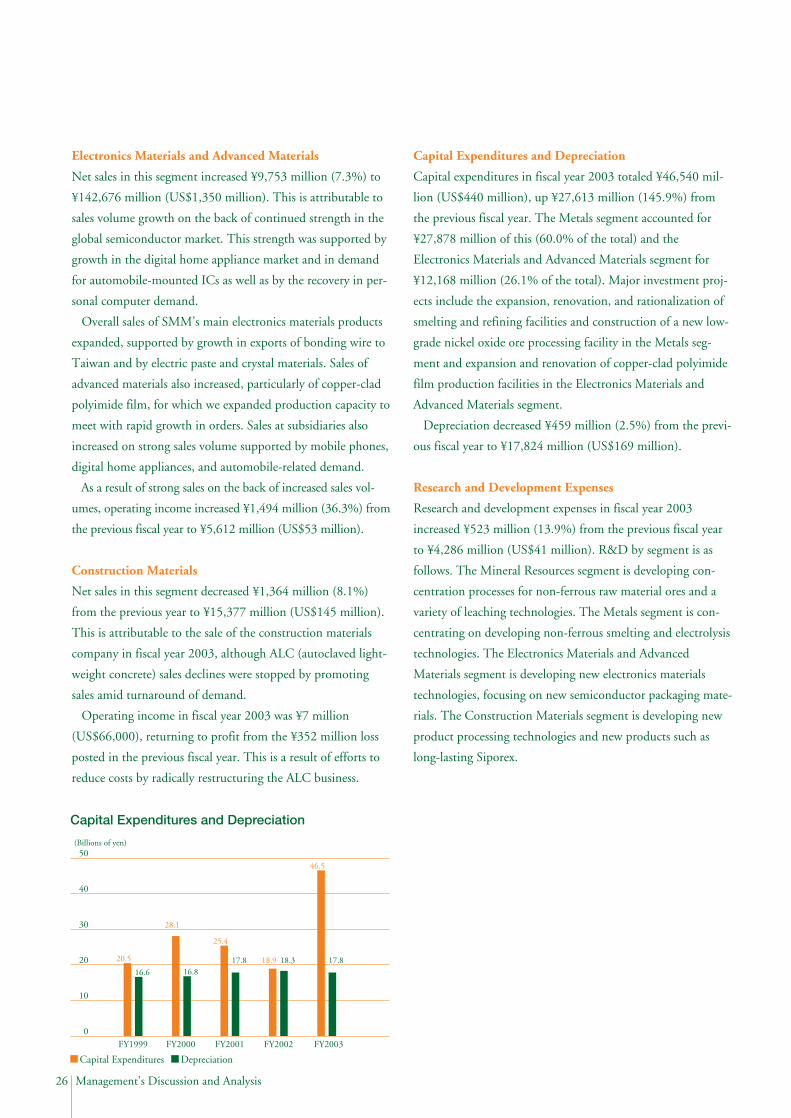
Capital Expenditures Depreciation
0
50
10
20
30
40
Capital Expenditures and Depreciation
(Billions of yen)
FY2000 FY1999 FY2001 FY2002 FY2003
20.5
16.6 16.817.8 18.3 17.8
28.1
25.4
18.9
46.5
26 Management’s Discussion and Analysis
Electronics Materials and Advanced Materials
Net sales in this segment increased ¥9,753 million (7.3%) to
¥142,676 million (US$1,350 million). This is attributable to
sales volume growth on the back of continued strength in the
global semiconductor market. This strength was supported by
growth in the digital home appliance market and in demand
for automobile-mounted ICs as well as by the recovery in per-
sonal computer demand.
Overall sales of SMM’s main electronics materials products
expanded, supported by growth in exports of bonding wire to
Taiwan and by electric paste and crystal materials. Sales of
advanced materials also increased, particularly of copper-clad
polyimide film, for which we expanded production capacity to
meet with rapid growth in orders. Sales at subsidiaries also
increased on strong sales volume supported by mobile phones,
digital home appliances, and automobile-related demand.
As a result of strong sales on the back of increased sales vol-
umes, operating income increased ¥1,494 million (36.3%) from
the previous fiscal year to ¥5,612 million (US$53 million).
Construction Materials
Net sales in this segment decreased ¥1,364 million (8.1%)
from the previous year to ¥15,377 million (US$145 million).
This is attributable to the sale of the construction materials
company in fiscal year 2003, although ALC (autoclaved light-
weight concrete) sales declines were stopped by promoting
sales amid turnaround of demand.
Operating income in fiscal year 2003 was ¥7 million
(US$66,000), returning to profit from the ¥352 million loss
posted in the previous fiscal year. This is a result of efforts to
reduce costs by radically restructuring the ALC business.
Capital Expenditures and Depreciation
Capital expenditures in fiscal year 2003 totaled ¥46,540 mil-
lion (US$440 million), up ¥27,613 million (145.9%) from
the previous fiscal year. The Metals segment accounted for
¥27,878 million of this (60.0% of the total) and the
Electronics Materials and Advanced Materials segment for
¥12,168 million (26.1% of the total). Major investment proj-
ects include the expansion, renovation, and rationalization of
smelting and refining facilities and construction of a new low-
grade nickel oxide ore processing facility in the Metals seg-
ment and expansion and renovation of copper-clad polyimide
film production facilities in the Electronics Materials and
Advanced Materials segment.
Depreciation decreased ¥459 million (2.5%) from the previ-
ous fiscal year to ¥17,824 million (US$169 million).
Research and Development Expenses
Research and development expenses in fiscal year 2003
increased ¥523 million (13.9%) from the previous fiscal year
to ¥4,286 million (US$41 million). R&D by segment is as
follows. The Mineral Resources segment is developing con-
centration processes for non-ferrous raw material ores and a
variety of leaching technologies. The Metals segment is con-
centrating on developing non-ferrous smelting and electrolysis
technologies. The Electronics Materials and Advanced
Materials segment is developing new electronics materials
technologies, focusing on new semiconductor packaging mate-
rials. The Construction Materials segment is developing new
product processing technologies and new products such as
long-lasting Siporex.
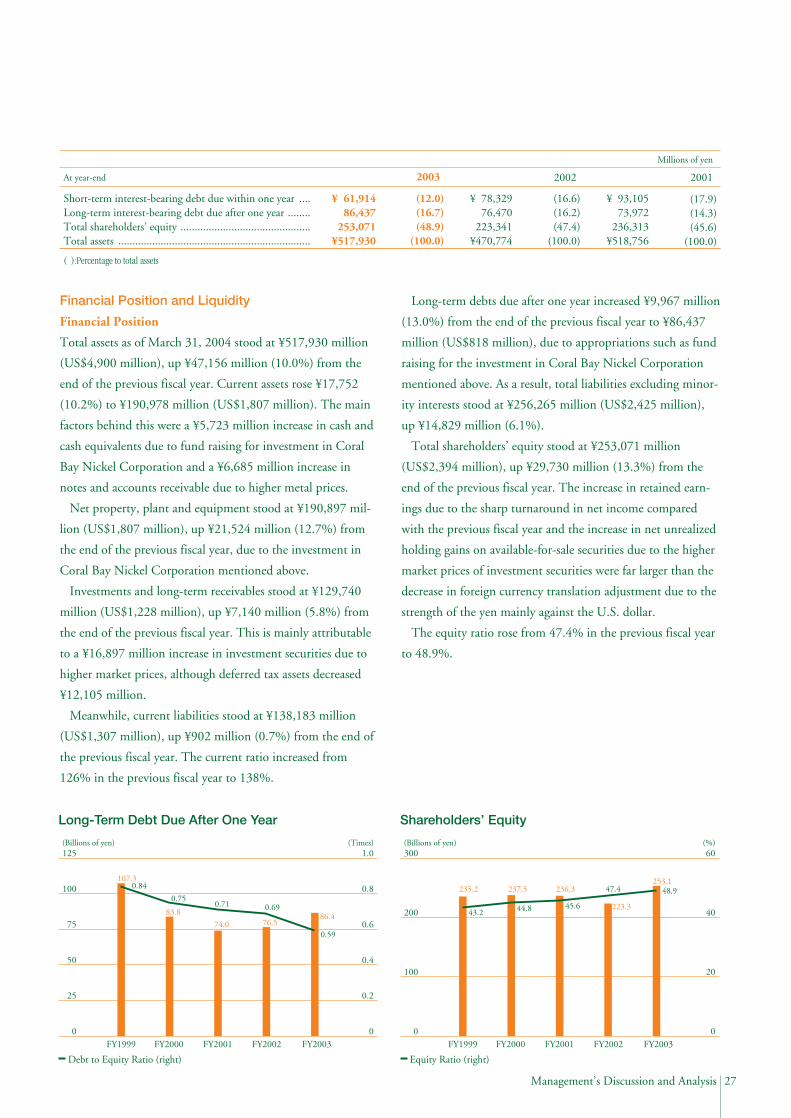
0
0.6
0.8
1.0(Times)
Debt to Equity Ratio (right)
0
125
75
0.450
0.225
100
Long-Term Debt Due After One Year
(Billions of yen)
FY2000 FY1999 FY2001 FY2002 FY2003
107.3
83.8
74.0 76.586.4
0.84
0.750.71 0.69
0.59
0
300
100
200
Shareholders’ Equity
(Billions of yen)
FY2000 FY1999 FY2001 FY2002 FY2003
235.2 237.5 236.3
223.3
253.1
Equity Ratio (right)
0
40
60(%)
20
43.2 44.8 45.6
47.4 48.9
27Management’s Discussion and Analysis
Financial Position and Liquidity
Financial Position
Total assets as of March 31, 2004 stood at ¥517,930 million
(US$4,900 million), up ¥47,156 million (10.0%) from the
end of the previous fiscal year. Current assets rose ¥17,752
(10.2%) to ¥190,978 million (US$1,807 million). The main
factors behind this were a ¥5,723 million increase in cash and
cash equivalents due to fund raising for investment in Coral
Bay Nickel Corporation and a ¥6,685 million increase in
notes and accounts receivable due to higher metal prices.
Net property, plant and equipment stood at ¥190,897 mil-
lion (US$1,807 million), up ¥21,524 million (12.7%) from
the end of the previous fiscal year, due to the investment in
Coral Bay Nickel Corporation mentioned above.
Investments and long-term receivables stood at ¥129,740
million (US$1,228 million), up ¥7,140 million (5.8%) from
the end of the previous fiscal year. This is mainly attributable
to a ¥16,897 million increase in investment securities due to
higher market prices, although deferred tax assets decreased
¥12,105 million.
Meanwhile, current liabilities stood at ¥138,183 million
(US$1,307 million), up ¥902 million (0.7%) from the end of
the previous fiscal year. The current ratio increased from
126% in the previous fiscal year to 138%.
Long-term debts due after one year increased ¥9,967 million
(13.0%) from the end of the previous fiscal year to ¥86,437
million (US$818 million), due to appropriations such as fund
raising for the investment in Coral Bay Nickel Corporation
mentioned above. As a result, total liabilities excluding minor-
ity interests stood at ¥256,265 million (US$2,425 million),
up ¥14,829 million (6.1%).
Total shareholders’ equity stood at ¥253,071 million
(US$2,394 million), up ¥29,730 million (13.3%) from the
end of the previous fiscal year. The increase in retained earn-
ings due to the sharp turnaround in net income compared
with the previous fiscal year and the increase in net unrealized
holding gains on available-for-sale securities due to the higher
market prices of investment securities were far larger than the
decrease in foreign currency translation adjustment due to the
strength of the yen mainly against the U.S. dollar.
The equity ratio rose from 47.4% in the previous fiscal year
to 48.9%.
Millions of yen
At year-end 20012002
Short-term interest-bearing debt due within one year ....Long-term interest-bearing debt due after one year ........Total shareholders’ equity ..............................................Total assets ....................................................................
2003
(17.9)(14.3)(45.6)
(100.0)
¥ 93,10573,972
236,313¥518,756
(16.6)(16.2)(47.4)
(100.0)
¥ 78,32976,470
223,341¥470,774
(12.0)(16.7)(48.9)
(100.0)
¥ 61,91486,437
253,071¥517,930
( ):Percentage to total assets
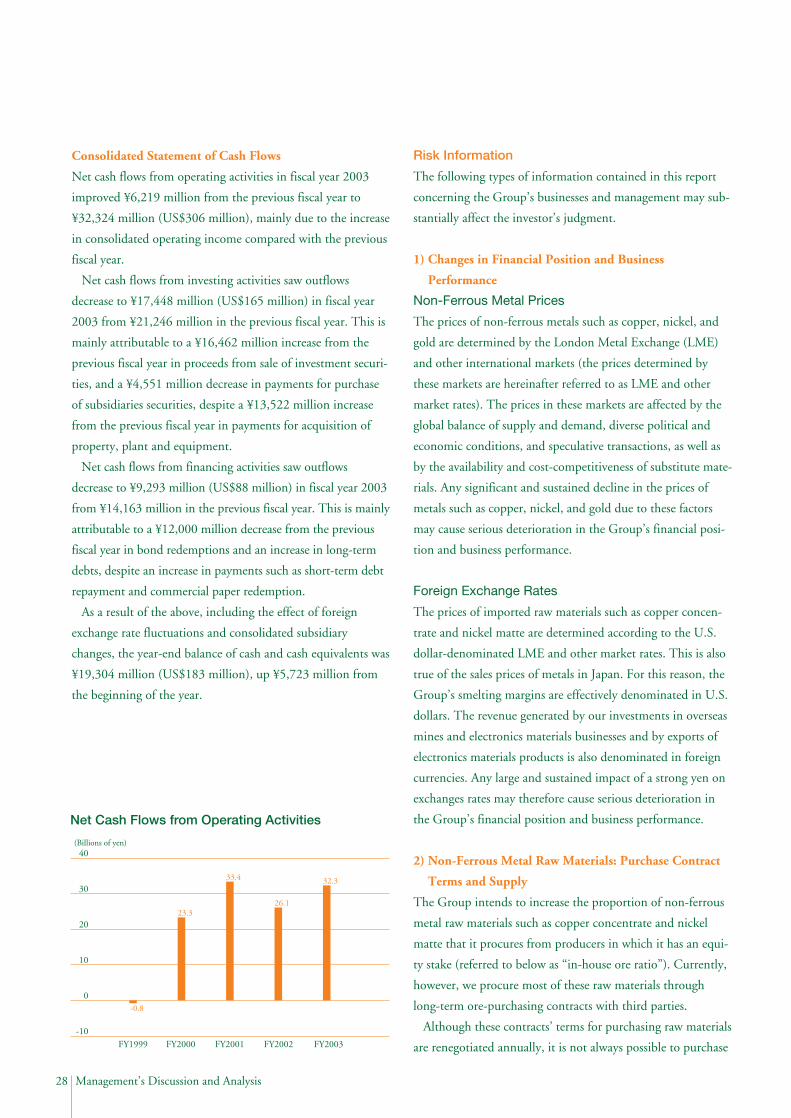
-10
0
40
10
20
30
Net Cash Flows from Operating Activities
(Billions of yen)
FY2000 FY1999 FY2001 FY2002 FY2003
23.3
33.4
26.1
32.3
-0.8
28 Management’s Discussion and Analysis
Consolidated Statement of Cash Flows
Net cash flows from operating activities in fiscal year 2003
improved ¥6,219 million from the previous fiscal year to
¥32,324 million (US$306 million), mainly due to the increase
in consolidated operating income compared with the previous
fiscal year.
Net cash flows from investing activities saw outflows
decrease to ¥17,448 million (US$165 million) in fiscal year
2003 from ¥21,246 million in the previous fiscal year. This is
mainly attributable to a ¥16,462 million increase from the
previous fiscal year in proceeds from sale of investment securi-
ties, and a ¥4,551 million decrease in payments for purchase
of subsidiaries securities, despite a ¥13,522 million increase
from the previous fiscal year in payments for acquisition of
property, plant and equipment.
Net cash flows from financing activities saw outflows
decrease to ¥9,293 million (US$88 million) in fiscal year 2003
from ¥14,163 million in the previous fiscal year. This is mainly
attributable to a ¥12,000 million decrease from the previous
fiscal year in bond redemptions and an increase in long-term
debts, despite an increase in payments such as short-term debt
repayment and commercial paper redemption.
As a result of the above, including the effect of foreign
exchange rate fluctuations and consolidated subsidiary
changes, the year-end balance of cash and cash equivalents was
¥19,304 million (US$183 million), up ¥5,723 million from
the beginning of the year.
Risk Information
The following types of information contained in this report
concerning the Group’s businesses and management may sub-
stantially affect the investor’s judgment.
1) Changes in Financial Position and Business
Performance
Non-Ferrous Metal Prices
The prices of non-ferrous metals such as copper, nickel, and
gold are determined by the London Metal Exchange (LME)
and other international markets (the prices determined by
these markets are hereinafter referred to as LME and other
market rates). The prices in these markets are affected by the
global balance of supply and demand, diverse political and
economic conditions, and speculative transactions, as well as
by the availability and cost-competitiveness of substitute mate-
rials. Any significant and sustained decline in the prices of
metals such as copper, nickel, and gold due to these factors
may cause serious deterioration in the Group’s financial posi-
tion and business performance.
Foreign Exchange Rates
The prices of imported raw materials such as copper concen-
trate and nickel matte are determined according to the U.S.
dollar-denominated LME and other market rates. This is also
true of the sales prices of metals in Japan. For this reason, the
Group’s smelting margins are effectively denominated in U.S.
dollars. The revenue generated by our investments in overseas
mines and electronics materials businesses and by exports of
electronics materials products is also denominated in foreign
currencies. Any large and sustained impact of a strong yen on
exchanges rates may therefore cause serious deterioration in
the Group’s financial position and business performance.
2) Non-Ferrous Metal Raw Materials: Purchase Contract
Terms and Supply
The Group intends to increase the proportion of non-ferrous
metal raw materials such as copper concentrate and nickel
matte that it procures from producers in which it has an equi-
ty stake (referred to below as “in-house ore ratio”). Currently,
however, we procure most of these raw materials through
long-term ore-purchasing contracts with third parties.
Although these contracts’ terms for purchasing raw materials
are renegotiated annually, it is not always possible to purchase
29Management’s Discussion and Analysis
the required amounts at reasonable prices due to a variety of
market factors. Moreover, as product prices are largely deter-
mined by factors directly related to the non-ferrous metals
themselves such as supply and demand, it is generally difficult
to shift deterioration in raw material purchasing terms to
product prices.
In addition, raw material supply can be delayed or suspend-
ed due to uncontrollable factors such as bad weather, major
earthquakes, operational accidents, and labor disputes. Any
constraint on the Group’s production due to these factors may
impact its financial position and business performance.
3) Uncertainties of Mining Investment
Despite the Group’s aforementioned policy of investing in
mines in order to boost the in-house ore ratio, however,
minable reserves and mining costs may prove to differ from
prospecting-based estimates, impairing the expected return on
investment. In mine development, a variety of factors includ-
ing environmental administration procedures may delay the
start of production and increase development costs.
Additional investment or higher mining costs resulting from
these uncertainties inherent in mining investment may impact
the Group’s financial position and business performance.
4) Environmental Protection Compliance
The environmental laws of Japan and other countries have a
significant impact on how the Group, and the Mineral
Resources and Metals segments in particular, conducts its
business. These environmental laws can require a business to
pay compensation whether or not it was at fault and to pay to
maintain and manage mines after they have been closed down.
In addition, mine development and mine operations are sub-
ject to a broad range of laws including those regulating worker
safety, worker hygiene, environmental protection, prevention
of pollution caused by mining, mine waste product process-
ing, and toxic substance management. The mining business
also bears the risks and liabilities associated with environmen-
tal pollution and mine waste products. The substantial costs
and potential liabilities of running a mining business in com-
pliance with these laws can push the necessary expenditure
above provisioned amounts.
5) Market Volatility, New Product Development, and
Intellectual Property Protection
The markets targeted by the Group’s Electronics Materials and
Advanced Materials segment are characterized by rapid changes
in technologies used, customer requirements, and product life
cycles on the one hand, and the need for large investments of
funds and human resources due to the longer time required to
develop new products on the other. In addition, when an exist-
ing product is outmoded by technological advances, when the
new product fails to meet changing customer requirements, and
when a competitor launches a similar product first, returns on
the investment may fall short of plan. In the Electronics
Materials and Advanced Materials segment in particular, there-
fore, problems with predicting and dealing with technological
advances and changes, meeting customer requirements, and
launching new products can cause serious deterioration in the
Group’s financial position and business performance.
The sales volumes of the Electronics Materials and Advanced
Materials segment’s main products depend on the levels at which
our clients produce mobile phones, personal computers, home
appliances, and other products and vary according to factors
such as cyclical changes in demand for the clients’ products,
technological innovation, and general economic trends. Any
future decline in demand for products due to these factors can
impact the Group’s financial position and business performance.
Recognizing the importance of acquiring and managing intel-
lectual property rights, the Group takes all the legal measures
required for claiming and protecting them. As it is not always
possible to establish secure measures to protect intellectual prop-
erty rights, however, disputes with third parties and unautho-
rized implementations by third parties can threaten our benefit-
ing from the results of our research and development.
6) International Operations
The Group is developing its businesses internationally by locat-
ing production bases and seeking markets for its products over-
seas. These overseas activities are subject to political and eco-
nomic risks in each country, including 1) political instability, 2)
changes in laws and regulations governing the environment,
labor, taxes, currency exchange, and trade, 3) limited legal pro-
tection of intellectual property rights or inadequate enforcement,
4) foreign exchange volatility, and 5) confiscation or nationaliza-
tion of assets. Any of these could prevent the Group from
achieving a return on its investment.
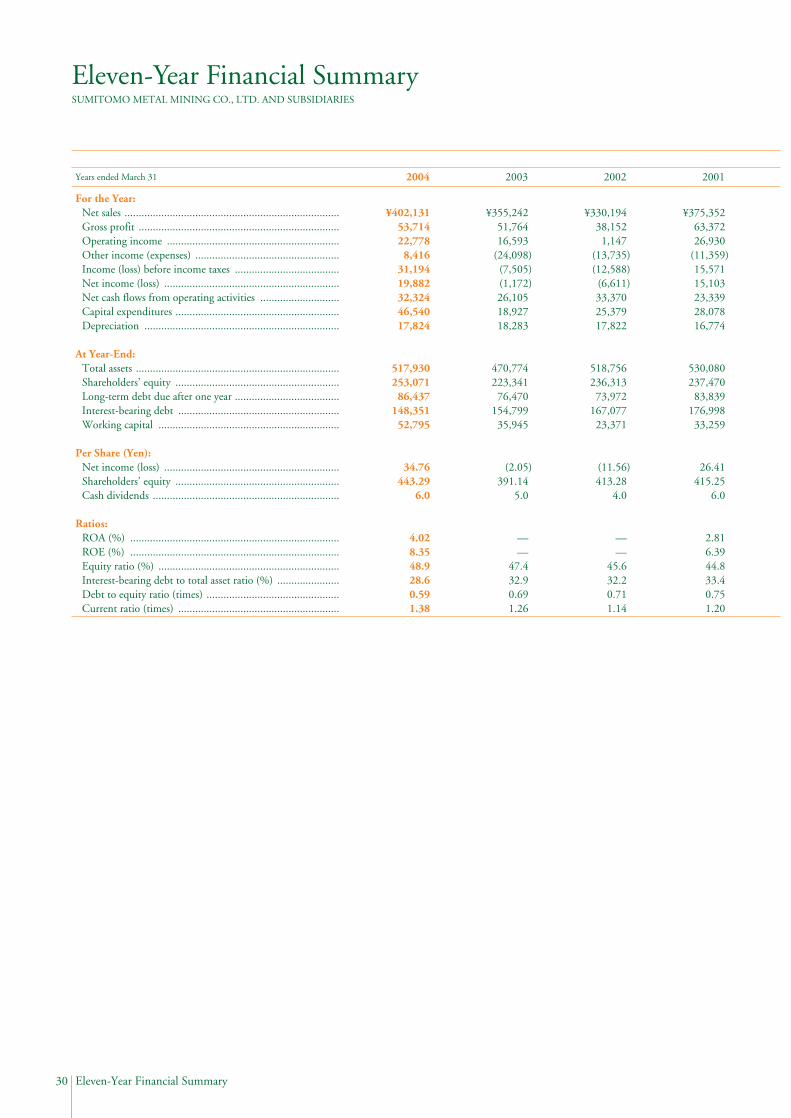
30 Eleven-Year Financial Summary
Eleven-Year Financial SummarySUMITOMO METAL MINING CO., LTD. AND SUBSIDIARIES
For the Year:Net sales ............................................................................Gross profit .......................................................................Operating income .............................................................Other income (expenses) ...................................................Income (loss) before income taxes .....................................Net income (loss) ..............................................................Net cash flows from operating activities ............................Capital expenditures ..........................................................Depreciation .....................................................................
At Year-End:Total assets ........................................................................Shareholders’ equity ..........................................................Long-term debt due after one year .....................................Interest-bearing debt .........................................................Working capital ................................................................
Per Share (Yen):Net income (loss) ..............................................................Shareholders’ equity ..........................................................Cash dividends ..................................................................
Ratios:ROA (%) ..........................................................................ROE (%) ..........................................................................Equity ratio (%) ................................................................Interest-bearing debt to total asset ratio (%) ......................Debt to equity ratio (times) ...............................................Current ratio (times) .........................................................
Years ended March 31 2001
¥375,35263,372 26,930
(11,359)15,571 15,103 23,339 28,078 16,774
530,080237,470
83,839176,998
33,259
26.41 415.25
6.0
2.816.3944.833.40.751.20
2002
¥330,19438,152
1,147 (13,735)(12,588)
(6,611)33,370 25,379 17,822
518,756236,313
73,972167,077
23,371
(11.56)413.28
4.0
——
45.632.20.711.14
2003
¥355,24251,764 16,593
(24,098)(7,505)(1,172)26,105 18,927 18,283
470,774223,341
76,470154,799
35,945
(2.05)391.14
5.0
——
47.432.90.691.26
2004
¥402,13153,714 22,778
8,416 31,194 19,882 32,324 46,540 17,824
517,930253,071
86,437148,351
52,795
34.76 443.29
6.0
4.028.3548.928.60.591.38

31Eleven-Year Financial Summary
Millions of yen (unless otherwise specified)
1994
¥446,71228,914 (3,934)3,543 (391)
1,902 17,780
—20,522
594,982210,902228,255281,073131,644
3.49 379.32
5.0
0.310.9735.447.21.332.02
1995
¥464,84340,262
5,169 (2,384)2,7851,292
721 —
20,917
591,446205,940197,884277,289101,110
2.32 370.17
5.0
0.220.6234.846.91.351.63
1996
¥511,88755,90419,947(7,553)12,39410,683
6,10025,72219,889
624,419225,296171,596285,871104,854
19.18398.35
6.0
1.764.9536.145.81.271.53
1997
¥525,07657,83621,665(4,294)14,61712,88443,13524,73020,702
586,948238,056117,021224,736
62,726
22.65 417.20
6.0
2.135.5640.638.30.941.31
1998
¥431,95062,641 24,622 (3,605)16,876 10,157 43,056 27,968 21,638
566,088243,436
82,356201,515
26,529
17.77425.68
6.0
1.764.2243.035.60.831.13
1999
¥350,28841,190
858 (12,932)(12,074)(12,495)22,912 32,499 23,095
544,519226,795124,535207,821
50,518
(21.85)396.59
3.0
——
41.738.20.921.31
2000
¥360,29945,061
8,990 (4,342)4,648 4,740 (800)
20,490 16,611
544,121235,231107,266197,624
38,910
8.29 411.34
5.0
0.872.0543.236.30.841.23

32 Consolidated Balance Sheets
Consolidated Balance SheetsSUMITOMO METAL MINING CO., LTD. AND SUBSIDIARIES
Current assets: Cash and cash equivalents ....................................................................................................................Time deposits ......................................................................................................................................Receivables:
Notes and accounts receivable (Notes 6 ): Trade ............................................................................................................................................Non-consolidated subsidiaries and affiliated companies ................................................................
Loans and others: Non-consolidated subsidiaries and affiliated companies ................................................................Other ............................................................................................................................................
Allowance for doubtful accounts ......................................................................................................Inventories (Note 5) ............................................................................................................................Deferred tax assets (Note 7) .................................................................................................................Other current assets .............................................................................................................................
Total current assets ....................................................................................................................
Investments and long-term receivables: Investment securities (Notes 3 and 6):
Non-consolidated subsidiaries and affiliated companies ...................................................................Other ...............................................................................................................................................
Allowance for loss on investments ........................................................................................................Loans:
Non-consolidated subsidiaries and affiliated companies ...................................................................Other ...............................................................................................................................................
Other long-term receivables .................................................................................................................Allowance for doubtful accounts ..........................................................................................................
Property, plant and equipment (Note 6): Land ....................................................................................................................................................Buildings and structures .......................................................................................................................Machinery and equipment ...................................................................................................................Construction in progress ......................................................................................................................
Accumulated depreciation ....................................................................................................................Net property, plant and equipment ...........................................................................................
Deferred tax assets (Note 7) .................................................................................................................Other assets ...........................................................................................................................................
Thousands ofU.S. dollars
(Note1)Millions of yen
As of March 31, 2004 and 2003 200420032004
ASSETS
The accompanying notes are an integral part of those balance sheets.
$ 182,6474,248
607,41819,046
79,43185,353
(11,534)615,04441,925
183,3861,806,964
614,420580,670
(5,251)
1,9216,727
27,476(4,485)
1,221,478
291,2291,176,9332,508,515
208,7804,185,457
(2,379,260)1,806,197
6,07459,751
$ 4,900,464
¥ 13,581448
57,5132,135
5,7704,480
(1,139)68,004
7,03515,399
173,226
66,03542,169(1,369)
303825
3,408(1,518)
109,853
31,292127,428259,809
4,289422,818
(253,445)169,373
12,7475,575
¥ 470,774
¥ 19,304449
64,1982,013
8,3959,021
(1,219)65,004
4,43119,382
190,978
64,93861,371
(555)
203711
2,904(474)
129,098
30,780124,390265,125
22,066442,361
(251,464)190,897
6426,315
¥ 517,930
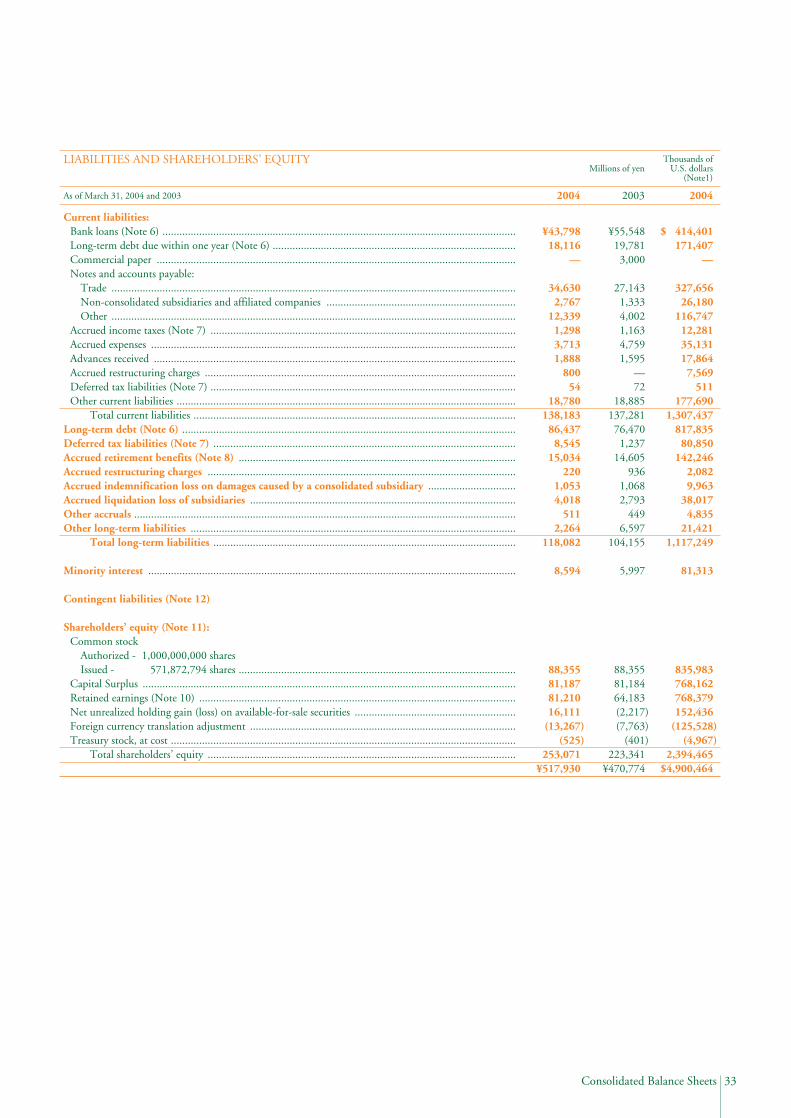
33Consolidated Balance Sheets
Current liabilities:Bank loans (Note 6) .............................................................................................................................Long-term debt due within one year (Note 6) ......................................................................................Commercial paper ...............................................................................................................................Notes and accounts payable:
Trade ...............................................................................................................................................Non-consolidated subsidiaries and affiliated companies ...................................................................Other ...............................................................................................................................................
Accrued income taxes (Note 7) ............................................................................................................Accrued expenses .................................................................................................................................Advances received ................................................................................................................................Accrued restructuring charges ..............................................................................................................Deferred tax liabilities (Note 7) ............................................................................................................Other current liabilities ........................................................................................................................
Total current liabilities ..................................................................................................................Long-term debt (Note 6) ......................................................................................................................Deferred tax liabilities (Note 7) ...........................................................................................................Accrued retirement benefits (Note 8) ..................................................................................................Accrued restructuring charges .............................................................................................................Accrued indemnification loss on damages caused by a consolidated subsidiary ...............................Accrued liquidation loss of subsidiaries ..............................................................................................Other accruals .......................................................................................................................................Other long-term liabilities ...................................................................................................................
Total long-term liabilities ...........................................................................................................
Minority interest ..................................................................................................................................
Contingent liabilities (Note 12)
Shareholders’ equity (Note 11):Common stock
Authorized - 1,000,000,000 sharesIssued - 571,872,794 shares ..................................................................................................
Capital Surplus ....................................................................................................................................Retained earnings (Note 10) ................................................................................................................Net unrealized holding gain (loss) on available-for-sale securities .........................................................Foreign currency translation adjustment ..............................................................................................Treasury stock, at cost ..........................................................................................................................
Total shareholders’ equity .............................................................................................................
Thousands ofU.S. dollars
(Note1)Millions of yen
As of March 31, 2004 and 2003 200420032004
LIABILITIES AND SHAREHOLDERS’ EQUITY
$ 414,401171,407
—
327,65626,180
116,74712,28135,13117,8647,569
511177,690
1,307,437817,835
80,850142,246
2,0829,963
38,0174,835
21,4211,117,249
81,313
835,983768,162768,379152,436
(125,528)(4,967)
2,394,465$4,900,464
¥55,54819,781
3,000
27,1431,3334,0021,1634,7591,595
—72
18,885137,281
76,4701,237
14,605936
1,0682,793
4496,597
104,155
5,997
88,35581,18464,183(2,217)(7,763)
(401)223,341
¥470,774
¥43,79818,116
—
34,6302,767
12,3391,2983,7131,888
80054
18,780138,183
86,4378,545
15,034220
1,0534,018
5112,264
118,082
8,594
88,35581,18781,21016,111
(13,267)(525)
253,071¥517,930

34 Consolidated Statements of Operations
Consolidated Statements of OperationsSUMITOMO METAL MINING CO., LTD. AND SUBSIDIARIES
Net sales (Note 13) ........................................................................................................Costs and expenses (Note 13):
Cost of sales ..................................................................................................................Selling, general and administrative (Note 9) ..................................................................
Operating income (Note 13) .........................................................................................Other income (expenses):
Interest and dividend income ........................................................................................Interest expense .............................................................................................................Gain on sale of investment securities .............................................................................Write-down of investment securities .............................................................................Write-down of subsidiary securities ...............................................................................Gain (Loss) on sale and disposal of property, plant and equipment ...............................Gain on securities contributed to employee retirement benefits trust ............................Loss on liquidation of subsidiaries .................................................................................Reversal of allowance (provision) for doubtful account .................................................Reversal of allowance (provision) for loss on investments ..............................................Exchange gain (loss) ......................................................................................................Restructuring charges ....................................................................................................Loss from realignment of operations .............................................................................Maintenance cost for ceased projects .............................................................................Loss from suspension of operating activity of a consolidated subsidiary .........................Loss from disposal of inventories ...................................................................................Write-off of obsolete inventories ...................................................................................Casualty loss .................................................................................................................Loss on sales of securities of an affiliated company ........................................................Gain from valuation of derivative instruments ..............................................................Amortization of consolidation difference .......................................................................Equity in earnings of affiliated companies ......................................................................Other, net .....................................................................................................................
Income (Loss) before income taxes and minority interests .........................................Income taxes (Note 7):
Current .........................................................................................................................Deferred ........................................................................................................................
Minority interests in net income (loss) of consolidated subsidiaries ..........................Net income (loss) .........................................................................................................
Thousands ofU.S. dollars
(Note1)Millions of yen
Years ended March 31, 2004, 2003 and 2002 2004200220032004
$3,804,816
3,296,594292,705
3,589,299215,517
9,679(20,068)45,870(9,443)
—16,520
—(10,701)
6,7182,564
(6,074)(7,475)(6,812)(7,049)
———
(1,022)(3,406)12,111
30367,291(9,377)79,629
295,146
12,58488,939
101,523193,623
(5,507)$ 188,116
¥330,194
292,04237,005
329,0471,147
1,700(3,475)
958(8,431)
(335)3,370
—(1,341)
(510)(424)319
(857)(3,434)
—(1,144)
(777)—
(442)—25
1291,535(601)
(13,735)(12,588)
437(5,968)(5,531)(7,057)
446¥ (6,611)
¥355,242
303,47835,171
338,64916,593
1,074(2,533)
108(17,247)
—(766)
1,845—
(851)(301)(838)
(3,613)(225)
—(990)(398)
(1,391)—
(465)240
493,400
(1,196)(24,098)
(7,505)
329(6,755)(6,426)(1,079)
(93)¥ (1,172)
¥402,131
348,41730,936
379,35322,778
1,023(2,121)4,848(998)
—1,746
—(1,131)
710271
(642)(790)(720)(745)
———
(108)(360)
1,28032
7,112(991)
8,41631,194
1,3309,400
10,73020,464
(582)¥ 19,882
Amounts per share of common stock:Net income (loss) ..........................................................................................................Cash dividends applicable to the year ............................................................................
$ 0.33 0.06
¥ (11.56)4.00
¥ (2.05)5.00
¥ 34.766.00
U.S. dollars(Note1)yen
The accompanying notes are an integral part of those statements.
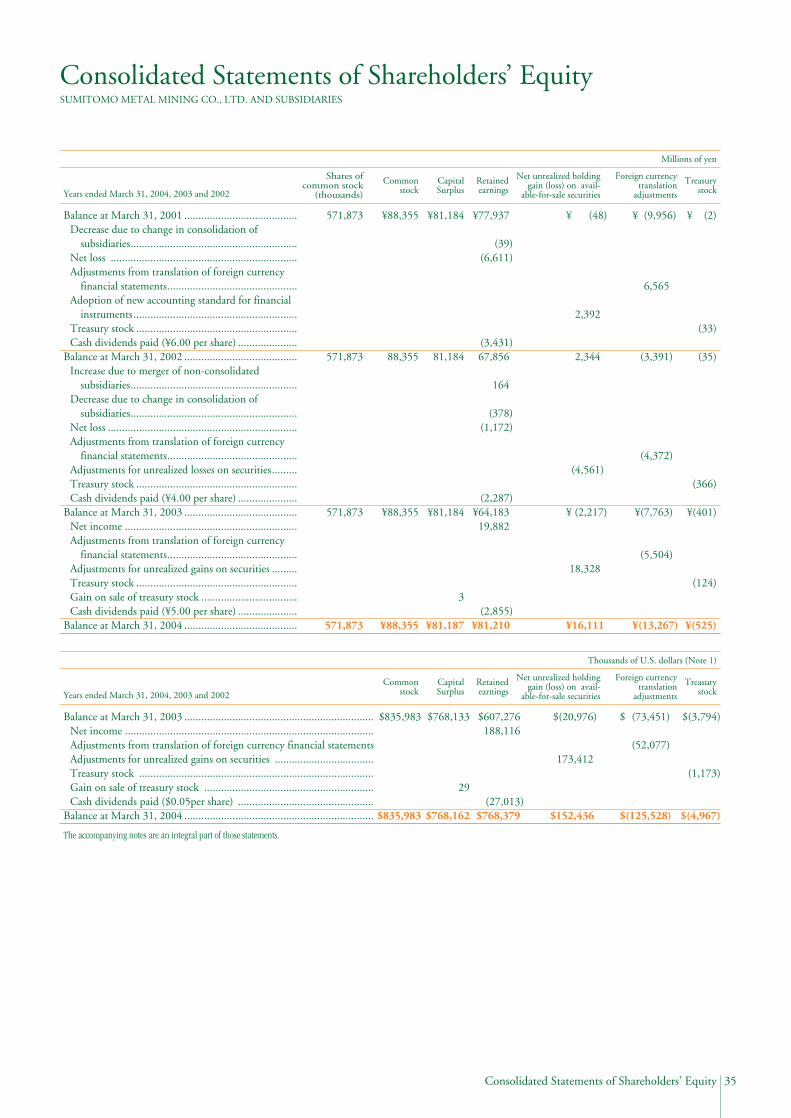
35Consolidated Statements of Shareholders’ Equity
Consolidated Statements of Shareholders’ EquitySUMITOMO METAL MINING CO., LTD. AND SUBSIDIARIES
Millions of yen
Balance at March 31, 2001 ........................................Decrease due to change in consolidation of
subsidiaries...........................................................Net loss ..................................................................Adjustments from translation of foreign currency
financial statements..............................................Adoption of new accounting standard for financial
instruments..........................................................Treasury stock .........................................................Cash dividends paid (¥6.00 per share) .....................
Balance at March 31, 2002 ........................................Increase due to merger of non-consolidated
subsidiaries...........................................................Decrease due to change in consolidation of
subsidiaries...........................................................Net loss ...................................................................Adjustments from translation of foreign currency
financial statements..............................................Adjustments for unrealized losses on securities.........Treasury stock .........................................................Cash dividends paid (¥4.00 per share) .....................
Balance at March 31, 2003 ........................................Net income .............................................................Adjustments from translation of foreign currency
financial statements..............................................Adjustments for unrealized gains on securities .........Treasury stock .........................................................Gain on sale of treasury stock ..................................Cash dividends paid (¥5.00 per share) .....................
Balance at March 31, 2004 ........................................
Treasurystock
Foreign currencytranslation
adjustments
Net unrealized holdinggain (loss) on avail-
able-for-sale securities
Retainedearnings
CapitalSurplus
Commonstock
Shares of common stock
(thousands)Years ended March 31, 2004, 2003 and 2002
¥ (2)
(33)
(35)
(366)
¥(401)
(124)
¥(525)
¥ (9,956)
6,565
(3,391)
(4,372)
¥(7,763)
(5,504)
¥(13,267)
¥ (48)
2,392
2,344
(4,561)
¥ (2,217)
18,328
¥16,111
¥77,937
(39)(6,611)
(3,431)67,856
164
(378)(1,172)
(2,287)¥64,183
19,882
(2,855)¥81,210
¥81,184
81,184
¥81,184
3
¥81,187
¥88,355
88,355
¥88,355
¥88,355
571,873
571,873
571,873
571,873
Thousands of U.S. dollars (Note 1)
Balance at March 31, 2003 ...................................................................Net income ........................................................................................Adjustments from translation of foreign currency financial statementsAdjustments for unrealized gains on securities ...................................Treasury stock ...................................................................................Gain on sale of treasury stock ............................................................Cash dividends paid ($0.05per share) ................................................
Balance at March 31, 2004 ...................................................................
Treasurystock
Foreign currencytranslation
adjustments
Net unrealized holdinggain (loss) on avail-
able-for-sale securities
Retainedearnings
CapitalSurplus
CommonstockYears ended March 31, 2004, 2003 and 2002
$(3,794)
(1,173)
$(4,967)
$ (73,451)
(52,077)
$(125,528)
$(20,976)
173,412
$152,436
$607,276 188,116
(27,013)$768,379
$768,133
29
$768,162
$835,983
$835,983
The accompanying notes are an integral part of those statements.

36 Consolidated Statements of Cash Flows
Consolidated Statements of Cash FlowsSUMITOMO METAL MINING CO., LTD. AND SUBSIDIARIES
Cash flows from operating activities:
Income (Loss) before income taxes and minority interests ............................................................
Adjustments to reconcile income (loss) before income taxes and minority interests to net cash provided by operating activities:Depreciation .............................................................................................................................Loss (Gain) on sale and disposal of property, plant and equipment ...........................................Gain on sale of investment securities .........................................................................................Write-down of investment securities .........................................................................................Write-down of subsidiary securities ...........................................................................................Decrease in allowance for loss on investments ..........................................................................Loss on sales of securities of an affiliated company ....................................................................Provision for (Reversal of) doubtful accounts ............................................................................Increase (Decrease) in retirement benefits ..................................................................................Interest and dividend income ....................................................................................................Interest expense .........................................................................................................................Equity in earnings of affiliated companies .................................................................................Loss from realignment of operations ..........................................................................................Restructuring charges ................................................................................................................Gain on securities contributed to employee retirement benefits trust .........................................Casualty loss ..............................................................................................................................Loss from indemnification of damages caused by a consolidated subsidiary ...............................Maintenance cost for ceased projects .........................................................................................Loss from suspension of operating activity of a consolidated subsidiary .....................................Loss on liquidation of subsidiaries .............................................................................................Decrease (Increase) in trade receivables ......................................................................................Decrease (Increase) in inventories ..............................................................................................Increase (Decrease) in trade payables .........................................................................................Others .......................................................................................................................................
Sub total ................................................................................................................................Interest and dividend received ...................................................................................................Interest paid ..............................................................................................................................Payments for additional retirement benefits by realignment of operations .................................Payments for maintenance costs for ceased project ....................................................................Payments for suspension of operating activity in a consolidated subsidiary ................................Payments for restructuring charges ............................................................................................Payments for recovery costs .......................................................................................................Payments for indemnification of damages caused by a consolidated subsidiary ..........................Payments for income taxes ........................................................................................................Other
Net cash provided by operating activities ...............................................................................
Cash flows from investing activities:Proceeds from sale of marketable securities ................................................................................Payments for acquisition of property, plant and equipment .......................................................Proceeds from sale of property, plant and equipment ................................................................Payments for purchases of investment securities ........................................................................Payments for purchase of subsidiaries securities .........................................................................Proceeds from sale of investment securities ................................................................................Increase in loans receivable ........................................................................................................Collection of loans receivable ....................................................................................................Other
Net cash used in investing activities .......................................................................................
Cash flows from financing activities:Proceeds from issuance of long-term debt ..................................................................................Repayments of long-term debt ..................................................................................................Net decrease in bank loans ........................................................................................................Net increase (decrease) in commercial paper ..............................................................................Payments for redemption of bonds ............................................................................................Proceeds from issuance of bonds ...............................................................................................Increase in treasury stocks ..........................................................................................................Cash dividends paid ..................................................................................................................Other
Net cash used in financing activities .....................................................................................
Effect of changes in exchange rate on cash and cash equivalents ................................................Net increase (decrease) in cash and cash equivalents ..................................................................Cash and cash equivalents at beginning of fiscal year .................................................................Increase in cash due to a newly consolidated subsidiary .............................................................Increase in cash and cash equivalents due to merger of non-consolidated subsidiaries ................Other decrease in cash and cash equivalents ..............................................................................Cash and cash equivalents at end of fiscal year ...........................................................................
Thousands ofU.S. dollars
(Note1)Millions of yen
Years ended March 31, 2004, 2003 and 2002 2004200220032004
$ 295,146
168,644(16,520)(45,870)
9,443—
(7,702)3,406
(8,383)3,482
(9,679)20,068
(67,291)6,812
——
1,02266
7,049—
11,591(69,666)24,90378,418
(74,747)330,19220,873
(20,598)(5,980)(6,784)
——
(1,022)(66)
(10,777)—
305,838
—(333,475)
45,870(19,359)
—174,454(30,504)13,171
(15,244)(165,087)
162,551(92,894)(99,622)(28,385)(94,616)94,616(1,173)
(27,013)(1,391)
(87,927)
(7,304)45,520
128,49812,291
—(3,662)
$ 182,647
¥(12,588)
17,822(3,370)
(958)8,4311,403
——
(1,338)1,180
(1,700)3,475
(1,535)3,434
315—
442247—
1,1442,280
17,018(3,280)3,2491,877
37,5483,001
(3,649)(326)
—(1,075)
(315)(442)(247)(905)(220)
33,370
53(26,778)
5,080(456)(265)
4,198(2,633)4,894(339)
(16,246)
12,264(11,134)(1,807)(2,500)
(18,000)10,000
(33)(3,434)
377(14,267)
6863,543
18,806414——
¥ 22,763
¥ (7,505)
18,283766
(108)17,247
301—
465485
(658)(1,074)2,533
(3,400)90
3,042(1,845)
—233—
9901,0694,2699,387
(3,769)(9,264)31,5372,338
(2,633)(3,198)
—(962)(201)
—(233)(460)(83)
26,105
—(21,723)
5,715(60)
(4,566)1,976
(3,381)648145
(21,246)
12,875(8,367)(7,393)3,000
(22,000)10,000
(366)(2,287)
375(14,163)
(58)(9,362)22,763
55125—
¥ 13,581
¥ 31,194
17,824(1,746)(4,848)
998—
(814)360
(886)368
(1,023)2,121
(7,112)720
——
1087
745—
1,225(7,363)2,6328,288
(7,900)34,8982,206
(2,177)(632)(717)
——
(108)(7)
(1,139)—
32,324
—(35,245)
4,848(2,046)
—18,438(3,224)1,392
(1,611)(17,448)
17,180(9,818)
(10,529)(3,000)
(10,000)10,000
(124)(2,855)
(147)(9,293)
(772)4,811
13,5811,299
—(387)
¥ 19,304
The accompanying notes are an integral part of those statements.
37Notes to Consolidated Financial Statements
Notes to Consolidated Financial StatementsSUMITOMO METAL MINING CO., LTD. AND SUBSIDIARIES
1. Basis of presenting consolidated financial state-ments
The accompanying consolidated financial statements have
been prepared in accordance with the provisions set forth in
the Japanese Securities and Exchange Law and its related
accounting regulations, and in conformity with accounting
principles generally accepted in Japan (“Japanese GAAP”),
which are different in certain respects as to application and
disclosure requirements of International Financial Reporting
Standards.
The accounts of overseas subsidiaries are based on their
accounting records maintained in conformity with generally
accepted accounting principles prevailing in the respective
countries of domicile. The accompanying consolidated finan-
cial statements have been restructured and translated into
English (with some expanded descriptions and the inclusion
of consolidated statements of shareholders’ equity) from the
consolidated financial statements of the Company prepared in
accordance with Japanese GAAP and filed with the appropri-
ate Local Finance Bureau of the Ministry of Finance as
required by the Securities and Exchange Law. Some supple-
mentary information included in the statutory Japanese lan-
guage consolidated financial statements, but not required for
fair presentation, is not presented in the accompanying con-
solidated financial statements.
The translation of the Japanese yen amounts into U.S. dol-
lars are included solely for the convenience of readers outside
Japan, using the prevailing exchange rate at March 31, 2004,
which was ¥105.69 to U.S. $1. The convenience translations
should not be construed as representations that the Japanese
yen amounts have been, could have been, or could in the
future be, converted into U.S. dollars at this or any other rate
of exchange.
2. Summary of significant accounting policiesConsolidation — The consolidated financial statements
include the accounts of the Company and its significant sub-
sidiaries (40 subsidiaries in 2004 and 39 in 2003 and 2002).
All significant intercompany balances and transactions have
been eliminated. Investments in significant affiliated compa-
nies (6 affiliated companies in 2004 and 2003 and 5 affiliated
companies in 2002) are accounted for using the equity
method. Investments in material non-consolidated sub-
sidiaries and affiliates over which the Company has the ability
to exercises significant influence over operating and financial
policies of the investees, are accounted for by the equity
method.
In the elimination of investments in subsidiaries, the assets
and liabilities of the subsidiaries, including the portion attrib-
utable to minority shareholders, are recorded based on the fair
value at the time the Company acquired control of the respec-
tive subsidiaries.
The consolidation difference between the cost of an invest-
ment and the underlying equity in its net assets at the date of
acquisition is being amortized over five years with minor
exceptions.
Accounting standard for impairment of fixed assets — In
the year ended March 31, 2004, the Company did not adopt
early the new accounting standard for impairment of fixed
Assets (“Opinion Concerning Establishment of Accounting
Standard for Impairment of Fixed Assets” issued by the
Business Accounting Deliberation Council on August 9,
2002) and the implementation guidance for accounting stan-
dard for impairment of fixed assets (the Financial Accounting
Standard Implementation Guidance No. 6 issued by the
Accounting Standards Board of Japan on October 31, 2003).
The Company plans to adopt these standards effective April 1,
2004. The Company has begun its analysis of possible
impairment of fixed assets. The Company cannot currently
estimate the effect of adoption of the new standard, because
the Company has not yet completed its analysis.
Cash and cash equivalents and cash flow statements — For
the purpose of the consolidated statements of cash flows, the
Company and its consolidated subsidiaries classify cash on
hand, readily-available bank deposits and short-term highly
liquid investments with maturities of not exceeding three
months at the time of purchase as cash and cash equivalents.
Allowance for doubtful accounts — The Company and its
consolidated domestic subsidiaries provide a general allowance
for doubtful accounts. Calculation of this allowance is based
on actual collection losses incurred in the past. Additionally,
for accounts receivable considered at risk (bankruptcy, compa-
nies under rehabilitation plan, or other similar conditions), an
allowance is booked based on an estimation of the uncol-
lectible amount, on a case by case basis.
Investment securities — Securities are classified into two cat-
egories based on the intent of holding; available-for-sale secu-
rities and securities issued by non-consolidated subsidiaries
and affiliated companies.
Available-for-sale securities with available fair values are stat-
ed at the fair value. Unrealized gains and losses on these secu-
rities are reported, net of applicable income taxes, as a separate
38 Notes to Consolidated Financial Statements
component of shareholders’ equity. Other available-for-sale
securities with no available fair values are stated at moving-
average method. Securities issued by non-consolidated sub-
sidiaries and affiliated companies are stated at moving-average
costs.
Derivatives and hedge accounting — Derivative instru-
ments are stated at fair value. Changes in the fair values are
recognized as gains and losses unless derivative transactions are
used for hedging purposes.
If derivative transactions are used as hedges and meet certain
hedging criteria, the Company and its domestic consolidated
subsidiaries defer recognition of gains or losses resulting from
changes in fair value of derivative transactions until the related
losses or gains on the hedged items are recognized.
However, in cases where forward foreign exchange contracts
are used as hedges and meet certain hedging criteria, forward
foreign exchange contracts and hedged items are accounted
for in the following manner:
(1) If a forward foreign exchange contract is executed to hedge
an existing foreign currency receivable or payable,
(a) the difference, if any, between the Japanese yen amount
of the hedged foreign currency receivable or payable
translated using the spot rate at the inception date of
the contract and the book value of the receivable or
payable is recognized in the income statement in the
period which includes the inception date, and
(1) (b) the discount or premium on the contract (that is, the
difference between the Japanese yen amount of the
contract translated using the contracted forward rate
and that translated using the spot rate at the inception
date of the contract) is recognized over the term of the
contract.
(2) If a forward foreign exchange contract is executed to hedge
a future transaction denominated in a foreign currency,
the future transaction will be recorded using the contract-
ed forward rate, and no gains or losses on the forward for-
eign exchange contract are recognized.
Also, if interest rate swap contracts are used as hedge and meet
certain hedging criteria, the net amount to be paid or received
under the interest rate swap contract is added to or deducted
from the interest on the assets or liabilities for which the swap
contract was executed.
The Company evaluates hedge effectiveness monthly by
comparing the cumulative changes in cash flows from or the
changes in fair value of hedged items and the corresponding
changes in the hedging derivative instruments.
Foreign currency translation — Receivables and payables
denominated in foreign currencies are translated into Japanese
yen at the year-end rates.
Balance sheets of consolidated overseas subsidiaries are
translated into Japanese yen at the year-end rates except for
shareholders’ equity accounts, which are translated at the his-
torical rates. Income statements of consolidated overseas sub-
sidiaries are translated at average rates except for transactions
with the Company, which are translated at the rates used by
the Company.
Inventories —
(1) Merchandise, finished products, semi-finished products,
work in process and raw materials - Merchandise, finished
products, semi-finished products, work in process and raw
materials of precious metals and of electronics materials are
stated at cost based on the first-in, first-out (FIFO)
method. Others are stated at cost based on the last-in,
first-out (LIFO) method.
(2) Supplies - Supplies are stated at the weighted-average cost.
Property, plant and equipment — Property, plant and
equipment are stated at cost.
Depreciation of property, plant and equipment is computed
by the straight-line method, based on the estimated useful
lives of the assets. The depreciation period generally ranges
from 3 years to 50 years for buildings and structures and 5
years to 17 years for machinery and equipment.
Retirement benefits — Under the terms of the Company’s
retirement plan, substantially all employees are entitled to a
lump-sum payment at the time of retirement. The amount of
retirement benefits is, in general, based on the length of serv-
ice, base salary at the time of retirement or severance and the
cause thereof.
The Company and certain consolidated domestic sub-
sidiaries also have a non-contributory funded pension plan,
which covers substantially all employees.
The Company may make payments for additional retire-
ment benefits for employees which payments have not been
included in the actuarial calculation of the projected benefit
obligation.
The Company and its consolidated domestic subsidiaries
provided allowance for employees’ severance and retirement

39Notes to Consolidated Financial Statements
benefits at March 31, 2004, 2003 and 2002 based on the esti-
mated amounts of projected benefit obligation and the fair
value of the plan assets at those dates.
Actuarial gains and losses are recognized in expenses using
the straight-line method over the average of the estimated
remaining service lives of ten years commencing with the fol-
lowing period.
Accrued retirement benefits in the consolidated balance
sheets also include estimated liabilities for the unfunded lump-
sum benefit plan covering directors and corporate auditors.
Research and development — Research and development
costs are charged to income as incurred.
Bond issue expense — Bond issue expense is charged to
income as incurred.
Accounting for certain lease transactions — Finance leases
which do not transfer ownership to lessees are accounted for
in the same manner as operating leases.
Income taxes — The Company and its consolidated sub-
sidiaries recognize tax effects of temporary differences between
the financial statement basis and the tax basis of assets and lia-
bilities. The provision for income taxes is computed based on
the pretax income included in the statement of operations.
The asset and liability approach is used to recognize deferred
tax assets and liabilities for the expected future tax conse-
quences of temporary differences.
Sales — Sales of merchandise and finished products are recog-
nized when the products are shipped to customers.
Bonuses to directors and corporate auditors — Bonuses to
directors and corporate auditors, which are subject to share-
holders’ approval at the annual shareholders’ meeting under
the Commercial Code of Japan, are accounted for as an
appropriation of retained earnings.
Earnings per share — Effective April 1, 2002, the Company
and its consolidated domestic subsidiaries adopted the new
accounting standard for earnings per share and related guid-
ance (Accounting Standards Board Statement No.2,
“Accounting Standard for Earnings Per Share” and Financial
Standards Implementation Guidance No.4, “Implementation
Guidance for Accounting Standard for Earnings Per Share”,
issued by the Accounting Standards Board of Japan on
September 25, 2002).
The adoption of the new accounting standard had no
impact on the consolidated financial statements.
Amounts per share of common stock — Net income per
share is computed based on the weighted-average number of
shares of common stock in issue during each fiscal year.
Cash dividends per share represent the actual amount applica-
ble to the respective fiscal year.
Reclassifications — Certain prior year amounts have been
reclassified to conform to the 2004 presentation. These
changes had no impact on previously reported results of oper-
ations or shareholders’ equity.
3. Securities(1) The following tables summarize acquisition costs, book
values and fair value of available-for-sale securities with
available fair values as of March 31, 2004 and 2003.
Millions of yen
DifferenceBook value
2003
¥2,588—
¥2,588
Equity securities .............................................................Others ............................................................................
Total ............................................................................
Acquisition cost
2004
¥12,846—
¥12,846
¥10,258—
¥10,258
DifferenceBook valueAcquisition cost
¥27,05428
¥27,082
¥52,58878
¥52,666
¥25,53450
¥25,584
Equity securities .............................................................Bonds .............................................................................
Total ............................................................................
2004
DifferenceBook valueAcquisition cost
$255,975 265
$256,240
$497,568 738
$498,306
$241,593 473
$242,066
Thousands of U.S. dollars
Securities with book values exceeding acquisition costs

40 Notes to Consolidated Financial Statements
Equity securities .............................................................Others ............................................................................
Total ............................................................................
Millions of yen
DifferenceBook valueAcquisition cost
20032004
¥(6,439)—
¥(6,439)
¥23,45250
¥23,502
¥29,89150
¥29,941
DifferenceBook valueAcquisition cost
¥(95)—
¥(95)
¥1,168—
¥1,168
¥1,263—
¥1,263
Equity securities .............................................................Others ............................................................................
Total ............................................................................
2004
DifferenceBook valueAcquisition cost
$(899)—
$(899)
$11,051—
$11,051
$11,950—
$11,950
Thousands of U.S. dollars
Securities with book values not exceeding acquisition costs
(2) The following tables summarize book values of the securities with no available fair values as of March 31, 2004 and 2003:
Unlisted equity securities ........................................................................................................................
Thousands ofU.S. dollarsMillions of yen
200420032004
$62,636 ¥ 5,643¥6,620
(3) Available-for-sale securities with maturities as of March 31, 2004 and 2003 are as follows:
Mutual funds .................................................................................................................
Millions of yen
TotalOver five years butwithin ten years
Over one year butwithin five yearsWithin one year
¥78¥—¥78¥—
As of March 31,2004
Mutual funds .................................................................................................................
Thousands of U.S. dollars
TotalOver five years butwithin ten years
Over one year butwithin five yearsWithin one year
$738 $—$738 $—
As of March 31,2004
Available-for-sale securities
Mutual funds .................................................................................................................
Millions of yen
TotalOver five years butwithin ten years
Over one year butwithin five yearsWithin one year
¥50¥—¥50¥—
As of March 31, 2003
(4) Total sales of available-for-sale securities sold in the year
ended March 31, 2004 amounted to ¥18,438 million
($174,454 thousand) and the related gains amounted to
¥4,848 million ($45,870 thousand). No losses were rec-
ognized in the year ended March 31, 2004.
Total sales of available-for-sale securities sold in the year
ended March 31, 2003 amounted to ¥1,976 million and
the related gains and losses amounted to ¥373 million and
¥265 million, respectively.
41Notes to Consolidated Financial Statements
4. Derivative transactions Status of derivative transactions — The Company and its
consolidated subsidiaries utilize derivative transactions in
order to hedge various risks, such as fluctuation of metal
prices, exchange rates and interest rates, in the normal course
of business; such as futures contracts for hedging fluctuation
of international price of metals, forward foreign exchange con-
tracts and currency swaps for hedging fluctuation of exchange
rates, and interest swaps for hedging fluctuation of interests of
floating-rate bonds and term loans payable.
Derivative transactions of the Company and its consolidated
subsidiaries cause market risk and credit risk. Market risk is
the potential loss the Company and its consolidated sub-
sidiaries may incur as a result of changes in the market value.
The Company’s and its consolidated subsidiaries’ exposure to
market risk are determined by a number of factors, including
fluctuation of market prices, exchange rates and interest rates.
Credit risk is the potential loss the Company and its consoli-
dated subsidiaries could incur if the counterparties made
default on their obligation. The derivative transactions are
solely made with highly rated financial institutions, their sub-
sidiaries or LME brokers guaranteed by banks, so that the
Company and its consolidated subsidiaries might reduce the
risk of default on an obligation.
Each department of the Company and its consolidated sub-
sidiaries involving derivative transactions have their own rules
for derivative transactions which stipulate purposes and scope
of using derivatives, standards for choosing transaction coun-
terparties, and procedures of reporting and administration.
The derivative transactions are subject to approval by the
General Manager of the department in charge after consulting
with related departments. Based on these rules, the person in
charge sets up the position. Then, the results are reported to
the Directors monthly.
The derivative positions are confirmed semi-annually with
the transaction counterparties. Also, the internal audit depart-
ment of the Company regularly examines derivative transac-
tions.
The Company and its consolidated subsidiaries are not
exposed to market risk arising from commodity derivative
transactions, because the risk of fluctuation of market prices,
that is caused by time lag between purchase and sale of materi-
als and products, is hedged by the corresponding future con-
tracts. The Company and its consolidated subsidiaries also
utilize currency derivative transactions to hedge market risk of
exchange rates or interest rates. Taking receivables and
payables denominated in foreign currencies into account, the
Company and its consolidated subsidiaries are not exposed to
market risk.
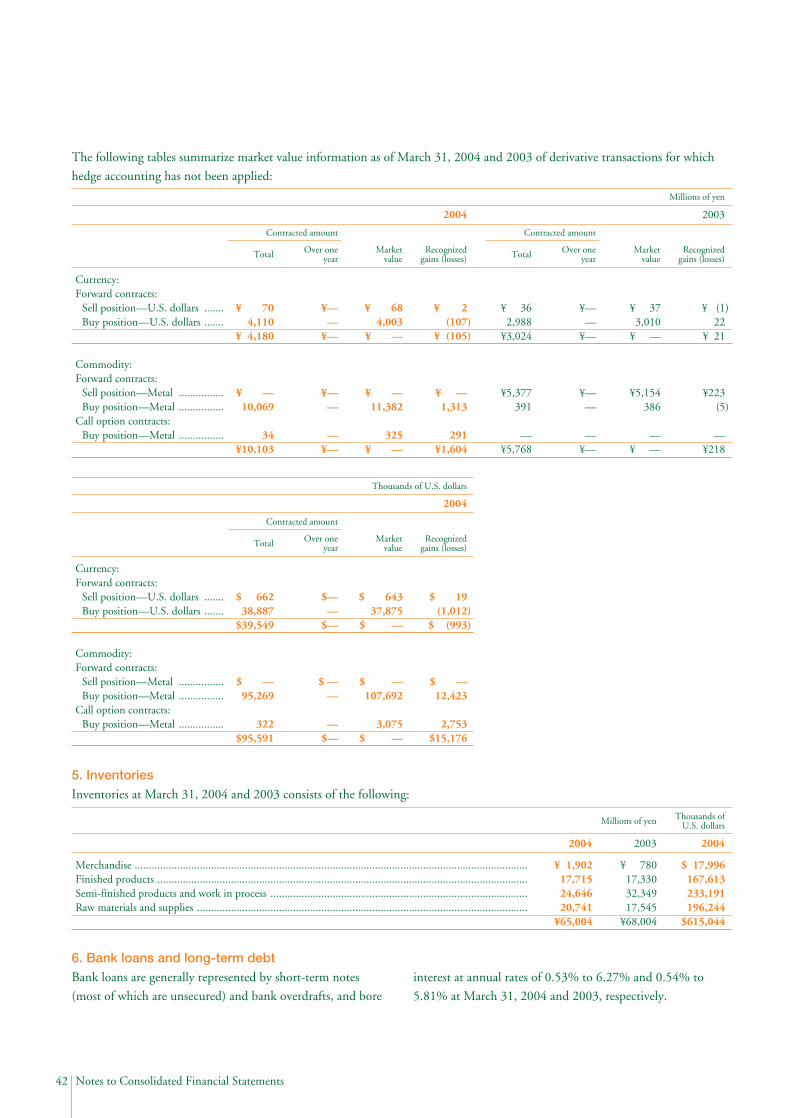
42 Notes to Consolidated Financial Statements
Currency:Forward contracts:
Sell position—U.S. dollars .......Buy position—U.S. dollars .......
Commodity:Forward contracts:
Sell position—Metal ................Buy position—Metal ................
Call option contracts:Buy position—Metal ................
Millions of yen
Contracted amount
20032004
¥ (1)22
¥ 21
¥223 (5)
—¥218
¥ 37 3,010
¥ —
¥5,154 386
— ¥ —
¥——
¥—
¥——
—¥—
Total Recognizedgains (losses)
Market value
Over one yearTotal Recognized
gains (losses)Market
valueOver one
year
Contracted amount
¥ 36 2,988
¥3,024
¥5,377 391
—¥5,768
¥ 2 (107)
¥ (105)
¥ —1,313
291 ¥1,604
¥ 684,003
¥ —
¥ —11,382
325¥ —
¥——
¥—
¥— —
—¥—
¥ 704,110
¥ 4,180
¥ —10,069
34¥10,103
Currency:Forward contracts:
Sell position—U.S. dollars .......Buy position—U.S. dollars .......
Commodity:Forward contracts:
Sell position—Metal ................Buy position—Metal ................
Call option contracts:Buy position—Metal ................
Thousands of U.S. dollars
2004
Total Recognizedgains (losses)
Market value
Over one year
Contracted amount
$ 19 (1,012)
$ (993)
$ —12,423
2,753 $15,176
$ 643 37,875
$ —
$ —107,692
3,075 $ —
$——
$—
$ ——
—$—
$ 662 38,887
$39,549
$ —95,269
322 $95,591
The following tables summarize market value information as of March 31, 2004 and 2003 of derivative transactions for which
hedge accounting has not been applied:
5. InventoriesInventories at March 31, 2004 and 2003 consists of the following:
Merchandise ...........................................................................................................................................Finished products ...................................................................................................................................Semi-finished products and work in process ...........................................................................................Raw materials and supplies .....................................................................................................................
Thousands ofU.S. dollarsMillions of yen
200420032004
$ 17,996 167,613 233,191 196,244
$615,044
¥ 78017,330 32,349 17,545
¥68,004
¥ 1,90217,715 24,646 20,741
¥65,004
6. Bank loans and long-term debt Bank loans are generally represented by short-term notes
(most of which are unsecured) and bank overdrafts, and bore
interest at annual rates of 0.53% to 6.27% and 0.54% to
5.81% at March 31, 2004 and 2003, respectively.
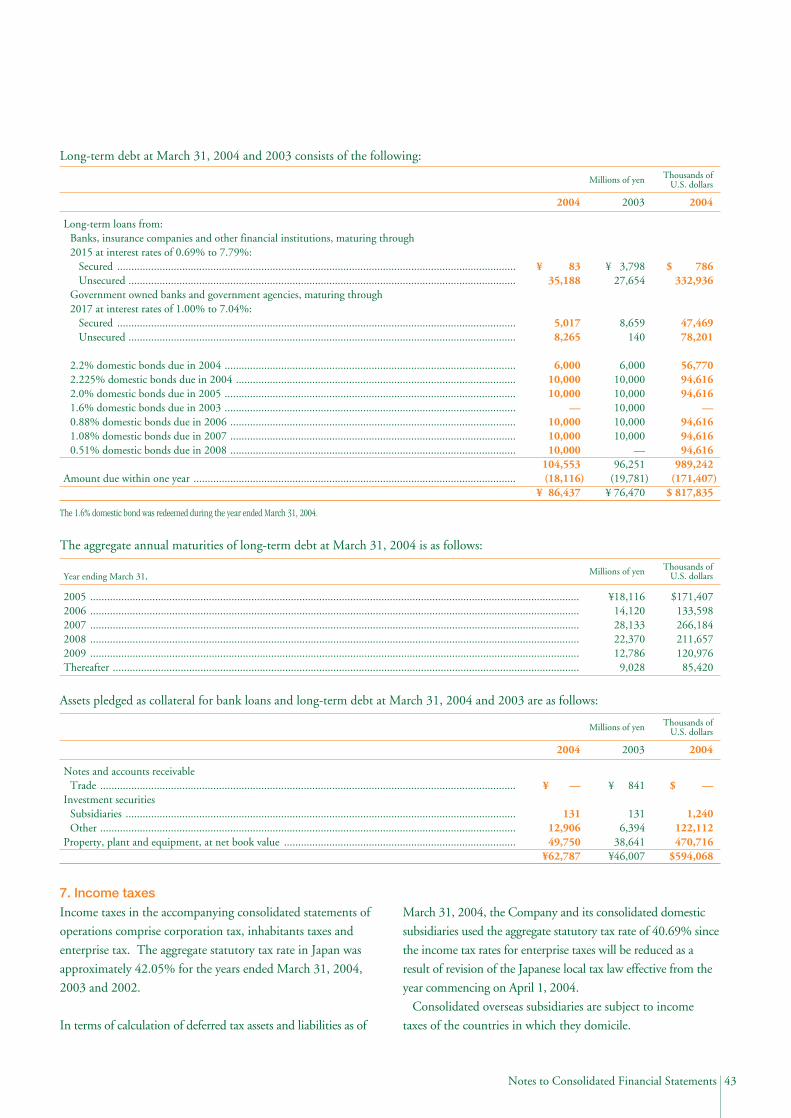
43Notes to Consolidated Financial Statements
Long-term debt at March 31, 2004 and 2003 consists of the following:
Long-term loans from:Banks, insurance companies and other financial institutions, maturing through 2015 at interest rates of 0.69% to 7.79%:
Secured .............................................................................................................................................Unsecured .........................................................................................................................................
Government owned banks and government agencies, maturing through 2017 at interest rates of 1.00% to 7.04%:
Secured .............................................................................................................................................Unsecured .........................................................................................................................................
2.2% domestic bonds due in 2004 .......................................................................................................2.225% domestic bonds due in 2004 ...................................................................................................2.0% domestic bonds due in 2005 .......................................................................................................1.6% domestic bonds due in 2003 .......................................................................................................0.88% domestic bonds due in 2006 .....................................................................................................1.08% domestic bonds due in 2007 .....................................................................................................0.51% domestic bonds due in 2008 .....................................................................................................
Amount due within one year ..................................................................................................................
Thousands ofU.S. dollarsMillions of yen
200420032004
$ 786 332,936
47,469 78,201
56,770 94,616 94,616
—94,616 94,616 94,616
989,242 (171,407)
$ 817,835
¥ 3,79827,654
8,659 140
6,000 10,000 10,000 10,000 10,000 10,000
—96,251
(19,781)¥ 76,470
¥ 8335,188
5,017 8,265
6,000 10,000 10,000
—10,000 10,000 10,000
104,553 (18,116)
¥ 86,437
The 1.6% domestic bond was redeemed during the year ended March 31, 2004.
The aggregate annual maturities of long-term debt at March 31, 2004 is as follows:
2005 .............................................................................................................................................................................2006 .............................................................................................................................................................................2007 .............................................................................................................................................................................2008 .............................................................................................................................................................................2009 .............................................................................................................................................................................Thereafter .....................................................................................................................................................................
Thousands ofU.S. dollarsMillions of yen
$171,407 133,598 266,184 211,657 120,976
85,420
¥18,11614,120 28,133 22,370 12,786
9,028
Year ending March 31,
Assets pledged as collateral for bank loans and long-term debt at March 31, 2004 and 2003 are as follows:
Notes and accounts receivableTrade ...................................................................................................................................................
Investment securitiesSubsidiaries ..........................................................................................................................................Other ...................................................................................................................................................
Property, plant and equipment, at net book value ..................................................................................
Thousands ofU.S. dollarsMillions of yen
200420032004
$ —
1,240122,112470,716
$594,068
¥ 841
1316,394
38,641¥46,007
¥ —
131 12,906 49,750
¥62,787
7. Income taxesIncome taxes in the accompanying consolidated statements of
operations comprise corporation tax, inhabitants taxes and
enterprise tax. The aggregate statutory tax rate in Japan was
approximately 42.05% for the years ended March 31, 2004,
2003 and 2002.
In terms of calculation of deferred tax assets and liabilities as of
March 31, 2004, the Company and its consolidated domestic
subsidiaries used the aggregate statutory tax rate of 40.69% since
the income tax rates for enterprise taxes will be reduced as a
result of revision of the Japanese local tax law effective from the
year commencing on April 1, 2004.
Consolidated overseas subsidiaries are subject to income
taxes of the countries in which they domicile.

44 Notes to Consolidated Financial Statements
Statutory tax rate ........................................................................................................................................................................................Equity in earnings of unconsolidated subsidiaries and affiliated companies ................................................................................................Effect of elimination of intercompany dividends received ...........................................................................................................................Difference in tax rates among the Company and its consolidated subsidiaries ............................................................................................Permanently nondeductible expenses .........................................................................................................................................................Permanently nontaxable dividends received ................................................................................................................................................Per capita inhabitant tax .............................................................................................................................................................................Increase in valuation allowance ...................................................................................................................................................................Others ........................................................................................................................................................................................................Effective tax rate .........................................................................................................................................................................................
2004
42.1% (9.6)2.6
(1.0)0.6
(1.5)0.4 0.6 0.2
34.4%
Deferred tax assets:Net operating loss carry forwards .........................................................................................................Retirement benefits ..............................................................................................................................Net unrealized holding loss on available-for-sale securities ...................................................................Allowance for bonus payable ................................................................................................................Depreciation ........................................................................................................................................Accrued liquidation loss of subsidiaries ................................................................................................Allowance for losses on investments .....................................................................................................Accrued indemnification loss of damages caused by a consolidated subsidiary ......................................Write-down of investment securities ....................................................................................................Accrued restructuring charges ..............................................................................................................Others .................................................................................................................................................
Gross deferred tax assets ...................................................................................................................Less valuation allowance ......................................................................................................................
Deferred tax assets-less valuation allowance ......................................................................................
Deferred tax liabilities:Net unrealized holding gain on available-for-sale securities ..................................................................Reserve for losses on overseas investment ............................................................................................Accrual for special depreciation of fixed assets ......................................................................................Deferred gains on properties for tax purpose ........................................................................................Reserve for explorations .......................................................................................................................Gain on securities contributed to employee retirement benefits trust ...................................................Depreciation ........................................................................................................................................Allowance for doubtful accounts ..........................................................................................................Accumulated earnings of overseas subsidiaries ......................................................................................Others .................................................................................................................................................
Deferred tax liabilities ......................................................................................................................
Net deferred tax assets ............................................................................................................................
Thousands ofU.S. dollarsMillions of yen
200420032004
$ 85,429 76,440
—10,824 1,798
15,470 2,129 3,936 5,280 3,908
25,593 230,807 (68,304)162,503
(104,466)(2,961)(2,394)
(38,925)(7,541)(7,106)
(15,148)—
(14,883)(2,441)
(195,865)
$ (33,362)
¥19,5957,113 1,508 1,312 1,169 1,147
558 422
—385
2,204 35,413 (7,026)28,387
—(281)(155)
(3,514)(770)(751)
(2,582)(515)(970)(376)
(9,914)
¥18,473
¥ 9,0298,079
—1,144
190 1,635
225 416 558 413
2,705 24,394 (7,219)17,175
(11,041)(313)(253)
(4,114)(797)(751)
(1,601)—
(1,573)(258)
(20,701)
¥ (3,526)
The following table summarizes the significant differences between the statutory tax rate and the Company’s and its consolidated
subsidiaries’ effective tax rate for financial statement purposes for the year ended March 31, 2004:
The Company has not disclosed the significant differences between
the statutory tax rate and the Company’s and its consolidated sub-
sidiaries’ effective tax rate for the years ended March 31, 2003 and
2002, because it has incurred a loss before income taxes and minor-
ity interests.
Significant components of the Company’s and its consolidated subsidiaries’ deferred tax assets and liabilities as of March 31, 2004
and 2003 are as follows:
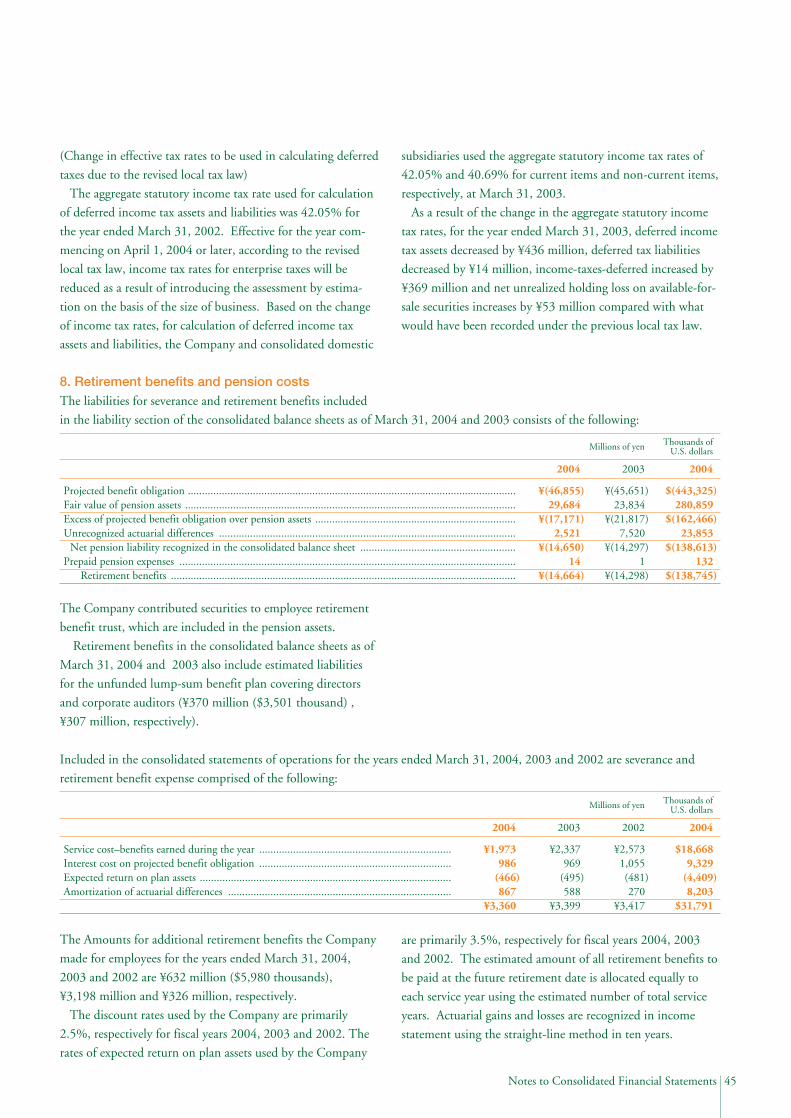
45Notes to Consolidated Financial Statements
(Change in effective tax rates to be used in calculating deferred
taxes due to the revised local tax law)
The aggregate statutory income tax rate used for calculation
of deferred income tax assets and liabilities was 42.05% for
the year ended March 31, 2002. Effective for the year com-
mencing on April 1, 2004 or later, according to the revised
local tax law, income tax rates for enterprise taxes will be
reduced as a result of introducing the assessment by estima-
tion on the basis of the size of business. Based on the change
of income tax rates, for calculation of deferred income tax
assets and liabilities, the Company and consolidated domestic
subsidiaries used the aggregate statutory income tax rates of
42.05% and 40.69% for current items and non-current items,
respectively, at March 31, 2003.
As a result of the change in the aggregate statutory income
tax rates, for the year ended March 31, 2003, deferred income
tax assets decreased by ¥436 million, deferred tax liabilities
decreased by ¥14 million, income-taxes-deferred increased by
¥369 million and net unrealized holding loss on available-for-
sale securities increases by ¥53 million compared with what
would have been recorded under the previous local tax law.
8. Retirement benefits and pension costsThe liabilities for severance and retirement benefits included
in the liability section of the consolidated balance sheets as of March 31, 2004 and 2003 consists of the following:
Projected benefit obligation ....................................................................................................................Fair value of pension assets .....................................................................................................................Excess of projected benefit obligation over pension assets .......................................................................Unrecognized actuarial differences .........................................................................................................
Net pension liability recognized in the consolidated balance sheet .......................................................Prepaid pension expenses .......................................................................................................................
Retirement benefits ..........................................................................................................................
Thousands ofU.S. dollarsMillions of yen
200420032004
$(443,325)280,859
$(162,466)23,853
$(138,613)132
$(138,745)
¥(45,651)23,834
¥(21,817)7,520
¥(14,297)1
¥(14,298)
¥(46,855)29,684
¥(17,171)2,521
¥(14,650)14
¥(14,664)
The Company contributed securities to employee retirement
benefit trust, which are included in the pension assets.
Retirement benefits in the consolidated balance sheets as of
March 31, 2004 and 2003 also include estimated liabilities
for the unfunded lump-sum benefit plan covering directors
and corporate auditors (¥370 million ($3,501 thousand) ,
¥307 million, respectively).
Included in the consolidated statements of operations for the years ended March 31, 2004, 2003 and 2002 are severance and
retirement benefit expense comprised of the following:
Service cost–benefits earned during the year ....................................................................Interest cost on projected benefit obligation ....................................................................Expected return on plan assets .........................................................................................Amortization of actuarial differences ...............................................................................
Thousands ofU.S. dollarsMillions of yen
2004200220032004
$18,668 9,329
(4,409)8,203
$31,791
¥2,573 1,055 (481)270
¥3,417
¥2,337 969
(495)588
¥3,399
¥1,973 986
(466)867
¥3,360
The Amounts for additional retirement benefits the Company
made for employees for the years ended March 31, 2004,
2003 and 2002 are ¥632 million ($5,980 thousands),
¥3,198 million and ¥326 million, respectively.
The discount rates used by the Company are primarily
2.5%, respectively for fiscal years 2004, 2003 and 2002. The
rates of expected return on plan assets used by the Company
are primarily 3.5%, respectively for fiscal years 2004, 2003
and 2002. The estimated amount of all retirement benefits to
be paid at the future retirement date is allocated equally to
each service year using the estimated number of total service
years. Actuarial gains and losses are recognized in income
statement using the straight-line method in ten years.
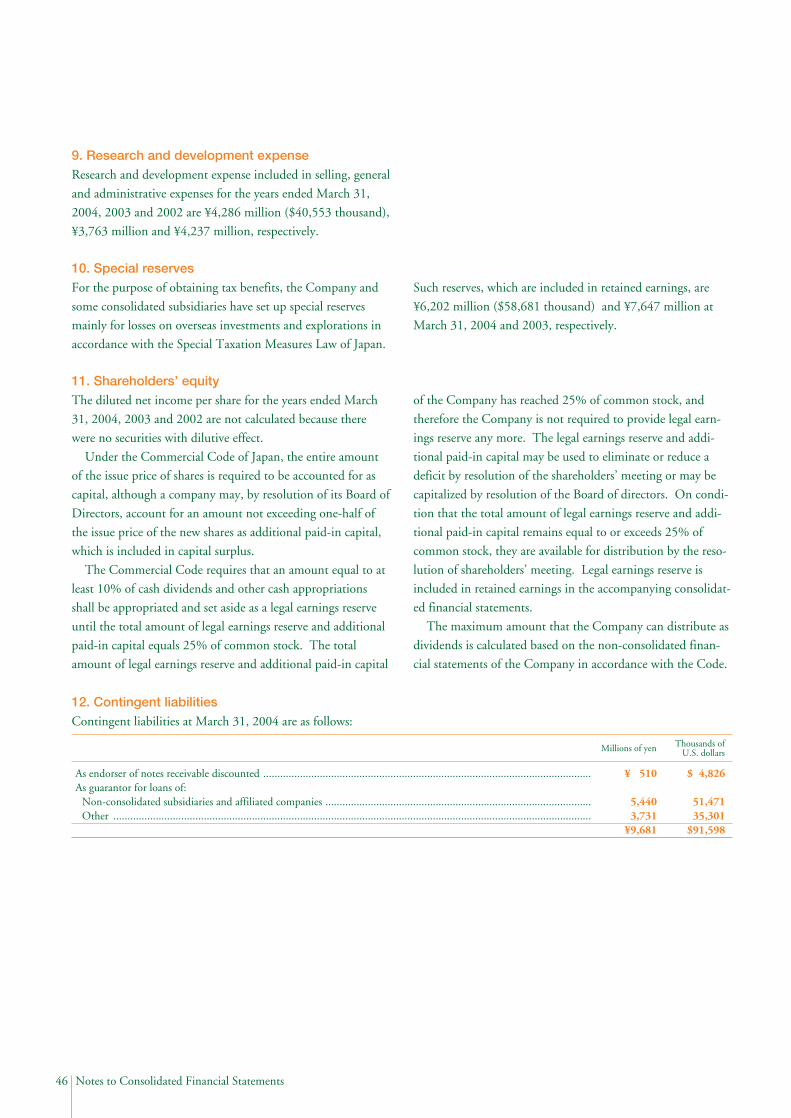
46 Notes to Consolidated Financial Statements
As endorser of notes receivable discounted ....................................................................................................................As guarantor for loans of:
Non-consolidated subsidiaries and affiliated companies ..............................................................................................Other .........................................................................................................................................................................
Thousands ofU.S. dollarsMillions of yen
$ 4,826
51,471 35,301
$91,598
¥ 510
5,440 3,731
¥9,681
9. Research and development expenseResearch and development expense included in selling, general
and administrative expenses for the years ended March 31,
2004, 2003 and 2002 are ¥4,286 million ($40,553 thousand),
¥3,763 million and ¥4,237 million, respectively.
10. Special reservesFor the purpose of obtaining tax benefits, the Company and
some consolidated subsidiaries have set up special reserves
mainly for losses on overseas investments and explorations in
accordance with the Special Taxation Measures Law of Japan.
Such reserves, which are included in retained earnings, are
¥6,202 million ($58,681 thousand) and ¥7,647 million at
March 31, 2004 and 2003, respectively.
11. Shareholders’ equityThe diluted net income per share for the years ended March
31, 2004, 2003 and 2002 are not calculated because there
were no securities with dilutive effect.
Under the Commercial Code of Japan, the entire amount
of the issue price of shares is required to be accounted for as
capital, although a company may, by resolution of its Board of
Directors, account for an amount not exceeding one-half of
the issue price of the new shares as additional paid-in capital,
which is included in capital surplus.
The Commercial Code requires that an amount equal to at
least 10% of cash dividends and other cash appropriations
shall be appropriated and set aside as a legal earnings reserve
until the total amount of legal earnings reserve and additional
paid-in capital equals 25% of common stock. The total
amount of legal earnings reserve and additional paid-in capital
of the Company has reached 25% of common stock, and
therefore the Company is not required to provide legal earn-
ings reserve any more. The legal earnings reserve and addi-
tional paid-in capital may be used to eliminate or reduce a
deficit by resolution of the shareholders’ meeting or may be
capitalized by resolution of the Board of directors. On condi-
tion that the total amount of legal earnings reserve and addi-
tional paid-in capital remains equal to or exceeds 25% of
common stock, they are available for distribution by the reso-
lution of shareholders’ meeting. Legal earnings reserve is
included in retained earnings in the accompanying consolidat-
ed financial statements.
The maximum amount that the Company can distribute as
dividends is calculated based on the non-consolidated finan-
cial statements of the Company in accordance with the Code.
12. Contingent liabilitiesContingent liabilities at March 31, 2004 are as follows:
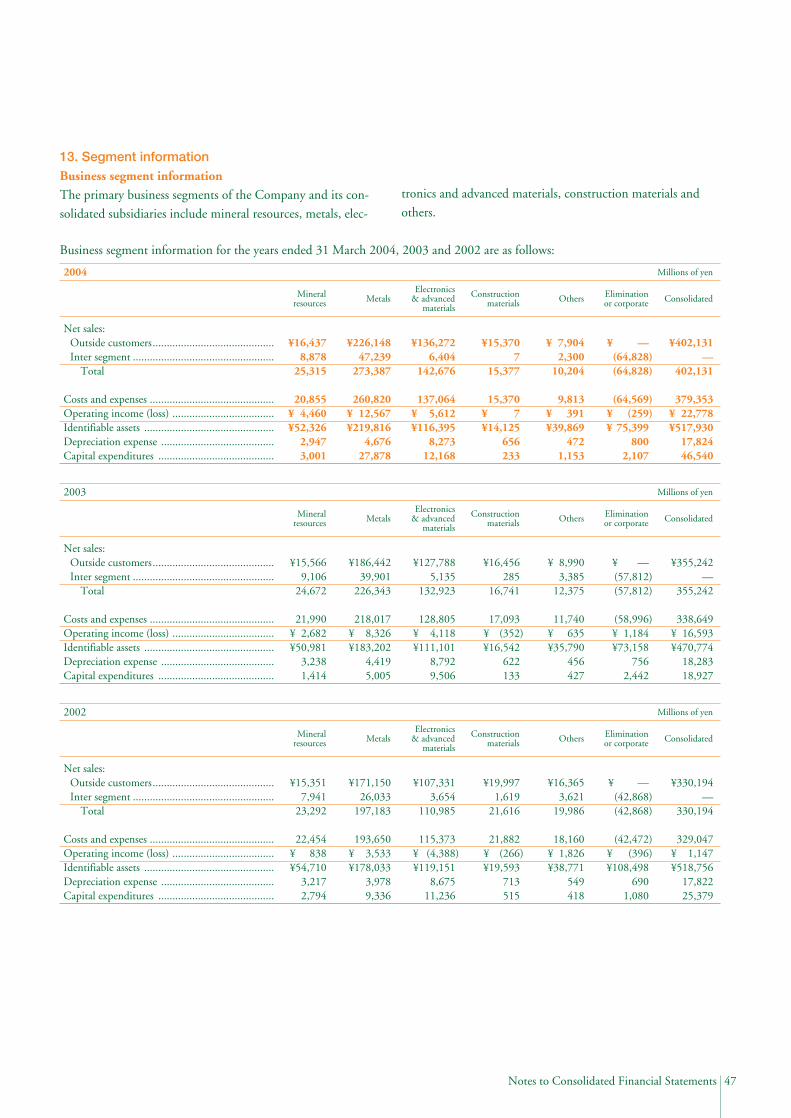
47Notes to Consolidated Financial Statements
Net sales:Outside customers...........................................Inter segment ..................................................
Total
Costs and expenses ............................................Operating income (loss) ....................................Identifiable assets ..............................................Depreciation expense ........................................Capital expenditures .........................................
Millions of yen
ConsolidatedElectronics
& advanced materials
Constructionmaterials Others Elimination
or corporateMetalsMineralresources
¥355,242—
355,242
338,649¥ 16,593¥470,774
18,28318,927
¥ —(57,812)(57,812)
(58,996)¥ 1,184¥73,158
7562,442
¥ 8,9903,385
12,375
11,740¥ 635¥35,790
456427
¥16,456285
16,741
17,093¥ (352)¥16,542
622133
¥127,7885,135
132,923
128,805¥ 4,118¥111,101
8,7929,506
¥186,44239,901
226,343
218,017¥ 8,326¥183,202
4,4195,005
¥15,5669,106
24,672
21,990¥ 2,682¥50,981
3,2381,414
2003
Net sales:Outside customers...........................................Inter segment ..................................................
Total
Costs and expenses ............................................Operating income (loss) ....................................Identifiable assets ..............................................Depreciation expense ........................................Capital expenditures .........................................
Millions of yen
ConsolidatedElectronics
& advanced materials
Constructionmaterials Others Elimination
or corporateMetalsMineralresources
¥330,194 —
330,194
329,047 ¥ 1,147 ¥518,756
17,822 25,379
¥ —(42,868)(42,868)
(42,472)¥ (396)¥108,498
690 1,080
¥16,365 3,621
19,986
18,160 ¥ 1,826 ¥38,771
549 418
¥19,997 1,619
21,616
21,882 ¥ (266)¥19,593
713 515
¥107,331 3,654
110,985
115,373 ¥ (4,388)¥119,151
8,675 11,236
¥171,150 26,033
197,183
193,650 ¥ 3,533 ¥178,033
3,978 9,336
¥15,351 7,941
23,292
22,454 ¥ 838 ¥54,710
3,217 2,794
2002
Net sales:Outside customers...........................................Inter segment ..................................................
Total
Costs and expenses ............................................Operating income (loss) ....................................Identifiable assets ..............................................Depreciation expense ........................................Capital expenditures .........................................
Millions of yen
ConsolidatedElectronics
& advanced materials
Constructionmaterials Others Elimination
or corporateMetalsMineralresources
¥402,131—
402,131
379,353 ¥ 22,778¥517,930
17,824 46,540
¥ —(64,828)(64,828)
(64,569)¥ (259) ¥ 75,399
800 2,107
¥ 7,9042,300
10,204
9,813¥ 391¥39,869
4721,153
¥15,3707
15,377
15,370¥ 7¥14,125
656233
¥136,2726,404
142,676
137,064¥ 5,612¥116,395
8,27312,168
¥226,14847,239
273,387
260,820¥ 12,567¥219,816
4,67627,878
¥16,4378,878
25,315
20,855¥ 4,460¥52,326
2,9473,001
2004
13. Segment informationBusiness segment information
The primary business segments of the Company and its con-
solidated subsidiaries include mineral resources, metals, elec-
tronics and advanced materials, construction materials and
others.
Business segment information for the years ended 31 March 2004, 2003 and 2002 are as follows:
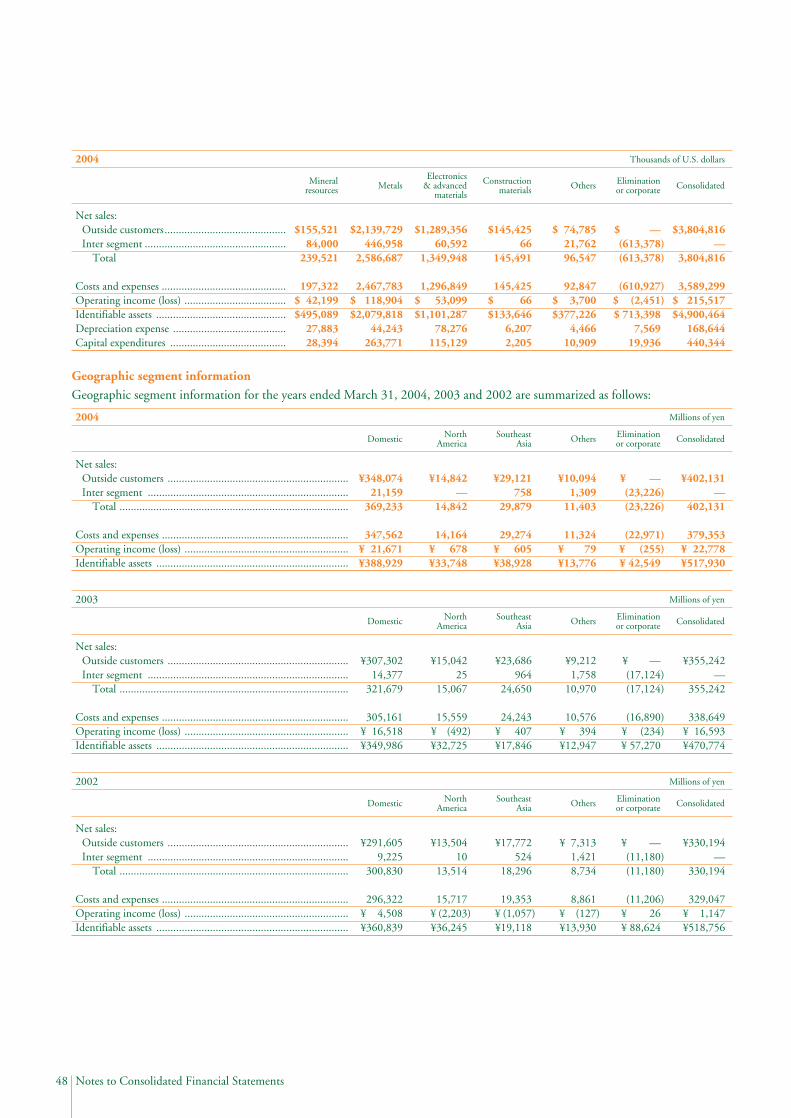
48 Notes to Consolidated Financial Statements
Net sales:Outside customers...........................................Inter segment ..................................................
Total
Costs and expenses ............................................Operating income (loss) ....................................Identifiable assets ..............................................Depreciation expense ........................................Capital expenditures .........................................
Thousands of U.S. dollars
ConsolidatedElectronics
& advanced materials
Constructionmaterials Others Elimination
or corporateMetalsMineralresources
$3,804,816 —
3,804,816
3,589,299 $ 215,517 $4,900,464
168,644 440,344
$ —(613,378)(613,378)
(610,927)$ (2,451)$ 713,398
7,569 19,936
$ 74,785 21,762 96,547
92,847 $ 3,700 $377,226
4,466 10,909
$145,425 66
145,491
145,425 $ 66 $133,646
6,207 2,205
$1,289,356 60,592
1,349,948
1,296,849 $ 53,099 $1,101,287
78,276 115,129
$2,139,729 446,958
2,586,687
2,467,783 $ 118,904 $2,079,818
44,243 263,771
$155,521 84,000
239,521
197,322 $ 42,199 $495,089
27,883 28,394
2004
Net sales:Outside customers ................................................................Inter segment .......................................................................
Total .................................................................................
Costs and expenses ..................................................................Operating income (loss) ..........................................................Identifiable assets ....................................................................
Millions of yen
ConsolidatedNorthAmerica
SoutheastAsia Others Elimination
or corporateDomestic
¥402,131—
402,131
379,353 ¥ 22,778¥517,930
¥ —(23,226)(23,226)
(22,971)¥ (255)¥ 42,549
¥10,0941,309
11,403
11,324 ¥ 79¥13,776
¥29,121758
29,879
29,274 ¥ 605¥38,928
¥14,842—
14,842
14,164 ¥ 678¥33,748
¥348,07421,159
369,233
347,562 ¥ 21,671¥388,929
2004
Net sales:Outside customers ................................................................Inter segment .......................................................................
Total .................................................................................
Costs and expenses ..................................................................Operating income (loss) ..........................................................Identifiable assets ....................................................................
Millions of yen
ConsolidatedNorthAmerica
SoutheastAsia Others Elimination
or corporateDomestic
¥355,242—
355,242
338,649 ¥ 16,593¥470,774
¥ —(17,124)(17,124)
(16,890)¥ (234)¥ 57,270
¥9,2121,758
10,970
10,576 ¥ 394¥12,947
¥23,686964
24,650
24,243 ¥ 407¥17,846
¥15,04225
15,067
15,559 ¥ (492)¥32,725
¥307,30214,377
321,679
305,161 ¥ 16,518¥349,986
2003
Net sales:Outside customers ................................................................Inter segment .......................................................................
Total .................................................................................
Costs and expenses ..................................................................Operating income (loss) ..........................................................Identifiable assets ....................................................................
Millions of yen
ConsolidatedNorthAmerica
SoutheastAsia Others Elimination
or corporateDomestic
¥330,194—
330,194
329,047 ¥ 1,147¥518,756
¥ —(11,180)(11,180)
(11,206)¥ 26¥ 88,624
¥ 7,3131,421 8,734
8,861 ¥ (127)¥13,930
¥17,772524
18,296
19,353 ¥ (1,057)¥19,118
¥13,50410
13,514
15,717 ¥ (2,203)¥36,245
¥291,6059,225
300,830
296,322 ¥ 4,508¥360,839
2002
Geographic segment information
Geographic segment information for the years ended March 31, 2004, 2003 and 2002 are summarized as follows:

49Notes to Consolidated Financial Statements
Overseas net sales ...........................................................................................Consolidated net sales.....................................................................................Share of overseas net sales ..............................................................................
Millions of yen
TotalSoutheastAsia
EastAsia OthersNorth
America
¥126,375 ¥402,131
31.4%
¥3,111 —
0.8%
¥75,452 —
18.7%
¥28,916 —
7.2%
¥18,896 —
4.7%
2004
Overseas net sales ...........................................................................................Consolidated net sales.....................................................................................Share of overseas net sales ..............................................................................
Millions of yen
TotalSoutheastAsia
EastAsia OthersNorth
America
¥107,589¥355,242
30.3%
¥2,386—
0.7%
¥61,743—
17.4%
¥25,385—
7.1%
¥18,075—
5.1%
2003
Overseas net sales ...........................................................................................Consolidated net sales.....................................................................................Share of overseas net sales ..............................................................................
Millions of yen
TotalSoutheastAsia
EastAsia OthersNorth
America
¥ 91,511¥330,194
27.7%
¥3,770—
1.1%
¥52,590—
15.9%
¥17,993—
5.5%
¥17,158—
5.2%
2002
Overseas net sales ...........................................................................................Consolidated net sales.....................................................................................Share of overseas net sales ..............................................................................
Thousands of U.S. dollars
TotalSoutheastAsia
EastAsia OthersNorth
America
$1,195,714 $3,804,816
31.4%
$29,435 —
0.8%
$713,899 —
18.7%
$273,593 —
7.2%
$178,787 —
4.7%
2004
Net sales:Outside customers ................................................................Inter segment .......................................................................
Total .................................................................................
Costs and expenses ..................................................................Operating income (loss) ..........................................................Identifiable assets ....................................................................
Thousands of U.S. dollars
ConsolidatedNorthAmerica
SoutheastAsia Others Elimination
or corporateDomestic
$3,804,816 —
3,804,816
3,589,299 $ 215,517 $4,900,464
$ —(219,756)(219,756)
(217,344)$ (2,412)$ 402,583
$ 95,506 12,385
107,891
107,144 $ 747 $130,344
$275,532 7,172
282,704
276,980 $ 5,724 $368,323
$140,430 —
140,430
134,015 $ 6,415 $319,311
$3,293,348 200,199
3,493,547
3,288,504 $ 205,043 $3,679,903
2004
Information for overseas sales

50 Notes to Consolidated Financial Statements
Machinery and equipment ............................................Others ..........................................................................
Total ..........................................................................
Thousands of U.S. dollars
2004
Net book valueAccumulated depreciationAcquisition cost
$5,989 549
$6,538
$ 8,109 2,923
$11,032
$14,098 3,472
$17,570
Due within one year ...............................................................................................................................Due after one year ..................................................................................................................................
Total ....................................................................................................................................................
Thousands ofU.S. dollarsMillions of yen
200420032004
$2,801 3,737
$6,538
¥353507
¥860
¥296395
¥691
Future lease payment, inclusive of interest at March 31, 2004 and 2003 under such leases are as follows:
Machinery and equipment ............................................Others ..........................................................................
Total ..........................................................................
Millions of yen
20032004
¥2360
¥236
¥1861
¥187
¥4221
¥423
Net book valueAccumulated depreciationAcquisition costNet book valueAccumulated
depreciationAcquisition cost
¥1810
¥181
¥2011
¥202
¥3821
¥383
Machinery and equipment ............................................Others ..........................................................................
Total ..........................................................................
Thousands of U.S. dollars
2004
Net book valueAccumulated depreciationAcquisition cost
$1,722 0
$1,722
$1,892 10
$1,902
$3,614 10
$3,624
Total lease expenses .........................................................................................................Assumed depreciation charge ...........................................................................................
Thousands ofU.S. dollarsMillions of yen
2004200220032004
$3,1223,122
¥555555
¥466466
¥330330
Total lease expenses and assumed depreciation charges for the years ended March 31, 2004, 2003 and 2002 are as follows:
As a lesser
A summary of acquisition cost , accumulated depreciation and net book value at March 31, 2004 and 2003 were as follows:
14. Information for certain leases As a lessee
A summary of assumed amounts inclusive of interest of acquisition cost, accumulated depreciation and net book value of finance
leases accounted for in the same manner as operating leases at March 31, 2004 and 2003 are as follows:
Machinery and equipment ............................................Others ..........................................................................
Total ..........................................................................
Millions of yen
20032004
¥79169
¥860
¥ 929239
¥1,168
¥1,720308
¥2,028
Net book valueAccumulated depreciationAcquisition costNet book valueAccumulated
depreciationAcquisition cost
¥63358
¥691
¥ 857309
¥1,166
¥1,490367
¥1,857
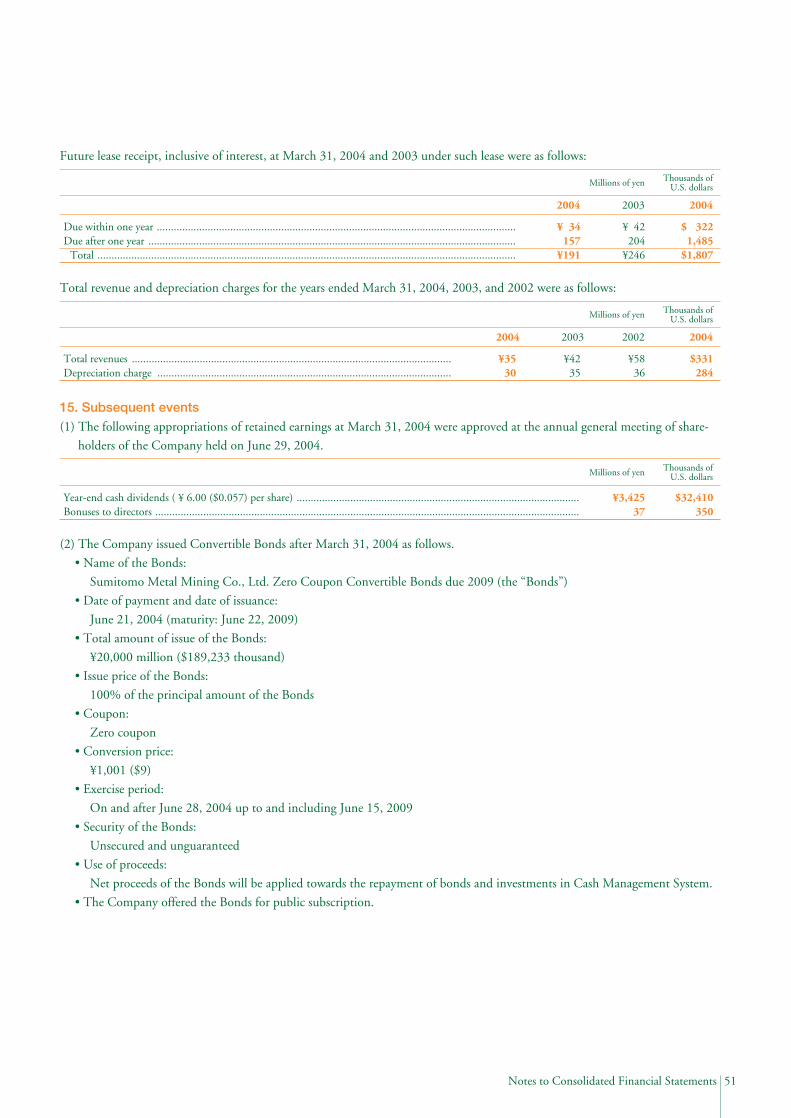
51Notes to Consolidated Financial Statements
Due within one year ...............................................................................................................................Due after one year ..................................................................................................................................
Total ....................................................................................................................................................
Thousands ofU.S. dollarsMillions of yen
200420032004
$ 3221,485
$1,807
¥ 42204
¥246
¥ 34157
¥191
Total revenues .................................................................................................................Depreciation charge ........................................................................................................
Thousands ofU.S. dollarsMillions of yen
2004200220032004
$331284
¥5836
¥4235
¥3530
Year-end cash dividends ( ¥ 6.00 ($0.057) per share) ....................................................................................................Bonuses to directors ......................................................................................................................................................
Thousands ofU.S. dollarsMillions of yen
$32,410350
¥3,42537
Future lease receipt, inclusive of interest, at March 31, 2004 and 2003 under such lease were as follows:
Total revenue and depreciation charges for the years ended March 31, 2004, 2003, and 2002 were as follows:
15. Subsequent events(1) The following appropriations of retained earnings at March 31, 2004 were approved at the annual general meeting of share-
holders of the Company held on June 29, 2004.
(2) The Company issued Convertible Bonds after March 31, 2004 as follows.
• Name of the Bonds:
Sumitomo Metal Mining Co., Ltd. Zero Coupon Convertible Bonds due 2009 (the “Bonds”)
• Date of payment and date of issuance:
June 21, 2004 (maturity: June 22, 2009)
• Total amount of issue of the Bonds:
¥20,000 million ($189,233 thousand)
• Issue price of the Bonds:
100% of the principal amount of the Bonds
• Coupon:
Zero coupon
• Conversion price:
¥1,001 ($9)
• Exercise period:
On and after June 28, 2004 up to and including June 15, 2009
• Security of the Bonds:
Unsecured and unguaranteed
• Use of proceeds:
Net proceeds of the Bonds will be applied towards the repayment of bonds and investments in Cash Management System.
• The Company offered the Bonds for public subscription.

52 Independent Auditor’s Report
Independent Auditor’s Report
To the Board of Directors of Sumitomo Metal Mining Co., Ltd.
We have audited the accompanying consolidated balance sheets of Sumitomo Metal Mining Co., Ltd. and
consolidated subsidiaries as of March 31, 2004 and 2003, and the related consolidated statements of opera-
tions, shareholders’ equity and cash flows for each of the three years in the period ended March 31, 2004,
expressed in Japanese yen. These consolidated financial statements are the responsibility of the Company’s
management. Our responsibility is to independently express an opinion on these consolidated financial
statements based on our audits.
We conducted our audits in accordance with auditing standards generally accepted in Japan. Those stan-
dards require that we plan and perform the audit to obtain reasonable assurance about whether the finan-
cial statements are free of material misstatement. An audit includes examining, on a test basis, evidence
supporting the amounts and disclosures in the financial statements. An audit also includes assessing the
accounting principles used and significant estimates made by management, as well as evaluating the overall
financial statement presentation. We believe that our audits provide a reasonable basis for our opinion.
In our opinion, the consolidated financial statements referred to above present fairly, in all material
respects, the consolidated financial position of Sumitomo Metal Mining Co., Ltd. and subsidiaries as of
March 31, 2004 and 2003, and the consolidated results of their operations and their cash flows for each of
the three years in the period ended March 31, 2004, in conformity with accounting principles generally
accepted in Japan.
The U.S. dollar amounts in the accompanying consolidated financial statements with respect to the year
ended March 31, 2004 are presented solely for convenience. Our audit also included the translation of yen
amounts into U.S. dollar amounts and, in our opinion, such translation has been made on the basis
described in Note 1 to the consolidated financial statements.
Tokyo, Japan
June 29, 2004

53SMM Group
SMM GroupSUMITOMO METAL MINING CO., LTD. AND SUBSIDIARIES
Name Voting Shares (%) Phone Operations
Branches, Divisions and LaboratoriesHead Office 81-3-3436-7701Osaka Branch 81-6-6223-7714Nagoya Branch 81-52-963-2360Besshi-Niihama District Division 81-897-37-4800Harima Smelter 81-794-37-8651Kunitomi District Division 81-135-72-1211Electronics Division 81-428-31-1181Hishikari Mine Department 81-995-26-3111Ichikawa Research Laboratories 81-47-372-7221Niihama Research Laboratories 81-897-37-7171Ome Research Laboratories 81-428-31-4140London Office 44-020-7246-3865Shanghai Office 86-21-6219-4077
Domestic Major Subsidiaries and Affiliated CompaniesMineral Resources
Sumiko Consultants Co., Ltd. 100.0 81-3-3827-6134 Geological surveys etc.Metals
Hyuga Smelting Co., Ltd. 60.0 81-982-52-8101 Ferro-nickel refiningSumitomo Metal Mining Brass & Copper Co., Ltd. 100.0 81-3-3847-8011 Brass & Copper productionTaihei Metal Industry Co., Ltd. 95.9 81-46-274-1606 Casting alloy productionMS Zinc co., Ltd.* 50.0 81-3-3591-3110 Zinc production etc.
Electronics and Advanced MaterialsOhkuchi Electronics Co., Ltd. 100.0 81-995-22-7511 IC packaging materials production etc.Shinko Co., Ltd. 92.0 81-265-79-0121 Printing wiring board productionNiihama Electronics Co., Ltd. 100.0 81-897-37-2411 Lead frame productionAjimu Electronics Co., Ltd. 100.0 81-978-44-2345 Solder plating of ICSumitomo Metal Mining Package Materials Co., Ltd. 100.0 81-42-527-7246 IC packaging materials businessSumiko Tec Co., Ltd. 100.0 81-45-921-2341 Electronic device terminal and connector productionFuji Electronics Industries Co., Ltd. 99.7 81-54-257-2800 Electronic device precision components productionSumico Lubricant Co., Ltd. 100.0 81-3-3344-6835 Lubricants productionNittosha Co., Ltd. 90.0 81-466-48-6200 Metal product plating etc.
Construction MaterialsSumitomo Metal Mining Siporex Co., Ltd. 100.0 81-3-3435-4660 Construction materials (ALC) productionIgeta Heim Co., Ltd. 100.0 81-3-5452-7591 Ferro-concrete, ALC housing (subcontractor)
Other ServicesSumiko Eco-engineering Co., Ltd. 100.0 81-3-5685-1311 Environmental engineering etc.Sumiko Technical Service Co., Ltd. 100.0 81-897-33-1050 Construction, refining etc. (subcontractor)SMM Plant Engineering Co., Ltd. 100.0 81-897-37-4820 Refining facility engineering etc.Sumiko Information Systems Co., Ltd. 100.0 81-3-3436-7788 IT system developmentN. E. Chemcat Corporation* 45.6 81-3-3435-5490 Precious metal catalysts production etc.Nippon Ketjen Co., Ltd.* 50.0 81-3-5442-5061 Oil refining catalysts production etc.
Overseas Major Subsidiaries and Affiliated CompaniesSumitomo Metal Mining America Inc. 100.0 1-206-405-2800 Manages mining affiliates in U.S.Sumitomo Metal Mining Arizona Inc. 80.0 1-206-405-2800 Jointly manages Morenci Mine, U.S.SMMA Candelaria Inc. 80.0 1-206-405-2800 Jointly manages La Candelaria Mine, ChileSumitomo Metal Mining Canada Ltd. 100.0 1-604-685-3274 Prospecting, consultingSumitomo Metal Mining Oceania Pty. Ltd. 100.0 61-2-9266-0400 Jointly manages Northparkes Mine, AustraliaSMM Pogo LLC 100.0 1-206-405-2800 Pogo Project, Alaska, U.S.Coral Bay Nickel Corporation 54.0 63-2-750-1536 Nickel cobalt mixed sulfide productionSumitomo Metal Mining Asia Pacific Pte. Ltd. 100.0 65-6293-4377 Manages overseas lead frame businessM-SMM Electronics SDN. BHD. 100.0 60-3-5519-8140 Lead frame productionMalaysian Electronics Materials SDN. BHD. 100.0 60-3-5519-8302 Bonding wire productionSumiko Electronics Taiwan Co., Ltd. 70.0 886-7-365-3592 Lead frame productionSumiko Leadframe (Thailand) Co., Ltd. 100.0 66-35-226303 Lead frame productionP.T.SUMIKO LEADFRAME BINTAN 100.0 62-770-696020 Lead frame productionSumiko Leadframe Singapore Pte. Ltd. 100.0 65-6293-4377 Lead frame productionSumiko Leadframe Chengdu Co., Ltd. 85.0 86-28-8515-5577 Lead frame productionSMM USA, Inc. 100.0 1-760-941-4500 TV frame productionSMMEP Pte. Ltd. 100.0 65-6863-1123 TV frame productionCOMPAÑIA CONTRACTUAL MINERA CANDELARIA*16.0 56-2-251-1200 Manages La Candelaria Mine, ChileP.T. International Nickel Indonesia* 20.1 62-21-5249003 Nickel ore mining and refiningFIGESBAL* 25.5 687-27-2031 Nickel ore mining etc.
*Affiliated company
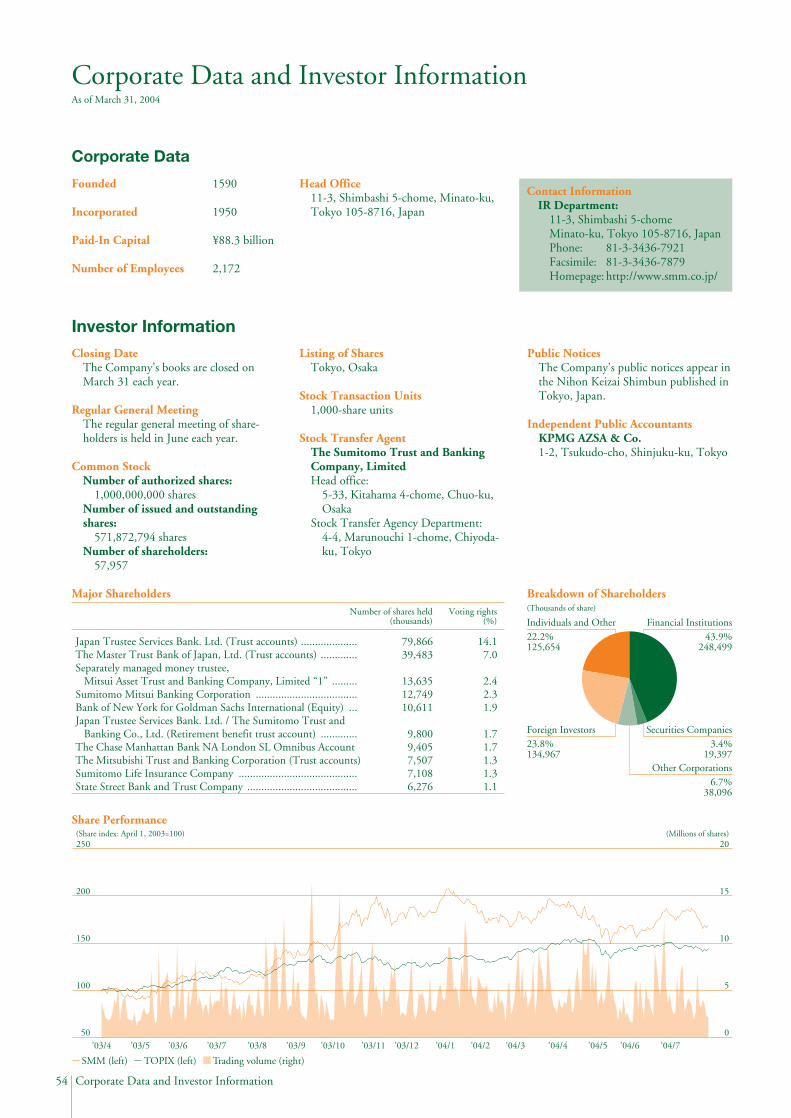
54 Corporate Data and Investor Information
Corporate Data and Investor InformationAs of March 31, 2004
Founded 1590
Incorporated 1950
Paid-In Capital ¥88.3 billion
Number of Employees 2,172
Head Office11-3, Shimbashi 5-chome, Minato-ku,Tokyo 105-8716, Japan
Closing DateThe Company’s books are closed onMarch 31 each year.
Regular General MeetingThe regular general meeting of share-holders is held in June each year.
Common StockNumber of authorized shares:
1,000,000,000 sharesNumber of issued and outstandingshares:
571,872,794 sharesNumber of shareholders:
57,957
Listing of SharesTokyo, Osaka
Stock Transaction Units1,000-share units
Stock Transfer AgentThe Sumitomo Trust and BankingCompany, LimitedHead office:
5-33, Kitahama 4-chome, Chuo-ku,Osaka
Stock Transfer Agency Department:4-4, Marunouchi 1-chome, Chiyoda-ku, Tokyo
Public NoticesThe Company’s public notices appear inthe Nihon Keizai Shimbun published inTokyo, Japan.
Independent Public AccountantsKPMG AZSA & Co.1-2, Tsukudo-cho, Shinjuku-ku, Tokyo
Corporate Data
Investor Information
Japan Trustee Services Bank. Ltd. (Trust accounts) ....................The Master Trust Bank of Japan, Ltd. (Trust accounts) .............Separately managed money trustee,
Mitsui Asset Trust and Banking Company, Limited “1” .........Sumitomo Mitsui Banking Corporation ....................................Bank of New York for Goldman Sachs International (Equity) ...Japan Trustee Services Bank. Ltd. / The Sumitomo Trust and
Banking Co., Ltd. (Retirement benefit trust account) .............The Chase Manhattan Bank NA London SL Omnibus Account The Mitsubishi Trust and Banking Corporation (Trust accounts) Sumitomo Life Insurance Company ..........................................State Street Bank and Trust Company .......................................
Voting rights(%)
Number of shares held (thousands)
14.17.0
2.42.31.9
1.71.71.31.31.1
79,86639,483
13,63512,74910,611
9,8009,4057,5077,1086,276
Major Shareholders Breakdown of Shareholders
Share Performance
(Thousands of share)
Financial Institutions43.9%
248,499
Securities Companies3.4%
19,397Other Corporations
6.7%38,096
Foreign Investors23.8%134,967
Individuals and Other22.2%125,654
Contact InformationIR Department:
11-3, Shimbashi 5-chomeMinato-ku, Tokyo 105-8716, JapanPhone: 81-3-3436-7921Facsimile: 81-3-3436-7879Homepage: http://www.smm.co.jp/
(Share index: April 1, 2003=100)250
200
150
100
(Millions of shares)
SMM (left)
50
20
15
10
5
0’03/4 ’03/5 ’03/6 ’03/7 ’03/8 ’03/9 ’03/10 ’03/11 ’03/12 ’04/1 ’04/2 ’04/3 ’04/4 ’04/5 ’04/6 ’04/7
TOPIX (left) Trading volume (right)

55Corporate Officers
Corporate Officers
Directors and Statutory Auditors
Representative Directors Koichi FukushimaChitsura Arakawa
DirectorsHirosuke ChiharaNobuto YamaguchiYukio IshikawaSusumu MakinoMasashi Koike
(Standing) Senior AuditorIsao Shima
(Standing) AuditorMotoki Kitamura
AuditorsHajime OhtaTsutomu Ushijima
Executive Officers
PresidentKoichi Fukushima
Executive Vice PresidentChitsura Arakawa
Senior Managing Executive OfficersHirosuke ChiharaNobuto Yamaguchi
Managing Executive OfficersKouji AibaTakeshi YamaneYukio IshikawaSusumu MakinoTakuro Mochihara
Executive OfficersMasashi KoikeIchiro AbeKotaro TominoNaoki TajiriYoshiaki HashinakaEtsu SendaKouzou BabaNobumasa Kemori
Director Director Director DirectorSusumu Makino Nobuto Yamaguchi Yukio Ishikawa Masashi Koike
Representative Director Representative Director DirectorChitsura Arakawa Koichi Fukushima Hirosuke Chihara
(As of June 29, 2004)

100% Recycled-content level