developing the change management value...
TRANSCRIPT
24 July, 2010
1
Developing the Change Management Value Proposition
2 24-Jul-10© Canvas4 Pty Ltd 2008
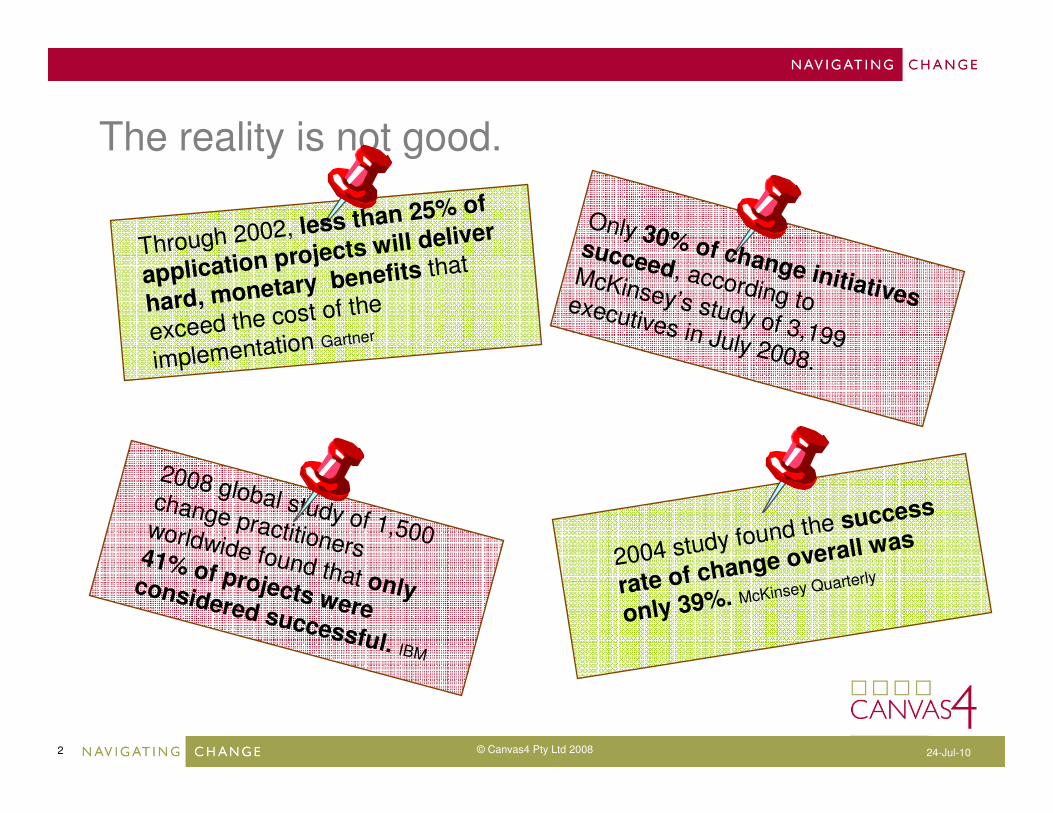
The reality is not good.
Only 30% of change initiatives
succeed, according to McKinsey’s study of 3,199
executives in July 2008.
Through 2002, less than 25% of
application projects will deliver
hard, monetary benefits that
exceed the cost of the
implementation Gartner
2004 study found the success
rate of change overall was
only 39%. McKinsey Quarterly
2008 global study of 1,500
change practitioners worldwide found that only
41% of projects were considered successful. IBM
3 24-Jul-10© Canvas4 Pty Ltd 2008
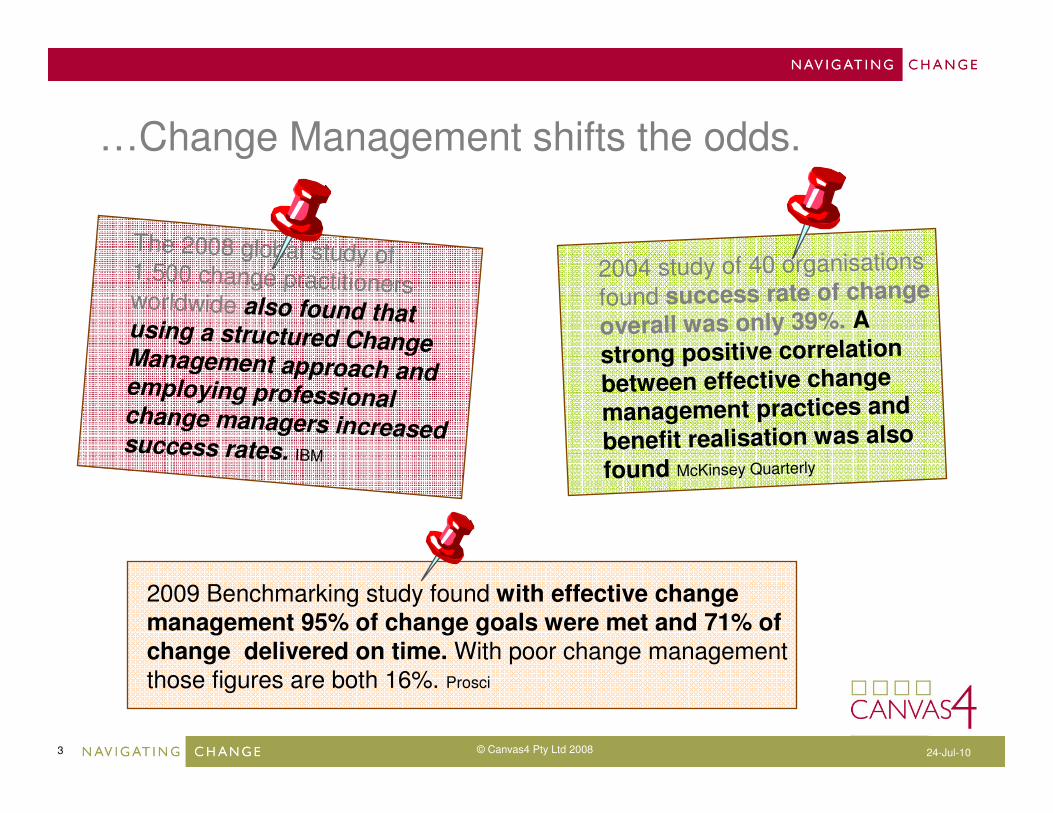
…Change Management shifts the odds.
2009 Benchmarking study found with effective change management 95% of change goals were met and 71% of change delivered on time. With poor change management those figures are both 16%. Prosci
The 2008 global study of 1,500 change practitioners worldwide also found that using a structured Change Management approach and employing professional change managers increased success rates. IBM
2004 study of 40 organisations
found success rate of change
overall was only 39%. A
strong positive correlation
between effective change
management practices and
benefit realisation was also
found McKinsey Quarterly

4 24-Jul-10© Canvas4 Pty Ltd 2008
Mind the Gap
� The gap between the expectation of change and the organisations history of managing it is growing.
IBM Making Change Work Study 2008
5 24-Jul-10© Canvas4 Pty Ltd 2008
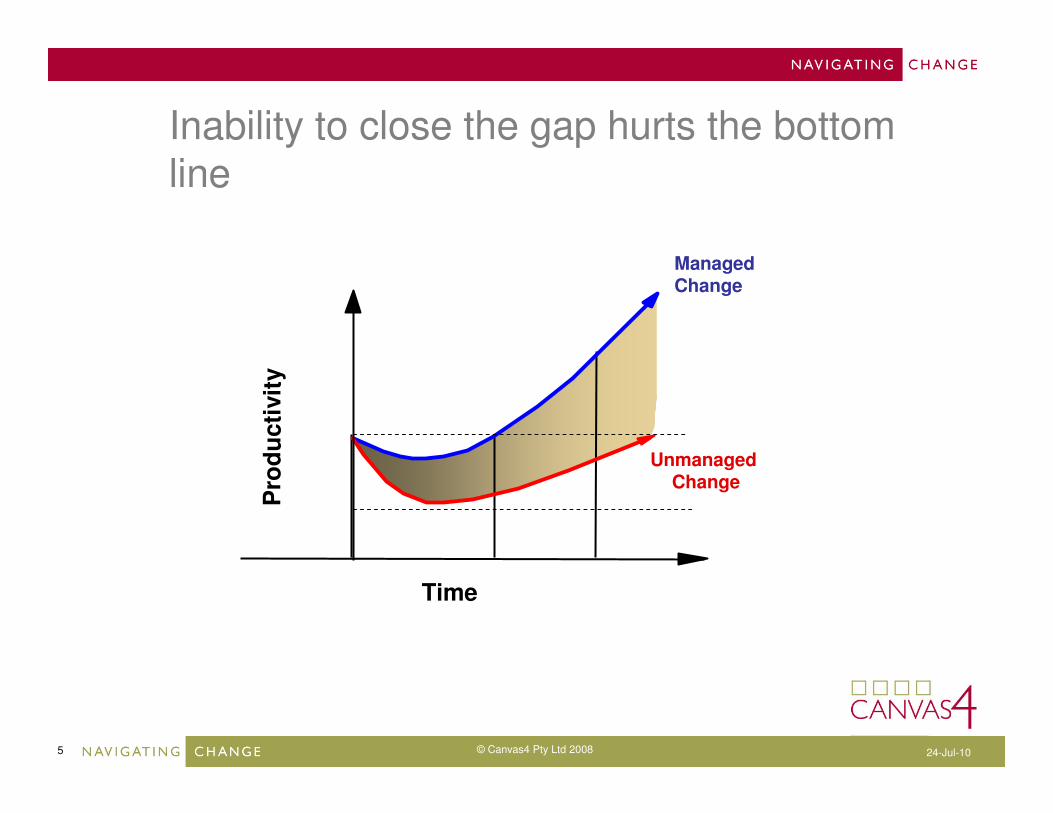
Inability to close the gap hurts the bottom line
Unmanaged Change
Time
Pro
du
cti
vit
yManagedChange
6 24-Jul-10© Canvas4 Pty Ltd 2008
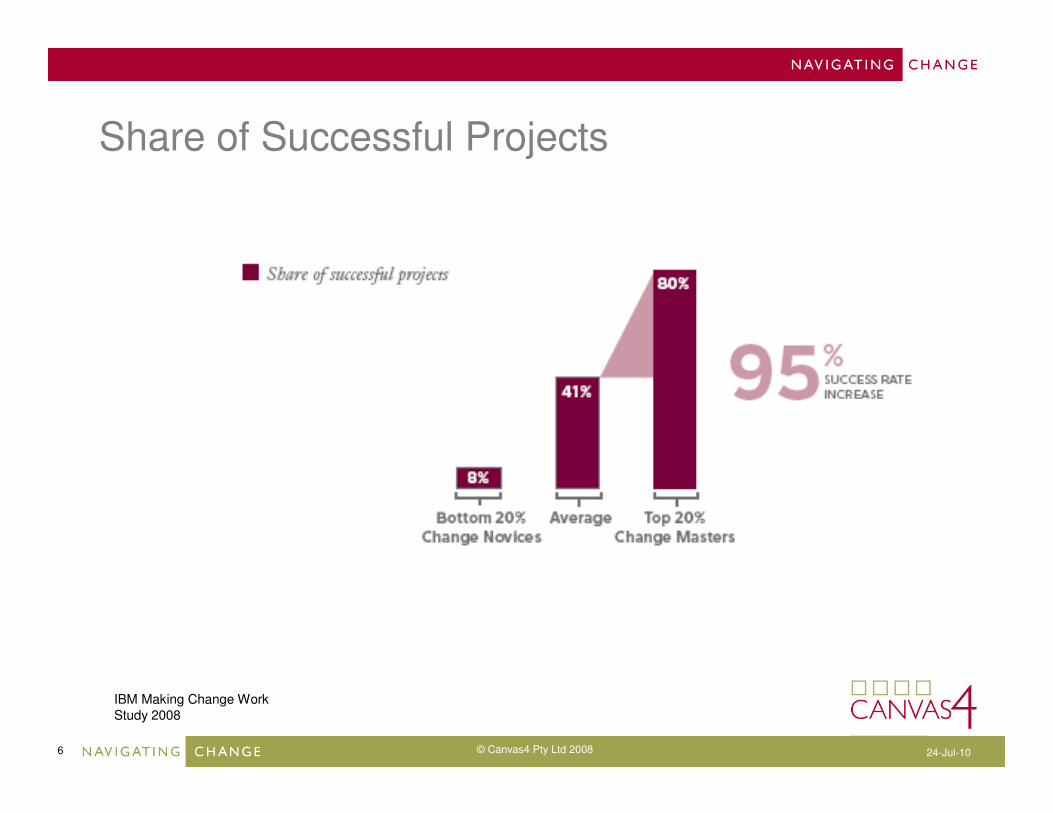
Share of Successful Projects
IBM Making Change Work Study 2008
7 24-Jul-10© Canvas4 Pty Ltd 2008
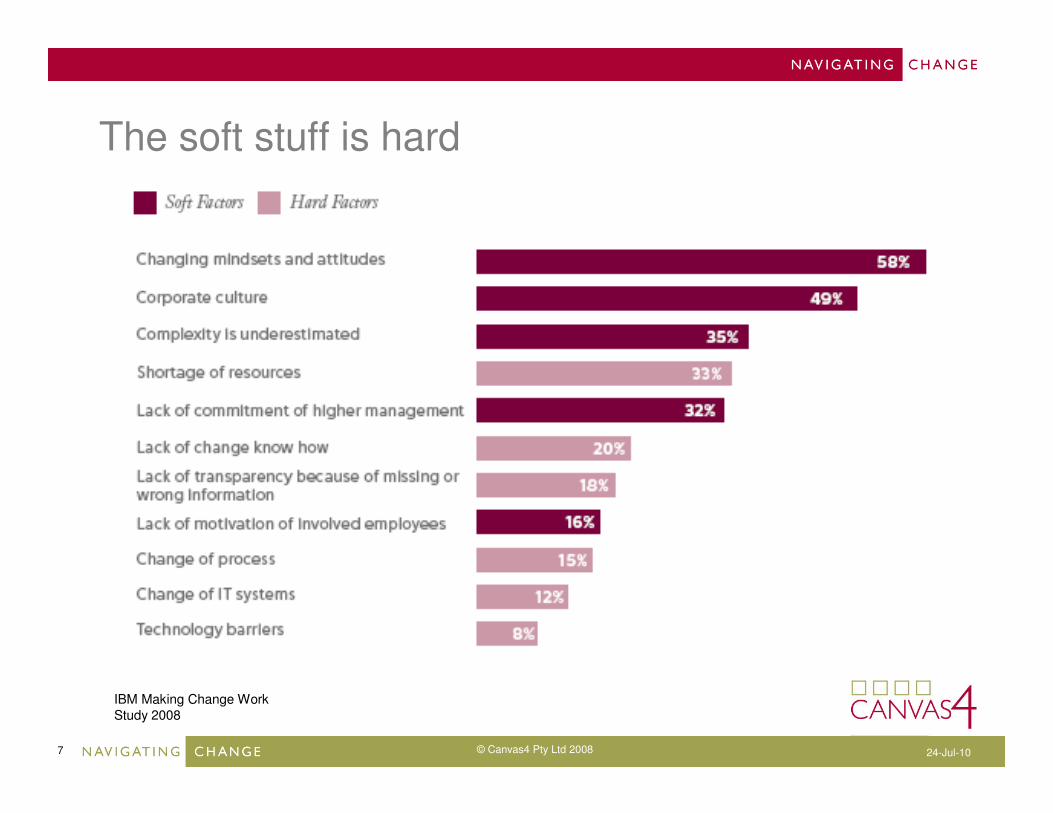
The soft stuff is hard
IBM Making Change Work Study 2008
8 24-Jul-10© Canvas4 Pty Ltd 2008
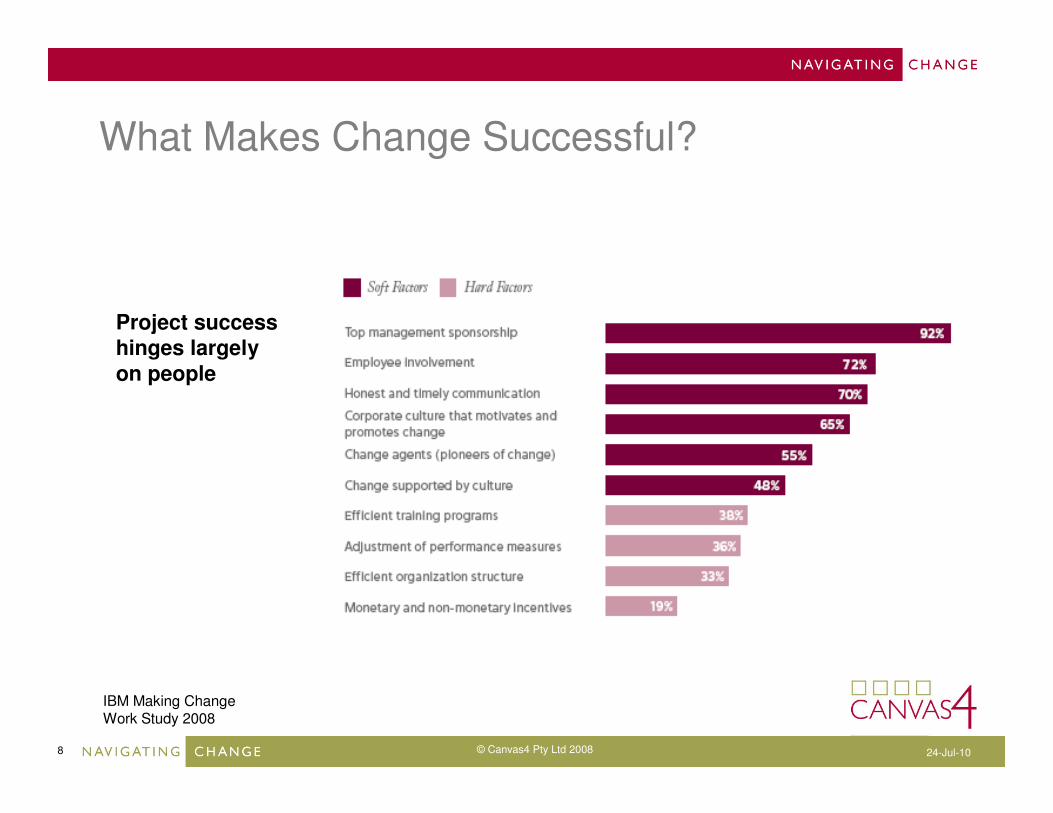
What Makes Change Successful?
Project success hinges largely on people
IBM Making Change Work Study 2008
9 24-Jul-10© Canvas4 Pty Ltd 2008
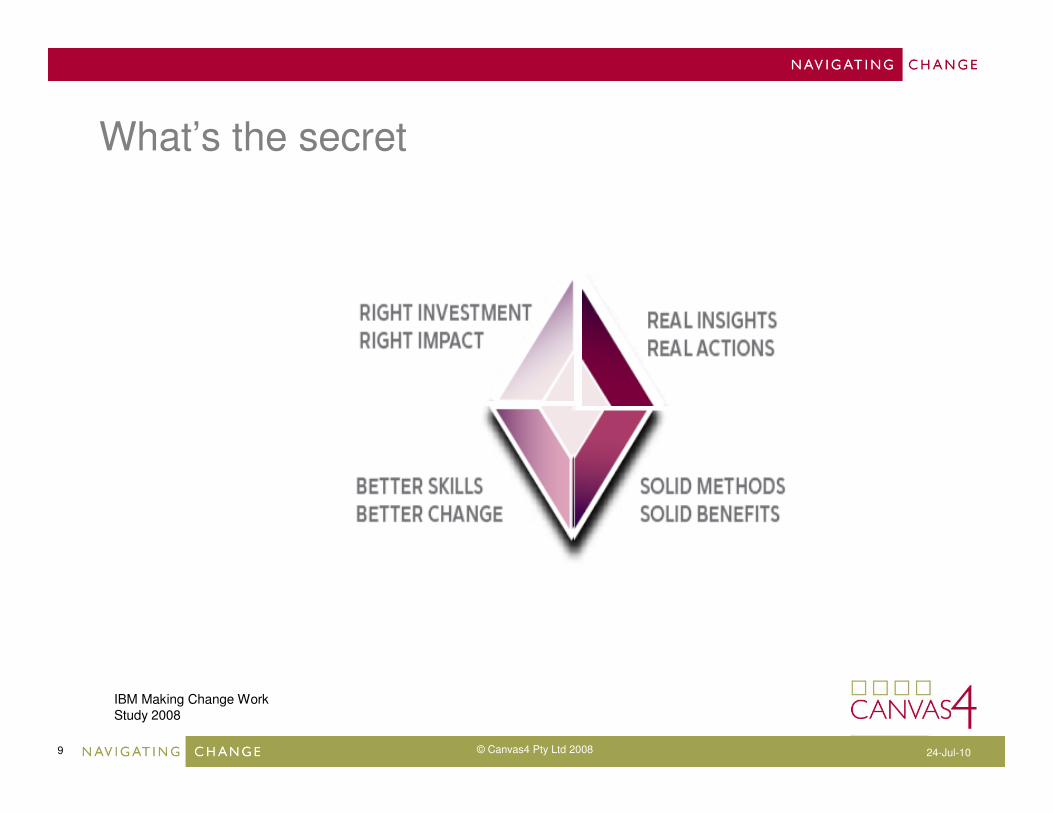
What’s the secret
IBM Making Change Work Study 2008
10 24-Jul-10© Canvas4 Pty Ltd 2008
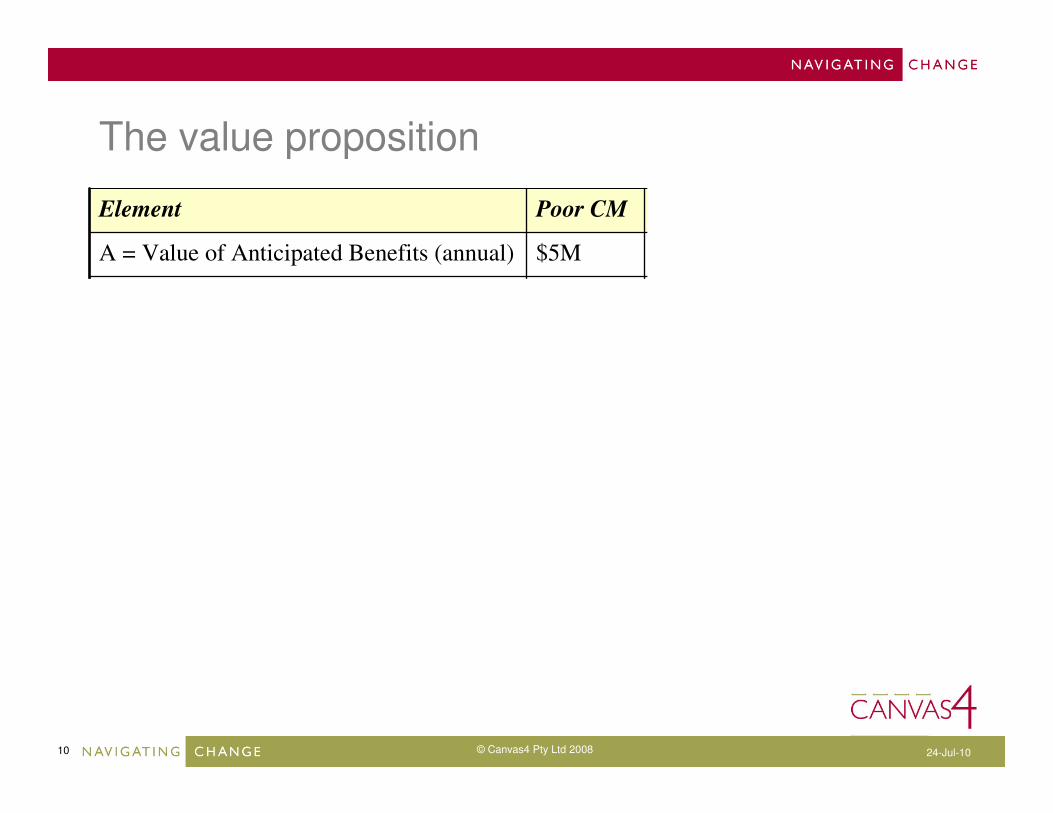
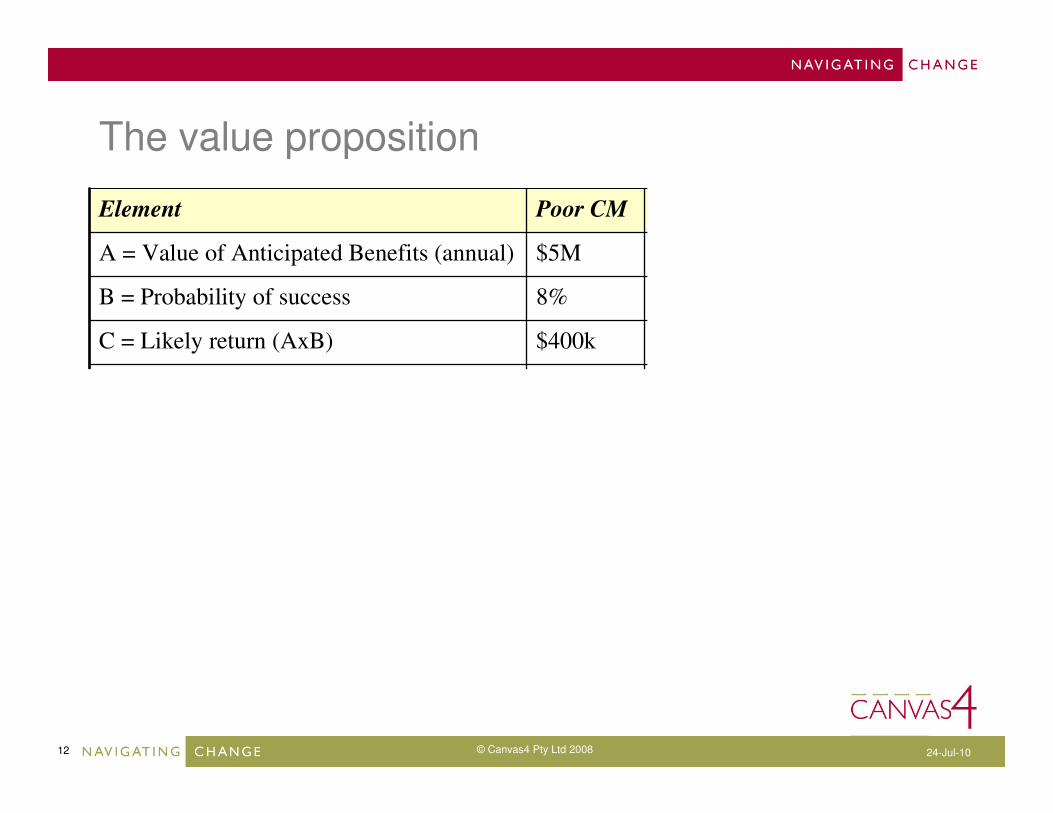
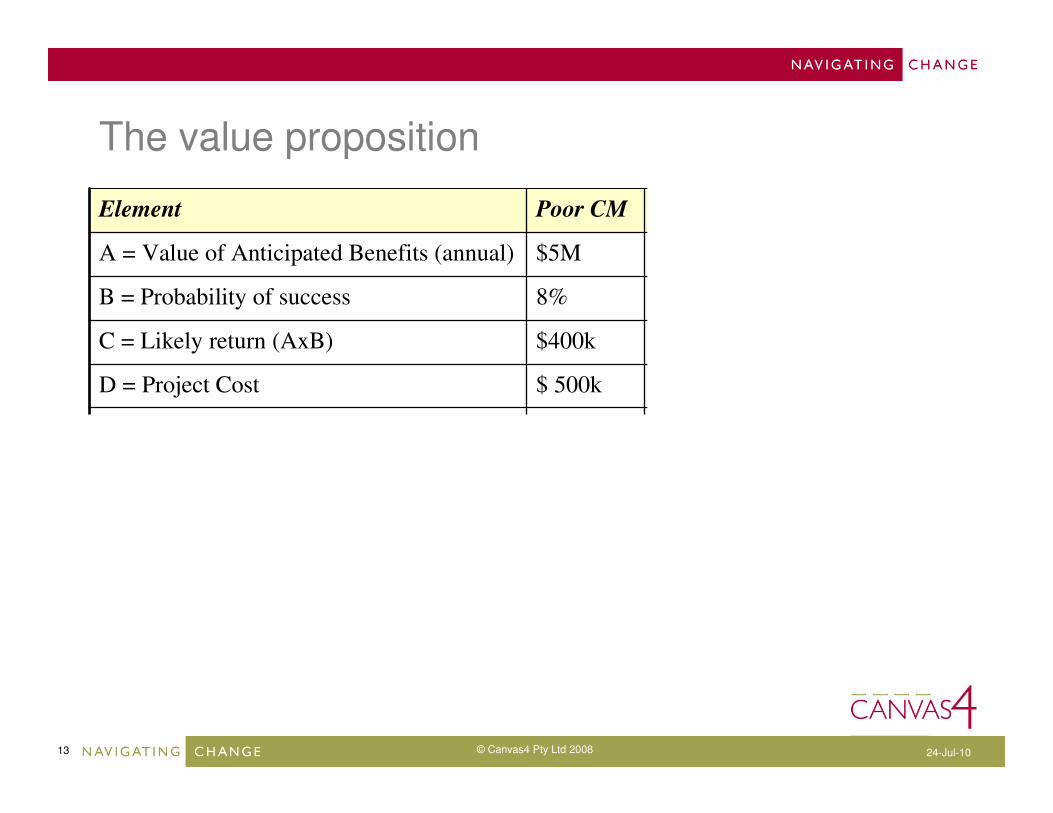
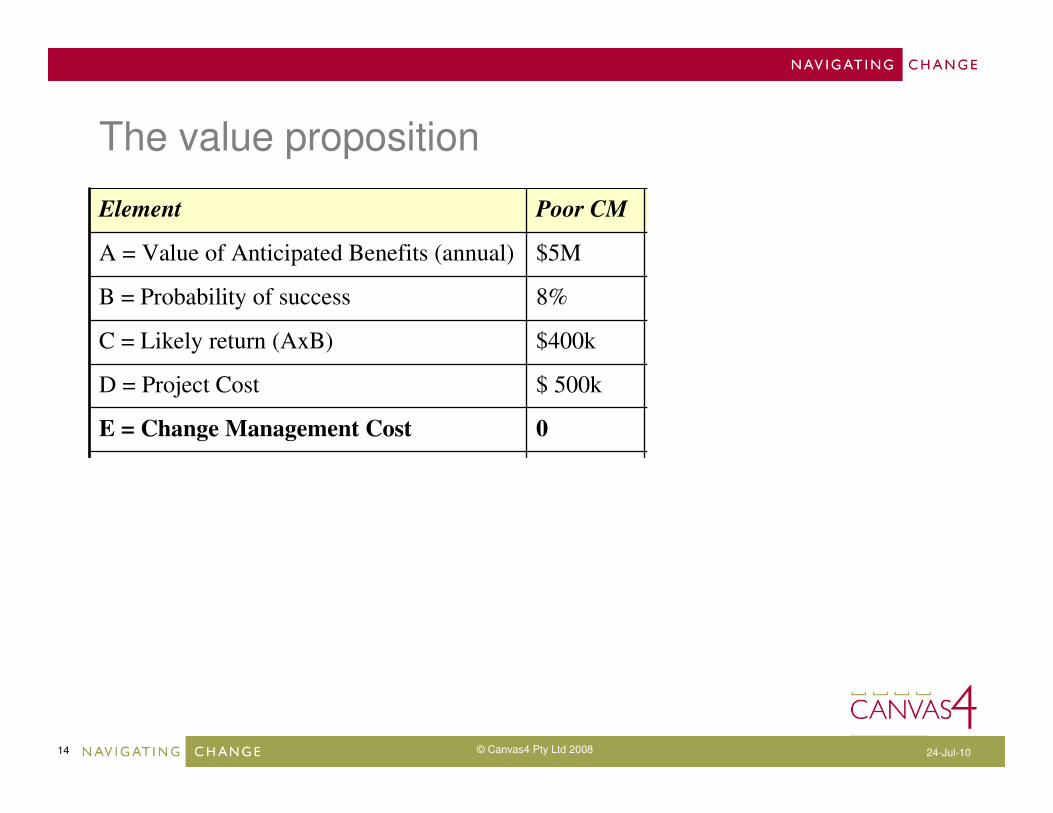
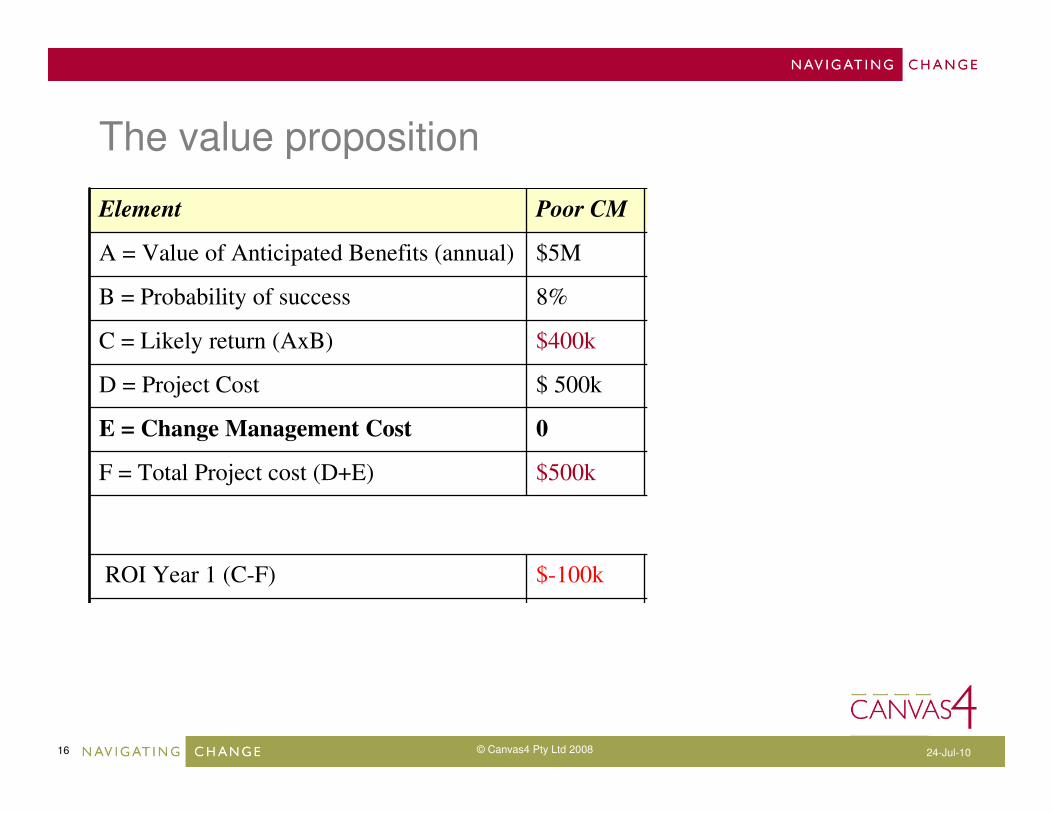
The value proposition
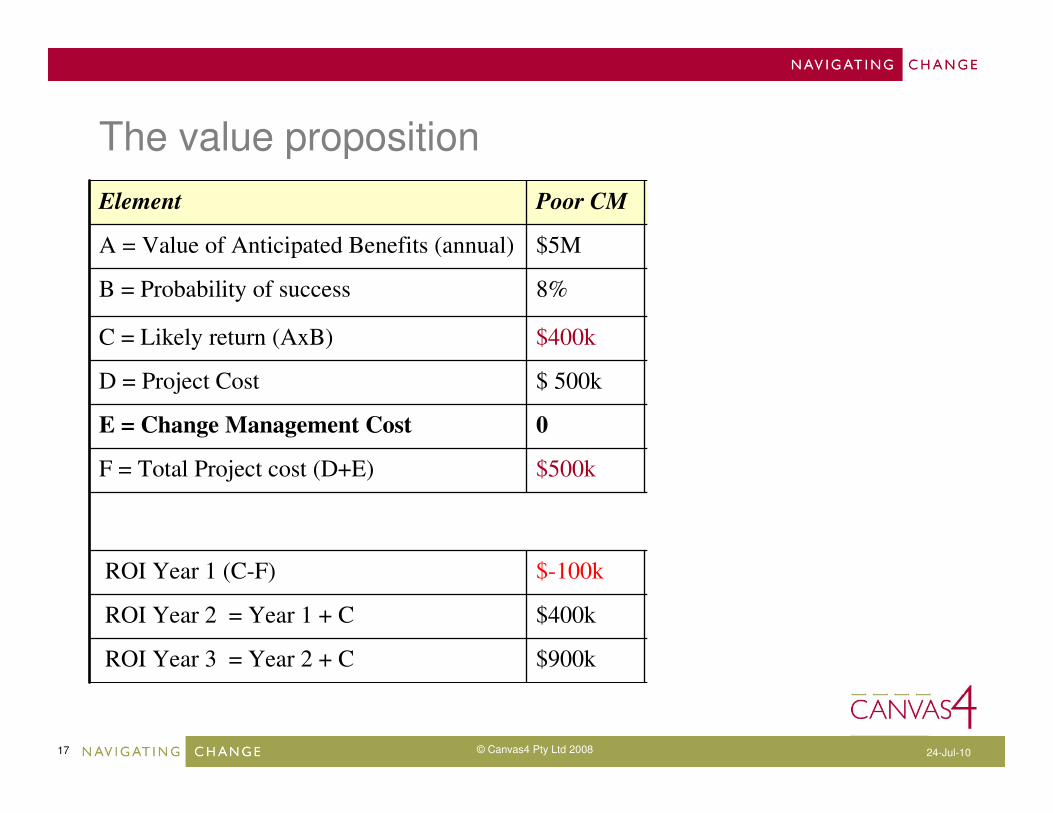
$ 11.435M$ 5.445M$900kROI Year 3 = Year 2 + C
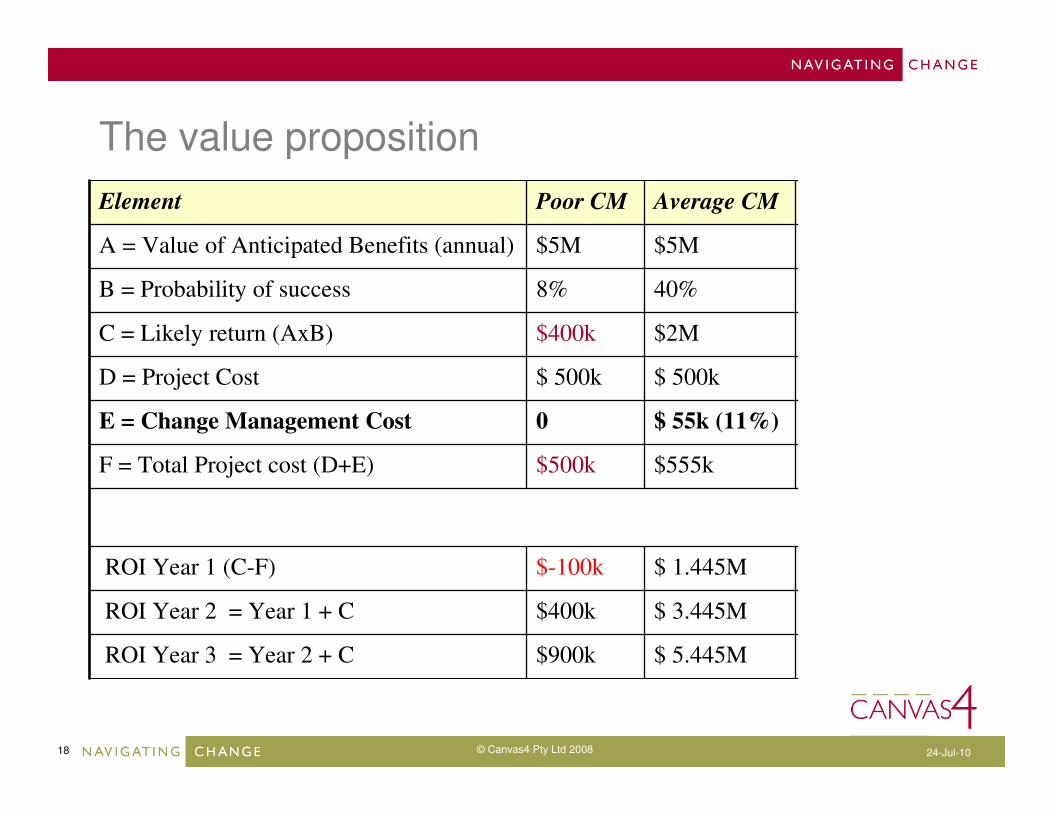
$ 7.435M$ 3.445M$400kROI Year 2 = Year 1 + C
$3.435M$ 1.445M$-100kROI Year 1 (C-F)
$565k$555k$500kF = Total Project cost (D+E)
$ 65k (13%)$ 55k (11%)0 E = Change Management Cost
$ 500k$ 500k$ 500kD = Project Cost
$4M$2M$400kC = Likely return (AxB)
80%40%8%B = Probability of success
$5M$5M$5MA = Value of Anticipated Benefits (annual)
Superior CMAverage CMPoor CMElement

11 24-Jul-10© Canvas4 Pty Ltd 2008
The value proposition
$ 11.435M$ 5.445M$900kROI Year 3 = Year 2 + C
$ 7.435M$ 3.445M$400kROI Year 2 = Year 1 + C
$3.435M$ 1.445M$-100kROI Year 1 (C-F)
$565k$555k$500kF = Total Project cost (D+E)
$ 65k (13%)$ 55k (11%)0 E = Change Management Cost
$ 500k$ 500k$ 500kD = Project Cost
$4M$2M$400kC = Likely return (AxB)
80%40%8%B = Probability of success
$5M$5M$5MA = Value of Anticipated Benefits (annual)
Superior CMAverage CMPoor CMElement
12 24-Jul-10© Canvas4 Pty Ltd 2008
The value proposition
$ 11.435M$ 5.445M$900kROI Year 3 = Year 2 + C
$ 7.435M$ 3.445M$400kROI Year 2 = Year 1 + C
$3.435M$ 1.445M$-100kROI Year 1 (C-F)
$565k$555k$500kF = Total Project cost (D+E)
$ 65k (13%)$ 55k (11%)0 E = Change Management Cost
$ 500k$ 500k$ 500kD = Project Cost
$4M$2M$400kC = Likely return (AxB)
80%40%8%B = Probability of success
$5M$5M$5MA = Value of Anticipated Benefits (annual)
Superior CMAverage CMPoor CMElement
13 24-Jul-10© Canvas4 Pty Ltd 2008
The value proposition
$ 11.435M$ 5.445M$900kROI Year 3 = Year 2 + C
$ 7.435M$ 3.445M$400kROI Year 2 = Year 1 + C
$3.435M$ 1.445M$-100kROI Year 1 (C-F)
$565k$555k$500kF = Total Project cost (D+E)
$ 65k (13%)$ 55k (11%)0 E = Change Management Cost
$ 500k$ 500k$ 500kD = Project Cost
$4M$2M$400kC = Likely return (AxB)
80%40%8%B = Probability of success
$5M$5M$5MA = Value of Anticipated Benefits (annual)
Superior CMAverage CMPoor CMElement
14 24-Jul-10© Canvas4 Pty Ltd 2008
The value proposition
$ 11.435M$ 5.445M$900kROI Year 3 = Year 2 + C
$ 7.435M$ 3.445M$400kROI Year 2 = Year 1 + C
$3.435M$ 1.445M$-100kROI Year 1 (C-F)
$565k$555k$500kF = Total Project cost (D+E)
$ 65k (13%)$ 55k (11%)0 E = Change Management Cost
$ 500k$ 500k$ 500kD = Project Cost
$4M$2M$400kC = Likely return (AxB)
80%40%8%B = Probability of success
$5M$5M$5MA = Value of Anticipated Benefits (annual)
Superior CMAverage CMPoor CMElement

15 24-Jul-10© Canvas4 Pty Ltd 2008
The value proposition
$ 11.435M$ 5.445M$900kROI Year 3 = Year 2 + C
$ 7.435M$ 3.445M$400kROI Year 2 = Year 1 + C
$3.435M$ 1.445M$-100kROI Year 1 (C-F)
$565k$555k$500kF = Total Project cost (D+E)
$ 65k (13%)$ 55k (11%)0 E = Change Management Cost
$ 500k$ 500k$ 500kD = Project Cost
$4M$2M$400kC = Likely return (AxB)
80%40%8%B = Probability of success
$5M$5M$5MA = Value of Anticipated Benefits (annual)
Superior CMAverage CMPoor CMElement
16 24-Jul-10© Canvas4 Pty Ltd 2008
The value proposition
$ 11.435M$ 5.445M$900kROI Year 3 = Year 2 + C
$ 7.435M$ 3.445M$400kROI Year 2 = Year 1 + C
$3.435M$ 1.445M$-100kROI Year 1 (C-F)
$565k$555k$500kF = Total Project cost (D+E)
$ 65k (13%)$ 55k (11%)0 E = Change Management Cost
$ 500k$ 500k$ 500kD = Project Cost
$4M$2M$400kC = Likely return (AxB)
80%40%8%B = Probability of success
$5M$5M$5MA = Value of Anticipated Benefits (annual)
Superior CMAverage CMPoor CMElement
17 24-Jul-10© Canvas4 Pty Ltd 2008
The value proposition
$ 11.435M$ 5.445M$900kROI Year 3 = Year 2 + C
$ 7.435M$ 3.445M$400kROI Year 2 = Year 1 + C
$3.435M$ 1.445M$-100kROI Year 1 (C-F)
$565k$555k$500kF = Total Project cost (D+E)
$ 65k (13%)$ 55k (11%)0 E = Change Management Cost
$ 500k$ 500k$ 500kD = Project Cost
$4M$2M$400kC = Likely return (AxB)
80%40%8%B = Probability of success
$5M$5M$5MA = Value of Anticipated Benefits (annual)
Superior CMAverage CMPoor CMElement
18 24-Jul-10© Canvas4 Pty Ltd 2008
The value proposition
$ 11.435M$ 5.445M$900kROI Year 3 = Year 2 + C
$ 7.435M$ 3.445M$400kROI Year 2 = Year 1 + C
$3.435M$ 1.445M$-100kROI Year 1 (C-F)
$565k$555k$500kF = Total Project cost (D+E)
$ 65k (13%)$ 55k (11%)0 E = Change Management Cost
$ 500k$ 500k$ 500kD = Project Cost
$4M$2M$400kC = Likely return (AxB)
80%40%8%B = Probability of success
$5M$5M$5MA = Value of Anticipated Benefits (annual)
Superior CMAverage CMPoor CMElement
19 24-Jul-10© Canvas4 Pty Ltd 2008
The value proposition
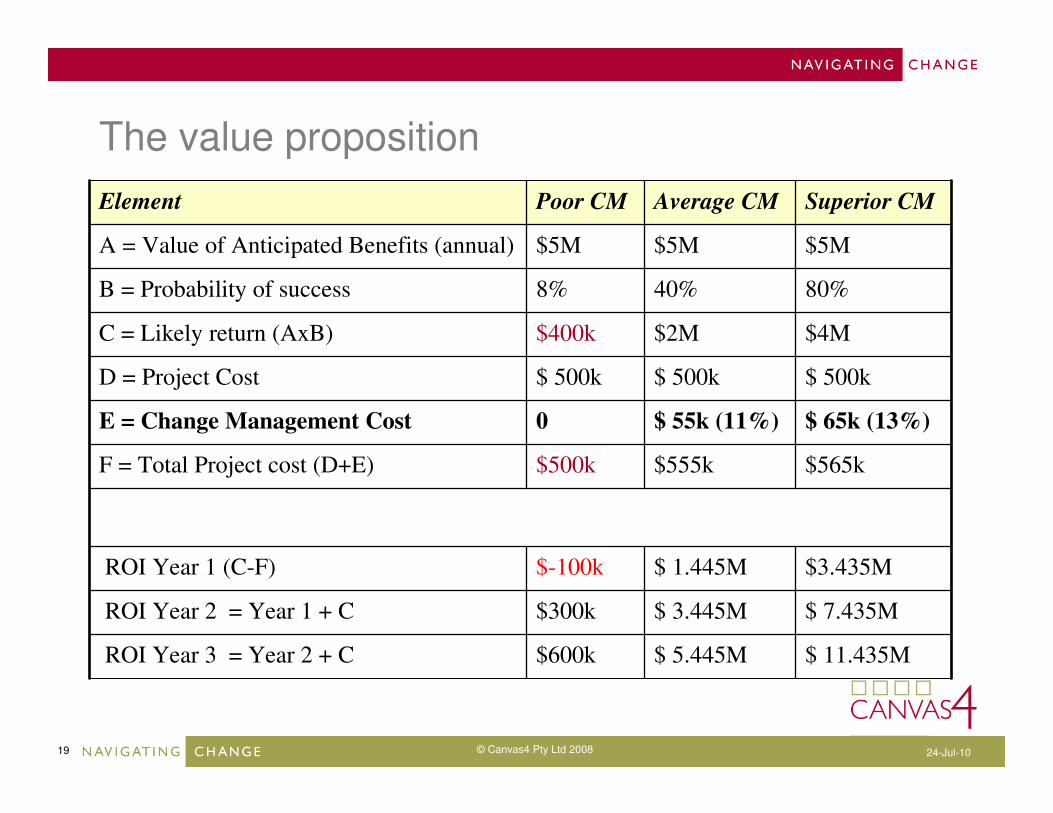
$ 11.435M$ 5.445M$600kROI Year 3 = Year 2 + C
$ 7.435M$ 3.445M$300kROI Year 2 = Year 1 + C
$3.435M$ 1.445M$-100kROI Year 1 (C-F)
$565k$555k$500kF = Total Project cost (D+E)
$ 65k (13%)$ 55k (11%)0 E = Change Management Cost
$ 500k$ 500k$ 500kD = Project Cost
$4M$2M$400kC = Likely return (AxB)
80%40%8%B = Probability of success
$5M$5M$5MA = Value of Anticipated Benefits (annual)
Superior CMAverage CMPoor CMElement

20 24-Jul-10© Canvas4 Pty Ltd 2008
Sample
ROI
-$2,000,000
$0
$2,000,000
$4,000,000
$6,000,000
$8,000,000
$10,000,000
$12,000,000
$14,000,000
Poor CM Average CM Superior CM
Change Management Input
$ B
us
ine
ss
Be
ne
fit
Year 1
Year 2
Year 3
21 24-Jul-10© Canvas4 Pty Ltd 2008
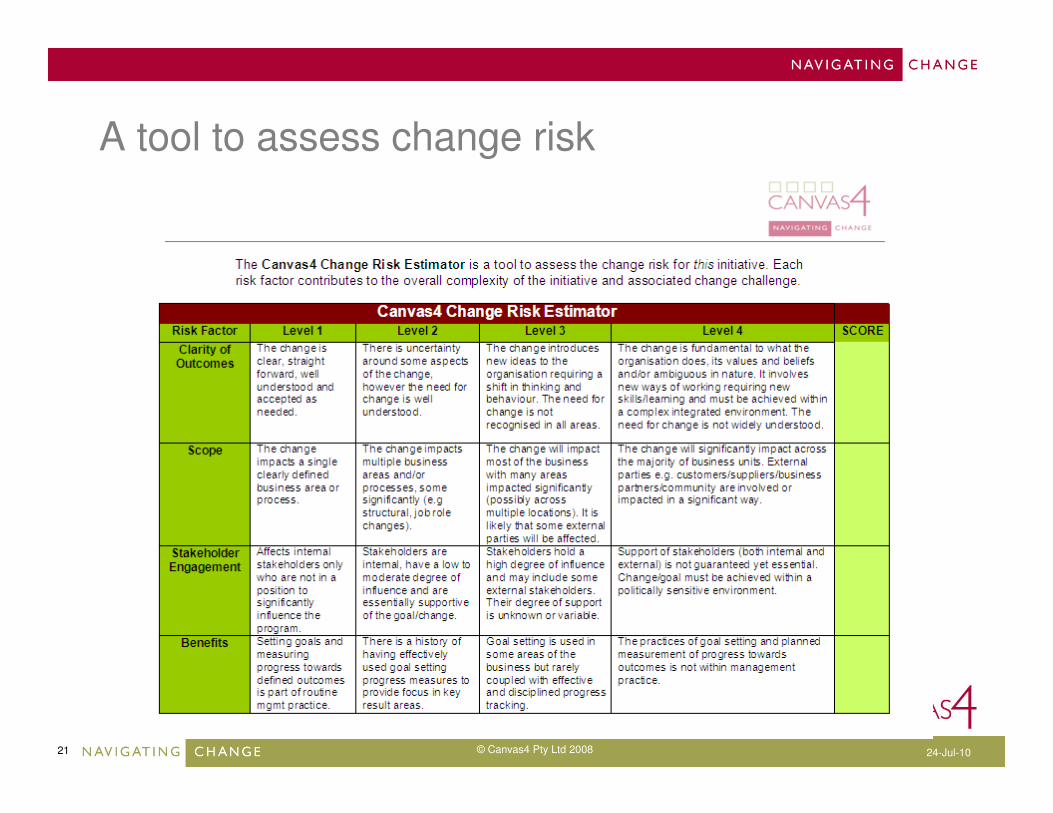
A tool to assess change risk
22 24-Jul-10© Canvas4 Pty Ltd 2008
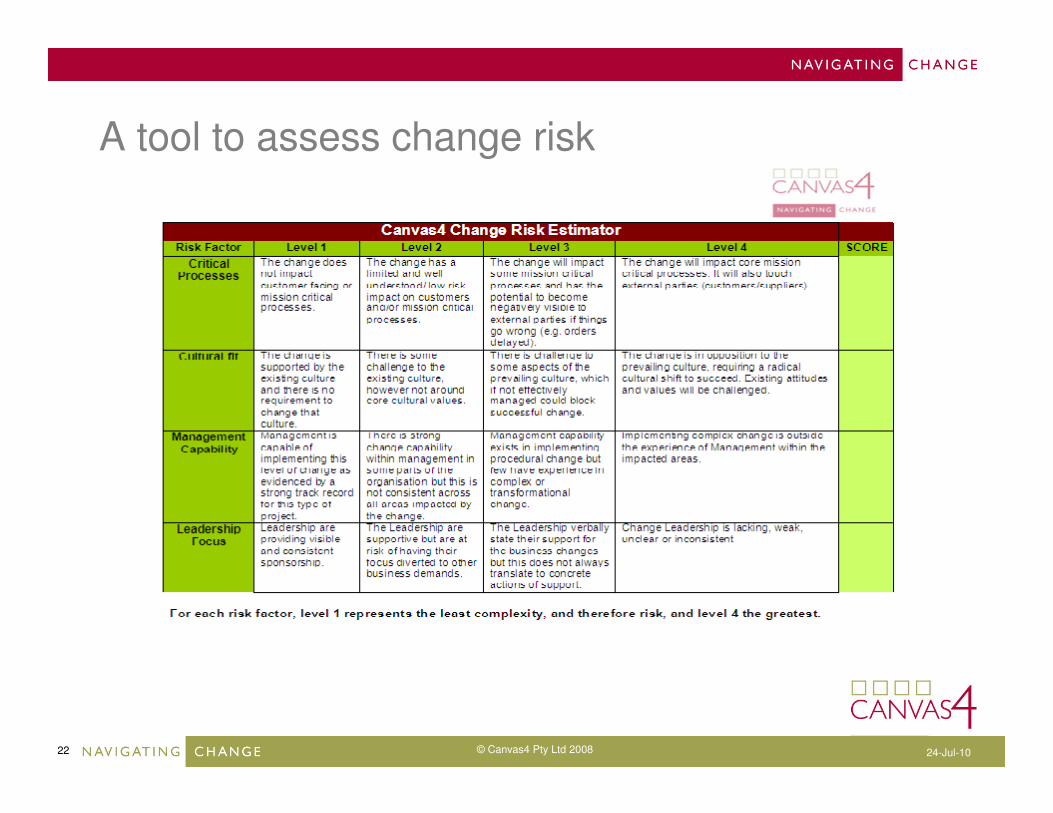
A tool to assess change risk
23 24-Jul-10© Canvas4 Pty Ltd 2008
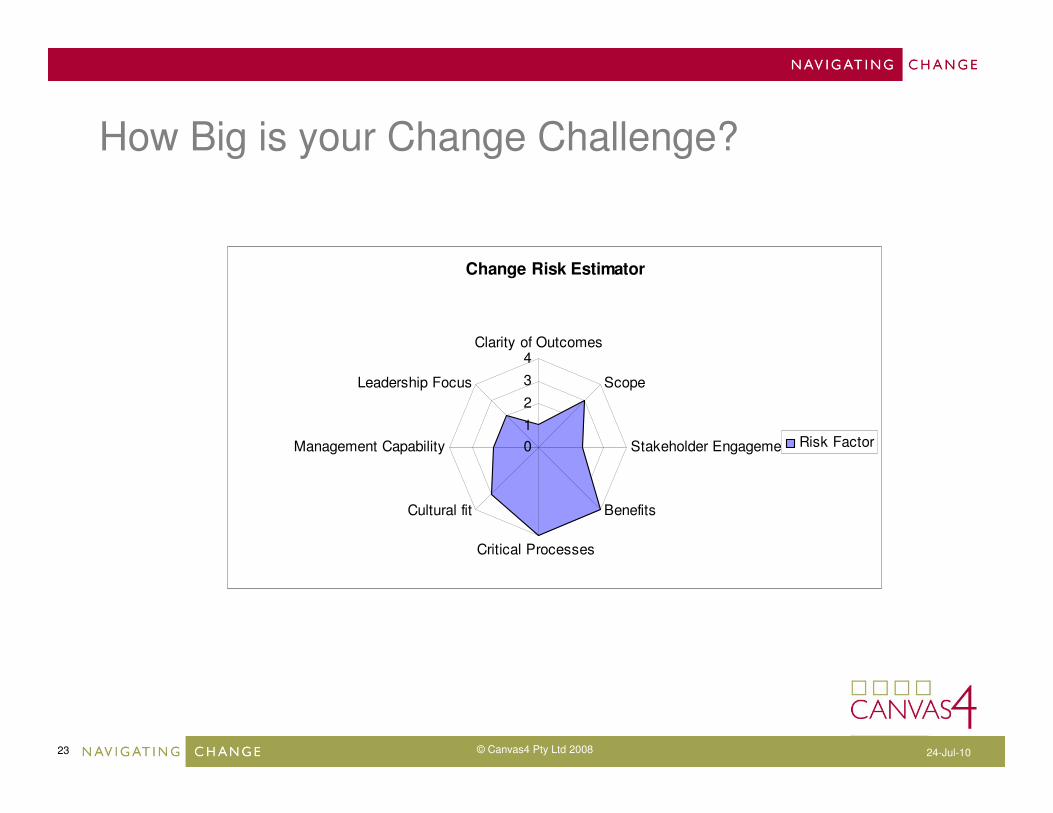
How Big is your Change Challenge?
Change Risk Estimator
0
1
2
3
4Clarity of Outcomes
Scope
Stakeholder Engagement
Benefits
Critical Processes
Cultural fit
Management Capability
Leadership Focus
Risk Factor
24 24-Jul-10© Canvas4 Pty Ltd 2008
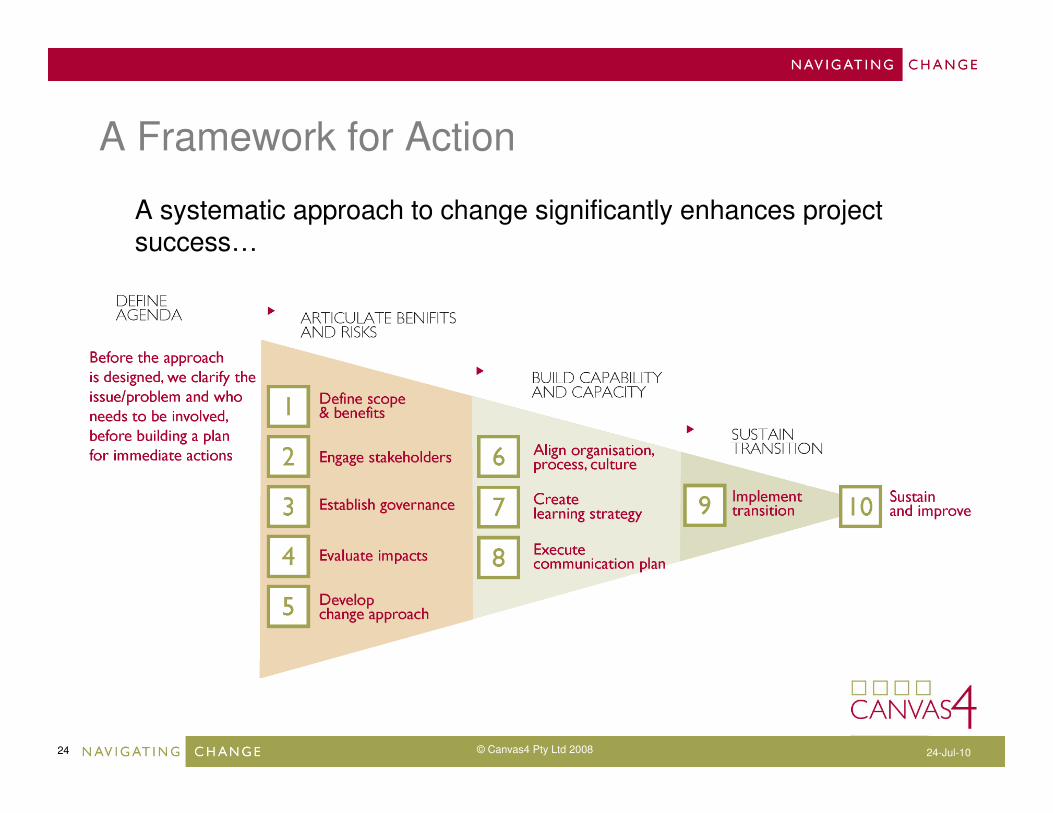
A Framework for Action
A systematic approach to change significantly enhances project success…

25 24-Jul-10© Canvas4 Pty Ltd 2008
Summary
� The evidence is both bad (project outcomes) and good (CM makes a difference)
� The business value case is compelling in $$ terms
� The Change Management Value Proposition needs to be built with the client to build awareness and understanding:
� Articulate the likely $ impacts (The Value Proposition)
� Assist the client to understand the change complexity and risks –e.g.Canvas4 CM Risk Estimator
� Share a structured approach to de-mystify change management