development and application of an hplc method for ... · development and application of an hplc...
TRANSCRIPT
Advanced Pharmaceutical Bulletin, 2013, 3(2), 289-293
doi: http://dx.doi.org/10.5681/apb.2013.047
http://apb.tbzmed.ac.ir/
*Corresponding author: Parvin Zakeri-Milani, Department of Pharmaceutics, Faculty of Pharmacy, Tabriz University of Medical Sciences, Tabriz,
Iran. 51664. Tel: +98 (411) 3392593, Fax: +98 (411) 3344798, E-mail: pzakeri @tbzmed.ac.ir
Copyright © 2013 by Tabriz University of Medical Sciences
Development and Application of an HPLC Method for Erlotinib
Protein Binding Studies
Soheila Bolandnazar1,2
, Adeleh Divsalar1, Hadi Valizadeh
3, Arash Khodaei
4, Parvin Zakeri-Milani
5*
1 Department of Biological Sciences, Kharazmi University, Tehran, Iran.
2 Biotechnology Research Center, Tabriz University of Medical Sciences, Tabriz, Iran.
3 Research Center for Pharmaceutical Nanotechnology and Faculty of Pharmacy, Tabriz University of Medical Sciences, Tabriz, Iran.
4 Department of biological sciences, Institute for Advanced Studies in Basic Sciences, Zanjan, Iran.
5 Drug Applied Research Center and Faculty of Pharmacy, Tabriz University of Medical Sciences, Tabriz, Iran.
Introduction
Lung cancer is the leading cause of cancer mortality in
the world.1-3 The epidermal growth factor receptor
(EGFR) is mutated and over expressed in many human
cancers, such as head and neck, breast, ovarian and
nonsmall cell lung cancers (NSCLC).4 Epidermal
growth factor receptor-tyrosine kinase inhibitors
(EGFR-TKIs) are used as first-line and efficient
therapy in the treatment of advanced non-small cell
lung cancer patients.2,5 The family of epidermal growth
factor receptor (HER1/EGFR), containing four
members, are essential in modulating cell proliferation,
cell differentiation, and cell survival in many tissue
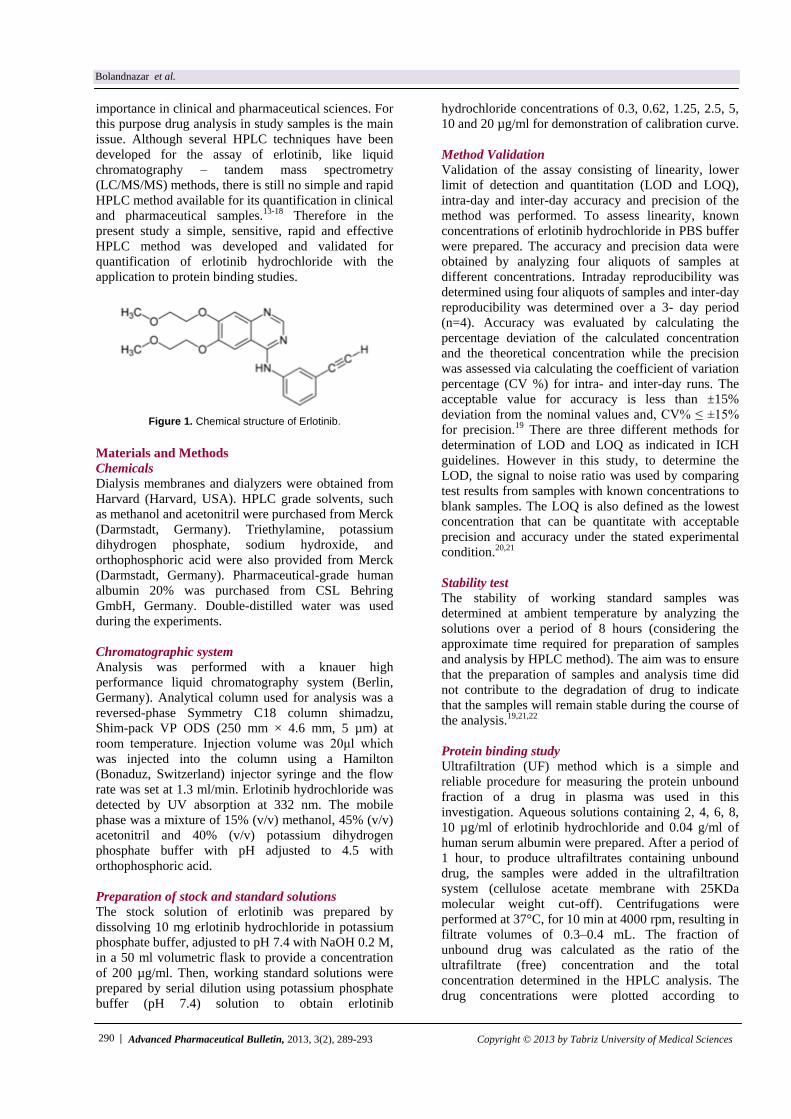
types.6 Erlotinib is a quinazolinamine with the chemical
name of N-(3- ethynylphenyl)- 6,7- bis(2-
methoxyethoxy)- 4- quinazolinamine.7 The chemical
structure of erlotinib is shown in Figure 1.
Plasma protein binding of erlotinib is reported to be
approximately 93% and it has an apparent volume of
distribution of 232 liters.3,8,9 It is a white powder,
slightly soluble in water, soluble in organic solvents
such as ethanol, DMSO, and dimethyl formamide
(DMF), which should be purged with an inert gas.10
Erlotinib is almost a new drug used for the treatment of
non-small cell lung cancer after the failure of more than
one or two courses of previous chemotherapy. It is an
orally available low molecular weight EGFR inhibitor
that binds competitively to the ATP binding site at the
kinase domain of EGFR and inhibits EGFR tyrosine
kinase autophosphorylation by inhibition of the
intracellular domain.3,6 Erlotinib is metabolised by the
hepatic cytochromes in humans, primarily
CYP3A4/CYP3A5 and to a lesser extent by CYP1A2
and the pulmonary isoform CYP1A1.11,12 On the other
hand, binding of drugs to plasma and tissue proteins
significantly affects the pharmacokinetic and
pharmacodynamic behaviors of drugs. The
pharmacologic effect of a drug in the body is related to
the free drug concentration at the target site. Because
the bound drug is kept in the blood stream while the
unbound components of the drug, may be distributed or
metabolized, making them the active part of the drug.
Therefore protein binding studies would be of great
A R T I C L E I N F O A B S T R A C T
Article Type:
Research Article
Article History:
Received: 10 February 2013
Revised: 24 February 2013
Accepted: 26 February 2013
ePublished: 20 August 2013
Keywords:
Erlotinib
HPLC
Protein binding
Ultrafilteration
Purpose: The aim of the present study was to develop a simple and rapid reversed-phase
high performance liquid chromatographic method with UV detection for erlotinib
hydrochloride quantification, which is applicable for protein binding studies. Methods:
Ultrafilteration method was used for protein binding study of erlotinib hydrochloride.
For sample analysis a simple and rapid reversed-phase high performance liquid
chromatographic method with UV detection at 332 nm was developed. The mobile
phase was a mixture of methanol, acetonitril and potassium dihydrogen phosphate buffer
(15:45:40 %v/v) set at flow rate of 1.3 ml/min. Results: The run time for erlotinib
hydrochloride was approximately 6 minutes. The calibration curve was linear over the
range of 320-20000 ng/ml with acceptable intra- and inter-day precision and accuracy.
The intra-day and inter-day precisions were less than 10% and the accuracies of intra
and inter-day assays were within the range of 97.20-104.83% and 98.8-102.2%
respectively. Conclusion: Based on the obtained results, a simple, accurate and precise
reversed-phase isocratic HPLC method with UV detection has been optimized and
validated for the determination of erlotinib hydrochloride in biological samples.
290 |
Bolandnazar et al.
Advanced Pharmaceutical Bulletin, 2013, 3(2), 289-293 Copyright © 2013 by Tabriz University of Medical Sciences
importance in clinical and pharmaceutical sciences. For
this purpose drug analysis in study samples is the main
issue. Although several HPLC techniques have been
developed for the assay of erlotinib, like liquid
chromatography – tandem mass spectrometry
(LC/MS/MS) methods, there is still no simple and rapid
HPLC method available for its quantification in clinical
and pharmaceutical samples.13-18 Therefore in the
present study a simple, sensitive, rapid and effective
HPLC method was developed and validated for
quantification of erlotinib hydrochloride with the
application to protein binding studies.
Figure 1. Chemical structure of Erlotinib.
Materials and Methods
Chemicals
Dialysis membranes and dialyzers were obtained from
Harvard (Harvard, USA). HPLC grade solvents, such
as methanol and acetonitril were purchased from Merck
(Darmstadt, Germany). Triethylamine, potassium
dihydrogen phosphate, sodium hydroxide, and
orthophosphoric acid were also provided from Merck
(Darmstadt, Germany). Pharmaceutical-grade human
albumin 20% was purchased from CSL Behring
GmbH, Germany. Double-distilled water was used
during the experiments.
Chromatographic system
Analysis was performed with a knauer high
performance liquid chromatography system (Berlin,
Germany). Analytical column used for analysis was a
reversed-phase Symmetry C18 column shimadzu,
Shim-pack VP ODS (250 mm × 4.6 mm, 5 µm) at
room temperature. Injection volume was 20μl which
was injected into the column using a Hamilton
(Bonaduz, Switzerland) injector syringe and the flow
rate was set at 1.3 ml/min. Erlotinib hydrochloride was
detected by UV absorption at 332 nm. The mobile
phase was a mixture of 15% (v/v) methanol, 45% (v/v)
acetonitril and 40% (v/v) potassium dihydrogen
phosphate buffer with pH adjusted to 4.5 with
orthophosphoric acid.
Preparation of stock and standard solutions
The stock solution of erlotinib was prepared by
dissolving 10 mg erlotinib hydrochloride in potassium
phosphate buffer, adjusted to pH 7.4 with NaOH 0.2 M,
in a 50 ml volumetric flask to provide a concentration
of 200 µg/ml. Then, working standard solutions were
prepared by serial dilution using potassium phosphate
buffer (pH 7.4) solution to obtain erlotinib
hydrochloride concentrations of 0.3, 0.62, 1.25, 2.5, 5,
10 and 20 µg/ml for demonstration of calibration curve.
Method Validation
Validation of the assay consisting of linearity, lower
limit of detection and quantitation (LOD and LOQ),
intra-day and inter-day accuracy and precision of the
method was performed. To assess linearity, known
concentrations of erlotinib hydrochloride in PBS buffer
were prepared. The accuracy and precision data were
obtained by analyzing four aliquots of samples at
different concentrations. Intraday reproducibility was
determined using four aliquots of samples and inter-day
reproducibility was determined over a 3- day period
(n=4). Accuracy was evaluated by calculating the
percentage deviation of the calculated concentration
and the theoretical concentration while the precision
was assessed via calculating the coefficient of variation
percentage (CV %) for intra- and inter-day runs. The
acceptable value for accuracy is less than ±15%
deviation from the nominal values and, CV% ≤ ±15%
for precision.19 There are three different methods for
determination of LOD and LOQ as indicated in ICH
guidelines. However in this study, to determine the
LOD, the signal to noise ratio was used by comparing
test results from samples with known concentrations to
blank samples. The LOQ is also defined as the lowest
concentration that can be quantitate with acceptable
precision and accuracy under the stated experimental
condition.20,21
Stability test
The stability of working standard samples was
determined at ambient temperature by analyzing the
solutions over a period of 8 hours (considering the
approximate time required for preparation of samples
and analysis by HPLC method). The aim was to ensure
that the preparation of samples and analysis time did
not contribute to the degradation of drug to indicate
that the samples will remain stable during the course of
the analysis.19,21,22
Protein binding study
Ultrafiltration (UF) method which is a simple and
reliable procedure for measuring the protein unbound
fraction of a drug in plasma was used in this
investigation. Aqueous solutions containing 2, 4, 6, 8,
10 µg/ml of erlotinib hydrochloride and 0.04 g/ml of
human serum albumin were prepared. After a period of
1 hour, to produce ultrafiltrates containing unbound
drug, the samples were added in the ultrafiltration
system (cellulose acetate membrane with 25KDa
molecular weight cut-off). Centrifugations were
performed at 37°C, for 10 min at 4000 rpm, resulting in
filtrate volumes of 0.3–0.4 mL. The fraction of
unbound drug was calculated as the ratio of the
ultrafiltrate (free) concentration and the total
concentration determined in the HPLC analysis. The
drug concentrations were plotted according to

| 291
HPLC method development for erlotinib
Advanced Pharmaceutical Bulletin, 2013, 3(2), 289-293
Copyright © 2013 by Tabriz University of Medical Sciences
Scatchard where the abscissa represents the binding r
(the number of molecules of drug bound per molecule
of albumin), and the ordinate r/Df (Df is free drug
concentration). The data of r and Df were fitted by
linear least squares regression analysis. Then the
number of binding sites and association constants were
calculated.23
Results and Discussion
Linearity
Six standard samples (0.3, 0.6, 1.2, 2.5, 5, 10 and 20
µg/ml) were prepared to generate the calibration curve
for linearity of the method. Representative
chromatogram of consecutively concentrations of
erlotinib hydrochloride is shown in Figure 2. Statistical
analysis using least square regression indicated
excellent linearity for erlotinib hydrochloride in the
mentioned range. A good correlation between erlotinib
hydrochloride peak heights and drug concentration was
observed with r2 ≥ 0.99 for all standard curves (Table 1).
Concentration curves for erlotinib hydrochloride had a
mean slope, intercept and r2 of 0.33, -22.8 and 0.996
respectively. The retention time was approximately 6
min.
Figure 2. Representative chromatogram of erlotinib hydrochloride standard samples with different concentrations.
Table 1. Analytical parameters of erlotinib hydrochloride
calibration curves on three consecutive days.
Standard curve Slope Intercept r2
Day 1 8861.0 2053.0 0.9979
Day 2 9010.6 1776.1 0.9970
Day 3 9019.2 1343.0 0.9976
Mean 8963.6 1724.0 0.9970
RSD 0.009 0.207 0.0004
LOD and LOQ
The LOD was defined as the analyte concentration that
gives a signal equal to yb+3.3sb, where yb is the signal
of the blank and sb is its standard deviation. Similarly,
the LOQ was defined as yb+10sb. In the unweiged least-
squares method it is quite suitable in practice to use sxy
(Residual standard deviation) instead of sb and the
value of the calculated intercept instead of yb. Thus
LOD = 3.3 sxy / b and LOQ = 10 sxy /b, Where b is the
slope of the regression line. Based on the above
equations, the calculated LOD and LOQ values for
erlotinib hydrochloride were 46 and 150 ng/ ml
respectively.
Accuracy and Precision
The intra- and inter-day precision and accuracy was
shown as percent of coefficient of variation (CV %)
and mean percentage of analyte recovered in the assay,
respectively. The Intra-day precision, accuracy and
relative errors range were calculated to be 1.91-3.07%,
97.2-104.83% and 0.6- 4.83, respectively. The same
parameters for inter-day evaluations were 1.56-9.91%,
98.8-100% and 0-2.2%, respectively. Precision (CV %)
and relative error percent acquired at all of
concentrations do not exceed ±15% (Table 2) which is
required by guidelines.
292 |
Bolandnazar et al.
Advanced Pharmaceutical Bulletin, 2013, 3(2), 289-293 Copyright © 2013 by Tabriz University of Medical Sciences
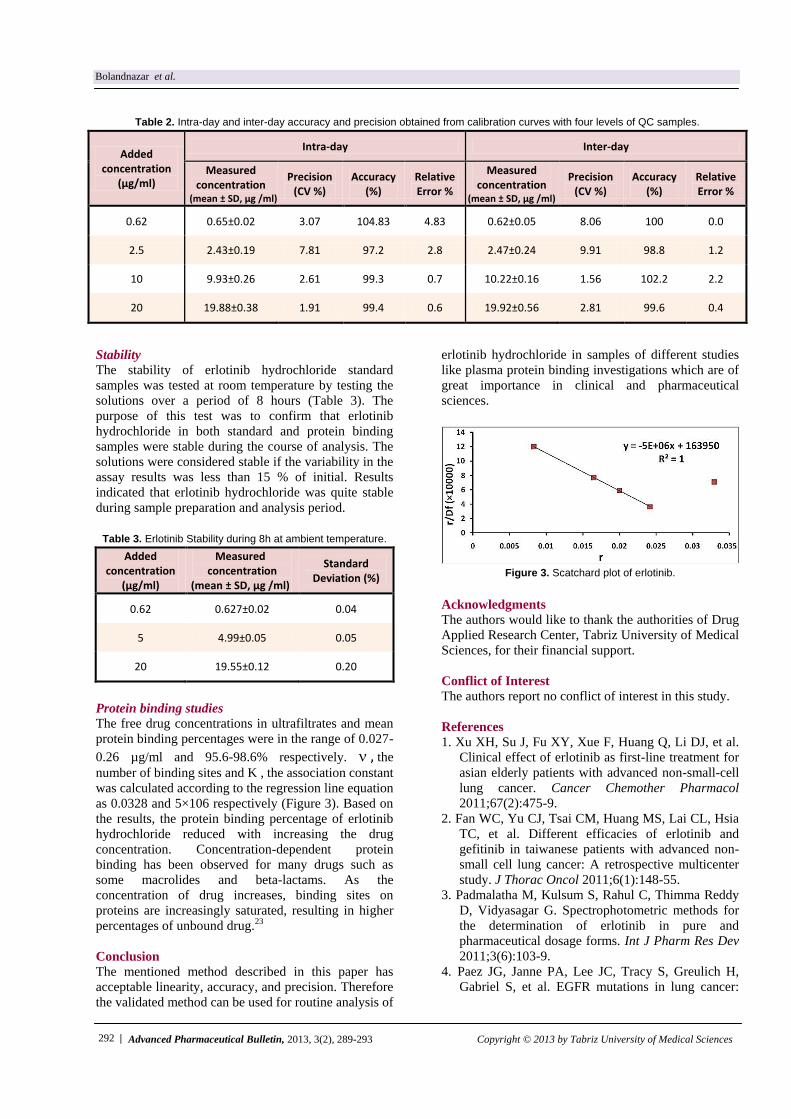
Table 2. Intra-day and inter-day accuracy and precision obtained from calibration curves with four levels of QC samples.
Added concentration
(µg/ml)
Intra-day Inter-day
Measured concentration
(mean ± SD, µg /ml)
Precision (CV %)
Accuracy (%)
Relative Error %
Measured concentration
(mean ± SD, µg /ml)
Precision (CV %)
Accuracy (%)
Relative Error %
0.62 0.65±0.02 3.07 104.83 4.83 0.62±0.05 8.06 100 0.0
2.5 2.43±0.19 7.81 97.2 2.8 2.47±0.24 9.91 98.8 1.2
10 9.93±0.26 2.61 99.3 0.7 10.22±0.16 1.56 102.2 2.2
20 19.88±0.38 1.91 99.4 0.6 19.92±0.56 2.81 99.6 0.4
Stability
The stability of erlotinib hydrochloride standard
samples was tested at room temperature by testing the
solutions over a period of 8 hours (Table 3). The
purpose of this test was to confirm that erlotinib
hydrochloride in both standard and protein binding
samples were stable during the course of analysis. The
solutions were considered stable if the variability in the
assay results was less than 15 % of initial. Results
indicated that erlotinib hydrochloride was quite stable
during sample preparation and analysis period.
Table 3. Erlotinib Stability during 8h at ambient temperature.
Added concentration
(µg/ml)
Measured concentration
(mean ± SD, µg /ml)
Standard Deviation (%)
0.62 0.627±0.02 0.04
5 4.99±0.05 0.05
20 19.55±0.12 0.20
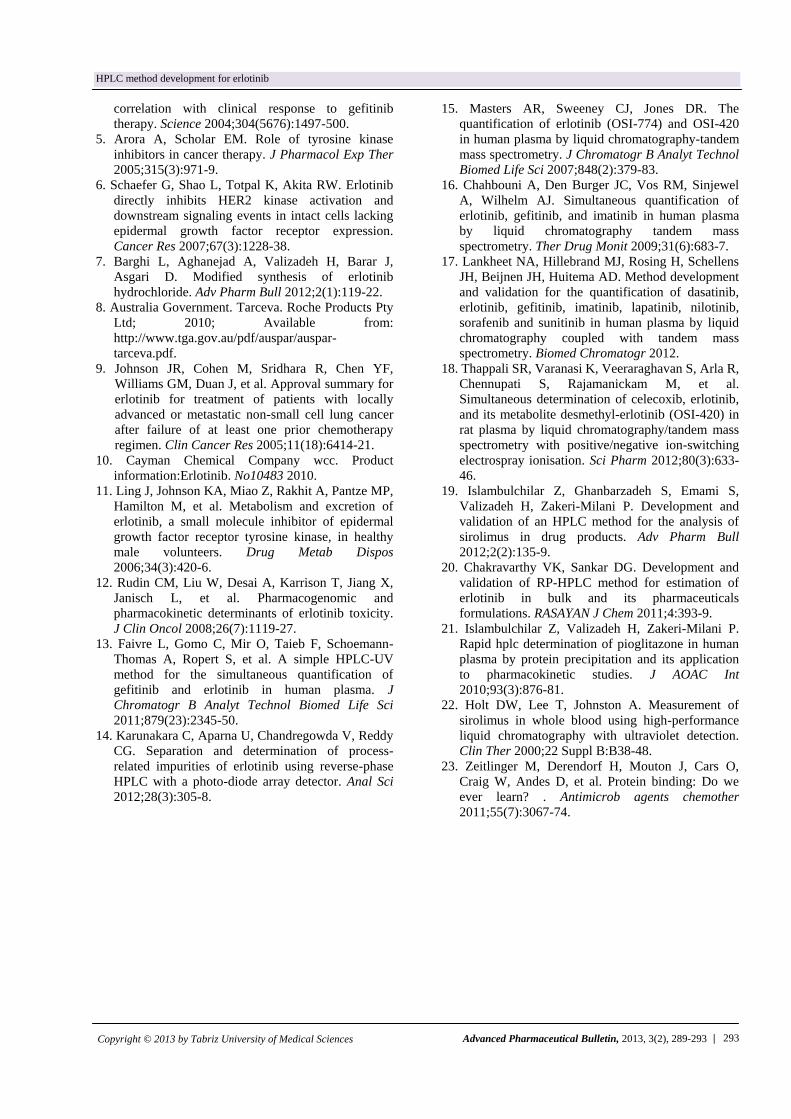
Protein binding studies
The free drug concentrations in ultrafiltrates and mean
protein binding percentages were in the range of 0.027-
0.26 µg/ml and 95.6-98.6% respectively. the
number of binding sites and K , the association constant
was calculated according to the regression line equation
as 0.0328 and 5×10⁶ respectively (Figure 3). Based on
the results, the protein binding percentage of erlotinib
hydrochloride reduced with increasing the drug
concentration. Concentration-dependent protein
binding has been observed for many drugs such as
some macrolides and beta-lactams. As the
concentration of drug increases, binding sites on
proteins are increasingly saturated, resulting in higher
percentages of unbound drug.23
Conclusion
The mentioned method described in this paper has
acceptable linearity, accuracy, and precision. Therefore
the validated method can be used for routine analysis of
erlotinib hydrochloride in samples of different studies
like plasma protein binding investigations which are of
great importance in clinical and pharmaceutical
sciences.
Figure 3. Scatchard plot of erlotinib.
Acknowledgments
The authors would like to thank the authorities of Drug
Applied Research Center, Tabriz University of Medical
Sciences, for their financial support.
Conflict of Interest
The authors report no conflict of interest in this study.
References
1. Xu XH, Su J, Fu XY, Xue F, Huang Q, Li DJ, et al.
Clinical effect of erlotinib as first-line treatment for
asian elderly patients with advanced non-small-cell
lung cancer. Cancer Chemother Pharmacol
2011;67(2):475-9.
2. Fan WC, Yu CJ, Tsai CM, Huang MS, Lai CL, Hsia
TC, et al. Different efficacies of erlotinib and
gefitinib in taiwanese patients with advanced non-
small cell lung cancer: A retrospective multicenter
study. J Thorac Oncol 2011;6(1):148-55.
3. Padmalatha M, Kulsum S, Rahul C, Thimma Reddy
D, Vidyasagar G. Spectrophotometric methods for
the determination of erlotinib in pure and
pharmaceutical dosage forms. Int J Pharm Res Dev
2011;3(6):103-9.
4. Paez JG, Janne PA, Lee JC, Tracy S, Greulich H,
Gabriel S, et al. EGFR mutations in lung cancer:
| 293
HPLC method development for erlotinib
Advanced Pharmaceutical Bulletin, 2013, 3(2), 289-293
Copyright © 2013 by Tabriz University of Medical Sciences
correlation with clinical response to gefitinib
therapy. Science 2004;304(5676):1497-500.
5. Arora A, Scholar EM. Role of tyrosine kinase
inhibitors in cancer therapy. J Pharmacol Exp Ther
2005;315(3):971-9.
6. Schaefer G, Shao L, Totpal K, Akita RW. Erlotinib
directly inhibits HER2 kinase activation and
downstream signaling events in intact cells lacking
epidermal growth factor receptor expression.
Cancer Res 2007;67(3):1228-38.
7. Barghi L, Aghanejad A, Valizadeh H, Barar J,
Asgari D. Modified synthesis of erlotinib
hydrochloride. Adv Pharm Bull 2012;2(1):119-22.
8. Australia Government. Tarceva. Roche Products Pty
Ltd; 2010; Available from:
http://www.tga.gov.au/pdf/auspar/auspar-
tarceva.pdf.
9. Johnson JR, Cohen M, Sridhara R, Chen YF,
Williams GM, Duan J, et al. Approval summary for
erlotinib for treatment of patients with locally
advanced or metastatic non-small cell lung cancer
after failure of at least one prior chemotherapy
regimen. Clin Cancer Res 2005;11(18):6414-21.
10. Cayman Chemical Company wcc. Product
information:Erlotinib. No10483 2010.
11. Ling J, Johnson KA, Miao Z, Rakhit A, Pantze MP,
Hamilton M, et al. Metabolism and excretion of
erlotinib, a small molecule inhibitor of epidermal
growth factor receptor tyrosine kinase, in healthy
male volunteers. Drug Metab Dispos
2006;34(3):420-6.
12. Rudin CM, Liu W, Desai A, Karrison T, Jiang X,
Janisch L, et al. Pharmacogenomic and
pharmacokinetic determinants of erlotinib toxicity.
J Clin Oncol 2008;26(7):1119-27.
13. Faivre L, Gomo C, Mir O, Taieb F, Schoemann-
Thomas A, Ropert S, et al. A simple HPLC-UV
method for the simultaneous quantification of
gefitinib and erlotinib in human plasma. J
Chromatogr B Analyt Technol Biomed Life Sci
2011;879(23):2345-50.
14. Karunakara C, Aparna U, Chandregowda V, Reddy
CG. Separation and determination of process-
related impurities of erlotinib using reverse-phase
HPLC with a photo-diode array detector. Anal Sci
2012;28(3):305-8.
15. Masters AR, Sweeney CJ, Jones DR. The
quantification of erlotinib (OSI-774) and OSI-420
in human plasma by liquid chromatography-tandem
mass spectrometry. J Chromatogr B Analyt Technol
Biomed Life Sci 2007;848(2):379-83.
16. Chahbouni A, Den Burger JC, Vos RM, Sinjewel
A, Wilhelm AJ. Simultaneous quantification of
erlotinib, gefitinib, and imatinib in human plasma
by liquid chromatography tandem mass
spectrometry. Ther Drug Monit 2009;31(6):683-7.
17. Lankheet NA, Hillebrand MJ, Rosing H, Schellens
JH, Beijnen JH, Huitema AD. Method development
and validation for the quantification of dasatinib,
erlotinib, gefitinib, imatinib, lapatinib, nilotinib,
sorafenib and sunitinib in human plasma by liquid
chromatography coupled with tandem mass
spectrometry. Biomed Chromatogr 2012.
18. Thappali SR, Varanasi K, Veeraraghavan S, Arla R,
Chennupati S, Rajamanickam M, et al.
Simultaneous determination of celecoxib, erlotinib,
and its metabolite desmethyl-erlotinib (OSI-420) in
rat plasma by liquid chromatography/tandem mass
spectrometry with positive/negative ion-switching
electrospray ionisation. Sci Pharm 2012;80(3):633-
46.
19. Islambulchilar Z, Ghanbarzadeh S, Emami S,
Valizadeh H, Zakeri-Milani P. Development and
validation of an HPLC method for the analysis of
sirolimus in drug products. Adv Pharm Bull
2012;2(2):135-9.
20. Chakravarthy VK, Sankar DG. Development and
validation of RP-HPLC method for estimation of
erlotinib in bulk and its pharmaceuticals
formulations. RASAYAN J Chem 2011;4:393-9.
21. Islambulchilar Z, Valizadeh H, Zakeri-Milani P.
Rapid hplc determination of pioglitazone in human
plasma by protein precipitation and its application
to pharmacokinetic studies. J AOAC Int
2010;93(3):876-81.
22. Holt DW, Lee T, Johnston A. Measurement of
sirolimus in whole blood using high-performance
liquid chromatography with ultraviolet detection.
Clin Ther 2000;22 Suppl B:B38-48.
23. Zeitlinger M, Derendorf H, Mouton J, Cars O,
Craig W, Andes D, et al. Protein binding: Do we
ever learn? . Antimicrob agents chemother
2011;55(7):3067-74.