development and application of improved methods …
TRANSCRIPT
DEVELOPMENT AND APPLICATION OF IMPROVED METHODS FOR MEASUREMENT
OF OZONE FORMATION POTENTIALS OF VOLATILE ORGANIC COMPOUNDS
Final Report to the California Air Resources Board
Contract No. 97-314
By
William P. L. Carter and Irina Malkina
May 22, 2002
Center for Environmental Research and Technology College of Engineering University of California
Riverside, California 92521

ii
ABSTRACT
This project was aimed at developing improved and lower-cost alternative experimental procedures for evaluating chemical mechanisms for predicting ozone impacts of volatile organic compounds (VOCs). More precise measurements of effects of VOCs on OH radicals in chamber experiments could be obtained if 1,3,5-trimethylbenzene is used instead of m-xylene as the radical tracer, but our ability to model reactions of 1,3,5-trimethylbenzene need improvement before the data will reduce uncertainties in evaluations. The use of HONO + VOC irradiations to provide an alternative reactivity measurement to reduce ambiguities in mechanism evaluations, and extend the range of compounds that can be studied, was investigated. Calculations indicate that such experiments are more sensitive to the direct effects of VOCs on ozone formation than environmental chamber experiments. Plug flow experiments with short reaction times should provide the best measurement of direct reactivity of the VOC itself, while stirred flow experiments with longer reaction times are more useful for evaluating effects of the VOC’s reactive products. A HONO generator was constructed that produces a continuous and stable output of HONO at the needed levels. Use of static, stirred flow, and plug flow systems were examined, with best results being obtained with a plug flow system using a 0.7” x 3’ quartz tube reactor with a residence time of ~30 seconds. This was tested using most of the homologous n-alkanes through n-hexadecane, with results generally in good agreement with model predictions. However, low volatility compounds could not always be reliably and reproducibly injected and measured. Experiments with CO, 2-2-4-trimethylpentane, methyl ethyl ketone, ethyl acetate, propene, benzene, toluene, and 1,3,5-trimethylbenzene were also conducted, with the results indicating potential problems with the mechanisms for 2,2,4-trimethyl pentane and the aromatics. Improvements are needed to the system used to inject low volatility compounds, and a total carbon analysis system needs to be integrated into the experiment before the HONO flow method can reliably applied to low volatility compounds. Work on improving this method is underway as part of a new project for the CARB.
iii
ACKNOWLEDGEMENTS AND DISCLAIMERS
The authors wish to gratefully acknowledge Dr. Dongmin Luo, now with the California Air Resources Board, for his major efforts for this program while he was employed at our laboratory, particularly in setting up the equipment and carrying out the experiments up the beginning of 1999. We also gratefully acknowledge Mr. Kurt Bumiller of our laboratory for valuable assistance in the design and construction of the HONO reactor, setting up the experiments, and in maintaining the equipment throughout the project. We also thank Mr. Dennis Fitz for helpful discussions and assistance in management of this project, and Mr. Randy Chang for assistance in carrying out the later experiments for this project.
The authors also wish to gratefully acknowledge the American Chemistry Council for a donation in support of this project. We appreciate their interest in this work.
Although this work was funded by the California Air Resources Board (CARB) and this report has been approved by the CARB Research Screening Committee, this report reflects only the opinions and conclusions of the primary author. Mention of trade names and commercial products does not constitute endorsement or recommendation for use
iv
TABLE OF CONTENTS
INTRODUCTION.........................................................................................................................................1 EVALUATION OF ALTERNATIVE SURROGATES FOR REACTIVITY CHAMBER
EXPERIMENTS.....................................................................................................................................9 Background and Objectives ....................................................................................................................9 Methods ................................................................................................................................................11
Experimental, Analytical and Characterization Methods...............................................................11 Reactivity Data Analysis Methods.................................................................................................12 Modeling Methods .........................................................................................................................13
Results and Discussion .........................................................................................................................14 DEVELOPMENT OF A DIRECT REACTIVITY MEASUREMENT METHOD....................................25
Objectives and Overall Approach.........................................................................................................25 Measurement of Direct Reactivity .................................................................................................25 Experimental Approaches to Measure Direct Reactivity ...............................................................26
Methods of Procedure...........................................................................................................................30 HONO Generation System.............................................................................................................30 Static Experiments..........................................................................................................................32 ETC Chamber.................................................................................................................................33 Stirred Flow Experiments...............................................................................................................33 PFA Tube Plug Flow Experiments.................................................................................................36 Quartz Tube Plug Flow Experiments .............................................................................................36 Analytical Methods ........................................................................................................................38 Pure Air Source ..............................................................................................................................39 Initial Development of a Total Carbon Analysis Method ..............................................................39
Modeling Methods and Reactor Characterization ................................................................................39 Chemical Mechanism.....................................................................................................................39 Light Characterization....................................................................................................................39 Chamber Wall Effects Model.........................................................................................................41 Representation of Static and Flow Experiments ............................................................................42
Experimental Results and Discussion...................................................................................................42 Summary of Experiments...............................................................................................................42 Performance of HONO Generator..................................................................................................48 Static Experiments..........................................................................................................................50 Stirred Flow Experiments...............................................................................................................51 PFA Tube Plug Flow Experiments.................................................................................................65 Quartz Tube Plug Flow Experiments .............................................................................................70
Modeling Evaluation of Direct Reactivity Measurements....................................................................86 Modeling Method and Scenarios....................................................................................................86 Assessment of Sensitivities to Mechanism Components ...............................................................88 Comparisons of Experimental and Atmospheric Reactivity Measures ..........................................92
CONCLUSIONS.........................................................................................................................................96 REFERENCES............................................................................................................................................99

v
LIST OF TABLES
Table 1. Composition of the standard and modified mini-surrogates for use in environmental
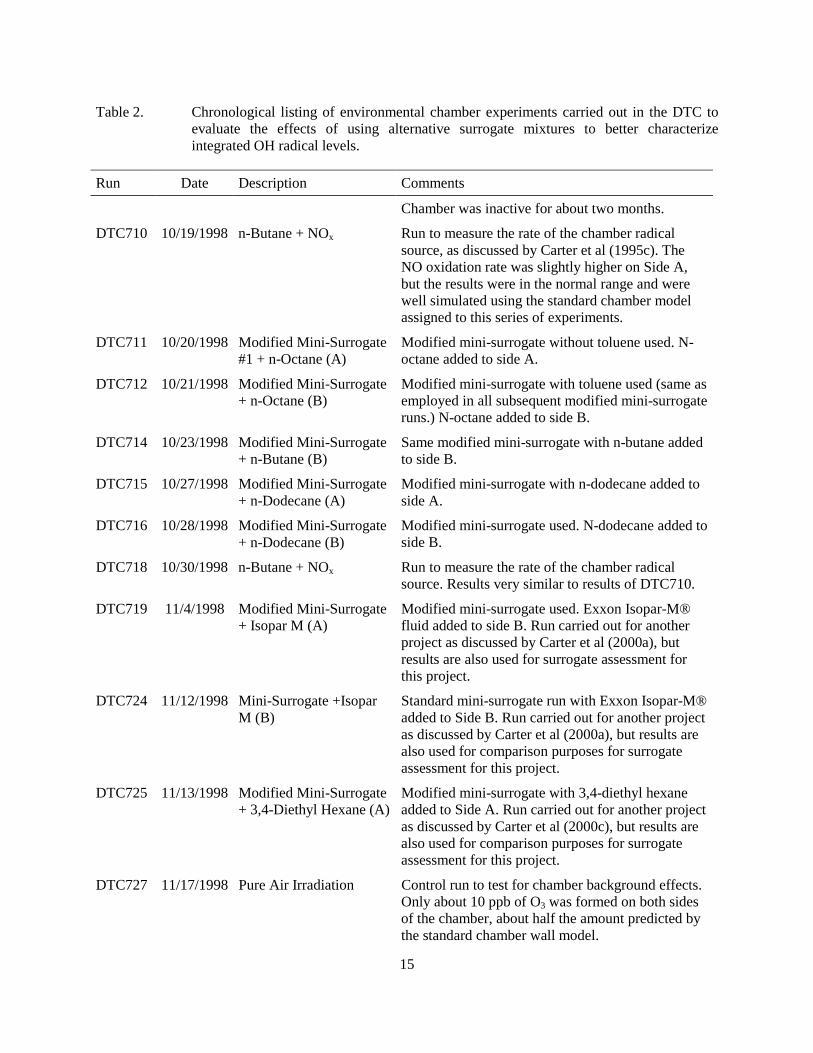
chamber experiments for VOC reactivity assessment. ...........................................................10 Table 2. Chronological listing of environmental chamber experiments carried out in the DTC
to evaluate the effects of using alternative surrogate mixtures to better characterize integrated OH radical levels. ..................................................................................................15
Table 3. Conditions and selected results of modified mini-surrogate experiments carried out for this and other programs and selected comparable standard mini-surrogate experiments with similar compounds. Runs are sorted in order of ........................................19
Table 4. Chronological summary of the experiments carried out for this project relevant to the assessment of direct reactivity effects. ...................................................................................43
Table 5. Summary of flows, HONO reactor temperatures, and HONO and NOx outputs of the HONO generator for the experiments discussed in this report. .............................................49
Table 6. Summary of results of ion analysis of 1/29/99 aqueous samples of output from HONO generator. ...................................................................................................................51
Table 7. Summary of static HONO and HONO + VOC experiments discussed in this report. ............52 Table 8. Summary of the HONO + VOC stirred flow experiments discussed in this report.................57 Table 9. Summary of average biases in model simulations of the ∆([O3]-[NO]) data for the
HONO-only irradiations in the stirred flow experiments. ......................................................62 Table 10. Summary of the experimental and calculated extrapolated low-added-VOC reactivity
results for the various compounds studied using the stirred flow method. ............................63 Table 11. Summary of the HONO + VOC plug flow experiments using the coiled PFA Teflon
tube reactor. ............................................................................................................................68 Table 12. Summary of the results of the quartz tube plug flow experiments with the various
added VOCs. ..........................................................................................................................72 Table 13. Results of replicate control propene experiments conducted using the quartz tube
plug flow reactor. ...................................................................................................................78 Table 14. Summary of model scenarios used in the reactivity measurement modeling
evaluation. ..............................................................................................................................87 Table 15. Measures of reactivity derived for the various types of scenarios used in this
assessment. .............................................................................................................................89 Table 16. Hypothetical “pure mechanisms” used to assess different aspects of a VOC’s
mechanism on incremental reactivities in various experimental or atmospheric systems. ..................................................................................................................................90
Table 17. Mechanistic reactivities calculated for different mechanism components for the various types of reactivity assessment experiments or atmospheric reactivity scenarios. ................................................................................................................................91

vi
LIST OF FIGURES
Figure 1. Concentration-time plots for the sum of ozone formed and NO oxidized in the base-
case experiments using the standard and the modified mini-surrogates.................................18 Figure 2. Plots of relationships between ∆([O3]-[NO]) and IntOH at 4 and 6 hours of irradiation
time results in the base case standard and modified mini-surrogate experiments. .................20 Figure 3. Model performance in simulating ∆([O3]-[NO]) and IntOH results of the base case
standard and modified mini-surrogate experiments listed on Table 2....................................21 Figure 4. Plots of Integrated OH results from standard and modified mini-surrogate
experiments where the 6-hour IntOH for the test experiment was ~6 ppt-min or less...........22 Figure 5. Plots of Integrated OH results from standard and modified mini-surrogate
experiments where the 6-hour IntOH for the test experiment was greater than ~6 ppt-min..........................................................................................................................................23
Figure 6. Diagram of HONO generation system as used in the initial phase of the project. ..................31 Figure 7. Photograph of the HCl diffusion vial and the HONO reactor inside the temperature
controlled oven. ......................................................................................................................31 Figure 8. Diagram of setup used for stirred flow system with the 50-liter carboy and gas-phase
VOC injection.........................................................................................................................34 Figure 9. Diagram of revised setup used for either gas-phase or liquid phase VOC injection,
showing the 50-liter stirred flask reactor employed in later stirred flow experiments for this project. .......................................................................................................................35
Figure 10. Diagram of revised setup used for first series of plug flow experiments. ..............................37 Figure 11. Diagram of setup used for quartz tube reactor plug flow experiments with liquid or
gas-phase VOC injection........................................................................................................38 Figure 12. Measurement of effect of carboy walls on blacklight spectral distribution............................41 Figure 13. Experimental and calculated concentration-time plots for ∆([O3]-[NO]), propane,
and acetone for the static HONO vs. HONO + propane experiments carried out in the DTC. .................................................................................................................................53
Figure 14. Experimental and calculated concentration-time plots for ∆([O3]-[NO]) and n-octane for the static HONO vs. HONO + n-octane experiment DTC-713. .......................................54
Figure 15. Plots of experimental vs. calculated ([O3]-[NO]) and ∆([O3]-[NO]) for the static HONO, HONO + propane, and HONO + n-octane experiments. ..........................................54
Figure 16. Plots of O3, NO, and ([O3]-[NO]) for a representative stirred flow experiment carried out during the first series of carboy runs. Results of model simulations of the experiment are also shown. ....................................................................................................55
Figure 17. Plots of experimental and calculated ∆([O3]-[NO]) vs. added VOC for the stirred flow experiments with propane, n-butane, n-hexane, n-octane, and n-decane.......................61
Figure 18. Plots of experimental and calculated ∆([O3]-[NO]) vs. added VOC for the stirred flow experiments with n-dodecane, carbon monoxide and acetone. ......................................62
vii
Figure 19. Plots of low concentration limit direct reactivity measurements divided by the VOC’s OH radical rate constant against carbon number for the unstirred carboy experiments with the n-alkanes. .............................................................................................64
Figure 20. NO, O3, and propane data from the representative HONO + propane PFA tube plug flow run carried out on 5/11/99. Steps in NO and O3 data show effects of changing added propane levels. .............................................................................................................66
Figure 21. NO, O3, and propane data from the HONO + n-hexadecane PFA tube plug flow run carried out on 5/26/99.............................................................................................................67
Figure 22. Plot of ∆([O3]-[NO]) vs. amount of test VOC added for the PFA tube plug flow experiments. ...........................................................................................................................69
Figure 23. Plots of low concentration limit direct reactivity measurements divided by the VOC’s OH radical rate constant against carbon number for the first series of the plug flow experiments with the n-alkanes..............................................................................70
Figure 24. NO, O3, and propane data from the representative HONO + propane quartz tube plug flow run carried out on 2/27/01. .............................................................................................75
Figure 25. NO, O3, and propane data from the apparently successful HONO + n-hexadecane quartz tube plug flow run carried out on 9/27/00. Steps in NO and O3 data show effects of changing added VOC levels ...................................................................................76
Figure 26. Plot of rates of change of [O3]-[NO] in HONO-only irradiations during HONO + VOC experiments against carbon number for the quartz tube experiments with the n-alkanes and against run order for all the experiments after 9/26/01.......................................77
Figure 27. Experimental and calculated ∆([O3]-[NO]) vs VOC added for the quartz tube plug flow experiments with propane. .............................................................................................77
Figure 28. Plots of experimental and calculated ∆([O3]-[NO]) in the standard propane irradiations in the quartz tube against the reactor flow rate....................................................79
Figure 29. Plots of experimental and calculated NO in the HONO-only irradiations in the quartz tube experiments against reactor flow rate. .................................................................80
Figure 30. Experimental and calculated ∆([O3]-[NO]) vs VOC added for the quartz tube plug flow experiments with ethane, n-hexane, n-octane, n-decane, n-tridecane and n-tetradecane..............................................................................................................................81
Figure 31. Experimental and calculated ∆([O3]-[NO]) vs VOC added for the quartz tube plug flow experiments with n-pentadecane and n-hexadecane. .....................................................82
Figure 32. Plots of low concentration limit direct reactivity measurements divided by the VOC’s OH radical rate constant against carbon number for the quartz tube plug flow experiments with the n-alkanes. .............................................................................................82
Figure 33. Experimental and calculated ∆([O3]-[NO]) vs VOC added for the quartz tube plug flow experiments with carbon monoxide, 2,2,4-trimethyl-pentane, methyl ethyl ketone, ethyl acetate, propene, and benzene...........................................................................84
Figure 34. Experimental and calculated ∆([O3]-[NO]) vs VOC added for the quartz tube plug flow experiments with toluene, and 1,3,5-trimethylbenzene..................................................85

viii
Figure 35. Summary of model biases for model simulations of the low-added-VOC incremental reactivities (R0) for the various VOCs studied in the quartz tube plug flow experiments.. ..........................................................................................................................85
Figure 36. Plots of the fraction of the VOC reacting in the simulation against the OH radical rate constants for various high NOx experiments or scenarios. ..............................................92
Figure 37. Plot of atmospheric incremental reactivities in the MIR scale against calculated incremental reactivities for the plug flow HONO experiments for all the separately represented model species in the SAPRC-99 mechanism. .....................................................93
Figure 38. Plot of atmospheric incremental reactivities in the MIR scale against calculated incremental reactivities for the stirred flow HONO experiments for all the separately represented model species in the SAPRC-99 mechanism. .....................................................93
Figure 39. Plot of OH radical rate constant against calculated results of plug flow or stirred flow HONO experiments for all the separately represented model species in the SAPRC-99 mechanism...........................................................................................................94
Figure 40. Comparison of model calculations of results of direct reactivity experiments using the plug flow and stirred flow methods for all the separately represented model species in the SAPRC-99 mechanism. ...................................................................................94
1
EXECUTIVE SUMMARY
Background
Many different types of volatile organic compounds (VOCs) are emitted into the atmosphere, each reacting at different rates and with different mechanisms. Because of this, VOCs can differ significantly in their effects on ozone formation, or their “reactivities”. Control strategies that take this into account can potentially achieve ozone reductions in a more cost-effective manner than those that ignore these differences. Implementation of reactivity-based controls requires some means to measure and quantify relative ozone impacts of different VOCs. However, the ozone impact of a VOC depends on the environment where the VOC is emitted as well as the nature of the VOC. Therefore, the only practical means to assess atmospheric reactivity, and how it varies among different environments, is to calculate its atmospheric ozone impacts using airshed models.
However, model calculations of ozone impacts of VOCs are no more reliable than the chemical mechanisms upon which they are based. Environmental chamber studies of reactivity play an essential role by providing the data necessary to test the predictive capabilities of the chemical mechanisms used. In the past several years, we have applied a standard methodology for conducting environmental chamber experiments for to assess atmospheric reactivities of VOCs, and used these data to evaluate and improve mechanisms for predicting atmospheric ozone impacts of VOCs. This approach has resulted in significant improvements in our ability to estimate ozone impacts of many types of compounds.
However, the use of environmental chamber data for evaluating ozone reactivity is not without limitations. The precision of quantifying radical inhibiting effects for compounds where this is important, such as many types of high molecular weight compounds present in stationary sources, is insufficient for a completely unambiguous mechanism evaluation. VOCs that have extremely low (but non-negligible) volatility, or are complex mixtures of constituents that are poorly characterized or have varying volatilities, currently cannot be reliably studied in environmental chambers. In addition, conducting environmental chamber experiments for mechanism evaluation is highly expensive and requires special expertise that is available at only a few laboratories. Therefore, development of a simpler and lower cost approach for obtain reactivity data that can complement or extend environmental chamber studies, or can be used for materials for which chamber methods are currently unsuitable, would clearly be highly beneficial.
Based on these needs, the CARB contracted with the College of Engineering Center for Environmental Research and Technology (CE-CERT) at the University of California at Riverside to develop additional and improved methods to provide data needed to assess ozone formation potentials of VOCs and to evaluate mechanisms for predicting their ozone impacts in the atmosphere. This work had two major components, as summarized below.
Evaluation of Alternative Surrogates for Reactivity Chamber Experiments
One of the limitations of the environmental chamber methodology we have been employing for assessing VOC reactivity is imprecision in measuring radical inhibition effects for VOCs where this is an important. Such experiments involve determining the effect of the compound on results of irradiations of “Surrogate” reactive organic gas (ROG) - NOx mixtures representing ambient pollution. The radical levels are derived by measuring the rates of decay of the most rapidly reacting ROG surrogate component that reacts only with OH radials. However, if the test compound is a strong radical inhibitor, the radical levels

2
are suppressed to a sufficiently low level that relatively small amounts of the compound reacts, and the integrated OH measurement is relatively precise. Use of a more rapidly reacting compound for this purpose will result in a more sensitive measurement of effects of VOCs on radical levels.
In the current “base case” chamber experiments (i.e., the experiments for which the effective of adding the test compound is being determined) we have been using for reactivity assessment, the compound that has been used for determining radical levels is m-xylene, because it is the most rapidly reacting compound in the ROG surrogates that react only with OH radicals. However, if the m-xylene were replaced by 1,3,5-trimethylbenzene, its higher reaction rate would give a radical measurement that may be up to ~2.5 times more sensitive. Therefore, for this project we investigated whether the base ROG surrogate could be modified to employ 1,3,5-trimethylbenzene to represent the more reactive aromatics rather than m-xylene, so a more precise radical measurement could be obtained.
It was found that modifying the surrogate mixture in this way indeed resulted in a more sensitive measurement of OH radical levels in experiments with radical inhibiting VOCs. However, this improvement was more than counteracted by the fact that the use of the modified surrogate resulted in a degradation of the ability of the model to simulate the base case experiment. Because the purpose of the experiments are to assess model performance, if the base case experiment is not well simulated by the model, then there is uncertainty in use of the experiment to test the model predictions of the effect of adding the test compound. The net result is that the uncertainty in using the experiment to evaluate the mechanism of the test compounds is enhanced rather than reduced. Therefore, until the model performance in simulating the base case in the modified surrogate experiment can be improved, it is probably better to continue to use the standard mini-surrogate experiment for mechanism evaluation purposes.
The ultimate solution is to improve the mechanism for the aromatic base ROG constituents to the point that the model simulates the base case experiment adequately regardless of which components or OH radical tracers are employed. However, this would require additional experimentation and mechanism development work that was beyond the scope of this current project.
Development of a Direct Reactivity Measurement Method
The impact of a VOC on ozone formation depends on various aspects of its atmospheric reaction mechanism, whose relative importance in terms of affecting ozone depends on environmental conditions. These include the amount of O3 formed resulting directly from the reactions of the VOC itself or its major oxidation products, referred to as the “direct reactivity” of the VOC, and the effects of the reactions of the VOC on O3 formation from all the VOCs present, which differ depending on the environmental conditions. All these aspects of reactivity are important and need to be appropriately represented to predict a VOC’s ozone impacts under the full variety of atmospheric conditions.
Environmental chamber experiments can to some extent be used to test these different aspects, since different experiments have different sensitivities, but because of imprecisions in the mechanisms such tests tend to be somewhat ambiguous, particularly in the evaluations of the direct reactivity. Because of this, if an experiment could be developed that provides a measurement that is primarily sensitive to direct reactivity effects, then a source of ambiguity in the evaluation of mechanisms would be removed. This would reduce uncertainties when applying chamber-derived mechanisms to model simulations of ozone formation in the atmosphere.
In addition, if a direct reactivity experiment can be designed that involves lower cost per compound and is better suited to low volatility VOCs and mixtures, then it would make it more practical to obtain experimental reactivity information for VOCs that otherwise would not be studied. Although
3
direct reactivity is not the only factor that needs to be considered when assessing reactivity, the availability of direct reactivity data for these compounds would be a significant improvement to the current situation.
An experiment that would be sensitive primarily to direct reactivity effects must be one where the effect of the VOC on the NO to NO2 conversions that lead to O3 formation can be measured under conditions where the initial reactions of the VOC are the same as in the atmosphere, but where both radicals and NOx are in excess. One simple type of experiment that satisfies these criteria is an irradiation of the VOC in the presence of relatively high levels of nitrous acid (HONO) in air. HONO undergoes rapid photolysis in the atmosphere to form OH radicals and NO, and in the absence of other reactants the OH radicals are consumed primarily by their reactions with NO, NO2 or HONO, and the result is the conversion of HONO to NO (primarily) and NO2. In the presence of added VOCs, the VOC oxidation processes that are responsible for the direct reactivity for O3 formation, and the net result is lower yields of NO and, if amount of added VOC is so high to convert all the NO, the formation of ozone. The change in [O3]-[NO] caused by adding the VOC, relative to the [O3]-[NO] levels when only HONO is present, provides a measure of the direct reactivity of the VOC.
A clean, reliable, and continuous source of HONO is needed in order for HONO irradiation experiments to be a practical and useful means for evaluating VOC reactivity. The method of Febo et al (1995), which involves forming HONO from the reactions of dilute HCl gas in humidified air passing through stirred NaNO2 salt, was investigated and found to be well suited to this purpose.
HONO + VOC irradiations for direct reactivity determination can be carried out in either static or continuous flow mode. Static experiments involve simply injecting the HONO or the HONO + VOC mixture in an environmental chamber or reactor and irradiating it either for a set amount of time or until all the HONO has reacted. This has the advantages of relative simplicity and the fact that the experimental and modeling procedures already established for environmental chamber experiments can be employed. However, it had many of the same problems as the types of environmental chamber reactivities experiments in terms of difficulties in injecting low volatility compounds, and the relatively high cost and expertise required. In addition, such experiments are relatively time consuming and it is difficult to reproduce injections exactly from experiment to experiment.
Nevertheless, a limited number of static HONO or HONO + VOC experiments were carried out for this project, using propane or n-octane as the test compound. The results were as expected, and the model was able to simulate the main features of the experimental data, though some variability in the simulations was observed. Although the simulations of the data were not perfect in all cases, they do not suggest any large major problems or consistent biases with our mechanism for the HONO photooxidation system.
Continuous flow experiments involve continuously flushing an irradiated reactor with the desired amount of HONO or HONO + VOC + air mixture, and sampling the reacted mixture as it exits the reactor. These can be conducted in either stirred flow or plug flow mode, depending on the design of the reactor, with plug flow experiments giving shorter reaction times and therefore more rapid responses to changes in concentrations, and stirred flow experiments giving longer reaction times and therefore a more sensitive measurement of the effect of the added VOC. Although more difficult to characterize for modeling, such experiments have several significant advantages over static experiments for the purpose of this project. These are (1) better adaptability to the continuous HONO generation system developed for this project, (2) potentially greater suitability for use with low volatility compounds and (3) the potential for obtaining more data points in a given amount of time. In addition, they are potentially adaptable to development of a self-contained system that can be used to make such measurements at other laboratories with lower cost and effort than required for environmental chamber studies. For these reasons, most of the
4
effort on this project was focused on use of continuous flow HONO + VOC systems for measuring direct reactivities of VOCs.
The stirred flow approach was examined initially because it was felt that the larger reaction vessels might make it more suitable for use with low volatility VOCs. Such experiments were carried out on the selected homologous n-alkanes from propane through n-dodecane, and also on CO and acetone. Most experiments employed a 50-liter glass reactor with a reactor flow rate of ~5 liters/minute, and an initial HONO concentration of about 0.7 ppm. The amount of added test compound added varied. Numerous replicate experiments were carried out for propane and (to a lesser extent) n-octane using various configurations, and at least some replicates were carried out for the other compounds.
The results of the replicate experiments were reasonably consistent, though some variability was observed in different experiments employing different reactors. The model was able to simulate the main features of the results, but some consistent and potentially significant differences were observed that could not be resolved. In particular, although the results of the experiments with the low added VOCs were reasonably consistent with model predictions for the more volatile compounds, the effects of additions of large amounts of added VOC were consistently underpredicted by the model. Use of mechanical stirring and different types of reaction vessels did not significantly reduce this bias. In addition, experiments on the homologous n-alkanes did not yield the expected results in terms of effects of reactivity on molecule size. It is concluded that we are not correctly characterizing the stirred flow experiments for modeling, and until this problem is resolved such experiments cannot be used for mechanism evaluation.
Because of problems with modeling the results of the stirred flow experiments, a series of plug flow experiments were carried out to see if results more consistent with model predictions could be obtained. The first series of plug flow experiments for this project used a coiled ~10’ x 0.3” ID PFA tube as the reactor, with a reactor flow rate of ~1 liter/minute, yielding a residence time of only ~1.3 minutes. The experiments employed initial HONO levels of ~3.5 ppm, and again the amount of added VOC was varied. Experiments were carried out using selected n-alkanes from propane through n-hexadecane.
Despite the very low residence times, the additions of the test compounds gave very measurable changes in [O3]-[NO] even with relatively low amounts added. In contrast with the results with the stirred flow experiments, the model gave very good simulations of the propane experiments throughout the concentration range, even with relatively high amounts of propane added. This indicates that we are able to characterize the conditions of the plug flow experiments for modeling, at least for compounds with well-characterized mechanisms and no apparent absorption or low volatility problems. On the other hand, the model consistently underpredicted the reactivities of n-octane and n-decane at the high concentration ranges, and underpredicted the reactivities of n-dodecane and higher at all concentrations. This is attributed to probable surface absorption problems on the long, narrow reactor employed in this first series of plug flow experiments. This is indicated by the fact that for compounds such as n-hexadecane the stabilization times were much longer and it took much longer to obtain data points for different concentrations.
Because of the apparent absorption problems in the first series of experiments, the second series of experiments was employed using a much shorter (3’ vs. 10’) and wider (0.7” vs. 0.3”) reactor that also had a shorter residence time (~30 vs. ~80 seconds) for the VOCs to be exposed to the reactor surfaces. The reactor employed was a quartz tube that has been used previously to measure NO2 photolysis rates using the method of Zafonte et al (1977). Most experiments employed reactor flow rates of about 0.5 liters/minute and HONO concentrations of about 4 ppm, though a number of experiments were carried out where these were varied.

5
The performance of this system and consistency with modeling for compounds with well-characterized mechanisms proved to be significantly superior to any of the other systems investigated, so a relatively large number of experiments carried out using this approach. In addition to numerous replicate experiments with propane, the compounds studied included ethane, most of the homologous n-alkanes from n-hexane through n-hexadecane, iso-octane, propene, benzene, toluene, 1,3,5-trimethylbzenzene, carbon monoxide, methyl ethyl ketone, and ethyl acetate. Reasonably reproducible results were obtained in replicate experiments at least for high volatility compounds, and the model was able to simulate the direct reactivity measurements for the homologous n-alkanes from ethane through n-hexadecane with no apparent bias as the volatility of the compounds increase. The results for the other compounds indicate the utility of the mechanism evaluation purposes. In particular, they suggest potentially significant problems with the mechanisms for the aromatics and iso-octane that will probably need to be addressed in future mechanisms updates. Although work on mechanism improvement is beyond the scope of this project, the data obtained are clearly potentially useful for this purpose, and indicate that work is needed in this area.
Although the results of the plug flow experiments were encouraging, some significant experimental problems were encountered that will need to be resolved before this method can be widely used for low volatility compounds or complex mixtures such as petroleum distillates. Problems were encountered in reliably and reproducibly injecting and analyzing low volatility compounds in this system, and some of the earlier experiments conducted using the C10+ n-alkanes could not be successfully reproduced later in the program. Imprecisions and time required for GC analysis of the low volatility compounds proved to be the limiting factor in attempts to improve the injection method and obtain useful reactivity data for such compounds. It is necessary to integrate the system with an appropriate total carbon analysis method in order to more reliably and continuously monitor the amounts of gas-phase VOCs when carrying out such experiments.
Conclusions and Ongoing Work
Although progress was made in this program towards its goals, but additional work is needed before these objectives will be achieved. More precise measurements of effects of VOCs on radical levels in chamber experiments can be obtained if a more reactive radical tracer compound is used, but improvements are needed to our ability to model the reactions of the alternative base ROG surrogate constituents for the data to reduce uncertainties in mechanism evaluation. It was shown that a plug flow HONO + VOC irradiation experiment can provide direct reactivity data that can supplement chamber data to reduce ambiguities in mechanism evaluations, and can potentially allow reactivity measurements to be made for classes of VOCs for which chamber experiments are unsuitable or difficult. However, improvements are needed to our ability to inject liquid VOC reactants and to readily and precisely analyze amounts of VOCs injected before this system can be widely used for reactivity assessments of low volatility compounds and complex mixtures.
Work has begun in developing a total carbon analysis method that can be integrated into plug flow HONO system, and this work is continuing as part of a currently ongoing project for the CARB (Carter, 2002). This should remove the need to analyze the test compounds by chromatography, which would significantly reduce the cost and time required to obtain direct reactivity data, and would permit application of this method to complex mixtures such as petroleum distillates for which GC methods are not well suited. Once this work is complete we can use the system to improve the mechanism evaluation database for important VOCs, and develop procedures and analysis methods for using these data for reducing uncertainties in ozone reactivity estimates for VOCs for which no other experimental data are available.
6
INTRODUCTION
Many different types of volatile organic compounds (VOCs) are emitted into the atmosphere, each reacting at different rates and with different mechanisms. Because of this, VOCs can differ significantly in their effects on ozone formation, or their “reactivities”. Therefore, VOC control strategies that take reactivity into account can potentially achieve ozone reductions in a more cost-effective manner than strategies that treat all non-exempt VOCs equally. Reactivity-based control strategies have already been implemented in the California Clean Fuel/Low Emissions Vehicle (CF/LEV) regulations (CARB, 1993), and have recently been incorporated in the California Aerosol Coatings regulations (CARB, 2000). The CARB staff is now evaluating the possibility of using reactivity-based control strategies in its regulations of architectural coatings, and possible applications to other types of stationary sources may be considered in the future. On the national level, the U.S. EPA must take ozone reactivity into account when considering whether it is appropriate to regulate a particular type of VOC as an ozone precursor (Dimitriades, 1999, RRWG, 1999). Furthermore, if California is successful in implementing reactivity-based regulations as a cost-effective way to reduce ozone, it is reasonable to expect that this approach will be adopted in other jurisdictions as well.
Implementation of reactivity-based controls requires some means to measure and quantify relative ozone impacts of different VOCs. This is not a simple problem, because the ozone impact of a VOC depends on the environment where the VOC is emitted as well as the nature of the VOC (e.g., see Carter and Atkinson, 1989). The effect of a VOC on ozone formation in a particular environment can be measured by its “incremental reactivity”, which is defined as the amount of additional ozone formed when a small amount of the VOC is added to the environment, divided by the amount added. Although this can be measured in environmental chamber experiments, and such experiments are essential to reactivity assessment for reasons discussed below, incremental reactivities measured in chamber experiments cannot be assumed to be the same as incremental reactivities in the atmosphere (Carter and Atkinson, 1989; Carter et al., 1995a). This is because it is not currently practical to duplicate in an experiment all the environmental factors that affect relative reactivities; and, even if it were, the results would only be applicable to a single type of environment. The only practical means to assess atmospheric reactivity, and how it varies among different environments, is to estimate its atmospheric ozone impacts using airshed models. However, such model calculations are no more reliable than the chemical mechanisms upon which they are based. While the initial atmospheric reaction rates for most VOCs are reasonably well known or at least can be estimated, for most VOCs the subsequent reactions of the radicals formed are complex and have uncertainties that can significantly affect predictions of atmospheric impacts. Laboratory studies can reduce these uncertainties, but for most VOCs they will not provide the needed information in the time frame required for current regulatory applications.
Experimental measurements of reactivity play an essential role in reactivity quantification by providing the data necessary to test and verify the predictive capabilities of the chemical mechanisms used to calculate atmospheric reactivities. They provide the only means to assess as a whole all the many mechanistic factors that might affect reactivity, including the role of products or processes that cannot be studied directly using currently available techniques. Because of this, the CARB and others have funded programs of environmental chamber studies to provide data needed to reduce uncertainties in reactivity assessments of the major classes of VOCs present in vehicle emissions (Carter et al., 1993a, 1995a,b; 1997; Carter 2000; Jeffries et al. 1982, 1985, 1990), and various private sector groups have funded studies of individual VOCs of interest to them (see references in Carter, 2000). Although there has been significant progress, the number of compounds adequately studied represents only a fraction of those presently in the emissions inventories, and obviously do not include new products which may be used in the future.
7
Most of the recent work on conducting reactivity studies of VOCs for developing and evaluating mechanisms for predicting atmospheric reactivity has been carried out in our laboratories. In the past several years, we have applied a standard methodology for this purpose, which was used in essentially all of the studies cited above. This involves measuring the effect of the VOC on O3 formation, NO oxidation, and OH radical levels when the VOC is added to three standard types of environmental chamber experiments employing reactive organic gases (ROGs) representing those present in polluted atmospheres (the “ROG surrogate”) and NOx. These are as follows:
• The “Mini-Surrogate” experiments employ a simplified ROG surrogate consisting of ethene, n-hexane and m-xylene at relatively low ROG/NOx ratios. Added VOC effects in these experiments were found to provide a very sensitive test of aspects of the mechanism concerning radical initiation and termination processes, which is a particularly important factor affecting reactivities of many types of VOCs (Carter et al, 1993, 1995a,b).
• The “Full Surrogate” experiments employ a more complex and realistic ROG surrogate, but also at relatively low ROG/NOx ratios. VOC effects in these experiments are less sensitive to radical initiation and termination effects of the mechanisms of the test VOCs, and therefore are correspondingly more sensitive to the direct effect of the added VOCs on ozone formation, due to their own reactions. The low ROG/NOx ratios represent atmospheric conditions that are most sensitive to effects of added VOCs.
• The “Low NOx Full Surrogate” experiments employ the same ROG surrogate as above, but use higher ROG/NOx ratios representing NOx-limited conditions. Such experiments are necessary to assess the ability of the model to predict peak ozone yields under conditions where NOx is low. This is sensitive to aspects of the mechanism affecting NOx sinks, to which the lower ROG/NOx are insensitive.
Chemical mechanisms are then developed based on available kinetic and mechanistic data or estimated based on our current knowledge of reactions of other VOCs, are evaluated by using them to simulate the results of these types of experiments, and are modified or adjusted as necessary and appropriate to make their predictions consistent with the experimental data. Once the mechanisms are shown to perform satisfactorily in simulating these data, they are then used in airshed models to calculate ozone reactivities under varying atmospheric conditions. Although there may still be uncertainties in the mechanism, and in some cases parameterized approaches have to be used to represent unknown processes, the expectation is that if they can simulate the effects of the VOCs in the experiments with varying sensitivities to the different relevant aspects of the mechanisms, then they will perform comparably well in atmospheric simulations.
Although this approach has resulted in significant improvements in our ability to more reliably calculate reactivities for a number of compounds, it is not without limitations. In the case of compounds which tend to act as radical inhibitors, such as the C8+ alkanes present in petroleum distillates, the precision of the integrated OH radical measurements, determined by rates of decay of the ROG surrogate component m-xylene, leaves something to be desired. Integrated OH data provides the most direct measurement of the inhibiting characteristics of the compound independently of other uncertainties, but measurements of effects of VOCs on integrated OH tends to be much less precise than measurements of their effects on O3 formation and NO oxidation rates. Because of this, the latter has been the primary means of evaluating radical inhibiting or enhancing characteristics of VOCs. However, effects of VOCs on NO oxidation and O3 formation are also affected by other uncertain aspects of the mechanism, such as the amount of ozone formed directly from the reactions of the VOC. This allows for the potential of errors one aspect of the mechanism to compensate, at least in part, for errors the other. This increases the uncertainties in model predictions of reactivities under atmospheric conditions, where the relative importance of the various aspects of the mechanisms may be different than in the chamber, and reduces

8
the utility of the data for developing evaluating mechanistic estimation methods that may be applicable to other compounds. Improved precision in integrated OH measurements, or experiments that are sensitive only to direct reactivity effects, or only to inhibition effects would provide a significantly improved database for mechanism evaluation and reactivity assessment.
Additional problems with the current approach are that the environmental chamber experiments for mechanism evaluation are highly expensive to carry out, require special expertise that is available at only a few laboratories, and, perhaps most seriously, are not suitable for use for all types of VOCs or mixtures that might be subject to reactivity-based regulations. VOCs that cannot be studied using this method are those of extremely low (but non-negligible) volatility, or those that are complex mixtures of whose constituents are poorly characterized or which have widely varying volatilities. Although environmental chamber studies for mechanism development and evaluation are still needed for representatives of classes of compounds which have not yet been adequately studied, a simpler and lower cost approach may be sufficient to adequately reduce uncertainties for a wide variety of substances, particularly those that are known to be chemically similar to compounds which have been adequately studied. Many classes of stationary source emissions, such as petroleum distillates, alcohol ethers, esters, etc., may well fall into this category after additional supporting mechanism evaluation research is completed.
Based on these considerations, the CARB contracted with the College of Engineering Center for Environmental Research and Technology (CE-CERT) at the University of California at Riverside to develop additional and improved methods to provide data needed to assess ozone formation potentials of VOCs and to evaluate mechanisms for predicting their ozone impacts in the atmosphere. Although the project as proposed was quite ambitious and had a number of components, the program as carried out had two major accomplishments. The first consisted of an investigation of whether use of modified ROG surrogates that give improved precision in measurements of integrated OH radical levels will result in improved data for mechanism evaluation. The second, which turned out to be the major effort for this project, consisted of the development and initial evaluation of a new method to measure the “direct reactivity” of VOCs. This approach, if successful, can provide a valuable supplement to chamber data for reducing ambiguity in mechanism evaluations, and can potentially reduce the cost and effort required to obtain at least some reactivity data for VOCs for which no data are available, including those that are not suitable for study using environmental chamber methodology. The objectives, approach, results, and conclusions for each of these two components of this project are discussed separately in the following two major sections of this report.
9
EVALUATION OF ALTERNATIVE SURROGATES FOR REACTIVITY CHAMBER EXPERIMENTS
Background and Objectives
Since it is not practical to experimentally duplicate all aspects of the environment that affect relative reactivities, the objective of any reactivity measurement experiments is to obtain data needed to derive or evaluate models for prediction of reactivity in the atmosphere. In the case of compounds such as alkanes, alcohols, ethers, etc., the most important measurements are the effects on overall radical levels and the amount of ozone directly formed from the VOC's reactions. For radical inhibitors such as the higher alkanes and other high molecular weight saturated compounds, these two aspects of the mechanism tend to counter each other in any given experiment, as well as in the ambient atmosphere. The relative importances of these opposing effects depend significantly on environmental conditions (see Carter et al, 1995a), so it is important that the model represent both correctly if it is to give reliable predictions in simulation of the atmosphere. The approach we have used in previous and ongoing studies is to use the mini-surrogate reactivity experiments the predictions of inhibition (i.e., assumed nitrate yields), and the full surrogate runs to test the other aspects of the mechanism. However, imprecisions of the data, particularly in measuring integrated OH radical levels in experiments where added alkanes significantly inhibit radical levels, has made it difficult to completely separate these two aspects of the mechanism in the evaluation process.
Because of this, one component of this program was to evaluate use of modified ROG surrogates that may give more precise measurements of integrated OH measurements in the added radical inhibitor experiments. In our previous studies, m-xylene has been used as the radical tracer because it is present in both of the ROG surrogates we use, its reaction with OH radicals is its only significant consumption process in these experiments, the rate constant is well known (Atkinson, 1989), and the reaction is sufficiently fast that a measurable amount is consumed, at least in the base case experiments. However, in added inhibitor experiments where the OH levels are suppressed the amount reacted, and therefore the precision of the OH measurement, is less precisely determined. If a more rapidly reacting OH tracer were used, one should be able to obtain a better measurement of the amount of tracer consumed in low OH experiments, and therefore a more precise measurement of the overall OH levels.
A number of compounds react with OH radicals more rapidly than m-xylene, though many, such as alkenes, are also consumed at non-negligible rates by reaction with O3, and others, such as amines, are more difficult to measure precisely with our available gas chromatographic methods. In addition, compounds whose mechanisms are highly uncertain are also unsuitable as OH tracers in reactivity experiments because their presence would complicate the use of the data for mechanism evaluation. If one sorts all organic compounds currently represented in the SAPRC-99 mechanism whose OH rate constants have been measured in order of descending rate constant, and eliminates alkenes because they react with O3, amines, naphthalenes, phenols and DMSO because their mechanisms are unknown or uncertain and their measurements by GC is expected to be of lower precision, then one is left with 1,3,5-trimethylbenzene on the top of the list. Because of its similar chemistry to m-xylene (at least in terms of overall reactivity characteristics) this could serve as a replacement for m-xylene in the surrogates used in the reactivity experiments that can give a somewhat more precise measurement of OH radical levels. Although the details of its photooxidation mechanism are uncertain, there are a sufficient number of experiments with this compound to permit a parameterized mechanism to be developed that can predict its overall effects on O3 formation and OH radical levels (Carter et al, 1997; Carter, 2000).

10
Based on these considerations, a series of experiments were carried out during this project to examine the suitability and potential advantages of using a modified base case ROG surrogate where 1,3,5-trimethylbenzene, or toluene + 1,3,5-trimethylbenzene were used as a replacement for m-xylene for representing the aromatic component of the ambient mixture. As discussed by Carter et al (1995a), two types of ROG surrogates have been used in our reactivity assessment experiments, one designed to provide a fairly realistic representation of ambient mixtures in terms of assessing reactivity effects, and the other to provide a system that is more sensitive to effects of VOCs on radical levels. The former is an 8-component “full surrogate” that contains one compound to represent each of the types of reactive organics used to represent ambient mixtures in current condensed mechanisms, and the latter is a three-component “mini-surrogate” consisting of ethene, n-hexane, and m-xylene. Since the mini-surrogate experiments are the most sensitive to the effects of the test VOCs on radical levels, this was used as the starting point for evaluating the effects of using the more sensitive tracer compound.
Table 1 lists the composition of the standard mini-surrogate base case we have used in previous reactivity assessment experiments and of the modified mini-surrogates we have examined as part of this project. In the first modified surrogate all the m-xylene was replaced by 1,3,5-trimethylbenzene, while in the second (which was used for most of the experiments), a toluene and 1,3,5-trimethylbenzene mixture was used. The amount of m-xylene and toluene in the second modified surrogate was determined such that approximately the same total amount of aromatic was estimated to react during the course of the experiment. In the first modified surrogate only the 1,3,5-trimethylbenzene was used for the aromatic, while for most experiments toluene was also present, in order to make the average aromatic reactivity closer to that of the m-xylene. Test calculations indicated that similar results should be obtained in the base case experiments using the modified mini-surrogate as in the standard mini-surrogate used as the starting point.
The use of the modified mini-surrogate was evaluated by conducting reactivity experiments with several radical inhibiting compounds and mixtures. This included test compounds that were studied for other projects, as well as compounds that have been studied previously. The details of the experimental methods and results are discussed in the following sections.
Table 1. Composition of the standard and modified mini-surrogates for use in environmental chamber experiments for VOC reactivity assessment.
Average Concentration (ppm) Reactant Standard Modified
(Prelim. Test)Modified
NO 0.28 -same- -same- NO2 0.10 -same- -same- n-Hexane 0.46 -same- -same- Ethene 0.81 -same- -same- Toluene 0.20 m-Xylene 0.13 1,3,5-Trimethylbenzene 0.052 0.048

11
Methods
Experimental, Analytical and Characterization Methods
The experimental methods employed in the chamber experiments to evaluate use of the alternative surrogates are the same as employed previously in our laboratories, which are discussed in detail elsewhere (e.g., Carter et al, 1995b, 1997). These are briefly summarized in this section, though the previous reports can be consulted for detail.
The experiments for this program were carried out using the CE-CERT “Dividable Teflon Chamber” (DTC) with a blacklight light source. This consists of two ~6000-liter 2-mil heat-sealed FEP Teflon reaction bags located adjacent to each other and fitted inside an 8' x 8' x 8' framework, and which uses two diametrically opposed banks of 32 Sylvania 40-W BL black lights as the light source. The reaction bags are referred to as the two “sides” of the chambers (Side A and Side B) and the experiment carried out in each side is appended with an “A” or “B” as appropriate. For reactivity assessment experiments, the base case ROG and NOx components are injected into both of the reactors and are mixed, with the contents interchanged by means of ports with integrated fans. These ports are then closed and the test compound is injected into one of the reactors, so the base case irradiation is carried out on one side and the base case + test compound irradiation is carried out in the other. The differences between the results indicate the effect of the added test compound to the base case experiment.
Before each experiment the reaction bags are flushed with dry air produced by an AADCO air purification system for at least 12 hours. The continuous monitors were connected prior to reactant injection and the data system began logging data from the continuous monitoring systems. The reactants are prepared injected as described previously (e.g., Carter et al, 1993, 1995, 1997), with the common reactants being injected and mixed first as indicated previously. After sampling to obtain initial reactant concentrations the lights are turned on and the irradiation is conducted for at least six hours.
Ozone was monitored using a Dasibi 1003-AH UV photometric ozone analyzer and NO and total oxides of nitrogen (including organic nitrates and perhaps HNO3) were monitored using a Teco Model 42 chemiluminescent NO/NOx monitor, with Teflon sample lines inserted directly into the chambers. The sampling lines from each side of the chamber were connected to solenoids that switched from side to side every 10 minutes, so the instruments alternately collected data from each side. Formaldehyde and CO were also monitored in most experiments, but the data are not used in the analysis of the results of this study. Organic reactants other than formaldehyde were measured by gas chromatography with FID detection as described elsewhere (Carter et al. 1993; 1995b). For analysis of the more volatile species, the contents of the syringe were flushed through a 10-ml and 5-ml stainless steel or 1/8' Teflon tube loop and subsequently injected onto the column by turning a gas sample valve. For analysis of less volatile species, the Tenax GC solid adsorbent cartridges were used, which were then placed into the injector of the GC to be heated and desorbed onto the head of the cooled column, which was then temperature programmed for analysis. The calibration procedures employed are discussed elsewhere (Carter et al, 1995b).
Some experiments with the modified surrogates were carried out using commercial products consisting of complex hydrocarbon or ester mixtures as discussed elsewhere (Carter et al, 2000). These were injected by measuring the desired amount of fluid with microsyringe into a tube wrapped with heat tape, then flushing the contents of the tube into the chamber with pure air at about 2 liters/minute for around 10 minutes, with the tube being heated to ~170oC. A total carbon analyzer was used to determine the total amounts of gas-phase carbon in both sides of the chamber after the test fluid has been injected, but before the lights were turned on. The difference in gas-phase carbon in the side with the test fluid injected compared to the base case side without the test fluid is taken as the total carbon in the gas-phase test fluid constituents injected into the chamber.

12
Two temperature thermocouples were used to monitor the chamber temperature, located in the sampling line of continuous analyzers to monitor the temperature in each side. The temperature range in these experiments was typically 25-30 C.
The light intensity in the DTC chamber was monitored by periodic NO2 actinometry experiments utilizing the quartz tube method of Zafonte et al (1977), with the data analysis method modified as discussed by Carter et al. (1995b). The results of these experiments were tracked over time, and there was a gradual decrease in light intensity over time during most of the operational lifetime of this chamber. The actinometry results around the time of these experiments were fit reasonably well by a straight line up to run DTC-704, and this was used to determine the NO2 photolysis rates used for modeling those runs. This yielded assigned NO2 photolysis rates of 0.159 min-1 for DTC-710, the first DTC run listed on Table 2, and 0.144 min-1 for run DTC-764, the last run on the table. The spectrum of the blacklight light source was periodically measured using a LiCor LI-1800 spectroradiometer, and was found to be essentially the same as the general blacklight spectrum recommended by Carter et al (1995b) for use in modeling blacklight chamber experiments. This was used for deriving the rates of all the photolysis reactions from the assigned NO2 photolysis rates derived from the results of the actinometry experiments.
Reactivity Data Analysis Methods
Reactivity experiments consist of simultaneous irradiation of a “base case” reactive organic gas (ROG) surrogate - NOx mixture in one of the dual reaction chambers, together with an irradiation, in the other reactor, of the same mixture with the test compound added. The results were analyzed to yield two measures of VOC reactivity. The first is the effect of the added VOC on the amount of NO reacted plus the amount of ozone formed, and integrated OH radical levels, which is quantified as the change in [O3] – the change in [NO], or ∆([O3]-[NO]). This gives a direct measure of the amount of conversion of NO to NO2 by peroxy radicals formed in the photooxidation reactions, which is the process that is directly responsible for ozone formation in the atmosphere. (e.g., Johnson, 1983; Carter and Atkinson, 1987; Carter and Lurmann, 1991, Carter et al, 1993, 1995b). The incremental reactivity of the VOC relative to this quantity, which is calculated for each hour of the experiment, is given by
0
Baset3
Testt3VOC
t3 ]VOC[])NO[]O([])NO[]O([
]])NO[]O([[IR−∆−−∆
=−∆ (I)
where ∆([O3]-[NO])tTest is the ∆([O3]-[NO]) measured at time t from the experiment where the
test VOC was added, ∆([O3]-[NO])tBase is the corresponding value from the corresponding base case run,
and [VOC]0 is the amount of test VOC added. An estimated uncertainty for IR[∆([O3]-[NO])] is derived based on assuming an ~3% uncertainty or imprecision in the measured ∆([O3]-[NO]) values. This is consistent with the results of the side equivalency test, where equivalent base case mixtures are irradiated on each side of the chamber.
The second measure of reactivity is the effect of the added compound on the integrated OH levels (abbreviated as IntOH in the subsequent discussion). Since this is the quantification we are attempting to improve by use of the modified surrogate being assessed in these experiments, the discussion of the results in this section will primarily focus on this measurement. This is an important factor affecting reactivity because radical levels affect how rapidly all VOCs present, including the base ROG components, react to form ozone.
The integrated OH radical levels are derived from measurements of consumption of a “tracer” compound present in the experiment that reacts significantly only with OH radicals. In particular, if [tracer]0 and [tracer]t are the initial and time=t concentrations of the tracer compound, kOHtracer its OH
13
rate constant, and D is the dilution rate in the experiments, then the integrated OH radical levels at time t is given by
tracert0
tkOH
Dt)]tracer[]tracer[ln(IntOH
−= (II)
The dilution rate is generally small in our flexible reaction bags because they are designed to collapse rather undergo as sample is withdrawn or lost due to leaks, so this is neglected in our analysis. The concentration of tracer at each hourly interval was determined by linear interpolation of the experimental-ly measured values. As discussed above, m-xylene is used as the tracer in our standard mini-surrogate experiments, while 1,3,5-trimethylbenzene is used in the experiments with the modified mini-surrogate mixtures. The OH rate constants used in our analysis for these compounds were 2.36 x 10⁻¹¹ and 5.75 x 10⁻¹¹ cm3 molec-1 s-1, respectively, based on the recommendation of Atkinson (1989). Subsequent evaluations by Atkinson (e.g., Atkinson, 1994) have not resulted in updates to these recommended values.
The effect of the VOC on OH radicals can thus be measured by its IntOH incremental reactivity, which is defined as
0
Baset
Testt
t ]VOC[IntOHIntOH
]IntOH[IR−
= (III)
where IntOHTest and IntOHBase are the IntOH values measured at time t in the added VOC and the base case experiment, respectively. The results are reported in units of 106 min. The uncertainties in IntOH and IR[IntOH] are estimated based on assuming an ~2% imprecision in the measurements of the tracer concentrations. This is consistent with the observed precision of results of replicate analyses of this compound.
Modeling Methods
All the model simulations discussed in this section were carried out using the SAPRC-99 mechanism as documented by Carter (2000). All the individual VOC in the base case experiments and the test VOCs that are single compounds were represented explicitly, though the complex commercial mixtures were represented using surrogate compounds and lumped mechanisms as discussed by Carter et al (2000a). No adjustments were made to the mechanism to improve or modify the results of the model simulations discussed in this section.
The environmental chamber modeling methods used in this work are based on those discussed in detail by Carter and Lurmann (1990, 1991), updated as discussed by Carter et al. (1995b, 1997; Carter, 2000). Model simulations of environmental chamber experiments requires including in the model appropriate representations of chamber-dependent effects such as wall reactions and characteristics of the light source. The photolysis rates were derived from results of NO2 actinometry experiments and measurements of the relative spectra of the light source, as discussed above. The thermal rate constants were calculated using the temperatures measured during the experiments, with the small variations in temperature with time during the experiment being taken into account. The computer programs and modeling methods employed are discussed in more detail elsewhere (Carter et al, 1995b). The specific values of the chamber-dependent parameters used in the model simulations of the experiments for this study are given elsewhere (Carter, 2000).
14
Results and Discussion
A chronological listing of the chamber experiments carried out for this portion of the project is given in Table 2, along with associated characterization and control runs and reactivity experiments carried out for other projects whose results were used or are relevant to this study. As indicated on the table, the characterization runs included n-butane - NOx experiments to measure the chamber radical source, pure air and acetaldehyde-air experiments to measure wall offgasing or background effects, and actinometry experiments. The results of the chamber effects characterization experiments associated with the experiments listed on the table were within the normal range and reasonably consistent with the predictions of the standard chamber effects model used when simulating these chamber experiments (e.g., see Carter et al, 1995b, 1997; Carter, 2000). The results of the actinometry experiments were consistent with the light intensity trend observed from previous actinometry experiments in this chamber, and were used in assigning the light intensities used when modeling the runs.
The concentration-time plots for the base-case ∆([O3]-[NO]) data for the standard and modified mini- surrogate runs listed on Table 2 are shown on Figure 1. The ∆([O3]-[NO]) results of most of the base case standard mini-surrogate runs were very similar, with the results of DTC757B being representative of the average. As shown on the right-hand plots, most of the modified mini-surrogate experiments gave very similar ∆([O3]-[NO]) data as run DTC757B, though the run without the added toluene (DTC711B) gave considerably less ∆([O3]-[NO]) than the others, and the ∆([O3]-[NO]) data for runs DTC730B and DTC733B were also somewhat low. In the latter case the results were different because somewhat lower NOx levels were injected into the experiment.
Table 3 lists the conditions and final ∆([O3]-[NO]) and IntOH results of the modified mini-surrogate experiments carried out for this and other projects during the period indicated on Table 2, and also the conditions and results of comparable standard mini-surrogate runs. The latter includes not only selected standard mini-surrogate runs listed on Table 2, but also earlier DTC experiments that employed comparable test compounds. Except for the experiment with added n-butane, the test compounds used in all the modified mini-surrogate experiments were higher molecular weight (≥C8) either singly or (in the case of Isopar-M®) as a complex mixture (Carter et al, 2000a), so the comparable standard mini-surrogate experiments employed similar test compounds. These are useful test compounds for assessing IntOH measurement methods because they are all relatively strong radical inhibitors. Although the extent of radical inhibition and number of NO to NO2 conversions vary somewhat from compound to compound, generally they have fairly similar overall reactivity characteristics (see Carter, 2000 and references therein). Note that the ∆([O3]-[NO]) and IntOH results of the added test compound are in similar ranges for the two types of surrogates employed.
Figure 2 shows plots of the mid-experiment and final IntOH against ∆([O3]-[NO]) for the base case and added VOC sides for the experiments that were carried out during the time period indicated on Table 2. (The results of the cyclohexane and n-dodecane experiments carried out previously are not shown because the model predicts that the higher light intensities are give somewhat different IntOH vs. ∆([O3]-[NO]) relationships.) It can be seen that there is a fair correlation between the ∆([O3]-[NO]) and IntOH results in the base case experiments, and an even stronger correlation in the case of the test experiments with added higher molecular weight alkane. The test experiment with added n-butane does not have the same relationship between ∆([O3]-[NO]) and IntOH as seen for the experiments with the C≥8 alkanes because of significant differences in its reactivity characteristics. In particular, n-butane has relatively low radical inhibiting characteristics compared to C≥8 alkanes, and tends to form more reactive oxidation products. Under the conditions of the mini-surrogate experiments this difference apparently has a greater effect on ∆([O3]-[NO]) reactivity than it does on reactivity with respect to IntOH.
15
Table 2. Chronological listing of environmental chamber experiments carried out in the DTC to evaluate the effects of using alternative surrogate mixtures to better characterize integrated OH radical levels.
Run Date Description Comments
Chamber was inactive for about two months.
DTC710 10/19/1998 n-Butane + NOx Run to measure the rate of the chamber radical source, as discussed by Carter et al (1995c). The NO oxidation rate was slightly higher on Side A, but the results were in the normal range and were well simulated using the standard chamber model assigned to this series of experiments.
DTC711 10/20/1998 Modified Mini-Surrogate #1 + n-Octane (A)
Modified mini-surrogate without toluene used. N-octane added to side A.
DTC712 10/21/1998 Modified Mini-Surrogate + n-Octane (B)
Modified mini-surrogate with toluene used (same as employed in all subsequent modified mini-surrogate runs.) N-octane added to side B.
DTC714 10/23/1998 Modified Mini-Surrogate + n-Butane (B)
Same modified mini-surrogate with n-butane added to side B.
DTC715 10/27/1998 Modified Mini-Surrogate + n-Dodecane (A)
Modified mini-surrogate with n-dodecane added to side A.
DTC716 10/28/1998 Modified Mini-Surrogate + n-Dodecane (B)
Modified mini-surrogate used. N-dodecane added to side B.
DTC718 10/30/1998 n-Butane + NOx Run to measure the rate of the chamber radical source. Results very similar to results of DTC710.
DTC719 11/4/1998 Modified Mini-Surrogate + Isopar M (A)
Modified mini-surrogate used. Exxon Isopar-M® fluid added to side B. Run carried out for another project as discussed by Carter et al (2000a), but results are also used for surrogate assessment for this project.
DTC724 11/12/1998 Mini-Surrogate +Isopar M (B)
Standard mini-surrogate run with Exxon Isopar-M® added to Side B. Run carried out for another project as discussed by Carter et al (2000a), but results are also used for comparison purposes for surrogate assessment for this project.
DTC725 11/13/1998 Modified Mini-Surrogate + 3,4-Diethyl Hexane (A)
Modified mini-surrogate with 3,4-diethyl hexane added to Side A. Run carried out for another project as discussed by Carter et al (2000c), but results are also used for comparison purposes for surrogate assessment for this project.
DTC727 11/17/1998 Pure Air Irradiation Control run to test for chamber background effects. Only about 10 ppb of O3 was formed on both sides of the chamber, about half the amount predicted by the standard chamber wall model.

Table 2 (continued)
16
Run Date Description Comments
DTC730 11/20/1998 Modified Mini-Surrogate + 3,4-Diethyl-Hexane (A)
Modified mini-surrogate with 3,4-diethyl hexane added to Side A. See comments for run DTC725.
DTC731 11/21/1998 Pure Air Irradiation Pure air irradiation carried out to determine the results of improvements made to clean air system to reduce the background NOx levels that have been periodically observed. Approximately 19 ppb of O3 was observed on both sides after 6 hours of irradiation, compared to ~35 ppb of O3 predicted by the standard chamber effects model. Therefore, the improvements reduced the background O3 formed in these experiments. This has no significant results on results of experiments where NOx is injected, as is the case for the mechanism evaluation runs for this program.
DTC733 11/24/1998 Modified Mini-Surrogate + 2,6-Dimethyl Octane (A)
Modified mini-surrogate with 2,6-dimethyl octane added to Side A. See comments for run DTC725.
DTC734 11/25/1998 Mini-Surrogate + 2-Methyl Nonane (B)
Standard mini-surrogate with 2-methyl nonane added to Side B. See comments for run DTC725.
DTC736 NO2 Actinometry NO2 photolysis rate measured using the quartz tube method was 0.162 min-1, suggesting that the light intensity is becoming approximately constant during this period.
DTC741 12/8/1998 Mini-Surrogate + 2-Methyl Nonane (A)
Standard mini-surrogate with 2-methyl nonane added to Side A. See comments for run DTC725.
DTC745 12/14/1998 n-Butane + NOx Runs were carried out for other programs that caused apparent contamination of Side B as indicated by results of characterization experiments. Several n-butane were conducted to condition the chamber to test whether the chamber has been restored to normal, and this is the last of several such experiments. The NO oxidation rate on Side B was only slightly higher than on Side A, and the NO oxidation rates on both sides were somewhat lower than predicted by the standard chamber model, but the results were in the normal range. Since the contamination caused higher than normal NO oxidation rates, and the side differences are now relatively small, it was concluded that the chamber has been adequately reconditioned.
DTC749 12/18/1998 Modified Mini-Surrogate + 2,6-Dimethyl Octane (A)
Modified mini-surrogate with 2,6-dimethyl octane added to Side A. See comments for run DTC725.

Table 2 (continued)
17
Run Date Description Comments
DTC750 12/19/1998 Mini-Surrogate + Methyl Isopropyl Carbonate (B)
Standard mini-surrogate with methyl isopropyl carbonate added to Side B. Run carried out for another project but base case results used for comparison purposes for this project.
DTC751 12/22/1998 n-Butane - Chlorine Actinometry
Run to measure the light intensity by determining the Cl2 photolysis rate, as discussed by Carter et al (1995c). The results yielded a calculated NO2 photolysis rate of 0.153 min-1, which is reasonably consistent with the results of the quartz tube Actinometry experiments carried out previously, which indicated an NO2 photolysis rate of ~0.16 min-1.
DTC752 1/5/1999 n-Butane + NOx Run to measure the rate of the chamber radical source. Results are reasonably well simulated using the standard chamber model, though Side B still had a somewhat higher radical source than Side A.
DTC753 1/6/1999 Mini-Surrogate + D95 Solvent (B)
Standard mini-surrogate with test mixture added to Side B. Run carried out for another project but base case result used for comparison purposes for this project.
DTC757 1/12/1999 Mini-Surrogate + D95 Solvent (A)
Standard mini-surrogate with test mixture added to Side B. See comments for run DTC753.
DTC759 1/14/1999 Mini-Surrogate + Methyl Isopropyl Carbonate (A)
Standard mini-surrogate with test compound added to Side A. See comments for run DTC753.
DTC760 1/15/1999 Mini-Surrogate + Exxate Solvent (B)
Standard mini-surrogate with test mixture added to Side B. See comments for run DTC753.
DTC761 1/20/1999 Propene + NOx Standard propene - NOx control run for comparison with other such runs in this and other chambers. Results in normal range. Good side equivalency observed.
DTC764 1/26/1999 Acetaldehyde + air Run to test for NOx wall offgasing effects. Approximately 17 ppb of O3 and 4 ppb of PAN formed after six hours of irradiation, with similar results on both sides. Results in good agreement with predictions of standard chamber wall model.

18
Standard Mini-Surrogate Modified Mini-Surrogates
0.0
0.1
0.2
0.3
0.4
0.5
0.6
0 60 120 180 240 300 360 420
Time (minutes)
∆([O
3]-[N
O])
(ppm
)
DTC741BDTC724ADTC734ADTC750ADTC753BDTC757BDTC759BDTC760A
0.0
0.1
0.2
0.3
0.4
0.5
0.6
0 60 120 180 240 300 360 420
Time (minutes)∆(
[O3]-
[NO
]) (p
pm)
DTC711B
DTC712A
DTC714A
DTC715B
DTC716A
DTC719B
DTC730B
DTC733B
DTC749B
Standard (DTC757B)
Figure 1. Concentration-time plots for the sum of ozone formed and NO oxidized in the base-case experiments using the standard and the modified mini-surrogates.
The data on Figure 2 show that the use of the modified mini-surrogate results in somewhat less scatter in the IntOH vs. ∆([O3]-[NO]) relationship in comparable experiments than is the case with the standard mini-surrogate. This is particularly for the experiments and times when the IntOH results are relatively low. On the other hand, the scatter is not significantly different in the IntOH measurements at the end of the base case experiment, since the fraction of tracer compound reacted is relatively large regardless of whether m-xylene or 1,3,5-trimethylbenzene is used as the OH tracer. The results indicate that the two tracers probably give similar precision for IntOH measurements when IntOH is greater than ~6-10 ppt-min, but the more reactive tracer gives a more precise measure when IntOH is less than that.
The ability of the model to simulate the results of the base case experiments carried out during the period indicated on Table 2 is shown on Figure 3, which gives plots of experimental vs. calculated ∆([O3]-[NO]) or IntOH for each hour of the experiments. It can be seen that for most runs during this period the model has a bias towards underpredicting ∆([O3]-[NO]), with the bias being about the same for the three types of mini-surrogates employed. The reason for this apparent bias is unknown, since it is not seen in mini-surrogate experiments carried out during other periods. It is interesting to note that no bias is observed in the experiments with the lowest NOx levels (initial NOx ≈ 0.3 ppb as indicated on Table 3). The bias cannot be attributed to uncertainties in the chamber radical source, since removing the bias requires increasing this parameter well beyond its reasonable uncertainty range.
On the other hand, Figure 3 shows that although there is also a bias towards the model underpredicting the IntOH in the modified mini-surrogate runs, there is no apparent bias in the simulations of this quantity in the standard surrogate experiments. The difference in the average bias is on the order of ~40%, which is more than what can be attributed to any reasonable uncertainty in the rate

19
Table 3. Conditions and selected results of modified mini-surrogate experiments carried out for this and other programs and selected comparable standard mini-surrogate experiments with similar compounds. Runs are sorted in order of
Test Compound Base Case Concentrations (ppm) [a] ∆([O3]-[NO]) (6-hr., ppm)
IntOH (6-hr., ppt-min)Run
Species [a] (ppm) NOx n-C6 Ethene m-Xyl. Tolu. TMB Base Test Base Test
Modified Mini-Surrogate Experiments (Sorted in order of increasing IntOH for test experiment) DTC733 26-DM-C8 3.0 0.30 0.48 0.83 0.21 0.049 0.47 0.23 15.4 3.0 DTC711 n-C8 3.9 0.41 0.45 0.85 0.051 0.39 0.23 11.9 3.9 DTC712 n-C8 4.4 0.39 0.45 0.84 0.20 0.050 0.53 0.27 16.8 4.4 DTC730 34-DE-C6 5.7 0.30 0.47 0.79 0.20 0.049 0.44 0.32 13.8 5.7 DTC749 26-DM-C8 7.0 0.38 0.47 0.90 0.21 0.048 0.54 0.36 16.5 7.0 DTC714 n-C4 7.5 0.39 0.42 0.76 0.18 0.044 0.55 0.66 16.8 7.5 DTC716 n-C16 8.7 0.40 0.43 0.77 0.19 0.045 0.58 0.38 17.2 8.7 DTC715 n-C12 9.2 0.40 0.43 0.75 0.20 0.048 0.54 0.42 15.7 9.2 DTC719 Isopar-M 10.0 0.40 0.45 0.82 0.20 0.051 0.51 0.42 14.1 10.0
Comparable Standard Mini-Surrogate Experiments (in order of increasing IntOH for test experiment) [b] DTC734 2-Me-C9 2.1 0.40 0.47 0.85 0.13 0.54 0.24 13.4 2.1 DTC724 Isopar-M 3.9 0.33 0.43 0.77 0.13 0.47 0.24 13.1 3.9 DTC551 Cyc-C6 4.3 0.38 0.42 0.74 0.12 0.63 0.37 18.8 4.3 DTC741 2-Me-C9 4.9 0.38 0.45 0.83 0.12 0.47 0.27 13.1 4.9 DTC541 Cyc-C6 6.6 0.38 0.45 0.84 0.13 0.62 0.44 16.9 6.6 DTC283 n-C12 7.8 0.32 0.49 0.76 0.15 0.58 0.34 19.5 7.8 DTC271 n-C12 14.4 0.30 0.49 0.77 0.12 0.55 0.38 23.2 14.4 DTC273 n-C12 15.5 0.31 0.51 0.74 0.12 0.63 0.49 23.0 15.5
[a] Abbreviations for species used in this table: n-C6: n-hexane; m-Xyl: m-xylene; Tolu: toluene; TMB: 1,3,5-trimethylbenzene; 26-DM-C8: 1,6-dimethyl octane, n-C8: n-octane; 34-DE-C6: 3,5-diethyl hexane; n-C4: n-butane; n-C16: n-hexadecane; n-C12: n-dodecane; Isopar-M: Exxon Isopar-M® fluid (complex mixture of C12-C16 branched alkanes, initial concentration given in ppmC); Cyc-C6: Cyclohexane.
[b] The experiments with n-dodecane and cyclohexane are documented by Carter et al (2000b) and Carter et al (1997), respectively. The other experiments are listed on Table 2.
constants used to derive the IntOH values. Thus, the performance of the model in simulating the base case results is somewhat different for the different types of surrogates in this respect.
Figure 4 and Figure 5 show experimental and calculated concentration-time profiles for IntOH and IntOH reactivities for all the experiments listed on Table 3. The estimated precision of the IntOH measurements is indicated by error bars in the data, which are derived based on an assumed ~2% “best case” uncertainty in each of the GC measurement of the tracer concentration, and then propagating this uncertainty through Equations (II) and (III). Note that any uncertainty in the test compound concentration is not taken into account in this analysis for IR IntOH. The top plots show the experiments with the standard mini-surrogate and the bottom plots show modified mini-surrogate experiments with similar ranges in IntOH values in the added test compound run.
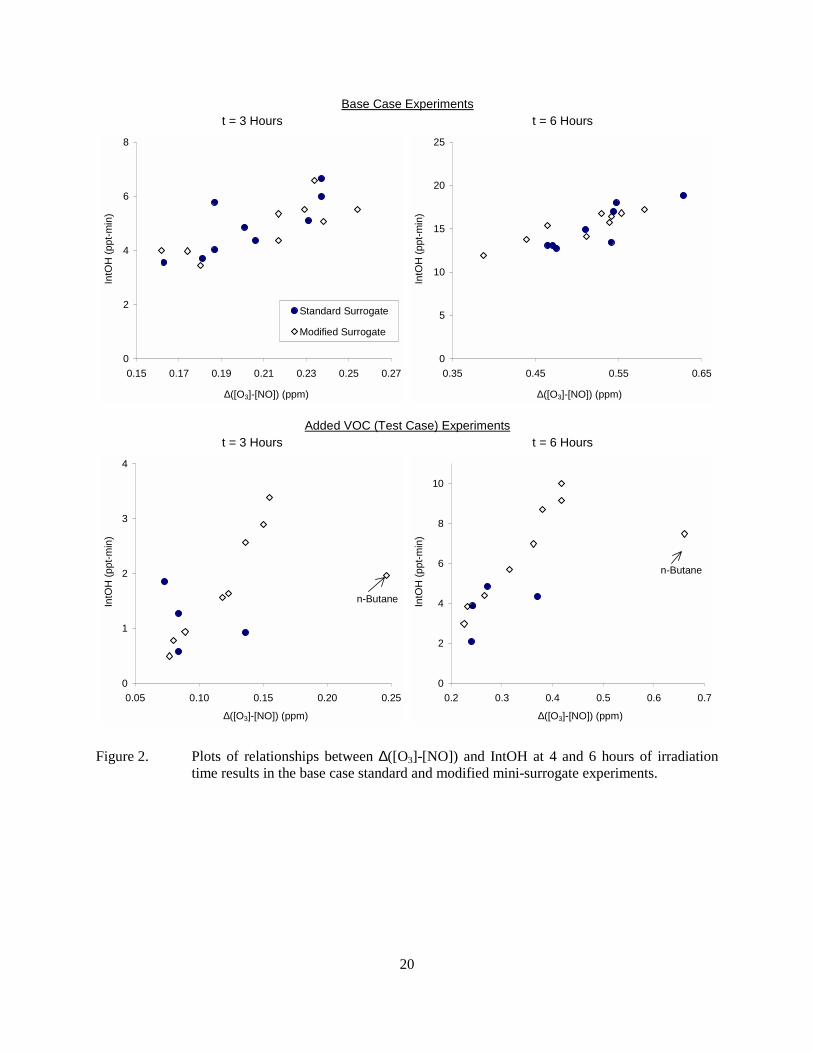
20
Base Case Experimentst = 3 Hours t = 6 Hours
0
5
10
15
20
25
0.35 0.45 0.55 0.65
∆([O3]-[NO]) (ppm)
IntO
H (p
pt-m
in)
0
2
4
6
8
0.15 0.17 0.19 0.21 0.23 0.25 0.27
∆([O3]-[NO]) (ppm)
IntO
H (p
pt-m
in)
Standard Surrogate
Modified Surrogate
Added VOC (Test Case) Experiments
t = 3 Hours t = 6 Hours
0
2
4
6
8
10
0.2 0.3 0.4 0.5 0.6 0.7
∆([O3]-[NO]) (ppm)
IntO
H (p
pt-m
in)
n-Butane
0
1
2
3
4
0.05 0.10 0.15 0.20 0.25
∆([O3]-[NO]) (ppm)
IntO
H (p
pt-m
in)
n-Butane
Figure 2. Plots of relationships between ∆([O3]-[NO]) and IntOH at 4 and 6 hours of irradiation time results in the base case standard and modified mini-surrogate experiments.
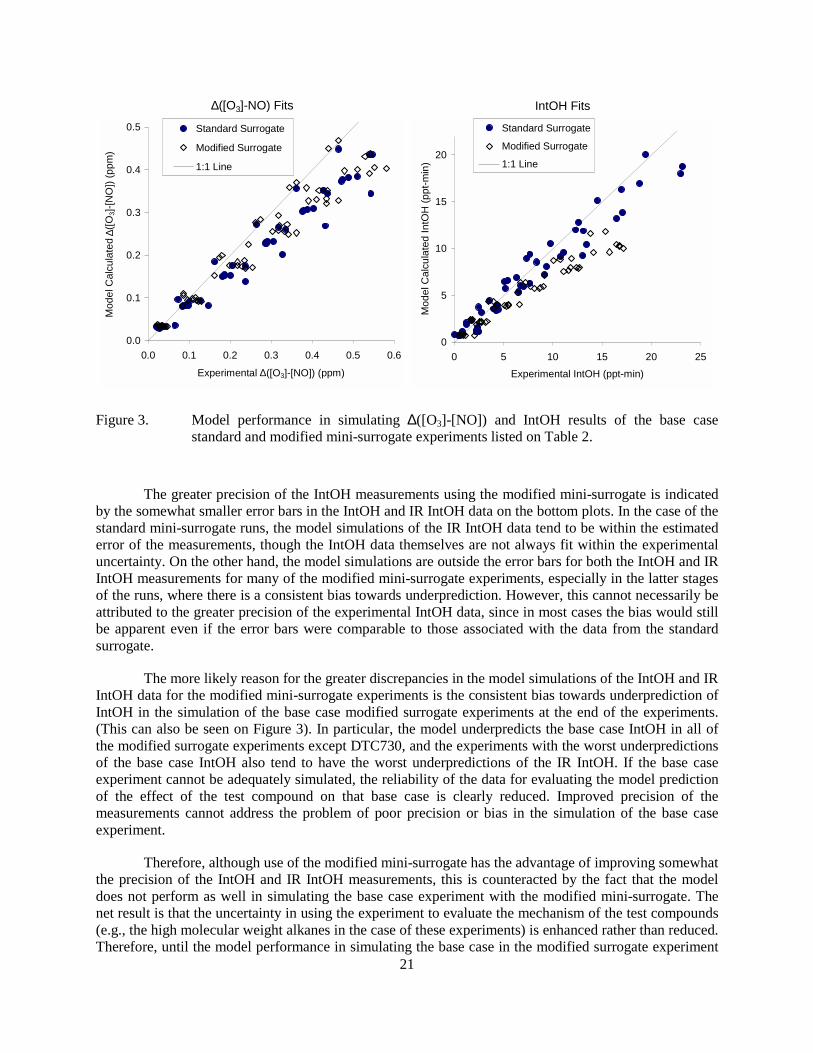
21
∆([O3]-NO) Fits IntOH Fits
0
5
10
15
20
0 5 10 15 20 25Experimental IntOH (ppt-min)
Mod
el C
alcu
late
d In
tOH
(ppt
-min
)
Standard Surrogate
Modified Surrogate
1:1 Line
0.0
0.1
0.2
0.3
0.4
0.5
0.0 0.1 0.2 0.3 0.4 0.5 0.6
Experimental ∆([O3]-[NO]) (ppm)
Mod
el C
alcu
late
d ∆(
[O3]-
[NO
]) (p
pm)
Standard Surrogate
Modified Surrogate
1:1 Line
Figure 3. Model performance in simulating ∆([O3]-[NO]) and IntOH results of the base case standard and modified mini-surrogate experiments listed on Table 2.
The greater precision of the IntOH measurements using the modified mini-surrogate is indicated by the somewhat smaller error bars in the IntOH and IR IntOH data on the bottom plots. In the case of the standard mini-surrogate runs, the model simulations of the IR IntOH data tend to be within the estimated error of the measurements, though the IntOH data themselves are not always fit within the experimental uncertainty. On the other hand, the model simulations are outside the error bars for both the IntOH and IR IntOH measurements for many of the modified mini-surrogate experiments, especially in the latter stages of the runs, where there is a consistent bias towards underprediction. However, this cannot necessarily be attributed to the greater precision of the experimental IntOH data, since in most cases the bias would still be apparent even if the error bars were comparable to those associated with the data from the standard surrogate.
The more likely reason for the greater discrepancies in the model simulations of the IntOH and IR IntOH data for the modified mini-surrogate experiments is the consistent bias towards underprediction of IntOH in the simulation of the base case modified surrogate experiments at the end of the experiments. (This can also be seen on Figure 3). In particular, the model underpredicts the base case IntOH in all of the modified surrogate experiments except DTC730, and the experiments with the worst underpredictions of the base case IntOH also tend to have the worst underpredictions of the IR IntOH. If the base case experiment cannot be adequately simulated, the reliability of the data for evaluating the model prediction of the effect of the test compound on that base case is clearly reduced. Improved precision of the measurements cannot address the problem of poor precision or bias in the simulation of the base case experiment.
Therefore, although use of the modified mini-surrogate has the advantage of improving somewhat the precision of the IntOH and IR IntOH measurements, this is counteracted by the fact that the model does not perform as well in simulating the base case experiment with the modified mini-surrogate. The net result is that the uncertainty in using the experiment to evaluate the mechanism of the test compounds (e.g., the high molecular weight alkanes in the case of these experiments) is enhanced rather than reduced. Therefore, until the model performance in simulating the base case in the modified surrogate experiment

22
Standard Mini-SurrogateDTC734 DTC724 DTC551 DTC7412-ME-C9 ISOPARM CYCC6 2-ME-C9
Test IntOH(6) = 2 4 4 5 ppt-min
IntOH (ppt-min)
IR IntOH (ppt-min / ppm or ppmC)
Modified Mini-SurrogateDTC733 DTC711 DTC712 DTC730
26DM-C8 N-C8 N-C8 34-DE-C6Test IntOH(6) = 3 4 4 6 ppt-min
IntOH (ppt-min)
IR IntOH (ppt-min / ppm or ppmC)
02468
10121416
1 2 3 4 5 6
-12
-9
-6
-3
0
0 1 2 3 4 5 6
02468
10121416
1 2 3 4 5 6
-12
-9
-6
-3
0
0 1 2 3 4 5 6
0
5
10
15
20
25
1 2 3 4 5 6
-8
-6
-4
-2
0
0 1 2 3 4 5 6
02468
10121416
1 2 3 4 5 6
-20
-15
-10
-5
0
5
0 1 2 3 4 5 6
0
5
10
15
20
1 2 3 4 5 6
-14-12-10
-8-6-4-20
0 1 2 3 4 5 6
0
5
10
15
1 2 3 4 5 6
-8
-6
-4
-2
0
0 1 2 3 4 5 6
0
5
10
15
20
1 2 3 4 5 6
-14
-10
-6
-2
2
0 1 2 3 4 5 6
0
5
10
15
1 2 3 4 5 6
-8
-6
-4
-2
0
0 1 2 3 4 5 6
Test Experiment Base Experiment Test Model Base Model
Figure 4. Plots of Integrated OH results from standard and modified mini-surrogate experiments where the 6-hour IntOH for the test experiment was ~6 ppt-min or less.
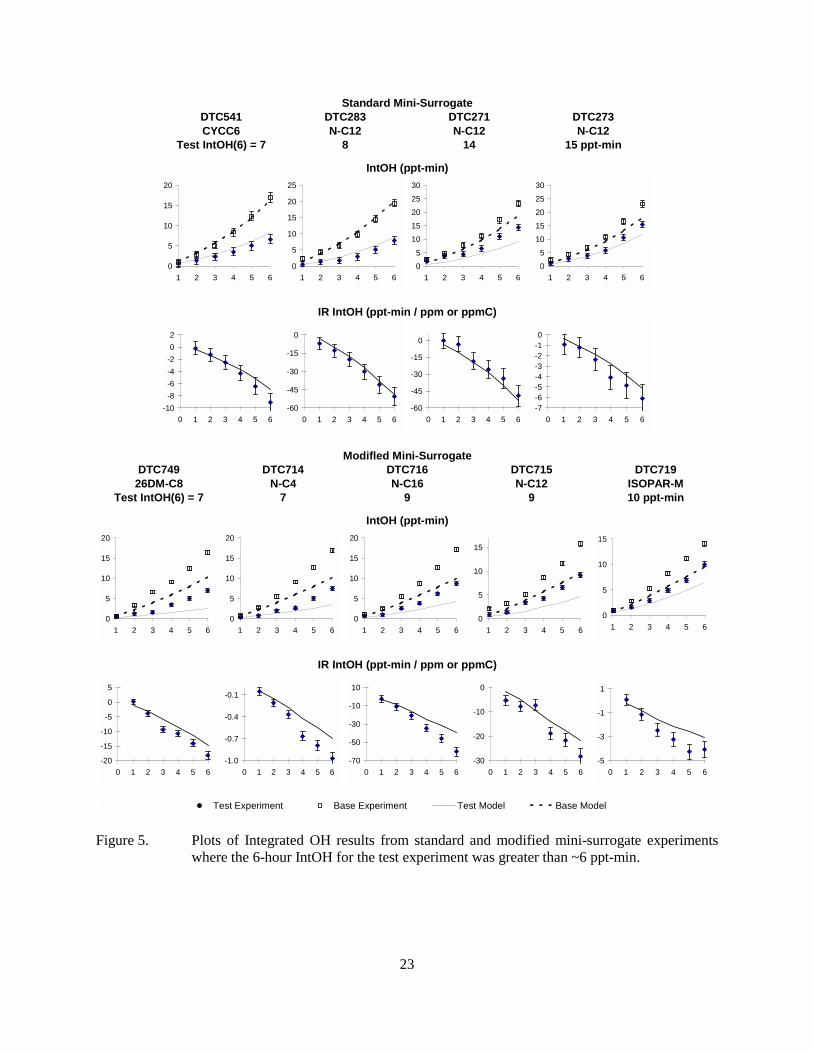
23
Standard Mini-SurrogateDTC541 DTC283 DTC271 DTC273CYCC6 N-C12 N-C12 N-C12
Test IntOH(6) = 7 8 14 15 ppt-min
IntOH (ppt-min)
IR IntOH (ppt-min / ppm or ppmC)
0
5
10
15
20
1 2 3 4 5 6
-10-8-6-4-202
0 1 2 3 4 5 6
0
5
10
15
20
25
1 2 3 4 5 6
-60
-45
-30
-15
0
0 1 2 3 4 5 6
05
1015
2025
30
1 2 3 4 5 6
-60
-45
-30
-15
0
0 1 2 3 4 5 6
05
1015
2025
30
1 2 3 4 5 6
-7-6-5-4-3-2-10
0 1 2 3 4 5 6
Modifled Mini-Surrogate
DTC749 DTC714 DTC716 DTC715 DTC71926DM-C8 N-C4 N-C16 N-C12 ISOPAR-M
Test IntOH(6) = 7 7 9 9 10 ppt-min
IntOH (ppt-min)
IR IntOH (ppt-min / ppm or ppmC)
0
5
10
15
20
1 2 3 4 5 6
-20
-15
-10
-5
0
5
0 1 2 3 4 5 6
0
5
10
15
20
1 2 3 4 5 6
-1.0
-0.7
-0.4
-0.1
0 1 2 3 4 5 6
0
5
10
15
20
1 2 3 4 5 6
-70
-50
-30
-10
10
0 1 2 3 4 5 6
0
5
10
15
1 2 3 4 5 6
-30
-20
-10
0
0 1 2 3 4 5 6
Test Experiment Base Experiment Test Model Base Model
0
5
10
15
1 2 3 4 5 6
-5
-3
-1
1
0 1 2 3 4 5 6
Figure 5. Plots of Integrated OH results from standard and modified mini-surrogate experiments where the 6-hour IntOH for the test experiment was greater than ~6 ppt-min.

24
can be improved, it is probably better to continue to use the standard mini-surrogate experiment for mechanism evaluation purposes.
Obviously, the preferred solution is to improve the mechanism to the point that the model simulates the base case experiment adequately regardless of which components or OH radical tracers are employed. The fundamental problem is probably the uncertainties in the aromatics mechanisms, which, because of lack of quantitative predictive information concerning the highly reactive products formed and their mechanisms, have to be adjusted based on model simulations of chamber data. In the case of m-xylene, the only reactive aromatic used in the standard mini-surrogate, the mechanism was optimized to achieve satisfactory model simulations not only of the aromatic - NOx experiments, but also of representative standard mini-surrogate runs. On the other hand, the 1,3,5-trimethylbenzene mechanism was optimized based only on simulations of trimethylbenzene - NOx experiments, with its ability to simulate surrogate experiments not taken into account. This probably would be necessary before the modified surrogates using this compound can be widely used in reactivity assessment experiments. This would require additional experimentation and mechanism development work that is beyond the scope of the current project.

25
DEVELOPMENT OF A DIRECT REACTIVITY MEASUREMENT METHOD
Objectives and Overall Approach
Measurement of Direct Reactivity
The impact of a VOC on ozone formation depends on various aspects of its atmospheric reaction mechanism, whose relative importance in terms of affecting ozone depends on environmental conditions. Although atmospheric reactions of VOCs can have many complexities, the major overall mechanistic factors that affect their ozone impacts can be categorized as follows:
• The conversions of NO to NO2 caused directly by the reactions of the VOC or of the oxidized products that it forms. This is the direct process by which VOCs cause ozone formation in photochemical systems. For this reason, the rate of NO to NO2 conversions caused directly by the reactions of the VOC is referred to as the direct reactivity of the VOC in this discussion. This is an important factor affecting ozone impacts under essentially all conditions where ozone formation can occur, though as indicated below it is not the only factor.
• The effect of the reactions of the VOC or the products that it forms on overall radical levels. This can be significant in affecting the incremental ozone impact of a VOC under environmental conditions where ozone levels are determined by how rapidly it is formed. This is because radical levels affect the rate of reaction of all VOCs present, and thus the rate at which they react to form ozone. This can be an important factor in affecting a VOCs impact under relatively high NOx conditions, such as those used to derive the MIR scale used in the CARB’s reactivity-based regulations (CARB 1992, 2000) where ozone levels are determined primarily by the rate of its formation. However, this aspect of reactivity is relatively less important affecting reactivity when ozone formation is NOx limited.
• The effect of the reactions of the VOC on rates of NOx removal from the atmosphere. This can be a major factor affecting a VOCs ozone impact under conditions where O3 is limited by the availability of NOx. NOx is required for O3 formation in the lower atmosphere and is removed more rapidly than VOCs and their reactive products, so NOx availability ultimately limits how much O3 can be formed given sufficient reaction time. Therefore, VOCs that enhance rates of NOx removal result in less ultimate O3 formation from reaction of all other VOCs present than would be the case if they were not reacting. For VOCs such as aromatics that have relatively high NOx removal effects, this can be the dominant factor affecting their reactivity under low NOx conditions. However, this aspect of reactivity has essentially no impact on O3 formation under relatively high NOx conditions where O3 formation is rate limited, such as used to derive the MIR scale.
Although MIR predictions are determined primarily by direct reactivities and effects on radical levels, all aspects of reactivity need to be appropriately represented to predict a VOC’s ozone impacts under the full variety of atmospheric conditions. Environmental chamber experiments such as carried out in our laboratories can to some extent be used to test these different aspects, since different experiments have different sensitivities. While the direct reactivities affect all types of experiments, the high NOx mini-surrogate experiments tend to be more sensitive to radical effects than the full surrogate experiments, and the low NOx experiments provide a test of the NOx removal aspects of the mechanisms. However, because of imprecisions of the data as discussed above, the tests of the different mechanistic aspects are somewhat ambiguous, particularly in the evaluations of the direct reactivity. This is because direct reactivity effects can be masked by radical impact effects in high NOx experiments and by radical

26
removal effects in low NOx experiments. As discussed in the previous section, measurements of effects of the VOCs on radical levels do not always remove this source of ambiguity.
Because of this, if an experiment could be developed that provides a measurement that is primarily sensitive to direct reactivity effects, then a source of ambiguity in the evaluation of mechanisms would be removed, and assessments of the indirect effects in model simulations of environmental chamber experiments would be less uncertain. This would reduce uncertainties in model predictions of ozone impacts under atmospheric conditions, where the relative importance of direct vs. indirect effects can be highly variable, and in general are different than obtained in the standard set of environmental chamber reactivity experiments.
As discussed in the Introduction, in addition to providing somewhat ambiguous information on the various mechanistic aspects of reactivity, environmental chamber experiments also suffer from the problem of being expensive to carry out and not well suited to studies of low volatility VOCs or incompletely characterized mixtures. If a direct reactivity experiment can be designed that involves lower cost per compound and is better suited to low volatility VOCs and mixtures, then it would make it more practical to obtain experimental reactivity information for VOCs that otherwise would not be studied. Although direct reactivity is not the only factor that needs to be considered when assessing reactivity, and the availability of experimental information concerning this aspect is clearly superior to the availability of no data at all, which may otherwise be the alternative.
Experimental Approaches to Measure Direct Reactivity
An experiment that would be sensitive primarily to direct reactivity effects must be one where the effect of the VOC on NO to NO2 conversions can be measured under conditions where the initial reactions of the VOC are the same as in the atmosphere, but where both radicals and NOx are in excess. The impacts of any effects of the VOCs on radical levels should be minimized if the main radical sources and sinks are due primarily to processes involving other reactants, and the impacts of their effects on NOx removal should be minimal as long as NOx levels are always abundant in the experiment.
One simple type of experiment that could satisfy these criteria, at least for VOCs that are consumed primarily by reaction with OH radicals, is an irradiation of the VOC in the presence of relatively high levels of nitrous acid (HONO) in air. HONO undergoes rapid photolysis in the atmosphere to form OH radicals and NO, and in the absence of other reactants the OH radicals are consumed primarily by their reactions with NO2, or HONO. The major reactions are as follows:
HONO + hν → OH + NO OH + HONO → H2O + NO2 OH + NO → HONO OH + NO2 → HNO3
with the following occurring to a minor extent (~13% of the HONO photolysis):
HONO + hν → H + NO2 H + O2 → HO2 HO2 + NO → NO2
The net effect of these reactions is the conversion of the HONO to NO, NO2 and HNO3. Although the photostationary state reactions involving the photolysis of NO2 and formation of O3 are also occurring at rapid rates,

27
NO2 + hν → O3P + NO O3P + O2 + M → O3 + M NO + O3 → NO2
in the absence of other reactants the NO/NO2 ratio is sufficiently high that ozone formation is not significant, and these three reactions have no significant net effect.
If a VOC that reacts with OH radicals and forms radicals that convert NO to NO2 is added to the system, the result is that the NO levels are reduced and the NO2 levels are increased. If enough VOC is present to convert all the NO to NO2, then this process is manifested by the formation of O3. As indicated in the previous section, because of the nature of the photostationary state reactions initiated by the rapid NO2 photolysis, above, the overall effect of these additional NO to NO2 conversions is an increase in the quantity ([O3]-[NO]). Therefore, the measure of the effect of the VOC on this system can be obtained from the quantity ∆([O3]-[NO]), which is defined as
∆([O3]-[NO])VOC = ([O3]-[NO])HONO+VOC - ([O3]-[NO])HONO (IV)
where ([O3]-[NO])HONO is the [O3]-[NO] measurement at the end of HONO photolysis experiment in the absence of the added VOC, and ([O3]-[NO])HONO+VOC is the [O3]-[NO] measurement in the experiment where the VOC has been added. Therefore, the quantity ∆([O3]-[NO])VOC divided by the amount of VOC added should provide a measure of the VOC’s reactivity under the conditions of this experiment.
Model simulations of this system indicate that the addition the VOC will cause the ∆([O3]-[NO]) to increase in an approximately linear manner with added VOC at low VOC levels, but then eventually level off to a constant level when the amount of added VOC is sufficiently high. This behavior is also observed our experiments, as discussed below. This can be fit using the following empirical relationship:
∆([O3]-[NO]) = Rmax (1 – e–[VOC] R0/Rmax) (V)
where R0 and Rmax are parameters that adjusted to fit the ∆([O3]-[NO]) vs [VOC] data. R0 and Rmax provide a measure of the effect of the VOC on the system at the low and high concentration limits, respectively, since at low VOC concentrations
∆([O3]-[NO]) ≈ R0 [VOC] (VI) or
[ ] [ ]( )[ ]VOC
NOOR 3
0−∆
≈ (VII)
and at high concentrations ∆([O3]-[NO]) ≈ Rmax (VIII)
Note that the unitless quantity R0 can also be thought of as the incremental reactivity of the VOC in the HONO photolysis system. This is the quantity of interest in the direct reactivity measurement. This is because if the amount of VOC reacting is relatively small compared to the amount of HONO reacting, then the only significant radical and NOx sources and sinks would be provided by the HONO reactions, and the only way the VOC will affect the results will be the additional NO to NO2 conversions it causes. On the other hand, the Rmax quantity, which has units of concentration, is expected to be relatively insensitive to indirect reactivity effects, being primarily determined by the experimental conditions and the availability of NOx. However, the ability to correctly model measured values of Rmax is useful means to test our characterization and ability to model the overall experiment.

28
These HONO and HONO + VOC photolysis experiments can be carried out using different general experimental approaches, each of which have advantages and disadvantages. The three alternatives considered in this project are discussed briefly below.
Static Experiments. This involves simply injecting the HONO or the HONO + VOC mixture in an environmental chamber or reactor and irradiating it either for a set amount of time or until all the HONO has reacted. This has the advantages of relative simplicity and the fact that the equipment and facilities available in our laboratory are suited for this approach. It also has the advantages of being most straightforward to model if the reasonably well-characterized environmental chambers used in our other reactivity studies are employed. However, it had many of the same problems as the types of environmental chamber reactivities experiments discussed in the previous section in terms of difficulties in injecting low volatility compounds, and the relatively high cost and expertise required. Although the half-life for HONO consumption in our environmental chambers is less than 15 minutes, each reactivity measurement would still be relatively time consuming because of the time required to prepare and inject the reactants, conduct the analyses before and after the irradiations, and to clean and prepare the chamber for the experiments. In addition, the HONO generation system constructed for this project was found not to produce sufficient amounts of HONO to conveniently inject in the desired concentrations in the relatively large environmental chambers we normally employ in a reasonable amount of time. Use of smaller reactors can address this problem, but this would mean that wall effects would be a greater factor in studies of lower volatility compounds.
Another serious problem with static chamber experiments is that variable amounts injected and dilution or volume reduction due to sampling (for smaller reactors) makes it more difficult to reproduce conditions exactly from experiment to experiment. To obtain a useful direct reactivity measure according to Equation (IV), it is necessary that the HONO-only and the HONO + VOC irradiations be carried out under the same conditions. However, this can be addressed to some extent by conducting dual chamber experiments such as employed with our reactivity experiments discussed above.
Continuous Flow Experiments. This involves continuously flushing an irradiated reactor with the desired amount of HONO or HONO + VOC – air mixture, and sampling the reacted mixture as it exits the reactor. These can be conducted in either stirred flow or plug flow mode, depending on the design of the reactor, as discussed below. In either case, continuous flow experiments have a number of significant advantages over static experiments for the purpose of this project. The reasons for this are as follows:
• The HONO generation system developed for this project (discussed below) produces HONO in a continuous flow, so it relatively easy to adapt it to a continuous flow experiment. It is also much more straightforward to reproduce conditions in terms of amounts of HONO present and reaction conditions using appropriate flow control methods, provided that the output of the HONO generation system is relatively constant, as turned out to be the case.
• A continuous VOC injection process is potentially more suitable for low volatility compounds that are difficult to study in static systems because of the time required to volatilize sufficient material for large reactors. In addition, “Sticky” or low volatility VOCs that that are absorbed on reactor walls would be replenished by the continuous VOC injection and in principle eventually a steady state should be reached between absorbing and offgasing VOC that may reduce the net effect of wall loss processes that may be significant in static systems.
• Once the appropriate conditions and experimental and analysis methods are established, it may be feasible to develop a self contained system that can make such measurements at other laboratories at lower cost and effort than is required to conduct environmental chamber experiments.

29
For these reasons, the major effort in this component of this project consisted of developing and evaluating various types of continuous flow experiments for obtaining direct reactivity measurements using the HONO photolysis methods. However, continuous flow experiments are physically more complex than static experiments and we do not have the level of experience for using them for mechanism evaluation than is the case for static experiments. Therefore, it is important to verify that the results of such experiments can be correctly modeled by conducting experiments with chemically simple systems where the mechanism is reasonably well established.
Stirred Flow Experiments. The first type of continuous flow experiment that was evaluated was based on the stirred flow approach. In this approach, the reactor is designed so that it can be expected that the reactants entering the irradiated reactor are well mixed during the experiment, as would be the case if a stirred reactor were employed. This approach was adopted initially because it involves use of larger volume reactors with lower surface / volume ratios and longer residence times than would be the case with the plug flow approach, discussed below. The lower surface/volume ratios would minimize surface effects when conducting experiments with lower volatility materials, and the longer residence times would give sufficient reaction time for the addition of the VOCs to have measurable effects on the results.
The conditions of the continuous stirred experiments are modeled by representing the continuous reactant and dilution air input using both an emissions and dilution term, and carrying out the simulation for a sufficiently long time that a steady state is achieved. For modeling purposes, the concentration of each reactant is represented by the following kinetic differential equation:
d[C]t/dt = ([C]0 – [C]t) (F / V) + ChemTrans(C,t) (IX)
Here, [C]0 is the concentration of the reactant in the input stream (which would be zero for product species not in the input stream, such as O3), [C]t is the concentration of the reactant at time t, F is the flow rate, V is the reactor volume, and ChemTrans(C,t) is the rate of change of the reactant at time t due to all the chemical formation and loss processes. Note that the F/V ratio (in appropriate units) is the effective dilution rate applicable to all reactants, and the F/V ratio times the initial reactant concentration is the effective emission rate of the reactant.
Note also that the F/V ratio, which has units of time-1, indicates the time scale required to achieve steady state. For most of the stirred flow experiments in this project the volume was about 50 liters and the flow was about 5 liters min-1, which means that the dilution rate was about 0.1 min-1. This means that at least 30 minutes is required to be sure that near-steady-state conditions have been reached.
It is important to recognize that Equation (IX) is only valid if the reactor is well mixed throughout the experiment, and if this is not the case then the experiment may not be modeled correctly. This was evaluated during the course of the experiments carried out for this project, as discussed below.
Plug Flow Experiments. As discussed below, problems were encountered in modeling aspects of the continuous flow experiments carried out initially, so during the latter portion of this program the focus of the project was on evaluating plug flow experiments. These experiments are carried out using relatively long and narrow tubular reactors where it is expected that mixing up- and downstream is negligible compared to the rate of flow through the reactor. Under this assumption, once the reactants enter the reactor they are assumed to react in their own parcel without being affected by dilution or mixing from the reactants in the next parcel as they move down the reaction tube being irradiated. Therefore, they can be modeled as a static system with a reaction time equal to the residence time in the irradiated tube, which is given by the volume divided by the flow (V/F).
Two series of plug flow experiments were carried out during the course of this project, one using a relatively long and narrow irradiated tube with a residence time of typically ~1.5 minutes, and one using

30
a wider and shorter tube with a residence time (in most experiments) of ~0.5 minutes. The first experiments employed the longer tube in order to assure plug flow conditions and maximize the reaction time to enhance the sensitivity of the measurement to the added VOC. Evidence of problems with experiments with low volatility compounds was found in those experiments, so the second series used a shorter and wider tube to minimize these wall effects. Although the reduced reaction time resulting from this modified design decreased the sensitivity of the measurement somewhat, with appropriate conditions the sensitivity was found to be generally sufficient. The details of the methods and results are discussed below.
Methods of Procedure
HONO Generation System
Although HONO is notoriously difficult to handle because it readily decomposes to NO and NO2 on surfaces, Febo et al (1995) developed a clean method of continuously generating up to10 ppm-liter per minute of nearly pure HONO. This involves passing dilute HCl gas in humidified air through a continuously stirred bed of granulated sodium nitrite salt, with the nitrous acid being formed by the reaction
HCl (g) + NaNO2 (s) → HONO (g) + NaCl (s).
The continuous stirring of the granulated salt apparently allows the HCl to be quantitatively converted without significant decomposition of the HONO that is formed.
Figure 6 shows a diagram of our implementation of the Febo et al (1995) HONO generation system as developed for this project, and Figure 7 shows a photograph of the components in the temperature controlled oven where the HCl is injected and the reaction takes place. The gas lines consisted of Teflon tubing, and the “T”’s and unions were also made of Teflon. As shown on Figure 6, a number of flow regulators were used to regulate the total flow of the input of purified air to the HONO generator so that the output remains constant over long periods of time. Generally, this total flow is measured using a mass flow sensor (McMillan Company Model 50, range 10) in conjunction with each experiment. The flow is split up into two or three streams using needle valves in series with rotameters, indicated on the figure as “Flow Regulator 1,” etc. The first two flows were used to determine the total amount of gas going into the HONO reactor itself, and the third was used to dilute the output of the reactor if desired for experiments with lower HONO levels. The first flow was humidified by bubbling through distilled water at laboratory temperature to achieve saturation, and the second was dry air. The two were combined to achieve a desired humidity of 50% RH. The relative humidity of the system can be varied by adjusting the flow rate ration between a humidified gas line and a dry line.
The reaction itself occurs inside a temperature-controlled oven (Fisher Scientific, Isotemp Incubator Model 5250) that can regulate the temperature to within ± 0.1oC in the 20-80oC range. The temperature employed varied depending on the desired HONO output levels, but was typically in the 37-56oC range. It was found that the best way to introduce the HCl into the gas stream at a controlled and constant rate in the desired low concentration range was to use a diffusion vial as indicated on the figure. This consisted of two 100 ml capacity Pyrex vials separated by a ¼” ID x 2.5” long neck. The lower portion of the vial was half filled with 50% HCl in water (VWR brand Hydrochloric acid solution 50% (V/V), Cat.# VW-3418-1), and the mixed air from regulators 1 and 2 was passed through the upper portion as indicated on the figure. The separation of the two halves is such that the diffusion yields the desired concentration entering the air stream. The temperature of the oven controls the vapor pressure of the HCl over the aqueous solution, and thus the rate at which it diffuses into the stream. This temperature is set at the level that yields the desired HONO concentration that is output. The humidified HCl – air
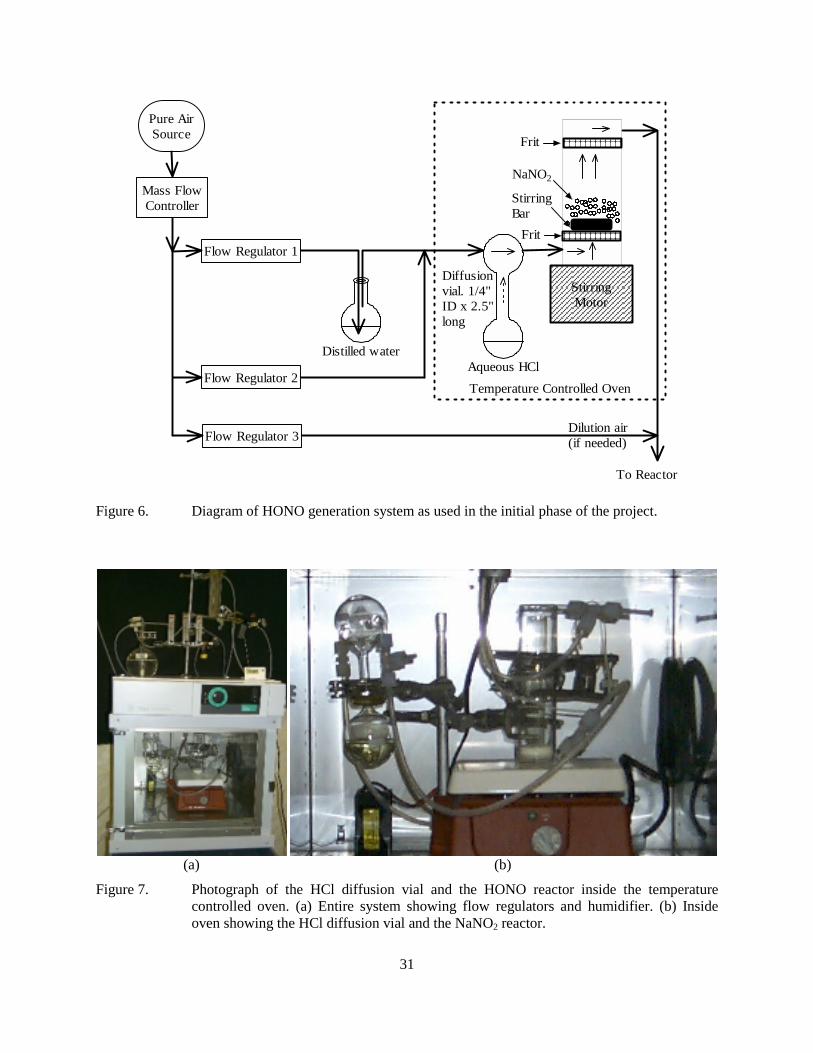
31
Distilled water
Flow Regulator 1
Flow Regulator 2
Flow Regulator 3
Pure AirSource
Aqueous HClTemperature Controlled Oven
StirringMotor
NaNO2
StirringBar
Dilution air(if needed)
To Reactor
Frit
Frit
Mass FlowController
Diffusionvial. 1/4"ID x 2.5"long
Figure 6. Diagram of HONO generation system as used in the initial phase of the project.
(a) (b)
Figure 7. Photograph of the HCl diffusion vial and the HONO reactor inside the temperature controlled oven. (a) Entire system showing flow regulators and humidifier. (b) Inside oven showing the HCl diffusion vial and the NaNO2 reactor.

32
stream then passes into the 1.3” ID reaction cell and through a frit holding the NaNO2 salt, which is continuously stirred using a 1” cross shaped magnetic stirring rod rotating at the low setting. The air with the HONO produced in the reaction exits from the top of the reactor after passing through a frit (that is ~6” from the bottom frit) that prevents the salt from getting into the output stream. This is then combined with the dilution air stream if appropriate for the experiment.
Approximately 10 grams of NaNO2 is used in our system. In most experiments, the “super-free-flowing NaNO2 from Aldrich Chemical, Inc. was used. However, between 3/21/01 and 5/3/01 the ACS reagent version was used because the super-free-flowing version was temporarily unavailable. (Although the “free flowing” type was preferred, using the other type didn’t seem to affect noticeably the amount of NO impurity in the output or the data obtained in the experiments.) The NaNO2 is replaced and the reactor is cleaned whenever the measured NO impurity in the HONO starts increasing above the normal levels observed when the salt is new, or whenever an excessive amount of salt becomes caked on the side. Generally this is approximately once a week under the conditions of most experiments carried out for this project.
Static Experiments
Several static HONO experiments were carried out using either the same CE-CERT “Dividable Teflon Chamber” (DTC) that was employed in the surrogate evaluation experiments discussed in the previous section or small “pillow bag” chamber described below. Except as noted below, the procedures, instrumentation, and analytical methods employed were the same as employed previously in our laboratories (e.g., Carter et al, 1995b, 1997, and references in Carter, 2000), and as discussed in the previous section. The main difference is that HONO was injected, and that shorter irradiation times were used because of the relatively rapid rate of the HONO photolysis that initiates the reactions.
The HONO was injected by connecting the undiluted output of the HONO generator to the reactant inlet system of the DTC and flushing it into the chamber for as long as required to achieve the desired concentrations. If the same amount of HONO was to be injected into both DTC reactors, the HONO injections were done simultaneously into both reactors, with the air in the reactors being mixed and exchanged using the built-in fans. Once the HONO injection was complete, the two DTC reactors were isolated by closing the valves connecting them and the test VOC injections, if any, were made using the standard procedures employed for our chambers (e.g., Carter et al, 1995, 1997).
Static experiments were also carried out using ~200-liter “pillow bag” reactors constructed of the same type of 2 mil FEP Teflon film as used for the DTC and our other Teflon film chambers. Before each experiment the reactors were flushed with purified air and then connected to the output of the HONO generator adjusted to yield the desired concentration in the reactor. The bag was filled and emptied using the HONO generator output four times. After that the desired amount of VOC was added using the same type of procedures used for large chamber runs, additional pure air was added if needed to fill the reactors, and the contents were mixed by manual agitation of the reactor sides. The reactor was then connected to the sample line for analysis using the NOx and other continuous analysis instruments, and is then disconnected as soon as stable readings are attained. GC analyses are taken to determine the amount of test VOC injected, if applicable. The reactor is then placed inside either the “ETC” chamber enclosure (discussed below) or between the reactors in the DTC, and lights are turned on for the desired amount of time. Usually the irradiation is conducted for about an hour to completely react the HONO. The reactor is then connected to the continuous analyzers and also GC analyses are taken (if applicable) to determine the amount of NO and O3 formed and VOC reacted during the irradiation.

33
ETC Chamber
The ETC chamber enclosure was used to provide the light source for the pillow bag experiments as well as for all the flow experiments discussed below. This consists of a ~4’ x ~4’ x ~8’ metal framework with reflective materials on all sides except one end that is covered with a black cloth, and with banks of blacklights equipped on the two opposing sides. It had no permanent reactor mounted inside during the period of this report. Instead, it was used to provide an irradiated enclosure for the pillow bags or the various flow reactors used in this project.
Stirred Flow Experiments
The first series of direct reactivity experiments were carried out using the stirred flow method, and several different setups and reactors were employed. Representative setups applicable to most of the experiments, showing the two major types of reactors employed, are shown on Figure 8 and Figure 9. Somewhat different setups and reactor configurations were employed in some experiments, but generally the best results were obtained using the setups shown on these two figures.
Most of the first series of stirred flow experiments employed the reactor and setup shown on Figure 8. The reactor consisted of a 50 liter Pyrex carboy located inside a blacklight irradiated ETC chamber enclosure discussed above. Although this is referred to as a “stirred flow” system based on the assumption that the reactor was well mixed during the experiment, no mechanical stirring was used in the carboy during most of the first series of experiments, unless noted otherwise. The gas lines leading into and out of the carboy consisted of a 0.3”, ID PFA Teflon tubing. The flows employed in the three flow regulators in the HONO generator as shown in Figure 6 and Figure 8 were usually 1, 1, and 3 liters/minute, respectively, making the total into the carboy in the absence of injected VOC to be ~5 liters/minute. This total HONO flow was measured accurately using a McMillan mass flow sensor and also verified with DTM-115 Dry Gas meter (Singer American Meter Division) at least once before each experiment started and sometimes verified at the end of experiment, and was used when computing the injection rate and dilution when representing the conditions of the experiment for modeling.
After 5/6/99 some modifications were made to the system to allow for injecting liquid reactants using a syringe pump, as discussed below. The resulting setup is shown on Figure 9 (though the initial setup used the carboy as shown on Figure 8 rather than the flask discussed below.) Flow regulators 1 and 2 were replaced with lower capacity models to operate at 250 ml/minute and a regulator 4 was added to control flow at 500 ml/minute through the heated tubing when liquid tested VOC was injected.
As discussed below, there was a concern that the reactants in the unstirred carboy reactor may not be well mixed in the first series of experiments, and that better results may be obtained if the reactor was mechanically stirred during the experiments. This was attempted by placing a 2” long magnetic stirring rod (with two 2” x 3” pieces of PFA Teflon strips attached to increase the stirring capability) inside the carboy, with an external magnet stirring motor. Several experiments were carried out with this configuration, but because of the convex shape of the bottom inside surface of the carboy, it was difficult to keep the stirring rod rotating consistently for long periods of time. Attempts were made to improve the situation by having the shape of the bottom of the carboy modified at the glass shop, but this resulted in the carboy being broken. Therefore, for later runs the carboy was replaced by a 50-liter Pyrex flask (ACE GLASS Inc) with a round bottom that was better suited for use with a magnetic stirrer. This stirred flask, which is shown on Figure 8, was used for the later series of stirred flow experiments for this program.
A few stirred flow experiments were carried out using a 15-liter cube-shaped “mini-chamber” constructed of 2 mil FEP Teflon film on a rigid framework, with a magnetic stirred on the bottom. The procedures employed were generally the same as employed with the carboy or stirred flask.
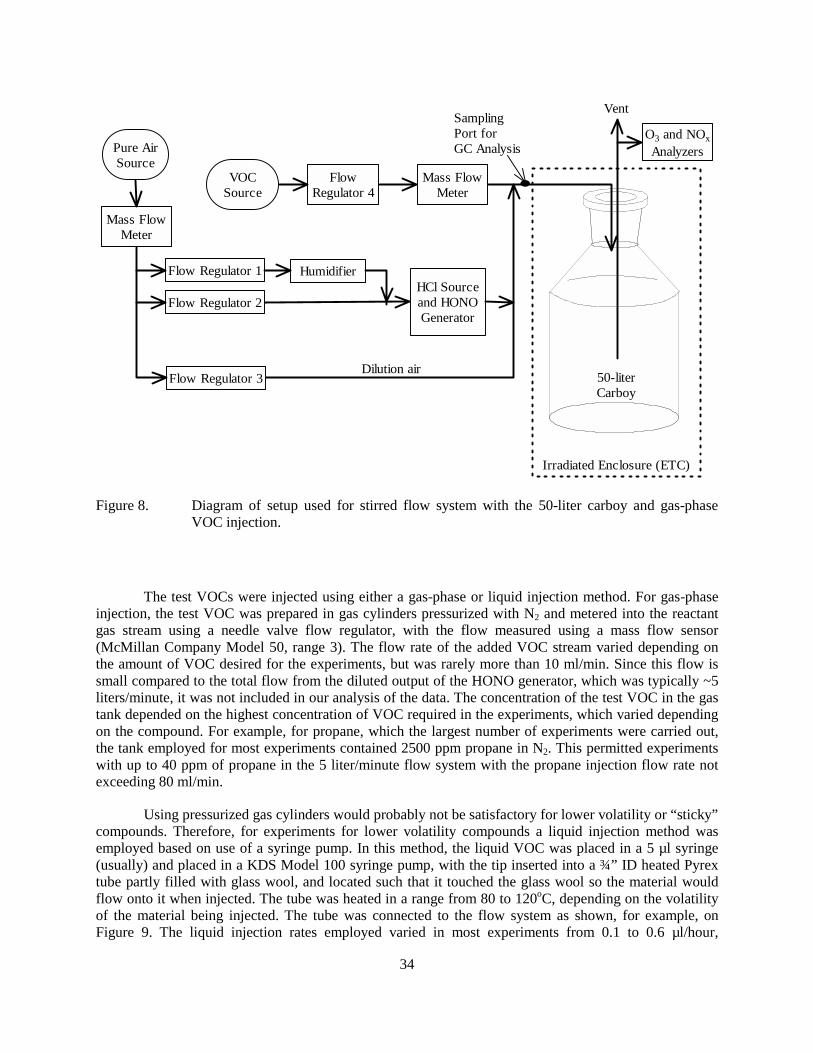
34
Flow Regulator 1
Flow Regulator 2
Flow Regulator 3
Pure AirSource
Dilution air
Mass FlowMeter
HumidifierHCl Sourceand HONOGenerator
VOCSource
FlowRegulator 4
Mass FlowMeter
O3 and NOxAnalyzers
SamplingPort forGC Analysis
Irradiated Enclosure (ETC)
Vent
50-literCarboy
Figure 8. Diagram of setup used for stirred flow system with the 50-liter carboy and gas-phase VOC injection.
The test VOCs were injected using either a gas-phase or liquid injection method. For gas-phase injection, the test VOC was prepared in gas cylinders pressurized with N2 and metered into the reactant gas stream using a needle valve flow regulator, with the flow measured using a mass flow sensor (McMillan Company Model 50, range 3). The flow rate of the added VOC stream varied depending on the amount of VOC desired for the experiments, but was rarely more than 10 ml/min. Since this flow is small compared to the total flow from the diluted output of the HONO generator, which was typically ~5 liters/minute, it was not included in our analysis of the data. The concentration of the test VOC in the gas tank depended on the highest concentration of VOC required in the experiments, which varied depending on the compound. For example, for propane, which the largest number of experiments were carried out, the tank employed for most experiments contained 2500 ppm propane in N2. This permitted experiments with up to 40 ppm of propane in the 5 liter/minute flow system with the propane injection flow rate not exceeding 80 ml/min.
Using pressurized gas cylinders would probably not be satisfactory for lower volatility or “sticky” compounds. Therefore, for experiments for lower volatility compounds a liquid injection method was employed based on use of a syringe pump. In this method, the liquid VOC was placed in a 5 µl syringe (usually) and placed in a KDS Model 100 syringe pump, with the tip inserted into a ¾” ID heated Pyrex tube partly filled with glass wool, and located such that it touched the glass wool so the material would flow onto it when injected. The tube was heated in a range from 80 to 120oC, depending on the volatility of the material being injected. The tube was connected to the flow system as shown, for example, on Figure 9. The liquid injection rates employed varied in most experiments from 0.1 to 0.6 µl/hour,

35
Pure AirSource
Mass FlowMeter
HCl Sourceand HONOGenerator
SyringePump
Flow Regulator 4 Heated Tubing
SamplingPort forGC Analysis
Flow Regulator 1
Flow Regulator 2
HumidifierIrradiated Enclosure (ETC)
50-LiterFlask
Reactor
StirringBar
StirringMotor
VOCSource
FlowRegulator 4
Mass FlowMeter
Flow Regulator 3 Dilution air
O3 and NOxAnalyzers
Vent
Figure 9. Diagram of revised setup used for either gas-phase or liquid phase VOC injection, showing the 50-liter stirred flask reactor employed in later stirred flow experiments for this project.
depending on the desired amount to be used in the reaction. The gas flow rates through the liquid injector was usually about 0.5 liters/min in the first series of carboy experiments, and kept as 0.5 liters/minute in the later experiments using the stirred flask. The success of this method in reliably and consistently injecting the desired amount of liquid VOCs was variable, as discussed below.
The experimental procedures employed for the stirred flow experiments were generally as follows. The HONO reactor was generally running continuously when experiments were carried out, and the reactor was flushed with zero air before each experiment. Before the experiment the gas analyzers were zeroed and span checked using a calibration system. The flows through the HONO generator and the total flows into the carboy or flask were measured using a dry gas meter. The analyzers were then attached to the output of the reactor and their measurements recorded until stable readings were obtained. Then the lights were turned on and the NOx and O3 analyzer measurements were recorded until stable readings were obtained. The test VOC injection was then begun either by turning on the gas flow (and recording the output of the associated mass flow meter) or by starting the syringe pump. NOx and O3 measurements were recorded and GC samples taken until stable readings were obtained. Once stable readings were obtained, the results were used as the measured of ([O3]-[NO])HONO+VOC for the measured

36
level of VOC injected. If time permitted the amount of VOC injected was modified by changing the gas or liquid flow rate and measurements were taken for the different VOC concentration once the data stabilized. Then the VOC flow was turned off and data recorded until stable NOx and O3 readings were once again attained. The NOx and O3 data during the irradiation before and after the VOC was injected were used to derive the ([O3]-[NO])HONO data for the purpose of deriving ∆([O3]-[NO])VOC according to Equation (IV). The lights are then turned off and data collection continued until stable readings were obtained. The reactor was then flushed with zero air overnight.
As discussed below, the light intensity in the enclosure and the carboy was measured using NO2 actinometry and found to correspond to an NO2 photolysis rate of ~1.08 min-1. The temperature during irradiations was not controlled, but was typically in the 27 - 32oC range.
PFA Tube Plug Flow Experiments
The first series of plug flow experiments was carried out using the experimental setup shown in Figure 10. The reactor consisted of a coil of 29 meter 0.3” ID PFA Teflon tubing that was located inside the same blacklight-irradiated enclosure as used for the stirred flow experiments. The volume of the irradiated portion of the reaction tube was calculated to be 1.31 liters. Because of the low volume of the reactor it was determined that the most sensitive measurements to added VOC effects would be obtained if lower flow rates and higher HONO concentrations were employed than was the case for the stirred flow runs. In particular, the flows through the reactor were decreased to ~ 1 liter/minute, and the HONO levels were increased to over 3 ppm. To achieve this, a somewhat different plumbing arrangement was employed, as shown on the figure. To achieve the lower flow rates and higher HONO concentrations in the photochemical reactor, no excess dilution flow was used prior to the inlet of the reactor. However, the NOx analyzers we employed to measure the HONO and NO levels do not operate properly at levels above ~ 1 ppm, so the excess dilution flow of ~4 liters/minute was used to dilute the output of the photochemical reactor before reaching the analyzers. The readings of the analyzers were then multiplied by the dilution factor given by the ratio of the measured total flow into the stream sampled by the analyzers to the measured flow exiting the reactors in order to determine the concentrations of NOx, NO, and O3 exiting the photochemical reactor.
As indicated on Figure 10, the plumbing was set up so that the VOC reactants could be injected either in the gas phase from pre-prepared cylinders, or using the syringe pump method. The VOC injection setup and procedures were generally the same as employed for the stirred flow experiments, discussed above.
The procedures employed when conducting these plug flow experiments were similar to those used for the stirred flow experiments, except that measurements could be made with many more VOC concentrations. This is because the plug flow conditions and the much lower residence time in the reactor compared to the stirred flow system resulted in much more rapid stabilization of the measured concentrations after changes were made to the system.
Quartz Tube Plug Flow Experiments
The second series of plug flow experiments was carried out using the experimental setup shown on Figure 11. The main difference was that a shorter, wider, and lower volume reactor was employed in order to minimize surface effects by reducing both the surface/volume ratio and also the residence time. The reactor consisted of a 86 cm long x 1.8 cm ID quartz tube with a measured volume of 0.283 liters. As with the first series, the main dilution flow was added after the reactor in order to permit experiments with higher HONO concentrations and lower reactor flow rates than otherwise would be possible. The other major change that was made was that slightly modified heated tube using for the liquid VOC injection

37
Flow Regulator 3
Pure AirSource
Dilution air
Mass FlowMeter
HCl Sourceand HONOGenerator
SyringePump
O3 and NOxAnalyzers
Irradiated Enclosure (ETC)
Flow Regulator 4Heated Tubing
SamplingPort forGC Analysis
29 Meterx 0.3" IDPFA TeflonTubing
Flow Regulator 1
Flow Regulator 2
Humidifier
Gas VOCSource
FlowRegulator
Mass FlowMeter
Vent Figure 10. Diagram of revised setup used for first series of plug flow experiments.
was flushed with the output of the HONO generator rather than using a separate dilution flow. Passing the HONO through the heated, glass-wool-filled tube was found not to significantly affect the HONO levels as determined by total NOx measurements or the extent of HONO decomposition as indicated by the measured NO. However, it took a while for the HONO and NO levels to stabilize whenever the heating of the tubing was turned on or off or otherwise changed. This was not a problem because the HONO levels and the temperature were kept constant throughout any given experiment.
Except as indicated, the procedures employed in the second series of plug flow experiments were similar to those employed in the first series of such runs. After 3/23/01 the line used to feed the VOC gas tank used for the gas-phase injection was flushed with pure air overnight minimize contamination of the flow regulator and flow meter from previous experiments. In addition, the light was turned off in the middle of the experiment in order to obtain data on changes in dark NO concentrations more frequently than just at the beginning and end of the run. Starting 4/17/01, in most experiments where VOCs other than propane were employed, the experiments included turning off the injections of the test compound and then making injections of 6 and 40 ppm of propane. This was done for control purposes and to obtain more information on reproducibility of two standard propane - HONO experiments under the same conditions of the experiments with the other test VOCs.

38
Flow Regulator 3
Pure AirSource
Dilution air
Mass FlowMeter
HCl Sourceand HONOGenerator
SyringePump
Heated Tubing
SamplingPort forGC Analysis
Flow Regulator 1
Flow Regulator 2
Humidifier
IrradiatedEnclosure
(ETC)
QuartzTube
Reactor
VOC GasSource
FlowRegulator
Mass FlowMeter
O3 and NOxAnalyzers
Vent
Figure 11. Diagram of setup used for quartz tube reactor plug flow experiments with liquid or gas-phase VOC injection.
Analytical Methods
The following continuous analytical instrumentation was used for most of the HONO - VOC experiments discussed in this section. Ozone was monitored using a Dasibi 1003-AH UV photometric ozone analyzer. NO and species converted to NO using heated Molybdenum catalysts (e.g., HONO and NO2) were monitored using a Teco model 42 chemiluminescent NO - NOx analyzer fitted with a NaCl filter to remove interferences from HNO3. CO was analyzed using a Dasibi Model 3003 CO analyzer.
VOC reactants were monitored by gas chromatography with FID detection. Samples were taken for GC analysis from the flow systems at the locations indicated on the figures or from the chambers or reactors used in the static experiments and injected into the GC instruments for analysis. Relatively low volatility compounds such as n-decane or higher were collected by passing 100 cc of the air sample through Tenax-GC solid adsorbent cartridges that were then placed in series with the GC column and heated to 300oC for cryofocused injection onto the column. The other compounds were sampled using 100 ml gas-tight all glass syringes to transfer to a sample loop in series with the column that was then used for cryofocused injection. The sampling method employed for injecting the sample onto the GC column depended on the volatility of the tested compound. The gaseous compounds such as ethane, ethylene, propane, n-butane and etc. were monitored by Hewlett-Packard 5890 Series II GC with an FID detector maintain at 250 C and equipped with 30 m x 0.53 mm GS-Alumina column. The liquid compounds such as n-alkanes up to n-decane, some aromatic compounds were analyzed by using the 30

39
m x 0.53 mm megabore DB-5 column located at the same GC. For the acetone analyses another HP 5890 GC with the 30 m x 0.53 mm megabore porous divinylbenzene polymer GSQ column was used. The low volatility compounds were monitored on a modified HP 5890 Series II GC using the Tenax cartridges system and fitted with a30 m x 0.53 mm DB-1701 column.
The continuous analyzers were maintained and calibrated using the standard procedures employed in our laboratories for analyses for environmental chamber experiments (e.g., see Carter et al, 1995b).
Pure Air Source
The same AADCO air purification system used for reactivity chamber experiments discussed in the previous section was used for the HONO + VOC experiments discussed in this section. Prior to 3/27/01 this system did not completely remove CO from the matrix air, and typically ~2 ppm was in the input air. After 3/27/01 a Hopcalite cartridge was used to remove this CO from the input air, and subsequently the CO levels in the experiments were below the detection level of our CO analyzer. This resulted in a measurable decrease in the NO levels observed in the HONO - air indicating that the background CO was having an effect on the experiment.
Initial Development of a Total Carbon Analysis Method
Initial work was carried out as part of this project toward development of a total carbon analysis method that can be used to determine the total amount of VOCs injected into the HONO flow experiments discussed above. The approach involves converting the injected VOCs to CO2 using a catalytic combustor, and then monitoring the CO2 so produced using a high sensitivity CO2 monitor. CO2-free purified air is used to provide input to the HONO system, dilution air and VOC injection to reduce the CO2 background so the CO2 from the combusted VOCs can be detected. An API Ultra Model 360 high sensitivity CO2 analyzer was acquired for this purpose, using funds from a gift from the American Chemistry Council. Initial tests using this system with a heated catalytic combustor taken from a Byron total carbon analyzer with methane, propane, and other VOCs in commercially-available CO2 free air indicate that the method should have sufficient sensitivity and accuracy for this purpose. However, there was insufficient time in this project to successfully integrate this with a HONO reaction system, and no useful results are available to report at this time. Work is continuing as part of a newly initiated project for the CARB (Carter, 2002), and more details concerning the development of this method and the evaluation results will be given in a subsequent report for that project.
Modeling Methods and Reactor Characterization
Chemical Mechanism
As with the simulations discussed in the previous section, all the model simulations discussed in this section were carried out using the SAPRC-99 mechanism as documented by Carter (2000). All the test VOCs were represented explicitly, and no adjustments were made to the mechanism to improve or modify the results of the model simulations discussed in this section.
Light Characterization
DTC Experiments. As discussed above in conjunction with the characterization of the surrogate evaluation experiments, he light intensity in the DTC chamber was monitored by periodic NO2 actinometry experiments utilizing the quartz tube method of Zafonte et al (1977), and the results were tracked over time to determine the most appropriate values to use when modeling particular runs. The

40
static HONO and HONO + VOC experiments in the DTC were carried out around the same general period as the surrogate evaluation experiments, and as with those runs the light intensity was assumed to decrease linearly with time. The first DTC experiment discussed in this section is run DTC-685 and the last such experiment is DTC-722, for which NO2 photolysis rates of respectively 0.166 and 0.155 min-1 were assigned. The general blacklight spectrum given by Carter et al (1995) was used to compute the rates for the other photolysis reactions.
ETC Chamber Enclosure. The light intensity in the ETC chamber enclosure used for the static pillow bag and all the flow experiments was determined by conducting NO2 actinometry experiments using the quartz tube method of Zafonte et al (1977), modified as discussed by Carter et al (1995). The experiments and their results are given in the chronological run summary in the first part of the Results section, below. The results of the experiments carried out during this period yielded an average NO2 photolysis rate of 1.08±0.09 min-1. The spectral distribution was measured using the LiCor LI-1800 spectroradiometer, and the results indicated that use of the standard blacklight spectrum derived by Carter et al (1995) is applicable to this enclosure. This was used when modeling the experiments carried out in this enclosure, except as indicated below.
Carboy. Although the carboy reactor was located inside the same ETC chamber enclosure, discussed above, there was concern that the relatively thick glass walls may affect the intensity and spectrum inside the reactor. To assess the effects of the walls on intensity, a smaller quartz flow tube was constructed so it could fit inside the carboy, and it was used to measure the NO2 photolysis rate using the quartz tube method (Zafonte et al, 1977, Carter et al, 1995). That experiment also gave an NO2 photolysis rate of 1.08 min-1, indicating the carboy walls do not have a significant effect on the intensity. This is consistent with the analysis of Zafonte et al (1977), which indicates that the reduction in intensity caused by the light reflecting off the outside of a tube is compensated for by the light reflecting off the inside.
However, the relatively thick walls of the carboy may have non-negligible absorption of the lower wavelengths, and thus affect the relative spectrum of the light. This may not significantly affect the NO2 photolysis rate because it is generally affected by longer wavelengths, but may affect photolysis of species, such as aldehydes and O3, more affected by the near UV. This was assessed by comparing the spectral distribution of a blacklight light source with the spectral distribution of the same light source after passing through the two walls of the carboy (see Figure 12). This approach had to be used because it was not possible to place the spectrometer inside the carboy. The ratio of the spectra obtained, normalized to give unity at wavelengths above ~420 nm, is shown on Figure 12.
It can be seen from Figure 12 that the walls have a measurable effect on the transmission at wavelengths less than ~420 nm, and this needs to be taken into account when computing photolysis rates. Since the measured effect is based on the light passing through two walls, the light passing through one wall is assumed to square root of that, which is indicated by the estimated one-wall transmission line shown on the figure. The spectral distribution used for modeling photolysis reactions inside the carboy was then obtained by multiplying this estimated one-wall transmission spectrum by the standard relative blacklight spectral distribution derived by Carter et al (1995).
PFA Teflon Tube Reactor. The PFA Teflon tube plug flow reactor used during the first series of plug flow experiments was also located inside the ETC enclosure. Because only a limited number of experiments were conducted using this method since it was eventually determined not to be satisfactory (see below), no separate actinometry or other light characterization experiments were done for this configuration. For the modeling discussed in this report, we assumed that the light intensity inside the tube was the same as inside the enclosure, i.e., an NO2 photolysis rate of 1.08 min-1 was used. The effect of the Teflon walls on the spectral distribution was assumed to be negligible, i.e., the blacklight spectrum of Carter et al. (1995) was used. It may be that using a UV-suppressed spectrum such as derived for the

41
0.0
0.5
1.0
1.5
0.300 0.400 0.500 0.600 0.700 0.800
Wavelength (nm)
Tran
smis
sion
Thr
ough
Car
boy
0.0
0.5
1.0
1.5
Rel
ativ
e qu
antu
m in
tens
ity
Measured TransmissionThrough Two Walls
Estimated TransmissionThrough One Wall
Blacklight SpectralDisbribution
Carboy
Irradiated Enclosure
SpectrometerSensorHead
Lights
Figure 12. Measurement of effect of carboy walls on blacklight spectral distribution.
Carboy may be more appropriate, but the results of the model simulations of the alkane test compounds that were studied using this reactor were found not to be sensitive to differences in the spectrum in this regard. This is because the reaction is driven primarily by photolysis of HONO, which responds to essentially the same general spectral region as the photolysis of NO2 (Carter, 2000, and references therein.)
Quartz Tube Reactor. The quartz tube reactor employed for most of the plug flow experiments in this study was also located inside the ETC chamber enclosure, though it was closer to the black-cloth-covered end of the enclosure than the other reactors because of the way it was configured. This means that the light intensity may be somewhat lower than was the case for the other reactors, which were located near the center of the enclosure. Since the quartz tube reactor is the same as employed for quartz tube NO2 actinometry experiments, the same tube was simply used for conducting the actinometry experiment while it was in the same location. Various actinometry experiments were conducted in this reactor, and the results indicated an average NO2 photolysis rate of 0.59±0.03 min-1. This was used when modeling the experiments in this reactor. The quartz tube was assumed not to affect the spectrum inside the reactor, so the standard blacklight spectrum of Carter et al (1995) was used when modeling these experiments. This is a reasonable assumption because the UV cutoff wavelength of quartz is much lower than the lowest wavelength output by the blacklights.
Chamber Wall Effects Model
The results of the HONO experiments are not expected to be highly sensitive to chamber wall effects because of the large radical and NOx source provided by the HONO itself, combined with the relatively short residence time of the reactants in the chamber. This was verified by conducting sensitivity calculations where, for example, the chamber radical source rate or the O3 wall loss rate was increased by more than an order of magnitude, and relatively little effects on the results were observed. Therefore, except as noted the standard chamber characterization model as used when modeling the DTC and other blacklight chamber experiments was used when modeling these runs. The one exception was the chamber
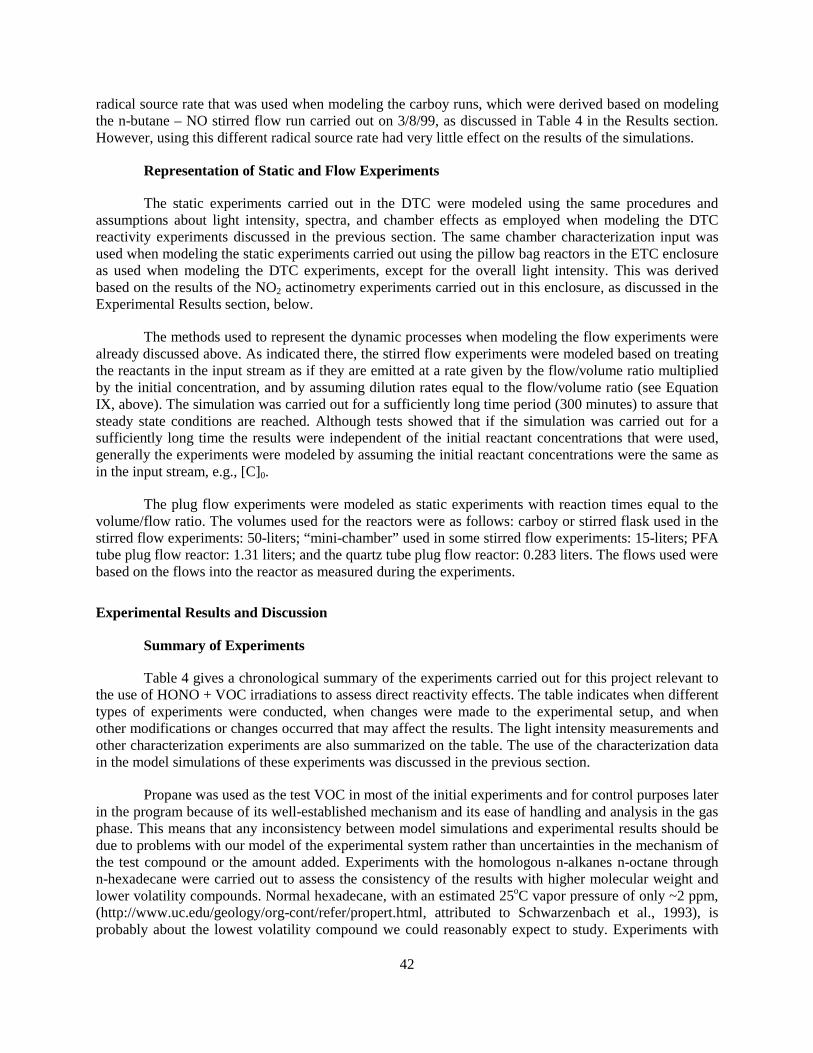
42
radical source rate that was used when modeling the carboy runs, which were derived based on modeling the n-butane – NO stirred flow run carried out on 3/8/99, as discussed in Table 4 in the Results section. However, using this different radical source rate had very little effect on the results of the simulations.
Representation of Static and Flow Experiments
The static experiments carried out in the DTC were modeled using the same procedures and assumptions about light intensity, spectra, and chamber effects as employed when modeling the DTC reactivity experiments discussed in the previous section. The same chamber characterization input was used when modeling the static experiments carried out using the pillow bag reactors in the ETC enclosure as used when modeling the DTC experiments, except for the overall light intensity. This was derived based on the results of the NO2 actinometry experiments carried out in this enclosure, as discussed in the Experimental Results section, below.
The methods used to represent the dynamic processes when modeling the flow experiments were already discussed above. As indicated there, the stirred flow experiments were modeled based on treating the reactants in the input stream as if they are emitted at a rate given by the flow/volume ratio multiplied by the initial concentration, and by assuming dilution rates equal to the flow/volume ratio (see Equation IX, above). The simulation was carried out for a sufficiently long time period (300 minutes) to assure that steady state conditions are reached. Although tests showed that if the simulation was carried out for a sufficiently long time the results were independent of the initial reactant concentrations that were used, generally the experiments were modeled by assuming the initial reactant concentrations were the same as in the input stream, e.g., [C]0.
The plug flow experiments were modeled as static experiments with reaction times equal to the volume/flow ratio. The volumes used for the reactors were as follows: carboy or stirred flask used in the stirred flow experiments: 50-liters; “mini-chamber” used in some stirred flow experiments: 15-liters; PFA tube plug flow reactor: 1.31 liters; and the quartz tube plug flow reactor: 0.283 liters. The flows used were based on the flows into the reactor as measured during the experiments.
Experimental Results and Discussion
Summary of Experiments
Table 4 gives a chronological summary of the experiments carried out for this project relevant to the use of HONO + VOC irradiations to assess direct reactivity effects. The table indicates when different types of experiments were conducted, when changes were made to the experimental setup, and when other modifications or changes occurred that may affect the results. The light intensity measurements and other characterization experiments are also summarized on the table. The use of the characterization data in the model simulations of these experiments was discussed in the previous section.
Propane was used as the test VOC in most of the initial experiments and for control purposes later in the program because of its well-established mechanism and its ease of handling and analysis in the gas phase. This means that any inconsistency between model simulations and experimental results should be due to problems with our model of the experimental system rather than uncertainties in the mechanism of the test compound or the amount added. Experiments with the homologous n-alkanes n-octane through n-hexadecane were carried out to assess the consistency of the results with higher molecular weight and lower volatility compounds. Normal hexadecane, with an estimated 25oC vapor pressure of only ~2 ppm, (http://www.uc.edu/geology/org-cont/refer/propert.html, attributed to Schwarzenbach et al., 1993), is probably about the lowest volatility compound we could reasonably expect to study. Experiments with

43
Table 4. Chronological summary of the experiments carried out for this project relevant to the assessment of direct reactivity effects.
Date Run [a] Experiment, Operation, or Modification
6/15/98 Light intensity inside the carboy measured using the quartz tube method using a specially designed tube that fit inside the carboy. The NO2 photolysis rate was measured to be 1.08 min-1, which was essentially the same as measured inside the enclosure without the carboy.
6/18/98 The light intensity inside the ETC chamber enclosure used for the flow and pillow bag experiments was measured using the quartz tube method. The NO2 photolysis rate was measured in two experiments to be 1.03 and 1.08 min-1
6/29/98 – 7/16/98
Stirred Flow
(Carboy)
First stirred flow experiment using HONO generator with the 50 liter carboy as the reactor. Plumbing approximately as shown on Figure 8. Flows and HONO output as shown on Table 5. Results of experiments are summarized on Table 8. The initial experiments used propane as the test compound.
7/20/98 7/21/98 7/31/98
DTC685 DTC686 DTC690
Static HONO and HONO + propane photolysis experiments in the DTC. HONO injected onto both sides, and HONO injected into one side, and irradiated for about an hour. Conditions and results summarized on Table 7.
10/22/98 DTC713 Static HONO and HONO + n-octane experiment in the DTC. Similar procedures as previous experiments. Conditions and results summarized on Table 7.
10/30/98 11/3/98
ETC549 ETC550
Static HONO photolysis experiment. ~ 200 L “pillow bag” used. Filled with ~0.4 ppm HONO and irradiated for 60 minutes. Conditions and results summarized on Table 7.
11/3/98 ETC551 Static HONO + propane photolysis experiment. Same pillow bag reactor used as previous runs. Conditions and results summarized on Table 7.
11/6/98 DTC721 DTC722
Static HONO irradiation followed by static HONO + propane irradiation in one of the ~6000-liter DTC reactors. Conditions and results summarized on Table 7.
11/14/98 The light intensity inside the ETC chamber enclosure used for the flow and pillow bag experiments was measured using the quartz tube method. The NO2 photolysis rate was measured to be 1.01 min-1
12/10/98 Attempted to use HONO as an OH source in a kinetic experiment for another project that involved injecting ~0.5 ppm of HONO into a ~6000-liter reactor and irradiating it in the presence NO and various VOCs and NO. The kinetic results indicated that a chlorine atom source was probably present.
1/29/99 ETC556 Static HONO + propane experiment followed by a static HONO + n-octane photolysis experiment. Same pillow bag reactor as ETC runs listed above. Conditions and results summarized on Table 7.
1/29/99 – 2/2/99
Samples were bubbled for 2 hr at 1 l pm through ~10 ml of HPLC grade water for chloride analysis. Flows and HONO levels shown on Table 5, and other conditions and results are given on Table 6. No evidence for chloride contamination was found.
3/3/99 – 4/6/99
Resume Stirred Flow
(Carboy)
Begin second series of stirred flow experiments with the 50 liter carboy as the reactor. Plumbing approximately as shown on Figure 8. Flows and HONO output as shown on Table 5. Results of experiments are summarized on Table 8. Experiments were carried out on n-butane, n-hexane, n-octane, CO and acetone, as well as propane.

Table 4 (continued)
44
Date Run [a] Experiment, Operation, or Modification
3/5/99 Rubber stopper on carboy covered with the Teflon film. Previously the reactants were exposed to the rubber.
3/8/99 A special n-butane - NOx irradiation was carried out to obtain an estimate of the chamber radical source rate for the carboy reactor used in the HONO experiments. This stirred flow experiment was carried out in the carboy using the same 5 liter min-1 flow rate and ~25% RH purified air as used for the HONO + VOC runs, except that in this case the initial reactants were 0.11 ppm NO + 11 ppm n-butane. The results were best fit by model simulations assuming a radical source rate / NO2 photolysis rate ratio of 1.5 ppb. This was used in the model simulations of all the carboy experiments discussed in this report.
3/11/99 Valve to take GC sample was installed on the line before the carboy as shown on Figure 8.
3/15/99 The HONO source was tested by using various filters on the input to the NO - NOxanalyzer. After a Na2CO3 filter was installed, which is expected to remove primarily HONO, the “NOx” reading dropped from 660 to 18 ppb. When a NaCl filter, which is expected to remove primarily HNO3, the “NOx” reading changed from 660 to 645 ppb.
4/3/99 Flows changed for HONO generator and reactor. Injection tube with glass wool and syringe pump installed for syringe pump injections. Some changes to plumbing made to accommodate syringe pump injections, as indicated on Figure 9.
4/7/99 – 4/14/99
First stirred flow experiment with syringe pump injection. Syringe pump injection experiments were carried out using n-octane (for comparison with gas-phase injection experiments with the same compound), and n-dodecane.
4/27/99 First experiments with mechanical stirring in carboy. Several experiments with propane were conducted.
5/6/99 – 5/28/99
Start Plug
Flow #1 (PFA)
Reactor changed to coiled PFA tubing, plumbing changed as shown on Figure 10, and first series of plug flow experiments began. Experiments were carried out on propane, n-octane, n-decane, n-dodecane, n-tridecane, and n-hexadecane. Syringe pump injection was used for compounds heavier than n-octane.
5/10/99 Some rotameters replaced and valve added to take GC samples, (see Figure 10 for location).
5/17/99 HONO reactor cleaned and flows and HONO generator oven adjusted. 5/28/99 Last experiment in first plug flow series.
6/24/99 – 7/14/99
Stirred Flow
(Mini-Cham.)
Resumed stirred flow experiments using 24.5 x 24.5 x 25 cm “mini-chamber” constructed of FEP Teflon film as the reactor. A few propane experiments were conducted using this reactor.
6/29/99 Stirred Flow
(Carboy)
Resumed using the carboy as the stirred flow reactor. Experiment with propane conducted. Although mechanical stirring was attempted, the stirrer failed in the experiment on this date.
7/17/99 – 7/23/99
Stirred Flow
(Stirred Flask)
Acquired 50 liter Pyrex flask from Ace Glass, and used it to replace the carboy as the reactor in the stirred flow experiments. Mechanical stirring employed. Experiments with propane, n-octane, n-decane, and n-dodecane conducted.

Table 4 (continued)
45
Date Run [a] Experiment, Operation, or Modification
7/23/99 Some changes made to VOC injection system to reduce line length. HONO system not used for several months after this experiment.
3/18/00 – 4/14/00
Stirred Flow
(Stirred Flask)
Resumed stirred flow experiments using the mechanically stirred 50-liter flask. Experiments conducted with propane, n-octane, and n-decane.
3/24/00 HONO reactor cleaned after excessive levels of NO reached in previous experiments.
4/14/00 Last stirred flow experiment discussed in this report carried out. 4/27/00 Sample were bubbled for 1 hr at 1 l pm through ~13 ml of HPLC grade water for
chloride analysis. Flows and HONO levels shown on Table 5, and other conditions and results are given on Table 6. No evidence for chloride contamination was found.
9/8/00 – 9/29/00
Start Plug
Flow #2 (Quartz Tube)
Set up system for second series of plug flow experiments. 8.6 cm long x 1.8 cm ID quartz tube used as the reactor. Several plumbing and VOC injection configurations were investigated until eventually settling on configuration shown on Figure 11. Although several trial experiments with propane were conducted during this period, the first experiment whose data are used in this report was carried out on 9/26. Experiments were conducted with propane, n-octane, n-decane, n-dodecane, and n-hexadecane.
10/18/00 The tube for liquid injections using the syringe pump was replaced using a somewhat different design. However, the general configuration was still as shown on Figure 11. Experiments were conducted with n-tridecane and n-pentadecane.
10/19/00 Last plug flow experiment in this series for several months. 11/1/00 The light intensity in the plug flow quartz tube was measured using the quartz tube
method using the same reactor. The NO2 photolysis rate was measured to be 0.59 min-1, which is significantly lower than measured previously in this enclosure. This may be due to the location of the tube, which was located near an outer corner of the reactor, with a black cloth covering the opening to the laboratory.
12/00 – 2/01
Initial testing of total carbon analysis methods for determining amount of VOC added in flow experiments. Initial tests evaluated use of a modified Byron Model 301 methane/total hydrocarbon analyzer. It was eventually concluded that this would not be satisfactory for this application. [b]
2/22/01 – 10/16/01
Resume Plug
Flow #2 (Quartz Tube)
Resumed plug flow experiments with the quartz tube reactor, using same setup and procedures as previously. Experiments were conducted using propane, ethane, n-hexane, n-octane, CO, 2,2,4-trimethylpentane, ethyl acetate, propene, benzene, toluene, and 1,3,5-trimethylbenzene, all using gas-phase injection. Syringe pump injection experiments were conducted using n-decane and n-pentadecane early in this period, but during most of this period the syringe pump did not perform satisfactorily.
3/20/01 Different bottle of NaNO2 used to synthesize HONO. Not “super free-flowing” type that is preferred for this purpose.
3/23/01 Began including standard propane injections for control and reproducibility checking purposes as part of the standard procedure for the experiments.

Table 4 (continued)
46
Date Run [a] Experiment, Operation, or Modification
3/27/01 Hopcalite filter added to pure air system to remove CO. Some change to the results of the HONO irradiation experiments seen (see text).
4/27/01 The light intensity in the plug flow quartz tube was measured using the quartz tube method using the same reactor. The NO2 photolysis rate was measured to be 0.54 min-1. This is somewhat outside the range of the other actinometry measurements carried out before and after this run, and was not used when computing the average NO2 photolysis rate used for modeling.
5/4/01 Started using “super free-flowing” NaNO2 in the HONO generator again. 5/01 Initial testing for developing a total carbon analysis method based on use of a high
sensitivity CO2 analyzer that was on loan from the manufacturer. The instrument appeared to be suitable for this purpose and was ordered for further research, using funds from “various donor” accounts. [b]
6/27/01 7/13/01
The light intensity in the plug flow quartz tube was measured using the quartz tube method using the same reactor. The NO2 photolysis rate was measured to be 0.57 min-1 on 6/27 and 0.59 min-1 on 7/13.
10/5/01 – date of report
The high sensitivity CO2 analyzer was received and testing on its suitability for a total carbon analysis system for flow-based direct reactivity measurements began. [b]
10/16/01 Last HONO experiment whose data are discussed in this report was carried out. Work continued on developing total carbon analysis method to interface to the HONO + VOC plug flow system.
[a] Chamber run designation are shown for the static experiments discussed in this report. For flow experiments, the general type of run is indicated.
[b] Although development of total carbon analysis methods for use with direct reactivity measurement systems began during this project, the major work is being carried out as part of a subsequent CARB project. A discussion of this preliminary work is beyond the scope of the present report.
CO, acetone, and a number of other compounds were also carried out obtain direct reactivity data for other types of compounds.
As indicted on the table, the first sets of experiments were the stirred flow propane experiments using the 50-liter carboy, and also a limited number of static experiments with propane and n-octane. Additional stirred flow experiments with the carboy were subsequently carried out on higher n-alkanes and also CO and acetone. CO was studied to obtain data for a compound with a different number of NO to NO2 conversions than is the case for alkanes, and acetone was studied to obtain data on a compound with an entirely different type of mechanism. As discussed below, although the model was able to simulate the effects of small amounts of added VOCs for most of the compounds, it had a consistent bias in overpredicting the effects of additions of large amounts of VOCs.
The static experiments were conducted to provided additional tests of our ability to model the HONO and HONO + VOC systems, and to assess the extent to which the model performance biases observed when modeling the carboy experiments was due to problems with or with the way the model was representing the dynamics of the stirred flow experiment. Although the model performance in simulating the static experiments was variable, the results did not indicate any consistent biases in the

47
gas-phase mechanism. This suggested that the model biases in simulating the high added VOC experiments might be due to problems representing the conditions of the flow experiments.
Attempts were made to assess whether mechanical stirring would affect the results, as may be the case if stirred flow approximation were not valid for the unstirred carboy experiments. The initial results did not indicate an obvious effect of stirring, but the results were somewhat inconclusive because of problems with mechanically stirring the carboy.
Because of problems with modeling the stirred flow experiments, a series of experiments with propane and the higher n-alkanes were carried out using a plug flow system based on use of a coiled PFA Teflon tube as the reactor. Although we expected that surface absorption on the long reactor could be a problem with low volatility compounds, it was hoped that eventually there would be an equilibrium between the absorbed and offgasing material so the net effect on the reacting VOC concentrations would be small. The results indicated significantly improved model performance in simulating the experiments using propane, and because of the faster response times to changes on propane concentrations, relatively large amounts of data could be obtained in relatively short amounts of time. However, this system did not perform satisfactory with the higher n-alkanes, particularly n-dodecane and above. The data indicated that wall effects were probably biasing the results.
We resumed work on the stirred flow method because of its potentially greater suitability for low volatility compounds, and because we had not completely evaluated the possibility that mechanical stirring may yield results that were more consistent with model predictions. The problem of mechanical stirring was addressed by replacing the carboy with a rounded flask of the same volume, which was better suited to use with the magnetic stirring system that was employed. However, the results did not indicate that mechanical stirring gave significant improvements with model performance; indeed, the performance of the model in simulating the data and the reproducibility of the results was worse than experienced with the unstirred carboy.
The encouraging results of the first series of plug flow experiments at least for high volatility compounds, together with the unresolved problems we had in modeling the stirred flow experiments, let us to devote the remainder of the project to improving the plug flow method. The long PFA tube reactor was replaced with a shorter and wider quartz tube with a much lower surface/volume ratio residence time, in order to reduce wall absorption effects. This system performed quite well in experiments with low volatility compounds and even obtained what appeared to be good data in some experiments with the high molecular weight n-alkanes up to n-hexadecane. Experiments were carried out on the homologous n-alkanes from propane through n-hexadecane, on a representative highly branched alkane (2,2,4-trimethylpentane), CO, methyl ethyl ketone, ethyl acetate, and several aromatics. Encouraging results were obtained in at least some experiments with the high molecular weight n-alkanes up to n-hexadecane, with the results of most of these n-alkane experiments being reasonably consistent with model predictions. Interesting and potentially useful data for mechanism evaluation were obtained for the other compounds studied. However, problems were encountered with the performance in the syringe pump in consistently and reliably injecting the desired amounts of compound, and early successful experiments on the C10+ n-alkanes could not be successfully reproduced later in the project. The length of time required and imprecision in the GC analysis used for low volatility compounds made work on improving the low volatility VOC injection method difficult and time-consuming.
Efforts was expended during the latter period of this project to improve the performance and reliability of the syringe pump system and to develop a total carbon analysis method that could be used as an alternative to GC analysis for determining the amount of VOC injected. Although some progress was made in developing a total carbon analysis method based on converting the VOCs to CO2 and analyzing the CO2 so produced using a sensitive CO2 analyzer, we were not able to complete this effort within the
48
time available for this project. Additional work on this is continuing as part of a newly funded CARB project (Contract on. 00-333, Carter, 2001). Therefore, the results of this effort will be described in a subsequent report.
Performance of HONO Generator
Table 5 lists the conditions and outputs of the HONO generator as operated for the HONO experiments carried out for this program. Although instrumentation to monitor HONO directly was not available at our laboratory during the period of this project, the as discussed below data obtained indicates that HONO is produced in at least 90% purity from this system as generally operated. Although as shown on the table the output concentration depending on the conditions, typically the undiluted HONO generator output was 3-5 ppm at flow rates of 0.5-1 liter/minute. Generally relatively stable concentrations were obtained once conditions have stabilized after changes to flows and temperatures.
The output of the reactor is generally monitored using a commercial NO/NOx chemiluminescence
analyzer that uses a heated Molybdenum to convert NO2 and other “NOx” species to NO for analysis. Since this converter quantitatively converts HONO to NO (Febo et al, 1995), the HONO reported as “NO2” by the analyzer. Small amounts of NO, typically 3-5% of the total NOx, is observed as an impurity. Small changes to reactor conditions can affect the NO to HONO ratio, and generally adjustments were made to minimize the levels of NO obtained. Although this analysis method gave no way determine which portion of the reported “NO2” was HONO or a NO2 impurity, a few measurements made using a TDLAS or GC luminol instrument in our laboratory (Carter, 2002) indicated that the NO2 levels were generally comparable to the measured levels of NO. This would be expected if the main decomposition mode for the HONO were the reaction
2 HONO → NO + NO2 + H2O
This indicates that most of the reported “NO2” was HONO, and if there are no other significant impurities present then the HONO would be at least 90% pure.
As indicated on Table 4, tests were conducted to using various filters on the input to the NO - NOx analyzer designed to remove HONO or HNO3. After installation of a Na2CO3-coated filter, which should remove both HONO and HNO3 but not NO2 (Ferm et al, 1985) the “NOx” reading dropped from 660 to 18 ppb. This is only ~3% of the total NOx, indicating that NO2 is indeed relatively minor as an impurity. On the other hand, installation of a NaCl-coated filter, which is expected to remove primarily HNO3 (Ferm et al, 1985), the “NOx” reading only dropped by 2%. This indicates that HNO3 is also not a significant impurity, and is consistent with our assessment that the HONO is at least 90% pure.
The possibility of HCl or some other chlorine-containing species being present as an impurity is also a concern, since it may result in chlorine atoms being introduced into the reactivity experiments. This could give an inappropriate direct reactivity measurement because of the rapid rate of reaction of Cl atoms with most VOCs, with the resulting reaction in general having different kinetics and mechanisms than the more atmospherically-relevant reaction with OH. The presence of HCl impurity could give rise to reactive Cl atoms via the following reactions,
OH + HCl → H2O + Cl· HCl + HONO → NOCl + H2O NOCl + hν → NO + Cl·
Evidence for chlorine atom involvement was seen in some chamber experiments when attempts were made to inject relatively large amounts of HONO into DTC chamber for the purpose of conducting

49
Table 5. Summary of flows, HONO reactor temperatures, and HONO and NOx outputs of the HONO generator for the experiments discussed in this report. .
Flows (liter/min) [a] HONO Output [b]
Wet to HONO
(1)
Dry to HONO
(2)
Dilution stream
(3)
VOC Injector
(4)
Flow to
React’r
HONO Rct’r Temp (oC)
Est’d HONO (ppm)
NO (ppb)
Run Type, Dates, and/or comments. [c]
1.5 1.5 4 - 5.8 57 0.78 20 Carboy, 6/98 - 7/98 1 1 3 - 5.0 31 0.67 9 Chlorine analysis, 1/29/99 1 1 3 - 5.0 [d] 0.65 11 Carboy, 3/99 - 4/2/99 1 1 3 - 4.9 [d] 0.61 10 Carboy, 4/3/99 - 4/6/99 1 1 2.5 0.5 4.9 [d] 0.62 11 Carboy, 4/7/99 - 5/5/99 1 1 3 - 5.0 45 0.69 11 Carboy, 5/4/99 - 5/5/99
0.5 0.5 4 [e] - 1.0 47 3.4 200 PFA Tube, 5/6/99 - 5/14/99 0.25 0.25 4 [e] 0.5 1.0 46 3.3 130 PFA Tube, 5/17/99 – 5/28/99 0.25 0.25 3 0.5 4.3 48 0.70 19 Carboy, 6/29/99 0.25 0.25 3.5 0.5 4.3 48 0.78 28 Flask, 7/17/99 - 7/23/99 0.25 0.25 3.5 0.5 4.7 42 0.63 65 Flask, 3/18/00 - 3/20/00 0.25 0.25 4 0.5 4.9 49 0.69 40 Flask, 3/24/00 - 5/28/00 0.25 0.25 4 0.5 4.8 49 0.76 30 Chlorine analysis, 4/27/00 0.25 0.25 4 0.5 4.8 46 0.77 48 Flask, 8/30/00 - 9/7/00 0.25 0.25 3.5 [e] - 0.52 46 3.5 150 Quartz tube, 9/26/00 - 10/19/00 0.25 0.25 4 [e] - 0.50 38 4.2 270 Quartz tube, 2/22/01 - 3/20/01 0.3 0.3 4 [e] - 0.56 40 4.0 190 Quartz tube, 3/27/01 - 10/16/01 [f]0.8 0.8 3 [e] - 1.56 39 1.5 11 Quartz tube, 6/15/01 [g]
0.19 0.19 4 [e] - 0.38 39 5.7 350 Quartz tube, 6/13 - 6/14/01 [g]
[a] Total flows are averages for the experiments carried out during the indicated time period. Component flows are approximate values for the indicated time period. Numbers in parentheses for the component flows refer to the flow regulators as shown on Figure 8 through Figure 11.
[b] Measured or calculated concentrations entering the photochemical reactor. HONO is estimated from the “NOx” and NO readings from the NO - NOx analyzer assuming that only NO, NO2, and HONO are being read on the “NOx” channel and that the initial NO2 is approximately equal to the initial NO. Averages for experiments carried out during the indicated time period are shown.
[c] “Carboy” and “Flask” refer to stirred flow runs using the 50-liter carboy or flask, respectively; “PFA Tube” refers to the first series of plug flow runs carried out using the PFA tubing as the reactor, and “Quartz Tube” refers to the plug flow runs carried out using the quartz tube as the reactor.
[d] This information was not recorded. It is probably about 40-50oC. [e] The dilution flow was added after the stream passed through the reactor, so it is not counted in the
total flow to the experiment since it did not affect the concentrations in the reactor. The concentrations exiting the reactor are calculated from the measured concentrations of the diluted reactants and the ratio of the total flow of the diluted sample to the total flow to the reactor.
[f] Excludes experiments where flow through reactor was varied. [g] Highest and lowest experiments where flow through reactor was varied

50
rate constant measurements, using reactor temperatures and flow rates much higher than employed for the experiments discussed in this report.
To test whether there was significant chlorine output from the reactor in our experiments, two tests were conducted where the reactor output was bubbled through HPLC grade water for chloride ion analysis. Nitrite and (in one set of samples) nitrate ions in the water were also analyzed. Any HCl and HNO3 should be efficiently trapped in the water and detected as chloride or nitrate ions, and at least some of the HONO in the gas should be trapped and detected as nitrite. (The collection efficiency for HCl and HNO3 in water should be high because they are both strong acids. HONO is a weaker acid so its collection efficiency may not be as high.) Two sets of samples were taken, one on 1/29 – 2/2/99 and the other on 4/27/00, and the conditions and results are summarized on Table 6. Additional information about the configuration of the system when these samples were taken is given on Table 4 and Table 5, above.
The results on Table 6 indicate no significant contamination by HCl or other water-soluble chlorine species in the output of the HONO generator, either when the NaNO2 salt was new or after it had been extensively used. Only one sample, which was not reproduced, indicated a chlorine content that is measurably higher than in the blank samples. The two sets of samples were somewhat different in their apparent HONO collection efficiency, the first indicating only about a 40% collection efficiency on the average, and the second indicating that all the HONO was collected as nitrite. The reason for this is not known. The results of the analysis of the first set of samples suggest that ~10% HNO3 may be present in the input stream, which is somewhat higher than indicated by the results of the tests with the NaCl filter, discussed above. However, some of the HONO may be converted to nitrate during the analysis. Nitrate data were not provided for the second set of samples.
Static Experiments
Table 7 lists the static HONO and HONO + VOC experiments that were carried out for this project. The experiments consisted of photolysis of either HONO by itself or the photolysis of HONO in the presence of propane either propane or n-octane for sufficient time for the initial HONO to be completely consumed by photolysis. Experiments with the “A” or “B” suffixes were carried out in the dual DTC chamber, where HONO and HONO + VOC irradiations were carried out simultaneously in the two reactors. The other experiments were pillow bag runs conducted using the either the ETC or the DTC enclosure to provide the irradiation.
As expected, the photolysis of HONO by itself resulted in the formation of NO at levels of 20-50% of the total initial NOx, while the addition of propane or n-octane resulted in a consumption of a portion of the initial VOC and the formation of ozone. Acetone was also measured as a product in the DTC experiments with propane. Figure 13 and Figure 14 give concentration-time plots for selected data in the dual DTC experiments with propane and n-octane, respectively. Note that only initial and final measurements were made in the pillow bag experiments, and the results for O3 and NO are shown on Table 7.
Results of model calculations are also shown on Figure 13 and Figure 14 for the dual DTC experiments, and, for final [O3]-[NO], on Table 7 for all runs. In addition, Figure 15 shows a plot of experimental vs. calculated [O3]-[NO] for all the static experiments.
The model was able to simulate the main features of the experimental data, though some variability in the simulations were observed. The [O3]-[NO] data tended to be somewhat overpredicted in the propane runs and to be underpredicted in the n-octane runs, with the simulations of the HONO only experiments being variable. The model gave fair simulations of the amount of propane or n-octane consumed in the DTC runs, and of the amount of acetone formed in the DTC experiments with propane.

51
Table 6. Summary of results of ion analysis of 1/29/99 aqueous samples of output from HONO generator.
NOx in Gas Sampled (ppb)
HONO Gen’r Conditions [a]
Results as ppb in gas sample analyzed Date Description
NOx-NO NO (oC) (l/min) Cl Nitrites Nitrates
Cl / NOxRatio [b]
01/29/99 Blanks 3 <0.9 <0.7 01/30/99 Sample HONO output ~670 ~9 31 2 3 216 51 0.0% 01/31/99 Replicate of above ~670 ~9 31 2 18 240 81 2.2% 02/01/99 Replicate of above ~670 ~9 31 2 5 261 102 0.3% 02/02/99 Replicate of above ~670 ~9 31 2 3 294 69 0.1%
04/27/00 Sample HONO prior to replacing salt 775 58 49 0.5 3 960 [c] -0.7%
04/27/00 Replicate of above 775 58 49 0.5 8 1006 [c] -0.1% 04/28/00 Blank 4 5 [c]
05/01/01 Blank (2 analyses) 11 15 [c]
05/01/00 Sample HONO from reactor with newly-replaced salt
742 36 49 0.5 7 669 [c] -0.2%
05/01/00 Replicate of above 735 36 49 0.5 13 1227 [c] 0.6%
[a] Temperature and gas flow through the HONO generator (flows 1+2 on the Figure 6). Note that the flow is prior to dilution for the flow experiment, HONO injection, or sampling.
[b] Ratio of chloride in sample – average chloride in blanks to total NOx measured in the input gas. [c] Not reported.
Although the simulations of the data were not perfect in all cases, they do not suggest any large major problems with our mechanism for the HONO photooxidation system.
Stirred Flow Experiments
Stirred flow experiments were carried out on the selected homologous n-alkanes from propane through n-dodecane, and also on CO and acetone. As indicated above, the first series of stirred flow experiments were carried out using the 50-liter carboy without mechanical stirring, but because of concern about whether stirred flow conditions are indeed achieved we eventually replaced the carboy reactor with a stirred flask with the same volume. A few stirred flow experiments were also carried out using a 15-liter FEP Teflon “mini-chamber” to see if the results would be affected by the nature of the reactor walls.
The data obtained in a representative stirred flow experiment are shown on Figure 16, along with results of the model simulations of the experiment. In this particular experiment, which employed the unstirred carboy as the reactor, about 1 ppm propane and 0.7 ppm HONO were present in the input stream flushing the reactor before the lights were turned on, and the “pre t=0” data show the NOx and NO readings of the unreacted HONO mixture. Turning the light on results in a significant increase of NO, and

52
Table 7. Summary of static HONO and HONO + VOC experiments discussed in this report.
Initial Reactants (ppm) Final Experimental (ppm) Calc Run Date
Irrad. Time (min) HONO NO VOC O3 NO O3-NO O3-NO
DTC685A 7/20/98 80 0.193 0.010 - 0.023 0.033 -0.010 -0.031 DTC685B 7/20/98 90 0.192 0.011 Propane 1.10 0.145 0.009 0.136 0.154 DTC686A 7/21/98 150 0.364 0.001 Propane 2.29 0.242 -0.003 0.245 0.289 DTC686B 7/21/98 160 0.367 0.000 - 0.007 0.081 -0.073 -0.066 DTC690A 7/31/98 80 0.518 0.006 Propane 2.30 0.148 0.000 0.147 0.206 DTC713A 10/22/98 110 0.405 0.011 n-Octane 0.187 0.182 0.006 0.176 0.107 DTC713B 10/22/98 120 0.405 0.012 - 0.006 0.150 -0.144 -0.149 ETC549 [a] 10/30/98 60 0.402 0.015 - 0.028 0.175 -0.148 -0.146 ETC550 [a] 11/3/98 31 0.448 0.002 - 0.002 0.222 -0.220 -0.158 ETC551 [a] 11/3/98 30 0.474 0.001 Propane 1.94 0.170 0.003 0.167 0.242 DTC721 [b] 11/6/98 45 0.478 0.002 Propane 1.76 0.041 0.004 0.037 0.132 DTC722 [b] 11/6/98 45 0.451 0.002 - -0.001 0.214 -0.216 -0.153 ETC555 [a] 1/29/99 20 0.616 0.008 Propane 3.55 0.378 0.000 0.378 0.465 ETC556 [a] 1/29/99 20 0.698 0.001 n-Octane 0.454 0.449 0.000 0.449 0.406
[a] Pillow bag experiment with irradiation inside the ETC enclosure. [b] Pillow bag experiment with irradiation inside the DTC enclosure. Although these are given DTC run
numbers, they did not use the DTC reactors.
some O3 to be formed, and took about 1-2 hours for the measurements to stabilize. The decrease in “NOx” readings when the lights are turned on is attributed to the formation of HNO3, which is not detected as NOx because it removed using a NaCl-coated filter before entering the instrument. Increasing the test compound caused the NO to decrease and the O3 to increase. Turning the test compound off causes the O3 to go away, the NO to increase to its maximum level, and the apparent HNO3 to decline somewhat. Note that it takes about 1-2 hours for the concentrations to stabilize after each change because of time required to reach equilibrium in the stirred flow reactor.
Figure 16 shows that the model gives a reasonably good simulation of the main features of the experiment, though not all the data are simulated exactly. The fact that the fit to [O3]-[NO] to the data with no or low added VOC is better than the fits to O3 or NO alone is attributed to the dark reaction between O3 and NO in the sample line, which is not represented in the model. This causes the measured O3 and NO both to be lower than in the actual reaction vessel, but because the amount of each consumed is equal, the [O3]-[NO] reading is not affected. This is an additional advantage to the use of [O3]-[NO] data as the primary measure of reactivity in these experiments. Note that although the model gives reasonably good fits to the [O3]-[NO] data for the experiment with the lower amount or no propane added, it underpredicts the data when the higher amount of propane is added. This is seen in almost all stirred flow experiments, as discussed below. The tendency of the model to underpredict the size of the “bump” in [O3]-[NO] that occurs when the lights are first turned on is also consistently seen in all experiments.
The data obtained in the experiments using the stirred flask were generally qualitatively similar to the data obtained using the carboy as shown on Figure 16. However, because of the lower volume/flow ratio, faster stabilization times were observed in the few experiments with the 15-liter Teflon “mini-chamber”, allowing many more concentrations to be studied in a single experiment. Although Table 8

53
DTC685 DTC686 DTC690HONO Only Side
[O3]
-[NO
] (pp
m)
Added Propane Side
[O3]
-[NO
] (pp
m)
Prop
ane
(ppm
)Ac
eton
e (p
pm)
Time (minutes)
-0.02
-0.01
0.00
0 30 60 90 120-0.10-0.08-0.06-0.04-0.020.00
0 30 60 90 120
0.00
0.05
0.10
0.15
0.20
0 30 60 90 1200.0
0.1
0.2
0.3
0.4
0 30 60 90 120
0.900.951.001.051.101.15
0 30 60 90 1201.92.02.12.22.32.4
0 30 60 90 120
0.000.020.040.060.080.10
0 30 60 90 1200.00
0.05
0.10
0.15
0.20
0 30 60 90 120
-0.15
-0.10
-0.05
0.00
0 30 60 90 120
0.00
0.05
0.10
0.15
0.20
0 30 60 90
1.92.02.12.22.32.4
0 30 60 90
0.000.050.100.150.200.25
0 30 60 90
Figure 13. Experimental and calculated concentration-time plots for ∆([O3]-[NO]), propane, and acetone for the static HONO vs. HONO + propane experiments carried out in the DTC.

54
HONO Only Side HONO + n-Octane Side[O3]-[NO] (ppm) [O3]-[NO] (ppm) n-Octane
Time (minutes)
0.00
0.05
0.10
0.15
0.20
0 30 60 90 1200.00
0.05
0.10
0.15
0.20
0 30 60 90 120-0.15
-0.10
-0.05
0.00
0 30 60 90 120
Figure 14. Experimental and calculated concentration-time plots for ∆([O3]-[NO]) and n-octane for the static HONO vs. HONO + n-octane experiment DTC-713.
-0.25
0.00
0.25
0.50
-0.25 0.00 0.25 0.50
Experimental Final [O3]-[NO] (ppm)
Cal
cula
ted
Fina
l [O
3]-[N
O] (
ppm
)
PB HONO onlyDTC HONO onlyPB PropaneDTC PropanePB n-OctaneDTC n-Octane1:1 Line
Figure 15. Plots of experimental vs. calculated ([O3]-[NO]) and ∆([O3]-[NO]) for the static HONO, HONO + propane, and HONO + n-octane experiments.
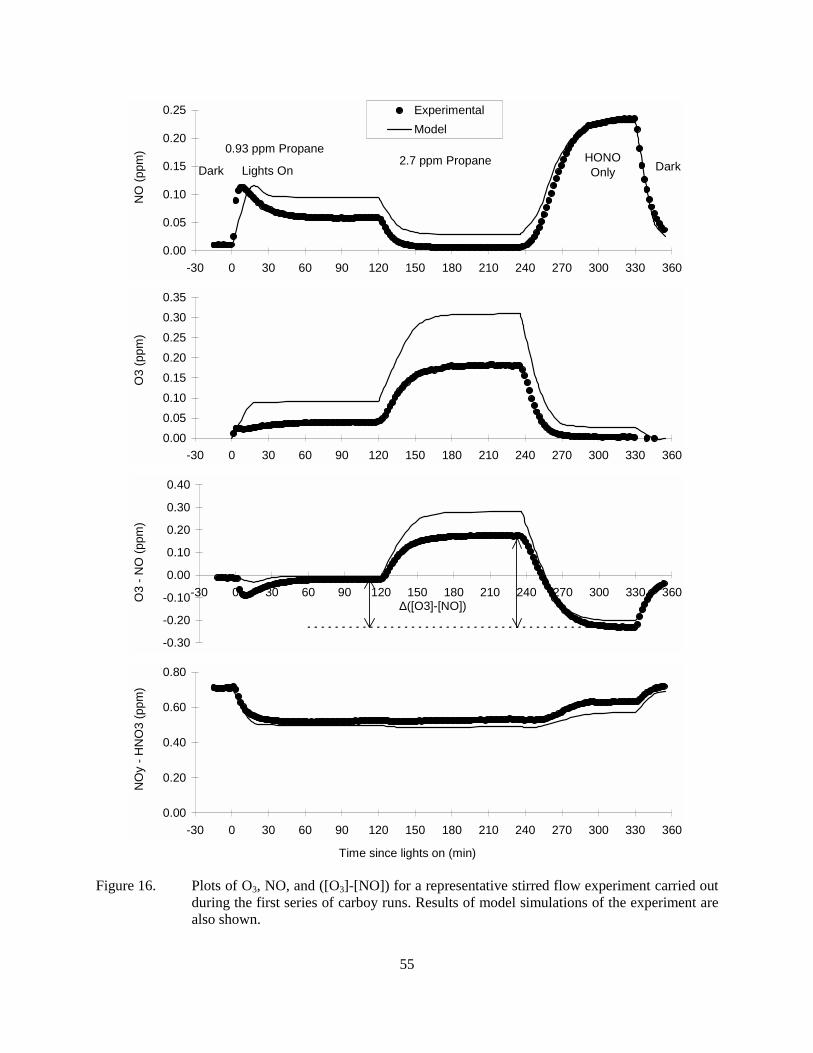
55
Time since lights on (min)
0.00
0.05
0.10
0.15
0.20
0.25
-30 0 30 60 90 120 150 180 210 240 270 300 330 360
NO
(ppm
)
ExperimentalModel
0.93 ppm Propane2.7 ppm Propane HONO
OnlyDark DarkLights On
0.000.050.100.150.200.250.300.35
-30 0 30 60 90 120 150 180 210 240 270 300 330 360
O3
(ppm
)
-0.30
-0.20
-0.10
0.00
0.10
0.20
0.30
0.40
-30 0 30 60 90 120 150 180 210 240 270 300 330 360O3
- NO
(ppm
)
∆([O3]-[NO])
0.00
0.20
0.40
0.60
0.80
-30 0 30 60 90 120 150 180 210 240 270 300 330 360
NO
y - H
NO
3 (p
pm)
Figure 16. Plots of O3, NO, and ([O3]-[NO]) for a representative stirred flow experiment carried out during the first series of carboy runs. Results of model simulations of the experiment are also shown.
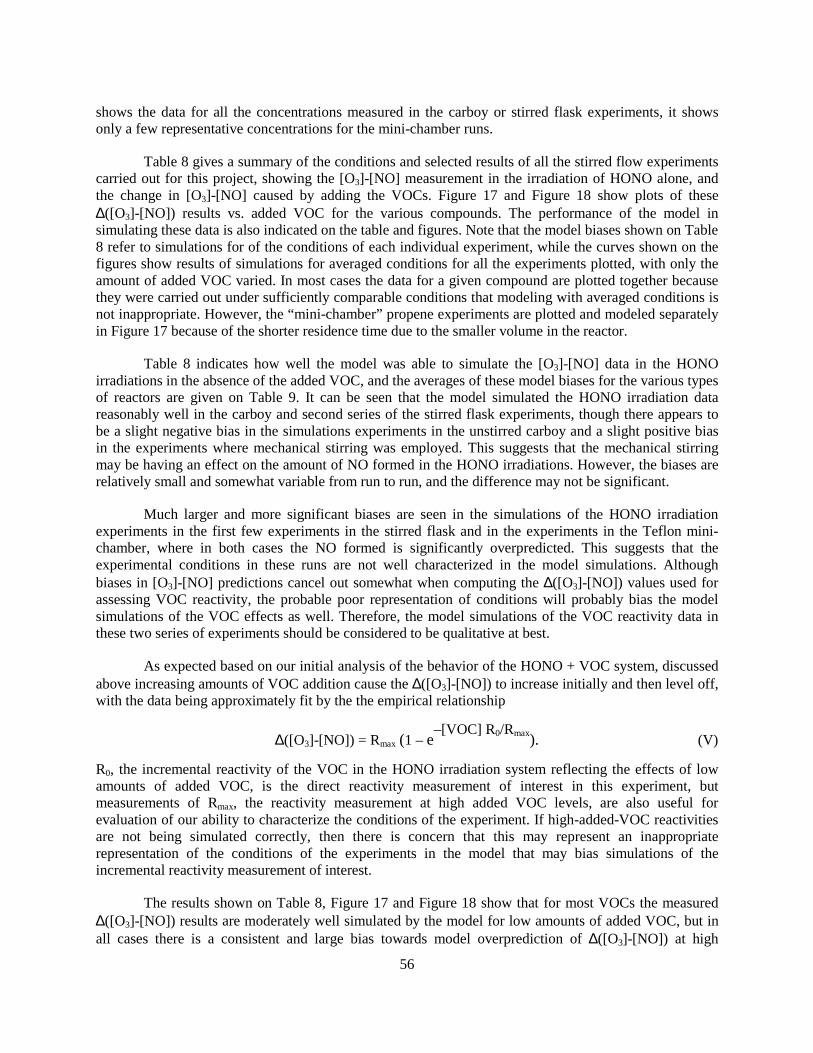
56
shows the data for all the concentrations measured in the carboy or stirred flask experiments, it shows only a few representative concentrations for the mini-chamber runs.
Table 8 gives a summary of the conditions and selected results of all the stirred flow experiments carried out for this project, showing the [O3]-[NO] measurement in the irradiation of HONO alone, and the change in [O3]-[NO] caused by adding the VOCs. Figure 17 and Figure 18 show plots of these ∆([O3]-[NO]) results vs. added VOC for the various compounds. The performance of the model in simulating these data is also indicated on the table and figures. Note that the model biases shown on Table 8 refer to simulations for of the conditions of each individual experiment, while the curves shown on the figures show results of simulations for averaged conditions for all the experiments plotted, with only the amount of added VOC varied. In most cases the data for a given compound are plotted together because they were carried out under sufficiently comparable conditions that modeling with averaged conditions is not inappropriate. However, the “mini-chamber” propene experiments are plotted and modeled separately in Figure 17 because of the shorter residence time due to the smaller volume in the reactor.
Table 8 indicates how well the model was able to simulate the [O3]-[NO] data in the HONO irradiations in the absence of the added VOC, and the averages of these model biases for the various types of reactors are given on Table 9. It can be seen that the model simulated the HONO irradiation data reasonably well in the carboy and second series of the stirred flask experiments, though there appears to be a slight negative bias in the simulations experiments in the unstirred carboy and a slight positive bias in the experiments where mechanical stirring was employed. This suggests that the mechanical stirring may be having an effect on the amount of NO formed in the HONO irradiations. However, the biases are relatively small and somewhat variable from run to run, and the difference may not be significant.
Much larger and more significant biases are seen in the simulations of the HONO irradiation experiments in the first few experiments in the stirred flask and in the experiments in the Teflon mini-chamber, where in both cases the NO formed is significantly overpredicted. This suggests that the experimental conditions in these runs are not well characterized in the model simulations. Although biases in [O3]-[NO] predictions cancel out somewhat when computing the ∆([O3]-[NO]) values used for assessing VOC reactivity, the probable poor representation of conditions will probably bias the model simulations of the VOC effects as well. Therefore, the model simulations of the VOC reactivity data in these two series of experiments should be considered to be qualitative at best.
As expected based on our initial analysis of the behavior of the HONO + VOC system, discussed above increasing amounts of VOC addition cause the ∆([O3]-[NO]) to increase initially and then level off, with the data being approximately fit by the the empirical relationship
∆([O3]-[NO]) = Rmax (1 – e–[VOC] R0/Rmax). (V)
R0, the incremental reactivity of the VOC in the HONO irradiation system reflecting the effects of low amounts of added VOC, is the direct reactivity measurement of interest in this experiment, but measurements of Rmax, the reactivity measurement at high added VOC levels, are also useful for evaluation of our ability to characterize the conditions of the experiment. If high-added-VOC reactivities are not being simulated correctly, then there is concern that this may represent an inappropriate representation of the conditions of the experiments in the model that may bias simulations of the incremental reactivity measurement of interest.
The results shown on Table 8, Figure 17 and Figure 18 show that for most VOCs the measured ∆([O3]-[NO]) results are moderately well simulated by the model for low amounts of added VOC, but in all cases there is a consistent and large bias towards model overprediction of ∆([O3]-[NO]) at high

57
Table 8. Summary of the HONO + VOC stirred flow experiments discussed in this report.
Conc. (ppm) Results [a] Model Bias [b] Date Reactor
Flow HONO VOC NO-O3 (0) ∆(O3-NO) NO-O3 (0) ∆(O3-NO)
Propane: Unstirred Carboy Mar-24-99 5.00 0.66 0.30 0.23 0.08 -15% -6% Apr-5-99 5.00 0.60 0.51 0.20 0.12 -14% 3%
Mar-24-99 5.00 0.66 0.61 0.23 0.15 -15% -4% Apr-5-99 5.00 0.60 0.72 0.20 0.16 -14% 5%
Mar-30-99 5.00 0.69 0.93 0.23 0.21 -13% 1% Mar-24-99 5.00 0.66 0.97 0.23 0.22 -15% 2% Jun-29-99 4.29 0.70 1.01 0.18 0.23 19% 7% Jun-9-98 6.83 0.82 1.16 0.29 0.27 -16% -17%
Mar-23-99 5.00 0.67 1.19 0.23 0.25 -14% 6% Mar-24-99 5.00 0.66 1.23 0.23 0.26 -15% 4% Apr-5-99 5.00 0.60 1.32 0.20 0.26 -14% 12% Jul-13-98 5.12 0.75 1.35 0.24 0.29 -6% 3% Jun-14-98 5.15 0.76 1.47 0.25 0.32 -11% -3% Jul-9-98 5.06 0.72 1.55 0.22 0.32 -4% 5%
Mar-10-99 5.00 0.69 1.77 0.23 0.32 -10% 15% Mar-4-99 5.00 0.71 1.86 0.18 0.31 18% 24% Mar-5-99 5.00 0.67 1.86 0.21 0.37 -10% 7%
Mar-24-99 5.00 0.66 2.01 0.23 0.35 -15% 16% Apr-5-99 5.00 0.60 2.07 0.20 0.34 -14% 20%
Mar-30-99 5.00 0.69 2.70 0.23 0.41 -13% 26% Jun-29-99 4.29 0.70 10.64 0.18 0.66 19% 56% Jun-4-98 5.00 0.77 13.60 0.29 0.76 -19% 42%
Mar-23-99 5.00 0.67 13.95 0.23 0.69 -14% 43% Mar-23-99 5.00 0.67 18.08 0.23 0.73 -14% 44% Mar-23-99 5.00 0.67 33.38 0.23 0.78 -14% 48%
Propane: Stirred Carboy May-5-99 5.02 0.70 1.06 0.18 0.21 17% 15% May-5-99 5.02 0.70 2.17 0.18 0.33 17% 34% May-4-99 4.99 0.68 3.11 0.17 0.38 17% 47% May-4-99 4.99 0.68 15.37 0.17 0.58 17% 77%
Propane: Mini-Chamber [c] Jul-19-99 4.33 0.79 0.38 0.11 0.05 125% 83% Jul-17-99 4.34 0.77 0.88 0.11 0.18 122% 17% Jul-19-99 4.33 0.79 3.06 0.11 0.38 125% 57% Jul-17-99 4.34 0.77 5.09 0.11 0.50 122% 61% Jul-17-99 4.34 0.77 10.26 0.11 0.61 122% 75% Jul-19-99 4.33 0.79 20.64 0.11 0.67 125% 90%
Propane: Stirred Flask: First Series Jul-19-99 4.33 0.79 0.38 0.11 0.05 125% 83% Jul-17-99 4.34 0.77 0.88 0.11 0.18 122% 17% Jul-19-99 4.33 0.79 3.06 0.11 0.38 125% 57%

Table 8 (continued)
58
Conc. (ppm) Results [a] Model Bias [b] Date Reactor
Flow HONO VOC NO-O3 (0) ∆(O3-NO) NO-O3 (0) ∆(O3-NO)Jul-17-99 4.34 0.77 5.09 0.11 0.50 122% 61% Jul-17-99 4.34 0.77 10.26 0.11 0.61 122% 75% Jul-19-99 4.33 0.79 20.64 0.11 0.67 125% 90%
Propane: Stirred Flask: Second Series Mar-28-00 4.79 0.70 0.49 0.22 0.08 5% 43% Mar-24-00 4.79 0.66 0.51 0.19 0.08 15% 53% Apr-11-00 5.18 0.68 0.52 0.21 0.06 14% 83% Mar-20-00 4.76 0.62 0.80 0.23 0.11 8% 61% Apr-11-00 5.18 0.68 0.90 0.20 0.12 16% 62% Mar-28-00 4.79 0.70 0.98 0.22 0.15 8% 48% Mar-24-00 4.79 0.66 1.04 0.18 0.13 19% 70% Mar-18-00 4.63 0.65 1.45 0.21 0.18 12% 62% Mar-28-00 4.79 0.70 3.05 0.21 0.34 11% 61% Mar-24-00 4.79 0.66 3.20 0.18 0.34 24% 64% Mar-20-00 4.76 0.62 3.50 0.22 0.35 10% 63% Mar-28-00 4.79 0.70 4.78 0.21 0.45 14% 64% Mar-18-00 4.63 0.65 7.29 0.21 0.56 13% 57% Mar-28-00 4.79 0.70 9.84 0.20 0.56 16% 74% Mar-20-00 4.76 0.62 10.42 0.22 0.59 13% 65% Mar-20-00 4.76 0.62 18.88 0.21 0.66 17% 74%
n-Butane: Unstirred Carboy Mar-12-99 5.00 0.62 0.24 0.20 0.15 -10% 4% Mar-11-99 5.00 0.58 0.41 0.19 0.21 -15% 19% Mar-12-99 5.00 0.62 0.50 0.20 0.26 -10% 8% Mar-11-99 5.00 0.58 0.89 0.19 0.33 -15% 28% Mar-12-99 5.00 0.62 1.05 0.20 0.38 -10% 24% Apr-1-99 5.00 0.70 3.86 0.25 0.60 -17% 46% Apr-1-99 5.00 0.70 7.90 0.25 0.69 -17% 49%
Mar-11-99 5.00 0.58 9.21 0.19 0.62 -15% 51% Apr-1-99 5.00 0.70 12.57 0.25 0.75 -17% 50% Apr-1-99 5.00 0.70 20.36 0.25 0.80 -17% 52%
n-Hexane: Unstirred Carboy Mar-17-99 5.00 0.58 0.06 0.22 0.09 -22% 7% Mar-17-99 5.00 0.58 0.13 0.22 0.17 -22% 9% Mar-16-99 5.00 0.59 0.24 0.22 0.26 -18% 16% Mar-17-99 5.00 0.58 0.25 0.22 0.28 -22% 10% Mar-16-99 5.00 0.59 0.54 0.22 0.41 -18% 30% Mar-17-99 5.00 0.58 1.91 0.22 0.61 -22% 45% Mar-16-99 5.00 0.59 5.63 0.22 0.72 -18% 55%
n-Octane: Unstirred Carboy. Gas-Phase Injection Mar-22-99 5.00 0.66 0.16 0.21 0.26 -7% -4% Mar-19-99 5.00 0.61 0.20 0.19 0.27 -3% 10% Mar-22-99 5.00 0.66 0.25 0.21 0.33 -7% 9% Mar-19-99 5.00 0.61 0.38 0.19 0.37 -3% 31%
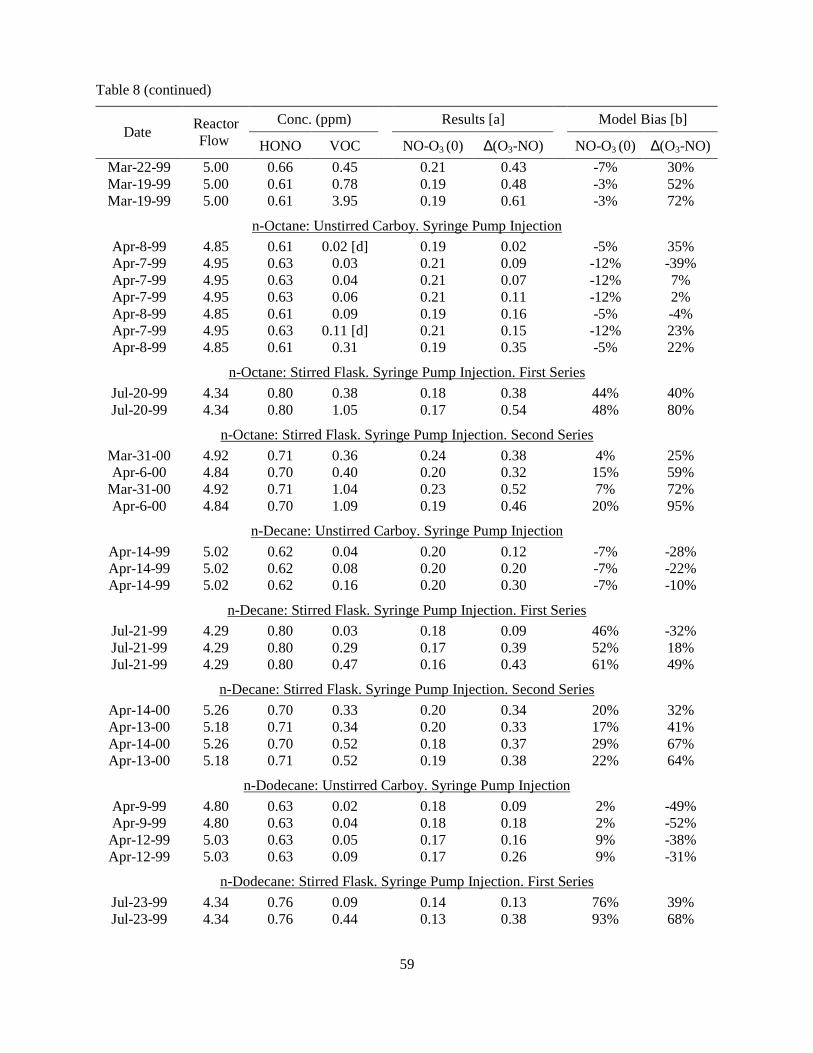
Table 8 (continued)
59
Conc. (ppm) Results [a] Model Bias [b] Date Reactor
Flow HONO VOC NO-O3 (0) ∆(O3-NO) NO-O3 (0) ∆(O3-NO)Mar-22-99 5.00 0.66 0.45 0.21 0.43 -7% 30% Mar-19-99 5.00 0.61 0.78 0.19 0.48 -3% 52% Mar-19-99 5.00 0.61 3.95 0.19 0.61 -3% 72%
n-Octane: Unstirred Carboy. Syringe Pump Injection Apr-8-99 4.85 0.61 0.02 [d] 0.19 0.02 -5% 35% Apr-7-99 4.95 0.63 0.03 0.21 0.09 -12% -39% Apr-7-99 4.95 0.63 0.04 0.21 0.07 -12% 7% Apr-7-99 4.95 0.63 0.06 0.21 0.11 -12% 2% Apr-8-99 4.85 0.61 0.09 0.19 0.16 -5% -4% Apr-7-99 4.95 0.63 0.11 [d] 0.21 0.15 -12% 23% Apr-8-99 4.85 0.61 0.31 0.19 0.35 -5% 22%
n-Octane: Stirred Flask. Syringe Pump Injection. First Series Jul-20-99 4.34 0.80 0.38 0.18 0.38 44% 40% Jul-20-99 4.34 0.80 1.05 0.17 0.54 48% 80%
n-Octane: Stirred Flask. Syringe Pump Injection. Second Series Mar-31-00 4.92 0.71 0.36 0.24 0.38 4% 25% Apr-6-00 4.84 0.70 0.40 0.20 0.32 15% 59%
Mar-31-00 4.92 0.71 1.04 0.23 0.52 7% 72% Apr-6-00 4.84 0.70 1.09 0.19 0.46 20% 95%
n-Decane: Unstirred Carboy. Syringe Pump Injection Apr-14-99 5.02 0.62 0.04 0.20 0.12 -7% -28% Apr-14-99 5.02 0.62 0.08 0.20 0.20 -7% -22% Apr-14-99 5.02 0.62 0.16 0.20 0.30 -7% -10%
n-Decane: Stirred Flask. Syringe Pump Injection. First Series Jul-21-99 4.29 0.80 0.03 0.18 0.09 46% -32% Jul-21-99 4.29 0.80 0.29 0.17 0.39 52% 18% Jul-21-99 4.29 0.80 0.47 0.16 0.43 61% 49%
n-Decane: Stirred Flask. Syringe Pump Injection. Second Series Apr-14-00 5.26 0.70 0.33 0.20 0.34 20% 32% Apr-13-00 5.18 0.71 0.34 0.20 0.33 17% 41% Apr-14-00 5.26 0.70 0.52 0.18 0.37 29% 67% Apr-13-00 5.18 0.71 0.52 0.19 0.38 22% 64%
n-Dodecane: Unstirred Carboy. Syringe Pump Injection Apr-9-99 4.80 0.63 0.02 0.18 0.09 2% -49% Apr-9-99 4.80 0.63 0.04 0.18 0.18 2% -52%
Apr-12-99 5.03 0.63 0.05 0.17 0.16 9% -38% Apr-12-99 5.03 0.63 0.09 0.17 0.26 9% -31%
n-Dodecane: Stirred Flask. Syringe Pump Injection. First Series Jul-23-99 4.34 0.76 0.09 0.14 0.13 76% 39% Jul-23-99 4.34 0.76 0.44 0.13 0.38 93% 68%

Table 8 (continued)
60
Conc. (ppm) Results [a] Model Bias [b] Date Reactor
Flow HONO VOC NO-O3 (0) ∆(O3-NO) NO-O3 (0) ∆(O3-NO)
Carbon Monoxide: Unstirred Carboy. Mar-31-99 5.00 0.71 4.04 0.24 0.09 -14% -15% Mar-31-99 5.00 0.71 4.78 0.24 0.10 -14% -10% Mar-25-99 5.00 0.68 4.80 0.23 0.11 -12% -17% Mar-25-99 5.00 0.68 10.00 0.23 0.22 -12% -12% Mar-31-99 5.00 0.71 13.62 0.24 0.26 -14% 0% Mar-25-99 5.00 0.68 30.00 0.23 0.48 -12% 9% Mar-25-99 5.00 0.68 50.00 0.23 0.55 -12% 34%
Acetone: Unstirred Carboy. Apr-6-99 4.80 0.61 0.73 0.22 0.08 -20% -28% Apr-6-99 4.80 0.61 0.98 0.22 0.10 -20% -23% Apr-6-99 4.80 0.61 1.49 0.22 0.13 -20% -18% Apr-6-99 4.80 0.61 2.94 0.22 0.21 -20% -12%
Apr-13-99 4.95 0.61 9.51 0.19 0.31 -5% 18% Apr-13-99 4.95 0.61 14.77 0.19 0.36 -5% 23% Apr-13-99 4.95 0.61 19.22 0.19 0.41 -5% 20% Apr-13-99 4.95 0.61 63.90 0.19 0.42 -5% 37%
[a] NO-O3 (0) is the ([O3]-[NO]) in the irradiation in the absence of the VOC, and ∆(O3-NO) is the change in ([O3]-[NO]) caused by adding the VOC (see Equation IV).
[b] Model error is the ratio of (Calculated – Experimental) / Experimental results for the NO-O3 (0) and ∆(O3-NO) values. Calculated using the SAPRC-99 mechanism and the measured flows and concentrations for the individual runs.
[c] Data for multiple concentrations were obtained. Results are shown for the second lowest and the highest concentration.
[d] Concentration uncertain.
amounts of added VOC. In other words, the model has a consistent bias towards overpredicting the Rmax values that would be derived from these data. Since the chemical mechanisms for propane and at least some of the other compounds we studied are considered reasonably well established, and approximately the same bias is seen for practically all compounds, this suggests a significant problem in our characterization of this system.
As indicated in the experimental summary section, above, some effort was expended in an attempt to determine the source of this problem. The possibility of O3 loss on the walls being much higher than model prediction was also considered, but model calculations and qualitative measurements of ozone lifetimes in the carboy indicated that this cannot be the problem. The lack of mechanical stirring was thought to be possible problem with the unstirred carboy experiments, but use of mechanical stirring did not have any significant affect on this bias. Indeed, the model performance in simulating the R0 data in the propane and n-octane systems became somewhat worse when mechanical stirring was employed.
The possibility that the problem may be due to some wall effect involving the glass reactors was investigated by conducting experiments using the 15-liter FEP Teflon mini-chamber. If anything, the

61
Propane (50 liter Carboy or Flask) Propane (15-liter "Mini-Chamber")
0.0
0.2
0.4
0.6
0.8
1.0
0 10 20 30 40
Unstirred Carboy Stirred CarboyStirred Flask: Series #1 Stirred Flask: Series #2Model (Carboy)
0.0
0.2
0.4
0 1 20.0
0.2
0.4
0.6
0 5 10 15 20 25
5/25/1999 7/9/19997/14/1999 Model
n-Butane n-Hexane
0.0
0.2
0.4
0.6
0.8
1.0
1.2
0 5 10 15 20 25
Unstirred CarboyModel
0.0
0.2
0.4
0 0.5 10.0
0.2
0.4
0.6
0.8
1.0
1.2
0 1 2 3 4 5 6
Unstirred CarboyModel
0.0
0.3
0.6
0 0.3 0.6
n-Octane n-Decane
∆([O3]-[NO]) vs Added VOC (ppm)
0.0
0.2
0.4
0.6
0.8
1.0
1.2
0 1 2 3 4
Unstirred Carboy (Gas Inj.)Unstirred Carboy (Liq. Inj.)Stirred Flask, Series #1 (Liq. Inj.)Stirred Flask:Series #2Model (Carboy)
0.0
0.2
0.4
0 0.2 0.40.0
0.2
0.4
0.6
0 0.1 0.2 0.3 0.4 0.5 0.6
Unstirred Carboy Stirred Flask, Series #1Stirred Flask: Series #2 Model (Carboy)
Figure 17. Plots of experimental and calculated ∆([O3]-[NO]) vs. added VOC for the stirred flow experiments with propane, n-butane, n-hexane, n-octane, and n-decane.
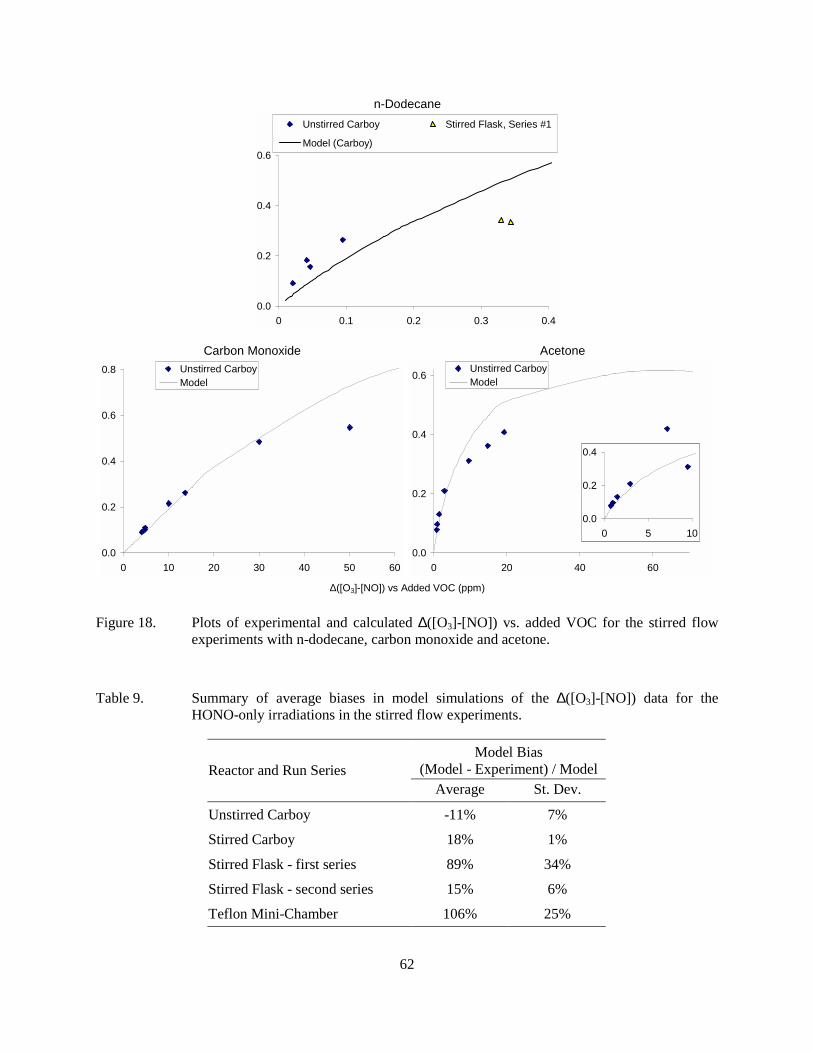
62
n-Dodecane
0.0
0.2
0.4
0.6
0 0.1 0.2 0.3 0.4
Unstirred Carboy Stirred Flask, Series #1
Model (Carboy)
Carbon Monoxide Acetone
∆([O3]-[NO]) vs Added VOC (ppm)
0.0
0.2
0.4
0.6
0.8
0 10 20 30 40 50 60
Unstirred CarboyModel
0.0
0.2
0.4
0.6
0 20 40 60
Unstirred CarboyModel
0.0
0.2
0.4
0 5 10
Figure 18. Plots of experimental and calculated ∆([O3]-[NO]) vs. added VOC for the stirred flow experiments with n-dodecane, carbon monoxide and acetone.
Table 9. Summary of average biases in model simulations of the ∆([O3]-[NO]) data for the HONO-only irradiations in the stirred flow experiments.
Model Bias (Model - Experiment) / Model Reactor and Run Series
Average St. Dev.
Unstirred Carboy -11% 7%
Stirred Carboy 18% 1%
Stirred Flask - first series 89% 34%
Stirred Flask - second series 15% 6%
Teflon Mini-Chamber 106% 25%

63
model bias in simulating Rmax was somewhat higher in the mini-chamber runs, though as indicated above the NO formed from the HONO-only irradiations in that reactor were also not well simulated. But the results indicate that this bias is qualitatively similar to that seen in the glass carboy experiments and not likely to be a wall effect. The simulations of the static experiments, discussed above, suggest that it is not a problem with the mechanism for the HONO system itself, since the amount of VOC added in those experiments was relatively high, yet the consistent large positive bias in the added-VOC [O3]-[NO] simulations was not observed (see Figure 13 and Figure 14, above).
Nevertheless, despite this consistent bias in the simulation of Rmax, as indicated on the table and figures the low-added-VOC reactivity (R0) measurements obtained using this system were reasonably consistent with model predictions, at least for experiments using low volatility compounds in the unstirred carboy. Table 10 gives a summary of the R0 values that were derived by optimizing the parameters in Equation (VI) to fit the low-added-VOC data in the unstirred carboy experiments, where they are compared to the value calculated by the model using the averaged experimental conditions. (Only the data from unstirred carboy experiments are used in this analysis because of the larger number of compounds studied using this reactor, and the generally better simulations of the HONO-only results, as indicated on Table 9.) The results indicate reasonably good simulations of the measured direct reactivities of the n-alkanes propane through n-octane, and fair simulations of the direct reactivities of CO and acetone. The biases observed are probably within the uncertainty of the measurement.
On the other hand, the model had an increasing tendency to underpredict the incremental reactivities of the C≥10 n-alkanes, with the negative bias increasing with the size of the molecule. Because of the similarity of the mechanisms for the higher n-alkanes, one would expect the these compounds to have about the same number of NO to NO2 per molecule reacting, so the direct reactivity, which is the rate at which the VOC converts NO to NO2 when it reacts, should be approximately proportional to its rate constant. Therefore, the R0 value divided by the OH radical rate constant should be approximately independent of the size of the molecule, to a first approximation.
Table 10. Summary of the experimental and calculated extrapolated low-added-VOC reactivity results for the various compounds studied using the stirred flow method.
Incremental Reactivity (R0) (molar) Compound Experimental Calculated Model Bias
Propane 0.30 0.26 -14%
n-Butane 0.73 0.70 -5%
n-Hexane 1.55 1.56 0%
n-Octane 2.15 1.83 -15%
n-Decane 3.16 2.05 -35%
n-Dodecane 5.24 2.17 -59%
CO 0.025 0.020 -20%
Acetone 0.109 0.080 -27%

64
Figure 19 shows plots of experimental and calculated low limit direct reactivity (R0) measures divided by the VOC’s OH rate constant for all the n-alkanes that were studied using the unstirred carboy. It can be seen that the experimental reactivity measure increases with carbon number above C8, while the model calculation decreases. The R0 divided by the rate constant is expected to decrease with increasing rate constant because for sufficiently rapidly reacting compounds the amounts reacted in a given time frame becomes less than proportional to the rate constant (see Figure 36, below). The fact that the experimental data have the opposite trend is not mechanistically reasonable, and suggests problems with the experiments either with the lower volatility compounds or with compounds with higher reaction rates.
One would expect that if surface absorption of low volatility compounds were the problem, then the experimentally measured direct reactivity for such compounds should be lower than expected, rather than the other way around. This is in fact what is observed in the PFA tube plug flow experiments discussed in the following sections, where the surface/volume ratio is much higher than in the stirred flow reactors discussed here. Possible analytical problems with measuring the low volatility compounds cannot be ruled out, and if the concentration measurements are biased low then the reactivity measure would be biased high. Another possibility is that problems with the model accurately representing the flow conditions of these dynamic experiments may have a greater effect with the more rapidly reacting compounds, causing increases in biases in the simulation. This could have been tested by conducting experiments with rapidly reacting VOCs that do not have low volatility or analytical concerns, but unfortunately such tests were not conducted during this project.
0
50
100
150
200
250
300
2 4 6 8 10 12
n-Alkane Carbon Number
106 x
R0 /
kO
H (p
pm-1
min
-1 )
ExperimentalCalculated
Figure 19. Plots of low concentration limit direct reactivity measurements divided by the VOC’s OH radical rate constant against carbon number for the unstirred carboy experiments with the n-alkanes.

65
PFA Tube Plug Flow Experiments
Because of problems with modeling the results of the stirred flow experiments, a series of plug flow experiments were carried out to see if results more consistent with model predictions could be obtained. As discussed above, the first series of plug flow experiments for this project used a coiled ~10’ x 0.3” ID PFA tube as the reactor. Experiments were carried out using selected n-alkanes from propane through n-hexadecane. Examples of the types of data that were obtained are shown on Figure 20 and Figure 21, which show data from a representative propane experiment and from the one apparently successful experiment with n-hexadecane, respectively. A summary of the conditions and results of the PFA tube experiments that were conducted is given on Table 11, along with the results of the model simulations of the runs. Plots of the experimental and calculated ∆([O3]-[NO]) vs. added VOC data for the various compounds are shown on Figure 22.
Because of rapid response of this system to changes in reactant concentration in the experiments with the more volatile materials, in most experiments data were obtained for a number of different concentrations. For this reason, the data were fitted using the empirical parameterization given in Equation V, and the resulting parameters are given on Table 11. As discussed above the quantity R0 measures the ∆([O3]-[NO])/[VOC] ratio for small amounts of added VOCs and is the direct reactivity measure of interest, and Rmax gives the ∆([O3]-[NO]) at the high added VOC limit, and provides a test of our ability to appropriately model the system.
Example of the types of data obtained with low volatility compounds are shown on Figure 20, which shows data from a representative propane run. Despite the relatively low residence time in the reactor to permit time for the propane to react, it can be seen that clearly measurable changes in NO and (at higher VOC levels) O3 result from the addition of the test compound, allowing reasonably precise data to be obtained. It can also be seen that the system responds rapidly to changes in the added propane concentration, permitting ∆([O3]-[NO]) to be derived for multiple concentrations during a single one-day experiment. This is because of the relatively short residence time of the reactants in the tube, which is calculated to be only about 80 seconds. There was clearly no evidence of wall absorption problems in the case of the propane experiments, given the rapid response of the NO and O3 data resulting when the propane flow is turned off.
On the other hand, the data obtained from the experiments using the lower volatility compounds clearly indicated that absorption on the walls was significant. The data obtained from the n-hexadecane experiment shown on Figure 21 shows the most extreme example, where it can be seen that it took about 4 hours for the NO to recover to its original HONO-only level after the n-hexadecane injection was ended. It also took at least two hours after the injection of the material or changes in its concentration for the data to stabilize to the point that it was considered appropriate to take the measurement data, and it may be that it had not completely stabilized at that point. For this reason it took much longer to obtain data with these low volatility compounds.
The data on Table 11 and Figure 22 show that very good reproducibility was obtained in the replicate propane experiments at the lower reactant concentrations and n-octane experiments at all concentrations, but the reproducibility of the higher concentration propane results was not quite as good. The data from the experiments with the higher molecular weight compounds are somewhat more scattered, but generally the results appeared to be consistent given the measurement uncertainties.
The ability of the model to simulate these data is also shown on Table 11 and Figure 22. Note that the model results shown on Table 11 are simulations of the conditions of the individual experiments, while those shown on Figure 22 is a simulation representing averaged conditions of the experiments whose data are plotted. Indeed, the model calculations indicate that the variability in the high-added-VOC

66
Time since lights turned on (minutes)
NO (ppm)
0.00.20.40.60.81.01.2
0 60 120 180 240 300 360 420
Continuous DataRecorded Data (points used)
Prop
ane
Off
Prop
ane
Off
Ligh
ts O
ff
Perturbations caused by GC sampling
O3 (ppm)
0.0
0.2
0.4
0.6
0.8
0 60 120 180 240 300 360 420
Perturbations caused by GC sampling
Propane
0
20
40
60
0 60 120 180 240 300 360 420
Figure 20. NO, O3, and propane data from the representative HONO + propane PFA tube plug flow run carried out on 5/11/99. Steps in NO and O3 data show effects of changing added propane levels.

67
Time since lights turned on (minutes)
NO (ppm)
0.0
0.2
0.4
0.6
0.8
0 60 120 180 240 300 360 420 480 540
Syringe Pump on Syringe Pump off
Firstn-C16Level
Secondn-C16Level
O3 (ppm)
0.0
0.1
0 60 120 180 240 300 360 420 480 540
Perturbations caused by GC sampling
n-Hexadecane (ppm)
0.0
0.5
1.0
1.5
0 60 120 180 240 300 360 420 480 540
Figure 21. NO, O3, and propane data from the HONO + n-hexadecane PFA tube plug flow run carried out on 5/26/99.

68
Table 11. Summary of the HONO + VOC plug flow experiments using the coiled PFA Teflon tube reactor.
Initial Conc (ppm) Flow Added VOC
(ppm) [a] Experimental [b] Model [c] Model Bias Date
HONO NO (l/min) Min Max R0 Rmax R0 Rmax R0 Rmax
Propane 5/6/99 3.85 0.11 0.94 1.0 160 0.11 1.39 0.12 1.62 9% 17%
5/11/99 3.50 0.24 0.98 0.8 58 0.11 1.54 0.11 1.69 -3% 10% 5/19/99 3.21 0.11 0.99 2.2 62 0.12 1.12 0.12 1.35 1% 21% 5/20/99 3.31 0.11 0.96 5.7 40 0.10 1.25 0.12 1.45 11% 16% 5/24/99 3.01 0.10 1.10 4.8 36 0.09 0.93 0.11 1.18 13% 27% 5/27/99 3.30 0.16 0.98 5.2 40 0.09 1.17 0.11 1.53 26% 31%
n-Octane 5/12/99 3.35 0.17 1.02 0.1 7.6 0.94 1.08 0.92 1.53 -2% 42% 5/13/99 3.21 0.18 1.05 0.2 2.3 0.88 1.42 0.80 1.74 -9% 23% 5/20/99 3.45 0.14 0.96 0.8 4.4 1.23 1.09 0.94 1.65 -23% 51% 5/27/99 3.35 0.17 0.98 0.6 4.6 0.89 0.95 0.91 1.63 2% 72%
n-Decane 5/14/99 3.23 0.29 1.00 0.7 1.3 1.51 1.26 0.89 2.13 -41% 69% 5/17/99 3.49 0.09 1.00 0.1 0.8 0.97 2.20 5/18/99 3.43 0.12 0.98 0.5 4.6 1.60 0.87 1.13 1.51 -29% 72% 5/21/99 3.20 0.09 1.03 0.4 2.5 1.84 0.80 1.06 1.41 -43% 78%
n-Dodecane 5/24/99 3.06 0.13 1.10 0.4 1.4 1.06 0.64 1.07 1.53 1% 139%
n-Tetradecane 5/25/99 3.30 0.18 0.96 0.4 1.8 0.90 0.69 1.39 1.77 55% 157%
n-Hexadecane 5/26/99 3.21 0.15 1.02 0.4 1.3 0.81 0.56 1.58 1.71 95% 203%5/28/99 3.23 0.16 1.00 0.9 1.1 (data rejected) 1.55 1.89
[a] In most experiments, results were obtained for a number of different concentrations. The minimum and maximum concentration for which data were obtained is given.
[b] R0 and Rmax are the parameters in the empirical relationship given by Equation V that was used to fit the data. R0, which is unitless and Rmax has units of ppm.
[b] R0 and Rmax were derived to fit the results of model calculations simulating the conditions of the experiment, with the amount of added VOC varied from low levels to the maximum experimental level.
[c] Model bias is the (calculated – experimental) / calculated ratio.

69
Propane n-Octane
n-Decane n-Dodecane, n-Tetradecane, and n-Hexadecane
∆([O3]-[NO]) vs Added VOC (ppm)
0.0
0.5
1.0
1.5
0 50 100 150
5/6/1999 5/11/1999 5/19/1999 5/20/99
5/24/1999 5/27/1999 Model
0.0
0.5
1.0
1.5
0 2 4 6 8
5/12/1999 5/13/1999 5/20/1999
5/27/1999 Model
0.00
0.25
0.50
0.75
0 5 10
0.0
0.2
0.4
0.6
0.8
1.0
1.2
1.4
0 1 2 3 4 5
5/14/1999 5/17/1999 5/18/1999
5/21/1999 Model
0.0
0.2
0.4
0.6
0.8
1.0
1.2
0.0 0.5 1.0 1.5 2.0
n-C12 (5/24/99) n-C14 (5/25/99)n-C16 (5/26/99) n-C16 (5/28/99)n-C12 Model n-C16 Model
Figure 22. Plot of ∆([O3]-[NO]) vs. amount of test VOC added for the PFA tube plug flow experiments.
results in the propane experiments is attributable to variability in run conditions, since the experimental and calculated Rmax values on Table 11 are closely correlated. Therefore, this variability is attributable to known variability in conditions, and should be reduced if better control on conditions were achieved.
Table 11 and Figure 22 shows that although there is still a bias in the model towards underpredicting the Rmax values representing the high concentration added VOC data, at least for propane this bias is significantly reduced. In particular, the average bias the Rmax predictions in the propane runs with the PFA tube is 20±8%, compared to around 50% for those carried out in the stirred flow system. This average bias for these PFA experiments is essentially the same as the 17±4% average bias in the ∆([O3]-[NO]) simulations of the static HONO vs. propane + HONO experiments the DTC, as derived from the data on Table 7, above. The biases are higher for n-octane and the higher n-alkanes, but this may be due to experimental problems as discussed below. Since the fewest apparent difficulties are encountered in the experiments with propane and also it has the best characterized mechanism of the compounds studied, the model simulations of the runs with this compound provide the best test of our
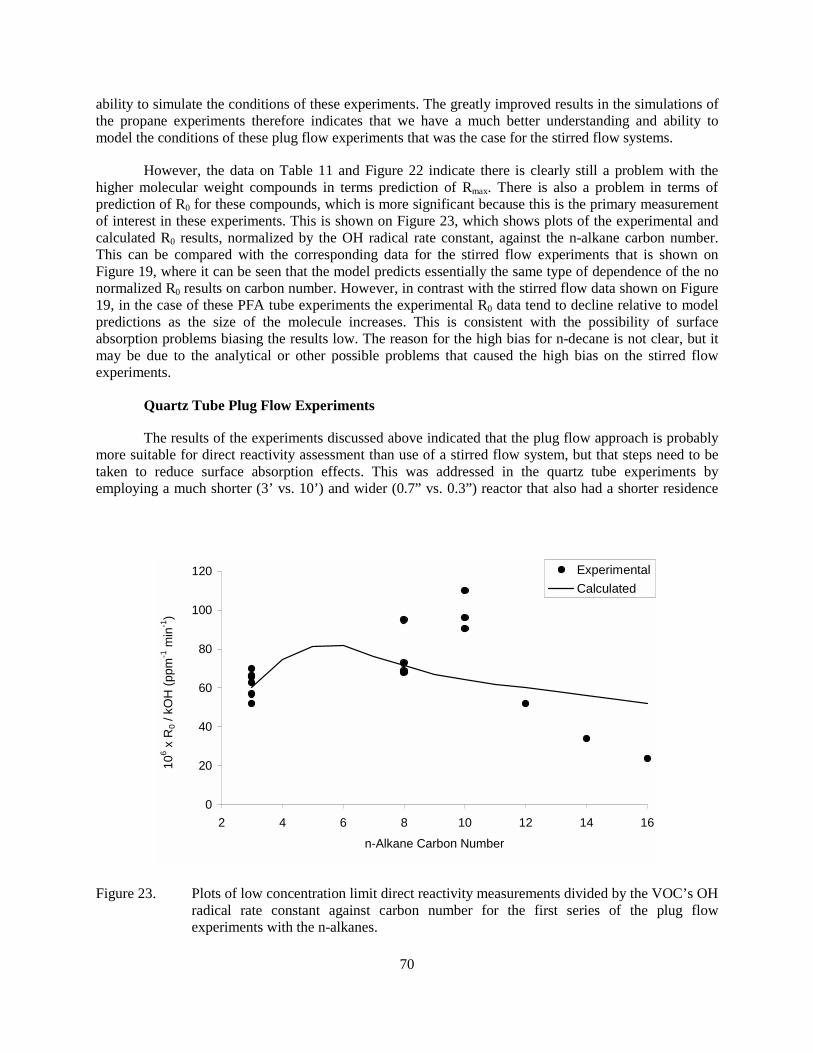
70
ability to simulate the conditions of these experiments. The greatly improved results in the simulations of the propane experiments therefore indicates that we have a much better understanding and ability to model the conditions of these plug flow experiments that was the case for the stirred flow systems.
However, the data on Table 11 and Figure 22 indicate there is clearly still a problem with the higher molecular weight compounds in terms prediction of Rmax. There is also a problem in terms of prediction of R0 for these compounds, which is more significant because this is the primary measurement of interest in these experiments. This is shown on Figure 23, which shows plots of the experimental and calculated R0 results, normalized by the OH radical rate constant, against the n-alkane carbon number. This can be compared with the corresponding data for the stirred flow experiments that is shown on Figure 19, where it can be seen that the model predicts essentially the same type of dependence of the no normalized R0 results on carbon number. However, in contrast with the stirred flow data shown on Figure 19, in the case of these PFA tube experiments the experimental R0 data tend to decline relative to model predictions as the size of the molecule increases. This is consistent with the possibility of surface absorption problems biasing the results low. The reason for the high bias for n-decane is not clear, but it may be due to the analytical or other possible problems that caused the high bias on the stirred flow experiments.
Quartz Tube Plug Flow Experiments
The results of the experiments discussed above indicated that the plug flow approach is probably more suitable for direct reactivity assessment than use of a stirred flow system, but that steps need to be taken to reduce surface absorption effects. This was addressed in the quartz tube experiments by employing a much shorter (3’ vs. 10’) and wider (0.7” vs. 0.3”) reactor that also had a shorter residence
0
20
40
60
80
100
120
2 4 6 8 10 12 14 16n-Alkane Carbon Number
106 x
R0 /
kO
H (p
pm-1
min
-1)
ExperimentalCalculated
Figure 23. Plots of low concentration limit direct reactivity measurements divided by the VOC’s OH radical rate constant against carbon number for the first series of the plug flow experiments with the n-alkanes.
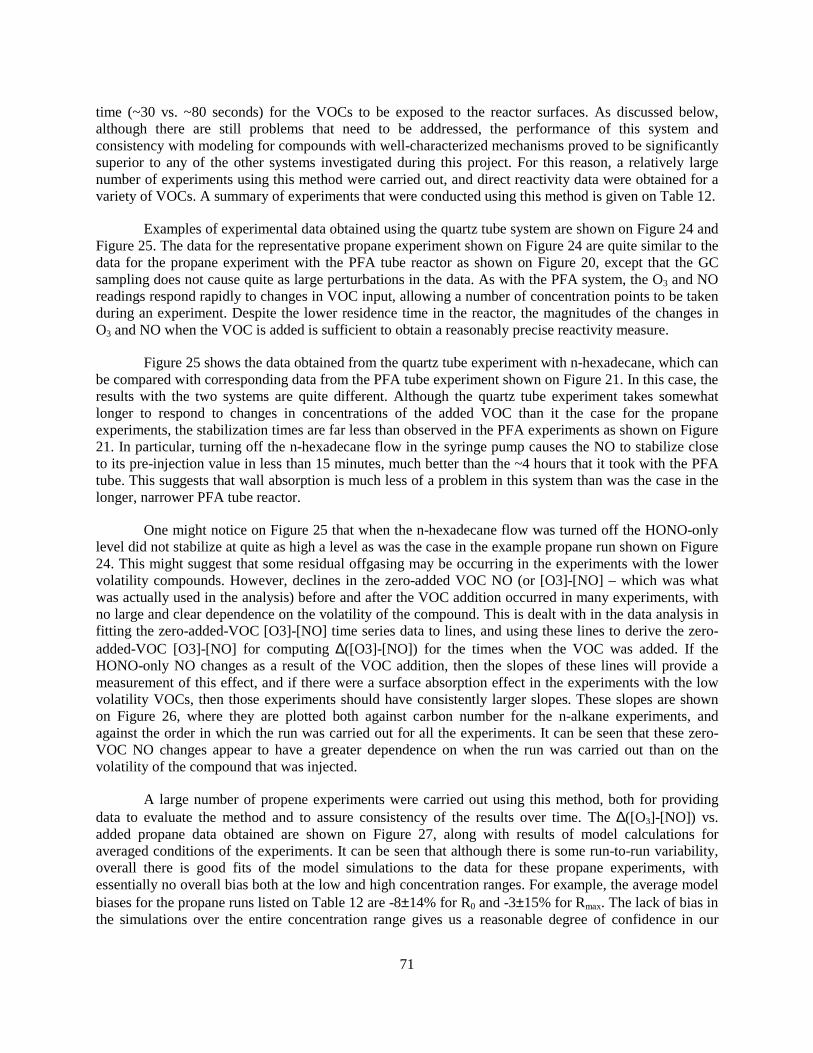
71
time (~30 vs. ~80 seconds) for the VOCs to be exposed to the reactor surfaces. As discussed below, although there are still problems that need to be addressed, the performance of this system and consistency with modeling for compounds with well-characterized mechanisms proved to be significantly superior to any of the other systems investigated during this project. For this reason, a relatively large number of experiments using this method were carried out, and direct reactivity data were obtained for a variety of VOCs. A summary of experiments that were conducted using this method is given on Table 12.
Examples of experimental data obtained using the quartz tube system are shown on Figure 24 and Figure 25. The data for the representative propane experiment shown on Figure 24 are quite similar to the data for the propane experiment with the PFA tube reactor as shown on Figure 20, except that the GC sampling does not cause quite as large perturbations in the data. As with the PFA system, the O3 and NO readings respond rapidly to changes in VOC input, allowing a number of concentration points to be taken during an experiment. Despite the lower residence time in the reactor, the magnitudes of the changes in O3 and NO when the VOC is added is sufficient to obtain a reasonably precise reactivity measure.
Figure 25 shows the data obtained from the quartz tube experiment with n-hexadecane, which can be compared with corresponding data from the PFA tube experiment shown on Figure 21. In this case, the results with the two systems are quite different. Although the quartz tube experiment takes somewhat longer to respond to changes in concentrations of the added VOC than it the case for the propane experiments, the stabilization times are far less than observed in the PFA experiments as shown on Figure 21. In particular, turning off the n-hexadecane flow in the syringe pump causes the NO to stabilize close to its pre-injection value in less than 15 minutes, much better than the ~4 hours that it took with the PFA tube. This suggests that wall absorption is much less of a problem in this system than was the case in the longer, narrower PFA tube reactor.
One might notice on Figure 25 that when the n-hexadecane flow was turned off the HONO-only level did not stabilize at quite as high a level as was the case in the example propane run shown on Figure 24. This might suggest that some residual offgasing may be occurring in the experiments with the lower volatility compounds. However, declines in the zero-added VOC NO (or [O3]-[NO] – which was what was actually used in the analysis) before and after the VOC addition occurred in many experiments, with no large and clear dependence on the volatility of the compound. This is dealt with in the data analysis in fitting the zero-added-VOC [O3]-[NO] time series data to lines, and using these lines to derive the zero-added-VOC [O3]-[NO] for computing ∆([O3]-[NO]) for the times when the VOC was added. If the HONO-only NO changes as a result of the VOC addition, then the slopes of these lines will provide a measurement of this effect, and if there were a surface absorption effect in the experiments with the low volatility VOCs, then those experiments should have consistently larger slopes. These slopes are shown on Figure 26, where they are plotted both against carbon number for the n-alkane experiments, and against the order in which the run was carried out for all the experiments. It can be seen that these zero-VOC NO changes appear to have a greater dependence on when the run was carried out than on the volatility of the compound that was injected.
A large number of propene experiments were carried out using this method, both for providing data to evaluate the method and to assure consistency of the results over time. The ∆([O3]-[NO]) vs. added propane data obtained are shown on Figure 27, along with results of model calculations for averaged conditions of the experiments. It can be seen that although there is some run-to-run variability, overall there is good fits of the model simulations to the data for these propane experiments, with essentially no overall bias both at the low and high concentration ranges. For example, the average model biases for the propane runs listed on Table 12 are -8±14% for R0 and -3±15% for Rmax. The lack of bias in the simulations over the entire concentration range gives us a reasonable degree of confidence in our
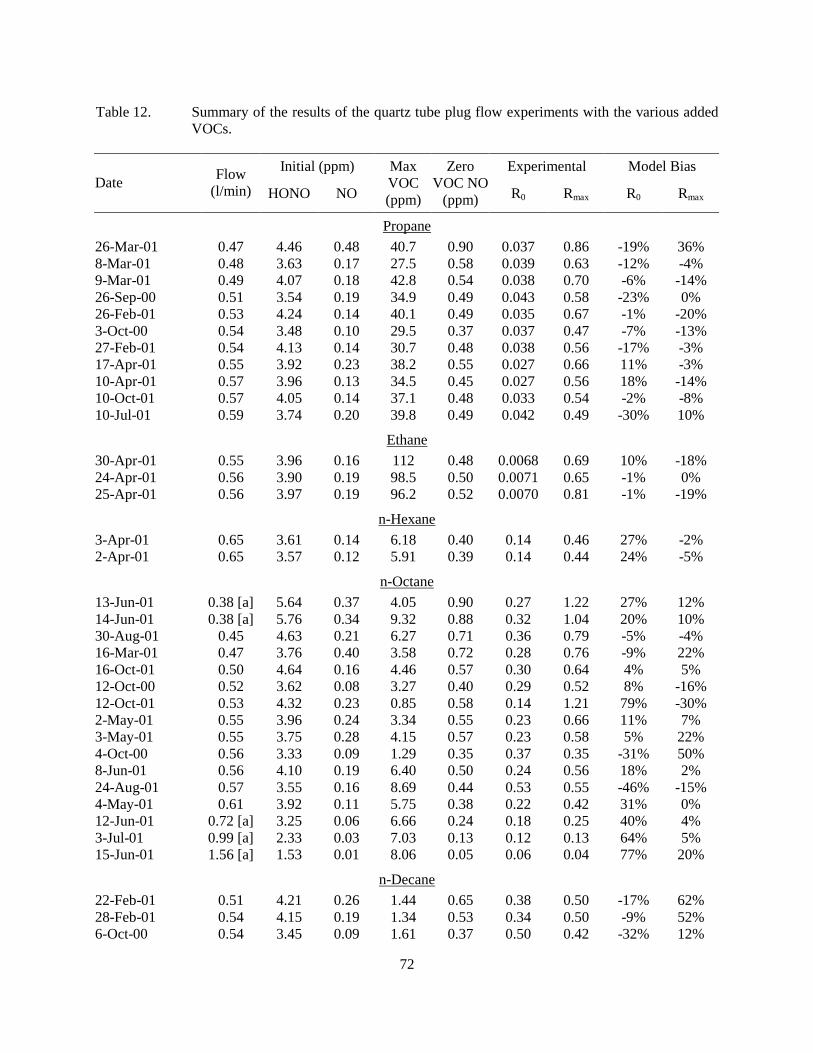
72
Table 12. Summary of the results of the quartz tube plug flow experiments with the various added VOCs.
Initial (ppm) Experimental Model Bias Date Flow
(l/min) HONO NO
Max VOC (ppm)
Zero VOC NO
(ppm) R0 Rmax R0 Rmax
Propane 26-Mar-01 0.47 4.46 0.48 40.7 0.90 0.037 0.86 -19% 36% 8-Mar-01 0.48 3.63 0.17 27.5 0.58 0.039 0.63 -12% -4% 9-Mar-01 0.49 4.07 0.18 42.8 0.54 0.038 0.70 -6% -14% 26-Sep-00 0.51 3.54 0.19 34.9 0.49 0.043 0.58 -23% 0% 26-Feb-01 0.53 4.24 0.14 40.1 0.49 0.035 0.67 -1% -20% 3-Oct-00 0.54 3.48 0.10 29.5 0.37 0.037 0.47 -7% -13% 27-Feb-01 0.54 4.13 0.14 30.7 0.48 0.038 0.56 -17% -3% 17-Apr-01 0.55 3.92 0.23 38.2 0.55 0.027 0.66 11% -3% 10-Apr-01 0.57 3.96 0.13 34.5 0.45 0.027 0.56 18% -14% 10-Oct-01 0.57 4.05 0.14 37.1 0.48 0.033 0.54 -2% -8% 10-Jul-01 0.59 3.74 0.20 39.8 0.49 0.042 0.49 -30% 10%
Ethane 30-Apr-01 0.55 3.96 0.16 112 0.48 0.0068 0.69 10% -18% 24-Apr-01 0.56 3.90 0.19 98.5 0.50 0.0071 0.65 -1% 0% 25-Apr-01 0.56 3.97 0.19 96.2 0.52 0.0070 0.81 -1% -19%
n-Hexane 3-Apr-01 0.65 3.61 0.14 6.18 0.40 0.14 0.46 27% -2% 2-Apr-01 0.65 3.57 0.12 5.91 0.39 0.14 0.44 24% -5%
n-Octane 13-Jun-01 0.38 [a] 5.64 0.37 4.05 0.90 0.27 1.22 27% 12% 14-Jun-01 0.38 [a] 5.76 0.34 9.32 0.88 0.32 1.04 20% 10% 30-Aug-01 0.45 4.63 0.21 6.27 0.71 0.36 0.79 -5% -4% 16-Mar-01 0.47 3.76 0.40 3.58 0.72 0.28 0.76 -9% 22% 16-Oct-01 0.50 4.64 0.16 4.46 0.57 0.30 0.64 4% 5% 12-Oct-00 0.52 3.62 0.08 3.27 0.40 0.29 0.52 8% -16% 12-Oct-01 0.53 4.32 0.23 0.85 0.58 0.14 1.21 79% -30% 2-May-01 0.55 3.96 0.24 3.34 0.55 0.23 0.66 11% 7% 3-May-01 0.55 3.75 0.28 4.15 0.57 0.23 0.58 5% 22% 4-Oct-00 0.56 3.33 0.09 1.29 0.35 0.37 0.35 -31% 50% 8-Jun-01 0.56 4.10 0.19 6.40 0.50 0.24 0.56 18% 2% 24-Aug-01 0.57 3.55 0.16 8.69 0.44 0.53 0.55 -46% -15% 4-May-01 0.61 3.92 0.11 5.75 0.38 0.22 0.42 31% 0% 12-Jun-01 0.72 [a] 3.25 0.06 6.66 0.24 0.18 0.25 40% 4% 3-Jul-01 0.99 [a] 2.33 0.03 7.03 0.13 0.12 0.13 64% 5% 15-Jun-01 1.56 [a] 1.53 0.01 8.06 0.05 0.06 0.04 77% 20%
n-Decane 22-Feb-01 0.51 4.21 0.26 1.44 0.65 0.38 0.50 -17% 62% 28-Feb-01 0.54 4.15 0.19 1.34 0.53 0.34 0.50 -9% 52% 6-Oct-00 0.54 3.45 0.09 1.61 0.37 0.50 0.42 -32% 12%

Table 12 (continued)
73
Initial (ppm) Experimental Model Bias Date Flow
(l/min) HONO NO
Max VOC (ppm)
Zero VOC NO
(ppm) R0 Rmax R0 Rmax
n-Dodecane 28-Sep-00 0.51 3.49 0.20 1.07 0.47 0.53 0.46 -30% 48% 29-Sep-00 0.51 3.30 0.22 1.40 0.46 0.35 0.74 5% -13%
n-Tridecane 19-Oct-00 0.52 3.65 0.14 1.32 0.42 0.56 0.41 -21% 43%
n-Tetradecane 5-Oct-00 0.54 3.38 0.11 1.74 0.35 0.64 0.33 -19% 33%
n-Pentadecane 18-Oct-00 0.52 3.61 0.18 1.56 0.46 0.61 0.43 [c] 2-Mar-01 0.52 4.25 0.26 7.18 0.55 0.11 0.60 [b] 1-Mar-01 0.52 4.35 0.21 2.08 0.53 0.59 0.33 [c]
n-Hexadecane 27-Sep-00 0.50 3.59 0.19 1.82 0.47 0.63 0.49 -2% 22% 26-Sep-00 0.51 3.57 0.19 1.04 0.49 [d]
Carbon Monoxide 13-Mar-01 0.48 3.62 0.37 292 0.69 0.0038 0.74 -33% 7% 14-Mar-01 0.49 3.50 0.44 299 0.75 0.0039 0.70 -38% 20%
2,2,4-Trimethylpentane (iso-octane) 19-Apr-01 0.56 3.82 0.22 12.6 0.52 0.101 0.61 86% 1% 18-Apr-01 0.56 3.81 0.22 40.0 0.52 0.103 0.66 98% -9%
Methyl Ethyl Ketone 31-Aug-01 0.51 4.03 0.22 11.26 0.59 0.050 0.86 -16% -36% 12-Sep-01 0.59 3.92 0.20 16.67 0.50 0.051 0.57 -28% -16%
Ethyl Acetate 22-Mar-01 0.46 4.86 0.27 28.9 0.74 0.090 0.67 -34% 0% 21-Mar-01 0.46 4.73 0.39 16.0 0.83 0.103 0.63 -44% 17% 23-Mar-01 0.47 4.75 0.32 27.5 0.77 0.075 0.69 -22% 1%
Propene 11-Jul-01 0.59 3.74 0.21 8.46 0.50 0.49 0.54 38% -4%
Benzene 13-Apr-01 0.57 4.01 0.14 30.9 0.48 0.017 0.47 127% 3% 11-Apr-01 0.57 3.91 0.19 35.6 0.50 0.013 0.46 182% 14%
Toluene 27-Mar-01 0.57 4.01 0.17 0.58 0.49 0.22 0.60 [b] 28-Mar-01 0.58 3.84 0.18 9.15 0.49 0.094 0.45 83% 11% 30-Mar-01 0.59 3.79 0.23 5.84 0.53 0.091 0.52 70% 13%
Table 12 (continued)
74
Initial (ppm) Experimental Model Bias Date Flow
(l/min) HONO NO
Max VOC (ppm)
Zero VOC NO
(ppm) R0 Rmax R0 Rmax
1,3,5-Trimethylbenzene 23-Jul-01 0.55 4.07 0.22 4.72 0.54 1.13 0.66 26% -14% 20-Jul-01 0.57 3.94 0.19 3.66 0.47 0.80 0.57 74% -9%
[a] Flow rate deliberately varied to assess its effects. [b] The data for this run appear to be anomalous and the results should not be used for model evaluation. [c] The R0 derived from the data for this experiment indicates a much better fit to the model than one
would expect from the experimental and calculated data for the individual data points, as shown on Figure 31. This is an artifact resulting from the parameterization in Equation V used to derive R0 and Rmax, the fact that the data do not cover a wide concentration range, and the scatter in the data points. Therefore, the R0 and Rmax derived for these experiments should not be used for model evaluation purposes.
[d] The lowest concentration point rejected because of inconsistency between calculated amount injected and measured value, and inconsistency with data from the other experiment. Only a single data point remained, so R0 and Rmax could not be derived. The remaining data point was consistent with the results of the other n-hexadecane experiment (see Figure 31, below).
ability to use model simulations of these data for mechanism evaluation, at least for VOCs such as propane that are easy to handle and monitor.
The replicate propane experiments provide useful controls for the purpose of assuring consistency of conditions as well as for method evaluation, which is why a relatively large number of such runs were carried out. For this reason, after 3/23/01, the general experimental procedure was modified so that propane injections at two different standard concentrations, ~7 ppm and ~40 ppm, were made in conjunction with most experiments to obtain standard low and high concentration propane data for control and characterization purposes. The ~7 ppm level was chosen to be sufficiently low that its ∆([O3]-[NO]) measurement can provide an approximate indication of the low-added-VOC incremental reactivity parameter R0 (while not being so low it is difficult to measure with precision), and the ~40 ppm level is sufficiently high that its ∆([O3]-[NO]) provide a good approximation to Rmax. The results of these control experiments (together with the data for these standard concentrations for the propane-only experiments listed on Table 12) are summarized on Table 13. Again the overall bias in the model simulations of these data was low, with the average biases being 3±16% and 4±6% for the low and high concentration, respectively.
Table 13 shows that there is some run-to-run variability in the results of the standard propane measurements, and this variability is also reflected in the measurements shown on Figure 27. The principal reason for this appears to be variations in the reactor flow, as is shown on Figure 28, which gives plots of both the low and high standard propane ∆([O3]-[NO]) measurements against reactor flow rates. Note that the in some experiments the flows were deliberately varied in order to assess the effects of flow. The top plots include the data obtained in the full range of conditions, while the bottom plots show only the standard and low flow experiments so the flow effects on the standard experiments can be seen more clearly.

75
NO (ppm)
O3 (ppm) (Raw data -- note zero offset)
Propane (ppm)
Time after lights on (min)
Con
cent
ratio
n (p
pm)
0.00
0.25
0.50
-60 0 60 120 180 240
Lights on Propane on -- amount variedLights
off
0.05
0.10
0.15
0.20
-60 0 60 120 180 240
Continuous dataLogged data used in the analysisTimes changes made
0
10
20
30
40
-60 0 60 120 180 240
Figure 24. NO, O3, and propane data from the representative HONO + propane quartz tube plug flow run carried out on 2/27/01. Steps in NO and O3 data show effects of changing added propane levels
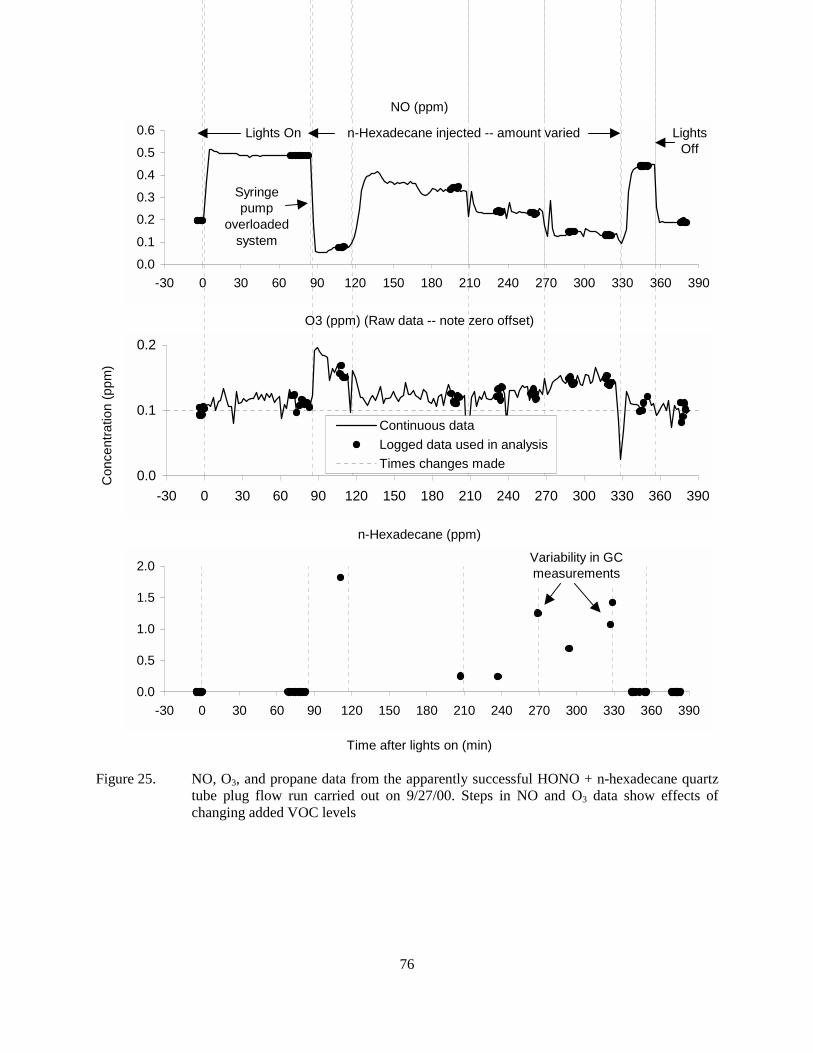
76
NO (ppm)
O3 (ppm) (Raw data -- note zero offset)
n-Hexadecane (ppm)
Time after lights on (min)
Con
cent
ratio
n (p
pm)
0.0
0.1
0.20.3
0.4
0.5
0.6
-30 0 30 60 90 120 150 180 210 240 270 300 330 360 390
Lights On n-Hexadecane injected -- amount varied LightsOff
Syringepump
overloadedsystem
0.0
0.1
0.2
-30 0 30 60 90 120 150 180 210 240 270 300 330 360 390
Continuous dataLogged data used in analysisTimes changes made
0.0
0.5
1.0
1.5
2.0
-30 0 30 60 90 120 150 180 210 240 270 300 330 360 390
Variability in GCmeasurements
Figure 25. NO, O3, and propane data from the apparently successful HONO + n-hexadecane quartz tube plug flow run carried out on 9/27/00. Steps in NO and O3 data show effects of changing added VOC levels
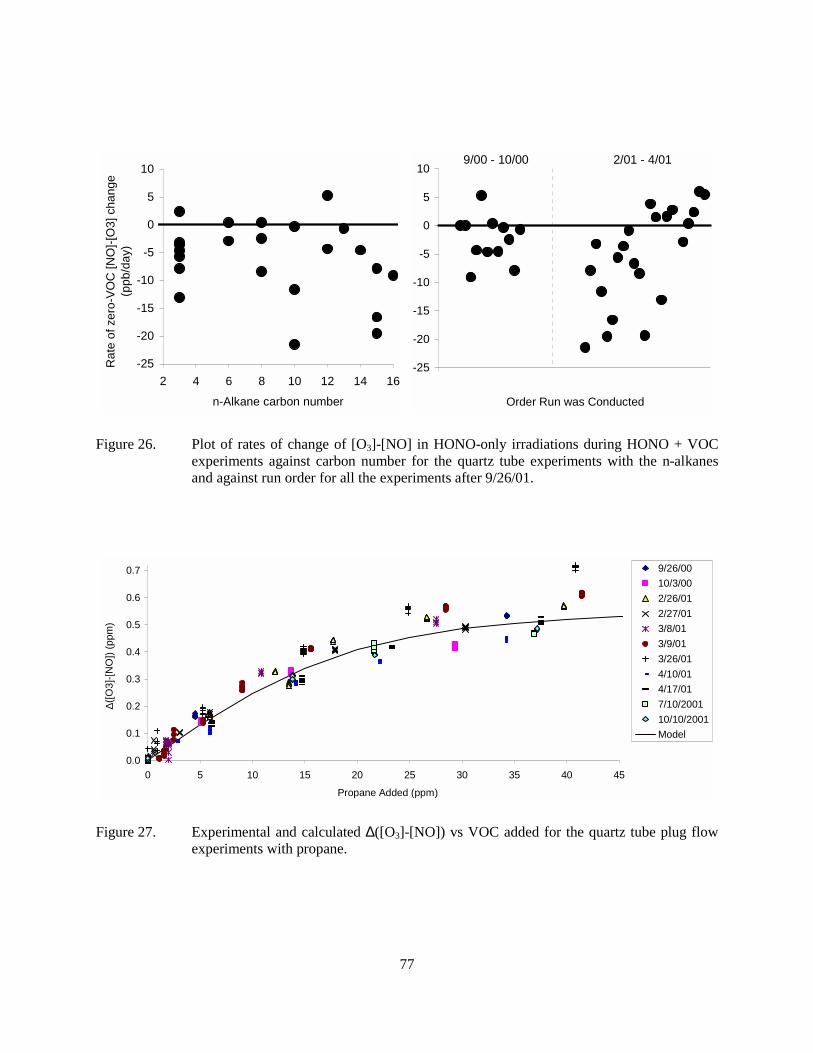
77
-25
-20
-15
-10
-5
0
5
10
2 4 6 8 10 12 14 16
n-Alkane carbon number
Rat
e of
zer
o-VO
C [N
O]-[
O3]
cha
nge
(ppb
/day
)
-25
-20
-15
-10
-5
0
5
10
Order Run was Conducted
9/00 - 10/00 2/01 - 4/01
Figure 26. Plot of rates of change of [O3]-[NO] in HONO-only irradiations during HONO + VOC experiments against carbon number for the quartz tube experiments with the n-alkanes and against run order for all the experiments after 9/26/01.
0.0
0.1
0.2
0.3
0.4
0.5
0.6
0.7
0 5 10 15 20 25 30 35 40 45
Propane Added (ppm)
∆([O
3]-[N
O])
(ppm
)
9/26/0010/3/002/26/012/27/013/8/013/9/013/26/014/10/014/17/017/10/200110/10/2001Model
Figure 27. Experimental and calculated ∆([O3]-[NO]) vs VOC added for the quartz tube plug flow experiments with propane.
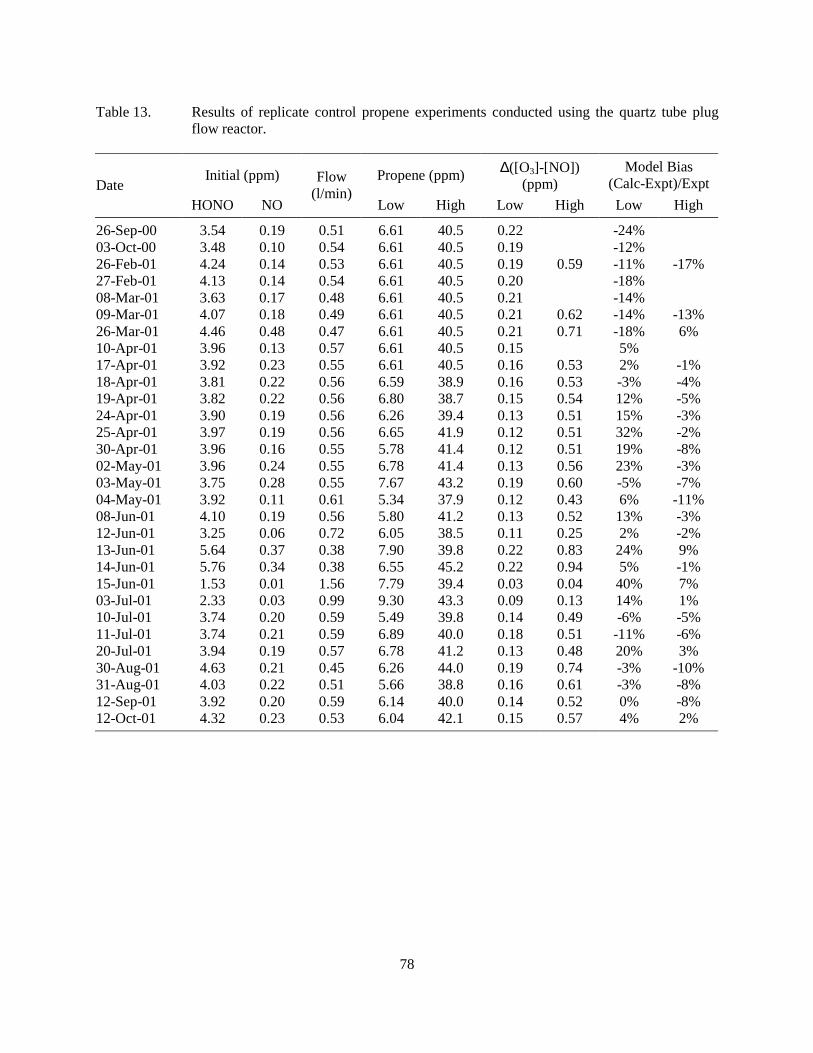
78
Table 13. Results of replicate control propene experiments conducted using the quartz tube plug flow reactor.
Initial (ppm) Propene (ppm) ∆([O3]-[NO]) (ppm)
Model Bias (Calc-Expt)/Expt Date
HONO NO
Flow (l/min)
Low High Low High Low High
26-Sep-00 3.54 0.19 0.51 6.61 40.5 0.22 -24% 03-Oct-00 3.48 0.10 0.54 6.61 40.5 0.19 -12% 26-Feb-01 4.24 0.14 0.53 6.61 40.5 0.19 0.59 -11% -17% 27-Feb-01 4.13 0.14 0.54 6.61 40.5 0.20 -18% 08-Mar-01 3.63 0.17 0.48 6.61 40.5 0.21 -14% 09-Mar-01 4.07 0.18 0.49 6.61 40.5 0.21 0.62 -14% -13% 26-Mar-01 4.46 0.48 0.47 6.61 40.5 0.21 0.71 -18% 6% 10-Apr-01 3.96 0.13 0.57 6.61 40.5 0.15 5% 17-Apr-01 3.92 0.23 0.55 6.61 40.5 0.16 0.53 2% -1% 18-Apr-01 3.81 0.22 0.56 6.59 38.9 0.16 0.53 -3% -4% 19-Apr-01 3.82 0.22 0.56 6.80 38.7 0.15 0.54 12% -5% 24-Apr-01 3.90 0.19 0.56 6.26 39.4 0.13 0.51 15% -3% 25-Apr-01 3.97 0.19 0.56 6.65 41.9 0.12 0.51 32% -2% 30-Apr-01 3.96 0.16 0.55 5.78 41.4 0.12 0.51 19% -8% 02-May-01 3.96 0.24 0.55 6.78 41.4 0.13 0.56 23% -3% 03-May-01 3.75 0.28 0.55 7.67 43.2 0.19 0.60 -5% -7% 04-May-01 3.92 0.11 0.61 5.34 37.9 0.12 0.43 6% -11% 08-Jun-01 4.10 0.19 0.56 5.80 41.2 0.13 0.52 13% -3% 12-Jun-01 3.25 0.06 0.72 6.05 38.5 0.11 0.25 2% -2% 13-Jun-01 5.64 0.37 0.38 7.90 39.8 0.22 0.83 24% 9% 14-Jun-01 5.76 0.34 0.38 6.55 45.2 0.22 0.94 5% -1% 15-Jun-01 1.53 0.01 1.56 7.79 39.4 0.03 0.04 40% 7% 03-Jul-01 2.33 0.03 0.99 9.30 43.3 0.09 0.13 14% 1% 10-Jul-01 3.74 0.20 0.59 5.49 39.8 0.14 0.49 -6% -5% 11-Jul-01 3.74 0.21 0.59 6.89 40.0 0.18 0.51 -11% -6% 20-Jul-01 3.94 0.19 0.57 6.78 41.2 0.13 0.48 20% 3% 30-Aug-01 4.63 0.21 0.45 6.26 44.0 0.19 0.74 -3% -10% 31-Aug-01 4.03 0.22 0.51 5.66 38.8 0.16 0.61 -3% -8% 12-Sep-01 3.92 0.20 0.59 6.14 40.0 0.14 0.52 0% -8% 12-Oct-01 4.32 0.23 0.53 6.04 42.1 0.15 0.57 4% 2%

79
Low Propane High Propane
0.00
0.05
0.10
0.15
0.20
0.25
0.30
0.0 0.5 1.0 1.5 2.0Reactor Flow (liters/min)
∆([O
3]-[N
O])
(ppm
)
0.0
0.2
0.4
0.6
0.8
1.0
0.0 0.5 1.0 1.5 2.0Reactor Flow (liters/min)
∆([O
3]-[N
O])
(ppm
)
Experimental - pre 3/27/01Experimental - post 3/27/01Calculated
0.10
0.14
0.18
0.22
0.40 0.45 0.50 0.55 0.60Reactor Flow (liters/min)
∆([O
3]-[N
O])
(ppm
)
0.4
0.5
0.6
0.7
0.8
0.40 0.45 0.50 0.55 0.60Reactor Flow (liters/min)
∆([O
3]-[N
O])
(ppm
)
Figure 28. Plots of experimental and calculated ∆([O3]-[NO]) in the standard propane irradiations in the quartz tube against the reactor flow rate. The top plots show the full range of the data, the bottom plots shows the more restricted range where runs with deliberately increased or reduced flows are excluded.
It can be seen that variations in the reactor flow affect both the low and high propane results, which means that they will affects measurements both of R0 and Rmax, though other factors also affect variability of the data for the experiments carried out in the standard flow range. Figure 28 shows that the model performs quite well in predicting the dependence of both the low and high propane reactivity results on reactor flow, with no systematic biases being observed either at the high or low flow range.
Although in general the model fits the propane reactivity data reasonably well, there does appear to be a consistent bias in the model towards underpredicting the reactivity in the low propene experiments carried out prior to 3/27/01. This is indicated on Figure 28 by use of different symbols for the experiments carried out before and after that date. On 3/27/01, hopcalite was added to the pure air system to remove CO, which prior to that has been present in the input air in the 1-2 ppm concentration range. Although this CO change was represented in the model simulations of these runs and the effects of the background CO

80
on the reactivity results was predicted to be small, the average bias in the model predictions of standard low propene reactivity data changed from -16±4% before the change to 9±13% afterwards. The reason for this ~25% change in the average bias is unknown. However, the biases are relatively small compared to what was seen in the simulations of the previous experiments discussed above, and are probably within the overall uncertainty of the measurement.
Variations in the flow also have significant effect on the amount of NO formed when HONO is photolyzed by itself, as is shown on Figure 29. The figure shows that the model simulates these data very well, though there is a small negative bias, averaging 11±4%. In contrast with the results of the simulations of the standard low propene reactivity results, there is no difference in the model bias between the experiments before and after the pure air system was upgraded on 3/27/01. This is despite the fact that one would expect that background air impurities to have much greater effects on the results of the HONO irradiations than on incremental changes caused by adding test VOCs.
Figure 30 and Figure 31 show plots of the ∆([O3]-[NO]) vs. added VOC data for the various quartz tube experiments with the n-alkanes (other than propane, which is shown on Figure 27, above), along with results of model calculations for averaged conditions of the experiments shown. It can be seen that reasonably good consistency was obtained in most of these experiments, even for runs n-tridecane, n-tetradecane, and n-hexadecane. However, the fits were not quite as good for the runs with n-pentadecane, and the data from one of the n-pentadecane experiments and a data point in the 9/26/00 n-hexadecane run were rejected because of inconsistency with the other data. Experimental difficulties in conducting the higher n-alkane runs are discussed further below.
Figure 32 shows a plot of the low-VOC incremental reactivity (R0) values derived from the data for the n-alkane experiments, normalized by the OH radical rate constants, against carbon number. This can be compared with similar plots obtained for the other types of experiments, as shown on Figure 19
Reactor Flow Rate (liters/min)
0.0
0.2
0.4
0.6
0.8
1.0
0.3 0.6 0.9 1.2 1.5
Zero
Add
ed V
OC
[NO
] (pp
m)
Experimental - pre 3/27/01Experimental - post 3/27/01Model
0.25
0.50
0.75
0.4 0.5 0.6 0.7
Figure 29. Plots of experimental and calculated NO in the HONO-only irradiations in the quartz tube experiments against reactor flow rate. The left plot shows the full range of the data, the right plot shows the more restricted range where runs with deliberately increased and reduced flows are excluded.

81
Ethane n-Hexane
0.0
0.1
0.2
0.3
0.4
0.0 2.0 4.0 6.0
4/3/20014/2/2001Model
0.0
0.1
0.2
0.3
0.4
0.5
0 30 60 90 120
4/24/20014/25/20014/30/2001Model
n-Octane n-Decane
N-C8
0.0
0.1
0.2
0.3
0.4
0.5
0.6
0 1 2 3 4 5 6
10/4/20003/16/20015/2/20015/3/20015/4/2001Model
0.0
0.1
0.2
0.3
0.4
0.0 0.5 1.0 1.5 2.0
10/6/002/22/012/28/01Series4
n-Dodecane n-Tridecane and n-Tetradecane
∆([O3]-[NO]) vs Added VOC (ppm)
0.0
0.1
0.2
0.3
0.4
0.0 0.5 1.0 1.5
9/28/20009/29/00Model
0.0
0.1
0.2
0.3
0.4
0.0 0.5 1.0 1.5
10/19/00 (n-C13)10/5/00 (n-C14)n-C13 Modeln-C14 Model
Figure 30. Experimental and calculated ∆([O3]-[NO]) vs VOC added for the quartz tube plug flow experiments with ethane, n-hexane, n-octane, n-decane, n-tridecane and n-tetradecane.
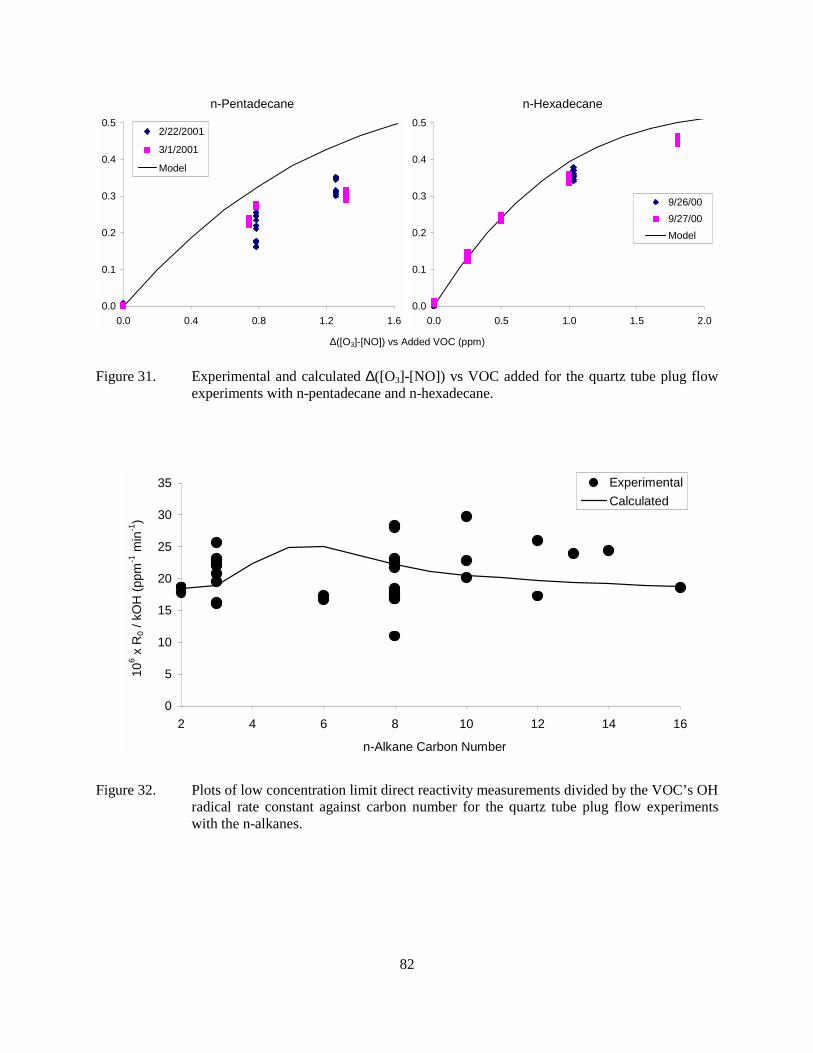
82
n-Pentadecane n-Hexadecane
∆([O3]-[NO]) vs Added VOC (ppm)
0.0
0.1
0.2
0.3
0.4
0.5
0.0 0.4 0.8 1.2 1.6
2/22/2001
3/1/2001
Model
0.0
0.1
0.2
0.3
0.4
0.5
0.0 0.5 1.0 1.5 2.0
9/26/009/27/00Model
Figure 31. Experimental and calculated ∆([O3]-[NO]) vs VOC added for the quartz tube plug flow experiments with n-pentadecane and n-hexadecane.
0
5
10
15
20
25
30
35
2 4 6 8 10 12 14 16
n-Alkane Carbon Number
106 x
R0 /
kO
H (p
pm-1
min
-1)
ExperimentalCalculated
Figure 32. Plots of low concentration limit direct reactivity measurements divided by the VOC’s OH radical rate constant against carbon number for the quartz tube plug flow experiments with the n-alkanes.

83
and Figure 23. It is interesting to note that the model predicts much less of decline in the measured direct reactivity / OH rate constant ratio with carbon number than predicted for the other experiments. This is attributed to the shorter residence time in the reactor as discussed below. It can also be seen that, in contrast with the results of the stirred flow experiments shown on Figure 19 and the PFA tube experiment shown on Figure 23, there is no consistent increase in negative or positive bias with the low volatility or high molecular weight compounds. This indicates that, when everything is operating properly, this quartz tube plug flow method should be suitable for providing useful direct reactivity measurements for low volatility compounds.
However, it should be noted that essentially all of the apparently successful experiments with the C12 or higher n-alkanes were in the first series of quartz tube experiments carried out during the fall of 2000, and attempts conduct additional and replicate experiments with these compounds during the second phase of experiments in 2001 were generally unsuccessful. Either the syringe pump did not deliver measurable amounts of the test compound into the reactor, or the measured amounts were inconsistent with amount calculated from the flow rate of the syringe pump, or the measurements were variable and unreliable. Although some apparently successful n-decane experiments were carried out during this period, the only other experiments where potentially useable data were obtained were those with n-pentadecane, where the reactivity measurements were low compared to the previous data with n-dodecane and n-hexadecane experiments conducted in the fall of 2000, and also compared to model calculations. This is despite the fact that the results of the standard propane experiments continued to be consistent with the previous data and model predictions.
Attempts were made during the later periods of this project to improve the performance and reliability of the syringe pump for injecting low volatility compounds, but progress was slow because difficulties with the GC analyses for these compounds. In particular, the GC analyses for the low volatility compounds was time consuming and give variable and relatively imprecise results, requiring many replicates (see, for example, the n-hexadecane data shown on Figure 25). Therefore, it was decided to focus on developing a total VOC analysis method that could be used to evaluate low volatility VOC injection methods on a continuous basis and greater precision. If successful, a sufficiently sensitive and reliable total VOC analysis method should remove the need to analyze the test compounds by chromatography, which would significantly reduce the cost and time required to conduct the measurements. The development of this method began during the period of this report and is continuing as part of a follow-on project (CARB contract 00-333, Carter, 2001) that will be discussed in a subsequent report. Therefore, it was decided not to attempt additional evaluations with low-volatility compounds or complex mixtures (which also require syringe pump injection) until progress was made in this regard.
For this reason, the major effort during the second phase of quartz tube experiments in 2001 was to obtain direct reactivity data compounds that can be reliably injected using prepared gas cylinders, to obtain additional high-quality data needed for method and mechanism evaluation. In addition to experiments needed to fill out the data for the homologous n-alkanes, experiments were conducted for other classes of compounds, including a representative branched alkane and olefin, and two representative oxygenates and three representative aromatics. Such data are needed to assess the performance of the method on a wider variety of compounds, as well as for obtaining potentially useful mechanism evaluation data for such compounds.
The data obtained for these other classes of compounds are shown on Figure 33 and Figure 34, which give plots of experimental and calculated ∆([O3]-[NO]) results against the amount of VOC added. As with the previous such figures, the modeling results shown are for averaged conditions of the various experiments shown (except for propene, where only a single successful experiment was conducted), with

84
Carbon Monoxide 2,2,4-Trimethylpentane
0.0
0.1
0.2
0.3
0.4
0.5
0.6
0 100 200 300
3/14/20013/13/2001Model
0.0
0.1
0.2
0.3
0.4
0.5
0.6
0.7
0 10 20 30 40
4/19/20014/18/2001Model
0.0
0.2
0.4
0.6
0 4 8
Methyl Ethyl Ketone Ethyl Acetate
∆([O3]-[NO]) vs Added VOC (ppm)
0.0
0.1
0.2
0.3
0.4
0.5
0.6
0.7
0 10 20 30 40
3/22/20013/21/20013/23/2001Model
0.0
0.1
0.2
0.3
0.4
0.5
0 5 10 15 20
8/31/20019/12/2001Model
Propene Benzene
∆([O3]-[NO]) vs Added VOC (ppm)
0.0
0.1
0.2
0.3
0.4
0.5
0 10 20 30 40
4/11/20014/13/2001Model
0.0
0.1
0.2
0.3
0.4
0.5
0.6
0 3 6 9
7/11/2001Model
Figure 33. Experimental and calculated ∆([O3]-[NO]) vs VOC added for the quartz tube plug flow experiments with carbon monoxide, 2,2,4-trimethyl-pentane, methyl ethyl ketone, ethyl acetate, propene, and benzene.

85
Toluene 1,3,5-Trimethylbenzene
∆([O3]-[NO]) vs Added VOC (ppm)
0.0
0.1
0.2
0.3
0.4
0.5
0 2 4 6 8 10
3/27/20013/28/20013/30/2001Model
0.0
0.1
0.2
0.3
0.4
0.5
0.6
0.7
0 1 2 3 4 5
7/20/2001
7/23/2001
Model
Figure 34. Experimental and calculated ∆([O3]-[NO]) vs VOC added for the quartz tube plug flow experiments with toluene, and 1,3,5-trimethylbenzene.
-67%
-33%
0%
33%
67%
100%
133%
167%
200%
CO
Etha
ne
Prop
ane
(avg
)
n-H
exan
e
n-O
ctan
e (a
vg.)
n-D
ecan
e
n-C
12
n-C
13
n-C
14
n-C
16
Iso-
Oct
ane
Ethy
l Ace
tate
MEK
Prop
ene
Benz
ene
Tolu
ene
1,3,
5-TM
B
Rct
Mod
el B
ias
(Cal
c - E
xpt)
/ Exp
t
Figure 35. Summary of model biases for model simulations of the low-added-VOC incremental reactivities (R0) for the various VOCs studied in the quartz tube plug flow experiments. Experimental results of individual experiments are shown for all compounds except propane and n-octane, where averages, standard deviations, extreme values are shown.

86
the results of the run-specific simulations being given on Table 12, above. The model biases in the run-specific simulations of the low-added-VOC incremental reactivity, R0, are also shown on Figure 35, where the variation in model performance in simulating the direct reactivities for the various classes of compounds can be readily seen.
Although in most cases there is no indication of experimental problems in studies of these compounds and (except for one toluene run) generally consistent results were obtained, the results indicate considerable variability in model performance in simulating the experiments with the different types of VOCs. Although there were moderate negative biases in simulating the incremental reactivities of CO, methyl acetate, and methyl ethyl ketone, and a positive bias of similar magnitude in simulating the incremental reactivity of propene, the biases were not significantly outside the variability observed in modeling the experiments with the homologous n-alkanes. However, significant positive biases, probably outside the range of variability of the method, are seen in the simulations of the direct reactivities of 2,2,4-trimethylbenzene and the aromatics, especially benzene. This suggests that there may be problems with the mechanisms of these compounds that need to be addressed in future mechanism development projects. However, a discussion of needs for mechanism improvements for specific classes of VOCs is beyond the scope of this report.
Modeling Evaluation of Direct Reactivity Measurements
In the previous sections, we discussed the alternative approaches for obtaining reactivity data using the various HONO – VOC photolysis systems from an experimental perspective, and the extent to which the data obtained were reasonable and consistent with model predictions. In this section, we discuss the results of a modeling analysis to assess actual potential utility and implications of these measurements, assuming that all the experimental and characterization difficulties can be eventually be addressed. This includes an assessment of the sensitivities of these experimental measurements to various aspects of VOC’s reaction mechanisms, and how these sensitivities differ in environmental chamber experiments and calculated atmospheric reactivities. This is necessary to evaluate the extent to which these experiments actually provide better measure of direct reactivity than environmental chamber experiments, and the extent to which the other aspects of the mechanisms, such as the radical sources and sinks, affect these results. The relationship between direct reactivity measurements obtained using these measurements and other measures of reactivity, such as atmospheric incremental reactivities and atmospheric reaction rates, are also investigated. An understanding of this is necessary in order to understand how to properly interpret and use the results of these experiments, we be successful in developing a method that can be routinely be used in practice.
Modeling Method and Scenarios
This evaluation consisted primarily of comparing results of calculations of incremental reactivities of various mechanisms and VOCs in different scenarios representing atmospheric or experimental simulations. These included EKMA atmospheric model scenarios designed to conditions used to derive the MIR, MOIR and EBIR scales, environmental chamber scenarios representing the three major types of environmental chamber experiments we have been using for mechanism evaluation, and scenarios representing the continuous flow HONO + VOC experiments carried out for this project. The latter are based on the conditions of the stirred flow carboy experiments carried out during the first period of the project, and the quartz tube plug flow experiments that were carried out during the latter period. Although better success was obtained in the experiments with the quartz tube, it is also of interest to see how the reactivity results may differ if stirred flow method is used. The scenarios employed are summarized on Table 14

87
Table 14. Summary of model scenarios used in the reactivity measurement modeling evaluation.
Designation Representing Input Details
Atm. MIR Relatively high NOx atmospheric conditions where VOCs have their highest incremental reactivities (Carter, 1994a).
Atm. MOIR Moderate NOx atmospheric conditions most favorable to ozone formation (Carter, 1994a).
Atm. EBIR Lower NOx atmospheric conditions where NOx control and VOC control are equally effective in reducing ozone (Carter, 1994a).
Averaged conditions MIR, MOIR, and EBIR scenario of Carter (1994a) used. Detailed input data given by Carter (1994b).
High NOx Mini-Surg
Environmental chamber experiments using relatively high NOx levels and the 3-component “mini-surrogate”. Most sensitive to radical termination/initiation effects (Carter et al, 1995)
Initial NOx = 0.5 ppm = 80% NO and 20% NO2; initial surrogate = 5.5 ppmC; NO2 photolysis rate = 0.39 min-1; 6-hour irradiation, chamber model for early DTC experiments (Carter, et al, 1995, Carter, 2000). Static experiment with dilution rate of 0.3%/hour. Each ppmC of mini-surrogate consists of 87 ppb n-hexane, 142 ppb ethene, and 25 ppb m-xylene.
High NOx Full Surg
Environmental chamber experiments using relatively high NOx levels and the 8-component “full surrogate” designed to better represent realistic VOC atmospheric mixtures. Gives best correlation to atmospheric reactivity (Carter et al, 1995).
Same as above except 4 ppmC of full surrogate employed. Each ppmC of full surrogate consists of 92 ppb n-butane, 22 ppb n-octane, 18 ppb ethene, 13 ppb propene, 13 ppb trans-2-butene, 20 ppb toluene, 19 ppb m-xylene, and 24 ppb formaldehyde.
Low NOx Full Surg
Environmental chamber experiments using relatively low NOx levels and the 8-component “full surrogate”. Useful for testing mechanisms under NOx-limited conditions. (Carter et al, 1995).
Same as above except 185 ppb NOx used.
Stirred Flow HONO
Conditions of the experiments with the 50-liter carboy that were carried out during the initial stages of this project.
Reactor flow/volume = 0.1 min-1; initial HONO = 0.67 ppm; initial NOx = 0.67 ppb = 90% HONO, 5% NO, 5% NO2; NO2 photolysis rate = 0.59 min-1[a]. Calculated for low amount of VOC added to yield incremental reactivity (R0).
Plug Flow HONO
Conditions of the experiments with the quartz tube reactor that were carried out during the final stages of this project.
Reactor residence time = 30 sec; initial NOx = 0.67 ppb = 90% HONO, 5% NO, 5% NO2; NO2 photolysis rate = 0.59 min-1. Calculated for low amount of VOC added to yield incremental reactivity (R0).
[a] Although the actual carboy experiments had a higher light intensity, for comparison purposes the stirred flow simulation scenario employed the same light intensity as used for the plug flow scenario.

88
The measures of reactivity that were calculated depended on the type of scenarios, but in all cases provided a measure of the effects of the test VOCs or model species on ozone formation potential. These measures are summarized on Table 15. Note that for the atmospheric and flow simulations the measures used are in terms of true incremental reactivities, i.e., reflect the effects of small additions of the VOCs. This is how the MIR and other atmospheric incremental reactivity scales is derived, and can be obtained experimentally in the HONO flow experiments by fitting the data to the empirical relationship shown in Equation (V) to get the low-VOC-added incremental reactivity parameter R0. However, since it is not practical to measure true incremental reactivities in environmental chamber experiments, the environmental chamber reactivities are derived for additions of finite amounts of the test compound in approximately the concentration ranges that would be used in actual experiments. In all cases the reactivity measures derived are reported in terms of moles ozone formation potential per mole of VOC added or emitted (for incremental reactivities) or per mole VOC reacted (for mechanistic reactivities).
Assessment of Sensitivities to Mechanism Components
As discussed first by Carter and Atkinson (1989), the effects of various aspects of a VOC’s reaction mechanism on its overall reactivity can be assessed by conducting model simulations of reactivities of various “pure mechanism” species that represent only a single aspect of a VOC’s mechanism. The mechanism aspects considered and the reactions of the pure mechanism species used to assess them are indicated on Table 16.
Table 17 gives the mechanistic reactivities calculated for representative pure mechanism species for the experimental and atmospheric reactivity scenarios being examined. Note that mechanistic reactivities are ozone formation potentials (as given in Table 15), relative to the amount of the test VOC reacted, and thus normalizes out to some extent reactivity effects of the VOC’s reaction rates. However, mechanistic reactivities still depend somewhat on the rate at which the model species react, particularly those reflecting radical effects or product formation, which tend to increase with increasing rates of reaction. The mechanistic reactivities on Table 17 are calculated for an OH rate constant of 3 x 10⁴ ppm-1 min-1, or 2 x 10-11 cm3 molec-1 s-1. This is a relatively high rate constant and thus gives relatively high sensitivities for radical effects.
The mechanistic reactivities shown on Table 17 indicate the sensitivities of the various experiments or atmospheric scenarios to the various aspects of the mechanisms. The table shows that the sensitivities to NO to NO2 conversions (direct reactivities) vary much less from scenario to scenario than is the case for the sensitivities to the other mechanism aspects, though they tend to decline in the lower NOx scenarios because of the reduced efficiency for O3 formation from NOx. Thus in this regard, the HONO experiments are not significantly more sensitive to as the chamber experiments or the atmospheric scenarios, particularly those at the higher NOx levels. The significant difference, however, is the sensitivities in the HONO experiments to radical sources and sink processes, which, though not entirely negligible, are significantly lower than in the chamber or atmospheric scenarios. The “direct / radical” ratio is a useful indication of extent to which the experiment can provide unambiguous information about direct reactivities under high NOx conditions, where it can be seen to be quite high in the HONO experiments compared to the other experiments or scenarios. This is why the HONO experiments are useful for evaluating direct mechanism effects.
It is interesting to note that the plug flow experiment is calculated to be a much better measure of direct reactivity than the stirred flow system, primarily because it has less sensitivity to radical sources and sinks. This could be because of the higher HONO levels used in the quartz tube plug flow system as carried out in this study, compared to the levels used in the stirred flow experiments, rather than being a
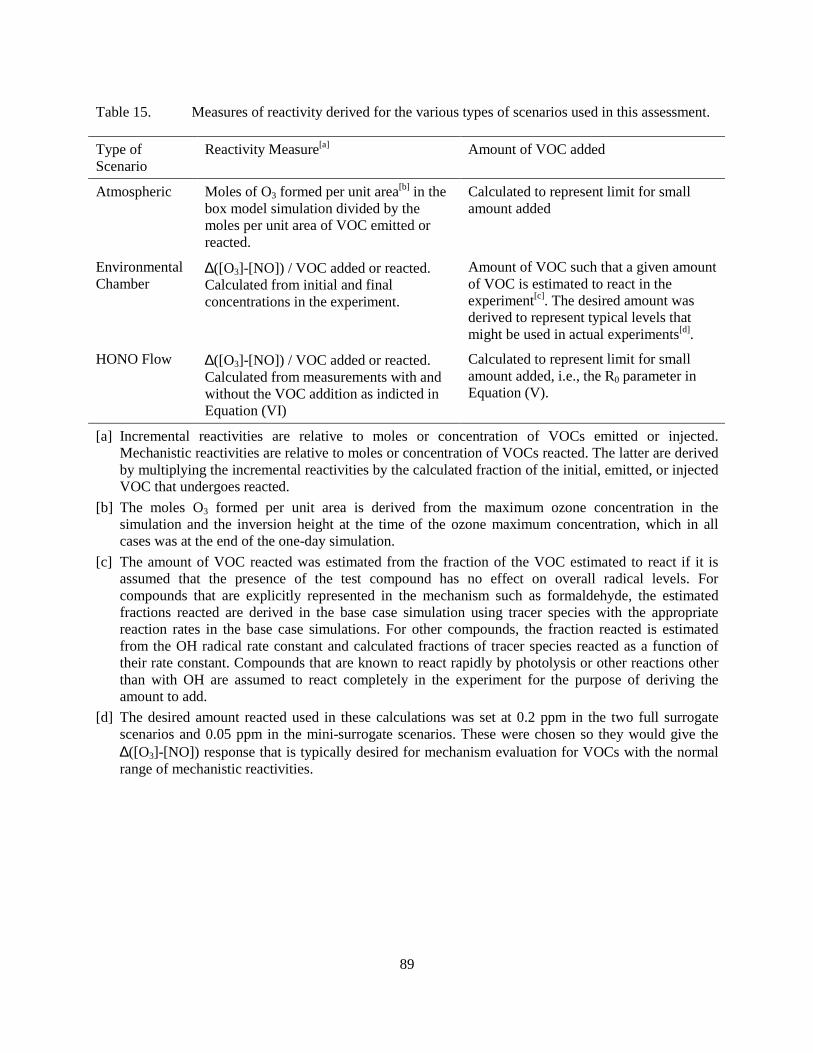
89
Table 15. Measures of reactivity derived for the various types of scenarios used in this assessment.
Type of Scenario
Reactivity Measure[a] Amount of VOC added
Atmospheric Moles of O3 formed per unit area[b] in the box model simulation divided by the moles per unit area of VOC emitted or reacted.
Calculated to represent limit for small amount added
Environmental Chamber
∆([O3]-[NO]) / VOC added or reacted. Calculated from initial and final concentrations in the experiment.
Amount of VOC such that a given amount of VOC is estimated to react in the experiment[c]. The desired amount was derived to represent typical levels that might be used in actual experiments[d].
HONO Flow ∆([O3]-[NO]) / VOC added or reacted. Calculated from measurements with and without the VOC addition as indicted in Equation (VI)
Calculated to represent limit for small amount added, i.e., the R0 parameter in Equation (V).
[a] Incremental reactivities are relative to moles or concentration of VOCs emitted or injected. Mechanistic reactivities are relative to moles or concentration of VOCs reacted. The latter are derived by multiplying the incremental reactivities by the calculated fraction of the initial, emitted, or injected VOC that undergoes reacted.
[b] The moles O3 formed per unit area is derived from the maximum ozone concentration in the simulation and the inversion height at the time of the ozone maximum concentration, which in all cases was at the end of the one-day simulation.
[c] The amount of VOC reacted was estimated from the fraction of the VOC estimated to react if it is assumed that the presence of the test compound has no effect on overall radical levels. For compounds that are explicitly represented in the mechanism such as formaldehyde, the estimated fractions reacted are derived in the base case simulation using tracer species with the appropriate reaction rates in the base case simulations. For other compounds, the fraction reacted is estimated from the OH radical rate constant and calculated fractions of tracer species reacted as a function of their rate constant. Compounds that are known to react rapidly by photolysis or other reactions other than with OH are assumed to react completely in the experiment for the purpose of deriving the amount to add.
[d] The desired amount reacted used in these calculations was set at 0.2 ppm in the two full surrogate scenarios and 0.05 ppm in the mini-surrogate scenarios. These were chosen so they would give the ∆([O3]-[NO]) response that is typically desired for mechanism evaluation for VOCs with the normal range of mechanistic reactivities.

90
Table 16. Hypothetical “pure mechanisms” used to assess different aspects of a VOC’s mechanism on incremental reactivities in various experimental or atmospheric systems.
Mechanism Aspect Mechanism [a] Note
NO to NO2 conversions OH + R(HO2.) → HO2. OH + R(R2O2.) → R2O2. OH + P(R2O2.) → OH + R2O2.
[b] [c]
Nitrate formation from RO2 + NO OH + R(RO2-N.) → RO2-N. [d] Pure radical termination OH + R(null) → Pure radical initiation OH + P(OH) → 2 OH Formation of product Pi OH + P(Pi) → OH + Pi
[a] Given in terms of species in the SAPRC-99 mechanism. Note that RO2-R. is the chemical “operator” representing the effects of formation of peroxy radicals that convert NO to NO2 and generate HO2, R2O2. is the operator that represents the extra NO to NO2 conversions caused by additional formation of peroxy radicals in multi-step mechanisms, and RO2-N. is the operator that represents the effects of formation of peroxy radicals that react with NO to form organic nitrates.
[b] The NO to NO2 conversion comes from the subsequent reaction of HO2 with NO to form NO2 and regenerate OH radicals. This is its major sink in the presence of NO2.
[c] This represents the effects of two NO to NO2 conversions, the first from the reaction of RO2-R. with NO to form HO2, and the second from the reaction of HO2 as indicated above.
[d] This process causes one NO conversion as well as radical termination. Although NO2 is not generated, from the kinetic differential equations for the NOx - O3 system, it is actually the loss of NO that causes the O3 to increase.
stirred flow vs. plug flow effect. It could also be related to the longer residence times in the stirred flow system, as discussed below. This has not been fully investigated.
Table 17 also shows the sensitivities of the experiments and scenarios to formation of selected representative types of products. The stirred flow HONO system is seen to be significantly more sensitive to product formation than is the case for the plug flow system, though it is still less sensitive than seen in the high NOx chamber experiments, which in turn are less sensitive that the atmospheric scenarios. The relatively low sensitivity of the HONO system to methyl glyoxal and formaldehyde, which are the most significant products in terms of impacts in the high NOx chamber and atmospheric scenarios, is because these are strong radical source species, and the HONO system is relatively sensitive to radical sources. The HONO system is relatively more sensitive to those products, such as propionaldehyde and the higher ketones, that cause additional NO to NO2 conversions when they react.
Some of the differences in sensitivities to product formations can be explained by the differences between the scenarios in the extent of reaction of the added VOCs. These differences can be clearly seen in Figure 36, which shows the dependence of fractions of VOCs reacting against their OH radical rate constant (for VOCs that react only with OH) in the various relatively high NOx experiments or scenarios. It can be seen that for a VOC with the same rate constant, the amount reacting is significantly lower in the plug flow HONO experiment than is the case in the stirred flow system, primarily because of the shorter residence time. This means that less product formation occurs when the test compound is reacting, so their subsequent reactions would have less of an effect on the system. Likewise, the amounts reacted in

91
Table 17. Mechanistic reactivities calculated for different mechanism components for the various types of reactivity assessment experiments or atmospheric reactivity scenarios.
Mechanistic Reactivities (moles O3 impact / mole species reacted)
Type of Mechanism [a] Plug Flow
HONO
Stirred Flow
HONO
High NOx Mini-Surg.
High NOx Full
Surg.
Low NOx Full
Surg.
Atm. MIR
Atm. MOIR
Atm. EBIR
NO to NO2 Conversions [b] 0.91 0.70 0.58 0.62 0.38 1.25 0.59 0.44 Nitrate formation [c] 0.81 1.50 -8.54 -1.25 -1.20 -3.81 -1.25 -1.53 Pure Radical Sink -0.10 -0.31 -9.14 -1.29 -1.63 -8.47 -2.47 -1.08 Pure Radical Source 0.12 0.32 6.01 2.96 -0.26 8.53 2.35 1.05 Direct / Radical [d] 8.2 2.2 0.08 0.3 0.4 0.15 0.2 0.4
Product Formation Reactivities Methyl Glyoxal 0.17 1.15 3.73 2.61 -0.36 14.87 4.41 2.47 Formaldehyde 0.05 0.34 1.19 0.99 0.05 3.53 1.03 0.54 Acetaldehyde 0.17 1.10 -0.39 0.26 -0.14 4.19 1.82 1.26 Propionaldehyde 0.22 1.55 -0.16 0.52 -0.16 6.12 2.60 1.74 Methyl Ethyl Ketone 0.00 0.06 0.08 0.09 0.00 0.30 0.14 0.10 Higher ketone products 0.14 1.67 0.16 0.33 0.09 4.14 2.20 1.41
[a] All have OH rate constant of 3 x 104 cm3 molec-1 s-1. [b] Average of mechanistic reactivities for pure species forming HO2 and R2O2. [c] Note that this reflects both a NO conversion and a radical sink process. [d] Ratio of mechanistic reactivity for NO to NO2 conversions to average of absolute values of pure
radical formation and sink mechanistic reactivities.
the chamber experiments are greater than in the MIR scenario, which explains why the product sensitivities are lower in the chamber than in the atmospheric scenario. This is a problem with using chamber data for evaluating aspects of mechanisms concerning effects of product formation on reactivity, as noted by Carter (2000).
It is interesting to note, however, that for VOCs that react with rate constants less than about 8 x 10⁻⁴ ppm-1 min-1 the amount reacted in the stirred flow HONO system is greater than in the high NOx full surrogate chamber experiment. Nevertheless, the stirred flow HONO experiment is still less sensitive to formation of methyl glyoxal and formaldehyde than is the case for the chamber experiment. This can be attributed to the lower sensitivity of the HONO system to radical sources, since as indicated above these are radical source species. On the other hand, the stirred flow HONO system is much more sensitive to the higher ketone and aldehyde products than is the chamber experiment, presumably because of the NO to NO2 conversions caused by the reactions of the additional amounts of these products that are formed. This suggests that stirred flow HONO experiments with long residence times may be useful for evaluating aspects of mechanisms regarding formation of reactive products that cause additional NO to NO2 conversions.
The short residence time plug flow experiments means that they are clearly not useful for testing aspects of the mechanism regarding product formation. While this is a disadvantage in this respect, it

92
0.0
0.2
0.4
0.6
0.8
1.0
0e+0 2e+4 4e+4 6e+4 8e+4 1e+5
OH Radical Rate Constant (ppm-1 min-1)
Frac
tion
of V
OC
reac
ting
(kin
etic
reac
tivity
)
MIRStirred Flow HONO
Plug Flow HONO
Chamber (Full Surrogate, High NOx)
Figure 36. Plots of the fraction of the VOC reacting in the simulation against the OH radical rate constants for various high NOx experiments or scenarios.
means that these experiments provide a more straightforward and unambiguous test of the mechanism of the starting VOC itself. Once this is established, this mechanism can be used in evaluations against data from other experiments that are more sensitive to product formation. With the initial mechanism better established, the mechanism for the products can be more unambiguously evaluated using experiments that are more sensitive to them.
Comparisons of Experimental and Atmospheric Reactivity Measures Figure 37 and Figure 38 show plots of the atmospheric incremental reactivities in the MIR scale against incremental reactivities (i.e, R0) calculated to be obtained from the plug flow or stirred flow HONO experiments for all the VOCs that are separately represented in the SAPRC-99 mechanism (Carter, 2000). In addition, Figure 39 shows plots of the OH radical rate constants for the VOCs against the calculated results of the two types of HONO experiments, and Figure 40 shows a plot of the calculated results of the two types of experiments against each other.
The data on Figure 37 and Figure 38 show that measuring the direct reactivities in these HONO flow experiments is clearly not the same as measuring the reactivities in the atmospheres, since significant scatter is seen, especially for the more reactive species. This is as expected, since as discussed above the atmospheric reactivities depend on both direct and indirect effects, and these experiments are designed primarily for evaluating mechanisms for direct effects. Thus the direct reactivity experiments cannot be used to estimate atmospheric reactivities in the absence of other data or (lacking that) in the absence of mechanistic judgments or estimates as to the other aspects of the mechanisms that are not being evaluated using these experiments. However, the log plots on the figures show that the direct reactivity experiments can be useful for obtaining an indication of the magnitudes of the atmospheric reactivities, particularly for slowly reacting compounds.
Since the rate at which a VOC reacts is probably the most important single factor affecting its direct reactivity, one would expect the results of direct reactivity experiments to be useful in providing an

93
Plug Flow ∆([O3]-[NO]) / [VOC] (R0, mole basis)
0
10
20
30
40
0.0 0.5 1.0 1.5 2.0
Atm
osph
eric
MIR
(mol
es O
3 / m
ole
VOC
)Alkanes, alcohols, esters, etc. AlkenesAromatics Aldehydes, other photoreactivesPhenols, benzaldehyde, etc. Others
0.001
0.01
0.1
1
10
100
0.0001 0.01 1 100
Figure 37. Plot of atmospheric incremental reactivities in the MIR scale against calculated incremental reactivities for the plug flow HONO experiments for all the separately represented model species in the SAPRC-99 mechanism.
Stirred Flow ∆([O3]-[NO]) / [VOC] (R0, mole basis)
0
10
20
30
40
0.0 1.0 2.0 3.0 4.0
Atm
osph
eric
MIR
(mol
es O
3 / m
ole
VOC
)
Alkanes, alcohols, esters, etc. AlkenesAromatics Aldehydes, other photoreactivesPhenols, benzaldehyde, etc. Others
0.001
0.01
0.1
1
10
100
0.001 0.01 0.1 1 10
Figure 38. Plot of atmospheric incremental reactivities in the MIR scale against calculated incremental reactivities for the stirred flow HONO experiments for all the separately represented model species in the SAPRC-99 mechanism.

94
Plug Flow ∆([O3]-[NO]) / [VOC] (R0, mole basis) Stirred Flow ∆([O3]-[NO]) / [VOC] (R0, mole basis)
0.0e+0
5.0e+4
1.0e+5
1.5e+5
2.0e+5
2.5e+5
3.0e+5
0.0 0.5 1.0 1.5 2.0
OH
Rad
ical
Rat
e C
onst
ant (
ppm
-1 m
in-1
)Alkanes, alcohols, esters, etc. AlkenesAromatics Aldehydes, other photoreactivesPhenols, benzaldehyde, etc. OthersLine fit to data for kOH < 5e+4
0.0e+0
5.0e+4
1.0e+5
1.5e+5
2.0e+5
2.5e+5
0.0 1.0 2.0 3.0 4.0
Figure 39. Plot of OH radical rate constant against calculated results of plug flow or stirred flow HONO experiments for all the separately represented model species in the SAPRC-99 mechanism.
Plug Flow ∆([O3]-[NO]) / [VOC] (R0, mole basis)
0
1
2
3
4
0.0 0.5 1.0 1.5 2.0
Stirr
ed F
low
∆([O
3]=[
NO
]) / [
VOC
](R
0, m
ole
basi
s)
Alkanes, alcohols, esters, etc. AlkenesAromatics Aldehydes, other photoreactivesPhenols, benzaldehyde, etc. Others
0.0
0.5
1.0
1.5
2.0
2.5
0.0 0.1 0.2 0.3 0.4 0.5
Figure 40. Comparison of model calculations of results of direct reactivity experiments using the plug flow and stirred flow methods for all the separately represented model species in the SAPRC-99 mechanism.
95
indication of this. The OH radical rate constant is probably the most important single factor determining how rapidly most VOCs react, particularly those for most stationary-source VOCs that are consumed primarily by reaction with OH. Figure 39 shows that the direct reactivity measurement using the short-residence-time plug flow method gives a very correlation with the OH radical rate constant for a wide variety of compounds, even alkenes. The good correlation for alkenes may seem surprising because they are also consumed in the atmosphere by reaction with O3, but the ozone levels are very low in the HONO experiments where the amount of added VOC is low, which is the condition used for determining its direct reactivity.
Figure 39 also shows that the incremental reactivities measured in the longer residence time stirred flow experiments do not give as good a correlation with the OH radical rate constant, particularly for the alkenes and some other highly reactive compounds. The poor correlation for alkenes cannot be attributed to the O3 reaction, since O3 is also not present as significant levels in those experiments when the amount of added VOC is low. It is interesting to note that in essentially all cases where there is poor correlation the calculated direct reactivity for the stirred flow experiment tends to be much less than predicted from the rate constant. Nevertheless, a log-log plot (not shown) indicates that these experiments can still give a good indication of the approximate magnitude of the reaction rate of the VOC, particularly for those that react very slowly.
Figure 40 shows that the calculated incremental reactivities for the two types of HONO flow experiments are well correlated for low reactivity (i.e., slowly reacting) compounds, but the correlation becomes less for the more rapidly reacting compounds. It can also be seen that there is significant curvature in the plots on Figure 40, particularly in the high concentration regime. These observations, and also the fact that the stirred flow results correlate more poorly with the OH rate constant at the higher rate constants, is due in large plot to the fact that significantly larger of the VOC undergoes reaction in the stirred flow system, as shown on Figure 36, above. As also shown on Figure 36, if a VOC reacts sufficiently rapidly, eventually the fraction reacted, and thus the response of the system to the effects of the VOCs reactions, becomes relatively insensitive to how rapidly it reacts. This is because such VOCs are nearly completely reacted in any case, so increasing its rate constant further does not increase how much reacts. For the stirred flow system, Figure 36 indicates that this “saturation” effect begins to occur at a rate constant of about 5 x 10⁴ ppm-1 min-1, which Figure 39 shows is about the rate constant range where the correlation with the stirred flow results tends to break down. Since the amounts reacted in the plug flow system is still relatively low for these compounds, the rate constant is still important in determining the amount reacted and thus the measured reactivity. This is the reason for the curvature shown on Figure 40.
Figure 36 suggests that there should be an almost linear relationship between the OH rate constant and the amount reacted, and thus the direct reactivity, for VOCs with rate constants less than about 8-10 x 104 ppm-1 min-1, and Figure 39 shows that this is indeed the case. This is why the R0 / kOH ratio for the higher n-alkanes is calculated to be relatively independent of the carbon number as shown on Figure 32, since the main difference between the mechanisms for the C8+ n-alkanes is their rate constants. This near-linear relationship is useful when applying this method to complex mixtures, because the measured direct reactivity would then give a good indication of the average OH rate constant of the components, especially if they all had similar mechanisms (as would be the case for petroleum distillates that are primarily mixtures of alkanes). The data from longer residence time experiments where the reactivity measure as not as sensitive to the OH rate constant would not be as useful in this regard, at least for mixtures of relatively rapidly reacting high molecular weight compounds.
96
CONCLUSIONS
Progress was made in this program towards its goals of developing improved experimental procedures to reduce uncertainties in mechanism evaluations for VOC reactivity assessments and in developing methods that can be applied to a wider variety of VOCs at lower costs. However, additional work is needed before these objectives will be achieved. Data were obtained to show that more precise measurements of effects of VOCs on radical levels in chamber experiments can be obtained if a more reactive radical tracer compound is used, but improvements are needed to our ability to model the reactions of the candidate tracer compounds for the data to reduce uncertainties in mechanism evaluation. It was shown that a plug flow HONO + VOC irradiation experiment can provide direct reactivity data that can supplement chamber data to reduce ambiguities in mechanism evaluations, and can potentially allow reactivity measurements to be made for classes of VOCs for which chamber experiments are unsuitable or difficult. However, improvements are needed to our ability to inject liquid VOC reactants and to readily and precisely analyze amounts of VOCs injected before this system can be widely used for reactivity assessments of low volatility compounds and complex mixtures. This is discussed further below.
Our ability to evaluate mechanisms of radical-inhibiting VOCs would be improved if we could measure integrated OH radical levels in environmental chamber reactivity experiments where radical levels are suppressed with a greater degree of precision. The standard environmental chamber reactivity experiments used in our laboratories for mechanism evaluation have used consumption rates of the base case ROG surrogate component m-xylene for measuring the integrated OH levels. Replacing this by 1,3,5-trimethylbenzene improves the precision of this integrated OH measurement, as expected due to its more rapid rate of reaction. However, it was found that the base case experiment using this modified ROG surrogate was not as well simulated by the model as the base experiments that employed m-xylene as the reactive aromatic. This results in a greater uncertainty in the use of the chamber data to evaluate the mechanism of the test compound than the imprecision in the measurement using the slower reacting tracer. Nevertheless, 1,3,5-trimethylbenzene appears to be the best candidate replacement tracer because the other alternatives either react with species other than OH, are more difficult to analyze with sufficient precision, or have even more uncertain mechanisms. Therefore, before more tests of effects of VOCs on radical levels in chamber experiments can be obtained, we will either need to improve the mechanism for 1,3,5-trimethylbenzene, or find an alternative rapidly reacting OH tracer compound that can be monitored precisely and whose use does not adversely affect our ability to model the base case experiment.
Experiments to measure the effects of VOCs on NO oxidation and O3 formation in HONO – air irradiations are potentially useful for obtaining a “direct reactivity” measurement that provide a valuable supplement to environmental chamber data for reducing ambiguity and uncertainty in chemical mechanism evaluations. Such experiments give data that are sensitive primarily to the rate at which the VOC reacts in the atmosphere and converts NO to NO2, which is the process that is responsible for ground-level ozone formation in the presence of NOx. HONO + VOC with very low reaction times such as obtained in plug flow systems with small volume reactors give the best indication of direct reactivity effects and the best correlations to atmospheric reaction rates, even for relatively rapidly reacting compounds. Experiments with longer reaction times such as obtained in stirred flow systems using larger volume reactors do not give as good an indication of direct reactivity effects, but are potentially useful for evaluating contributions of the VOC’s reactive product towards its total effect on NO to NO2 conversions.
The availability of a clean, reliable, and continuous source of HONO is needed in order for HONO irradiation experiments to be a practical and useful means for evaluating VOC reactivity. Fortunately, the method of Febo et al (1995), which involves forming HONO from the reactions of dilute HCl gas in humidified air passing through stirred NaNO2 salt, is well suited to this purpose. It performed

97
extremely well in generating at least 90% pure HONO at stable concentrations at the levels required for conducting direct reactivity experiments in either static or continuous reactive flow systems. This can be adapted to use either for HONO injections in static experiments or to provide a continuous and stable source of HONO for dynamic flow irradiation experiments. Care must be taken, however, not to overload the system in attempts to generate high concentrations of HONO for injection into large reactors, since breakthrough of HCl may occur. This is very undesirable because it may result in Cl atoms being generated in the irradiation experiment, which could react with the test VOC and give results that are not representative of normal atmospheric conditions. There was some evidence that this may have occurred in some experiments carried out for other projects, but sampling for chloride analysis indicated that this was not a problem for the experiments conducted for this project.
Although static irradiation systems can be used to obtain direct reactivity data in HONO + VOC irradiations, reactive flow experiments have a number of very significant advantages. It is easier to adapt to the output of HONO generators that produce HONO on a continuous basis and continuous flow experiments are better suited to use with low volatility compounds. In addition, continuous flow experiments can potentially give larger numbers of data points in a given amount of time, and have the greatest potential to be adapted for routine use at lower cost than environmental chamber experiments. They are also better suited for carrying out the low reaction time experiments that tend to give the most unambiguous measurements of direct reactivity effects. Based on this we concluded that some type of continuous flow method would be the best approach to achieve the objectives of this project.
Although the stirred flow approach was examined initially because it was felt that the larger reaction vessels might make it more suitable for use with low volatility VOCs, it was ultimately concluded to be unsatisfactory as currently employed. The main problem is that it did not give results that were consistent with model predictions. First, the ozone formed in experiments with large amounts of added VOCs was consistently much less than predicted by model calculations, even for compounds with well established mechanisms and no handling or analytical problems. Use of mechanical stirring and different types of reaction vessels did not significantly reduce this bias. In addition, experiments on the homologous n-alkanes did not yield the expected results in terms of effects of reactivity on molecule size. It is concluded that we are not correctly characterizing the stirred flow experiments for modeling, and until this problem is resolved such experiments cannot be used for mechanism evaluation.
On the other hand, results of the plug flow experiments were highly encouraging and suggested that this can provide a basis for a useful direct reactivity measurement for general VOC reactivity assessment. Test experiments on compounds with well-established mechanisms and no analytical or handling problems gave results that were quite consistent with model predictions, even when large variations were made to the flows through the reactor or the nature of the reactor itself. This suggests that we are appropriately representing both the chemistry and dynamics of this system, and thus the data should be suitable for mechanism evaluation. Although the initial tests indicated that use of a long and narrow tube as the reactor is probably not satisfactory for use with low volatility compounds, use of a 0.7” x 3’ quartz tube reactor was found to give results in good agreement with model predictions for the homologous n-alkanes through n-hexadecane. Since n-hexadecane has an estimated vapor pressure of only a few ppm at room temperature, experiments with this compound provides a good test of the utility of the system for studies of low volatility materials.
The plug flow system was also used to obtain direct reactivity data for a number of other compounds, including 2,2,5-trimethylpentane (iso-octane), and several representative oxygenates and aromatics. The results indicated the utility of the mechanism evaluation purposes. In particular, they suggest potentially significant problems with the mechanisms for the aromatics and iso-octane that will probably need to be addressed in future mechanisms updates. Although work on mechanism improvement

98
is beyond the scope of this project, the data obtained are clearly potentially useful for this purpose, and indicate that work is needed in this area.
Although the results of the plug flow experiments were encouraging, some significant experimental problems were encountered that will need to be resolved before this method can be widely used for low volatility compounds or complex mixtures such as petroleum distillates. Problems were encountered in reliably and reproducibly injecting and analyzing low volatility compounds in this system, and some of the earlier experiments conducted using the C10+ n-alkanes could not be successfully reproduced later in the program. Imprecisions and time required for GC analysis of the low volatility compounds proved to be the limiting factor in attempts to improve the injection method and obtain useful reactivity data for such compounds. It was concluded that it is necessary to integrate the system with an appropriate total carbon analysis method in order to more reliably and continuously monitor the amounts of gas-phase VOCs when carrying out such experiments.
Work was begun in developing a total carbon analysis method that can be integrated into plug flow HONO system, and this work is continuing as part of a currently ongoing project for the CARB (Carter, 2002). If a sufficiently sensitive and reliable total VOC analysis method can be developed as a result of this effort, it should remove the need to analyze the test compounds by chromatography, which would significantly reduce the cost and time required to obtain direct reactivity data. In addition, this would permit application of this method to complex mixtures such as petroleum distillates for which GC methods are not well suited. Once this work is complete we can use the system to improve the mechanism evaluation database for important VOCs, and develop procedures and analysis methods for using these data for reducing uncertainties in ozone reactivity estimates for VOCs for which no other experimental data are available.
99
REFERENCES
Atkinson, R. (1989): “Kinetics and Mechanisms of the Gas-Phase Reactions of the Hydroxyl Radical with Organic Compounds,” J. Phys. Chem. Ref. Data, Monograph no 1.
Atkinson, R. (1994): “Gas-Phase Tropospheric Chemistry of Organic Compounds,” J. Phys. Chem. Ref. Data, Monograph No. 2.
CARB (1993): “Proposed Regulations for Low-Emission Vehicles and Clean Fuels -- Staff Report and Technical Support Document,” California Air Resources Board, Sacramento, CA, August 13, 1990. See also Appendix VIII of “California Exhaust Emission Standards and Test Procedures for 1988 and Subsequent Model Passenger Cars, Light Duty Trucks and Medium Duty Vehicles,” as last amended September 22, 1993. Incorporated by reference in Section 1960.
CARB (2000): “Initial Statement of Reasons for the Proposed Amendments to the Regulation for Reducing Volatile Organic Compound Emissions from Aerosol Coating Products and Proposed Tables of Maximum Incremental Reactivity (MIR) Values, and Proposed Amendments to Method 310, ‘Determination of Volatile Organic Compounds in Consumer Products’,” California Air Resources Board, Sacramento, CA, May 5.
Carter, W. P. L. (2000): “Documentation of the SAPRC-99 Chemical Mechanism for VOC Reactivity Assessment,” Report to the California Air Resources Board, Contracts 92-329 and 95-308, May 8. Available at http://www.cert.ucr.edu/~carter/absts.htm#saprc99.
Carter, W. P. L. (2001): “Evaluation of Atmospheric Impacts of Selected Coatings Emissions,” Research Proposal to the California Air Resources Board, February 9, 2001. (Now funded. CARB contract 00-333).
Carter, W. P. L. (2002): “Development of a Next-Generation Environmental Chamber Facility for Chemical Mechanism and VOC Reactivity Research,” Draft Research Plan and First Progress Report to the United States Environmental Protection Agency Cooperative Agreement CR 827331-01-0. January 3.
Carter, W. P. L. and R. Atkinson (1987): “An Experimental Study of Incremental Hydrocarbon Reactivity,” Environ. Sci. Technol., 21, 670-679
Carter, W. P. L. and R. Atkinson (1989): “A Computer Modeling Study of Incremental Hydrocarbon Reactivity”, Environ. Sci. Technol., 23, 864.
Carter, W. P. L., and F. W. Lurmann (1990): “Evaluation of the RADM Gas-Phase Chemical Mechanism,” Final Report, EPA-600/3-90-001.
Carter, W. P. L. and F. W. Lurmann (1991): “Evaluation of a Detailed Gas-Phase Atmospheric Reaction Mechanism using Environmental Chamber Data,” Atm. Environ. 25A, 2771-2806.

100
Carter, W. P. L., J. A. Pierce, I. L. Malkina, D. Luo and W. D. Long (1993): “Environmental Chamber Studies of Maximum Incremental Reactivities of Volatile Organic Compounds,” Report to Coordinating Research Council, Project No. ME-9, California Air Resources Board Contract No. A032-0692; South Coast Air Quality Management District Contract No. C91323, United States Environmental Protection Agency Cooperative Agreement No. CR-814396-01-0, University Corporation for Atmospheric Research Contract No. 59166, and Dow Corning Corporation. April 1.
Carter, W. P. L., D. Luo, I. L. Malkina, and J. A. Pierce (1995a): “Environmental Chamber Studies of Atmospheric Reactivities of Volatile Organic Compounds. Effects of Varying ROG Surrogate and NOx,” Final report to Coordinating Research Council, Inc., Project ME-9, California Air Resources Board, Contract A032-0692, and South Coast Air Quality Management District, Contract C91323. March 24. Available at http://www.cert.ucr.edu/~carter/absts.htm#rct2rept.
Carter, W. P. L., D. Luo, I. L. Malkina, and D. Fitz (1995b): “The University of California, Riverside Environmental Chamber Data Base for Evaluating Oxidant Mechanism. Indoor Chamber Experiments through 1993,” Report submitted to the U. S. Environmental Protection Agency, EPA/AREAL, Research Triangle Park, NC., March 20. Available at http://www.cert.ucr.edu/ ~carter/absts.htm#databas.
Carter, W. P. L., D. Luo, and I. L. Malkina (1997): “Environmental Chamber Studies for Development of an Updated Photochemical Mechanism for VOC Reactivity Assessment,” Final report to the California Air Resources Board, the Coordinating Research Council, and the National Renewable Energy Laboratory, November 26. Available at http://www.cert.ucr.edu/~carter/absts.htm #rct3rept
Carter, W. P. L., D. Luo, and I. L. Malkina (2000a): “Investigation of the Ozone Formation Potentials of Exxsol® D95, Isopar-M®, and the Exxate® Fluids,” Draft Report to ExxonMobil Chemical Company, August 25, 2000.
Carter, W. P. L., D. Luo, and I. L. Malkina (2000b): “Investigation of the Atmospheric Ozone Formation Potentials of Selected C12 Normal And Cyclic Alkanes,” Draft Report to the Aluminum Association, October 31.
Carter, W. P. L., D. Luo, and I. L. Malkina (2000c): “Investigation of the Atmospheric Ozone Formation Potentials of Selected Branched Alkanes and Mineral Spirits Samples,” Draft Report to Safety-Kleen Corporation, August 18.
Dimitriades, B. (1999): “Scientific Basis of an Improved EPA Policy on Control of Organic Emissions for Ambient Ozone Reduction,” J. Air & Waste Manage. Assoc. 49, 831-838
Febo, A., C. Perrino, M. Gerardi and R. Sparapini (1995): "Evaluation of a High-Purity and High Stability Continuous Generation System for Nitrous Acid," Environ. Sci. Technol. 29, 2390-2395.
Ferm M. and Sjodin A. (1985): “A sodium carbonate coated denuder for the determination of nitrous acid in the atmosphere,” Atmos. Environ. 19, 979-983.
Jeffries, H. E., R. M. Kamens, K. G. Sexton, and A. A. Gerhardt (1982): “Outdoor Smog Chamber Experiments to Test Photochemical Models”, EPA-600/3-82-016a, April.
101
Jeffries, H. E., Sexton, K. G., Kamens, R. M. and Holleman, M. S. (1985): “Outdoor Smog Chamber Experiments to Test Photochemical Models: Phase II,” Final Report, EPA-600/3-85-029.
Jeffries, H. E., K. G. Sexton, J. R. Arnold, Y. Bai, J. L. Li, and R. Crouse (1990): “A Chamber and Modeling Study to Assess the Photochemistry of Formaldehyde,” Report on EPA Cooperative Agreement CR-813964, Atmospheric Research and Exposure Assessment Laboratory, EPA, Research Triangle Park, NC.
Johnson, G. M. (1983): “Factors Affecting Oxidant Formation in Sydney Air,” in “The Urban Atmosphere -- Sydney, a Case Study.” Eds. J. N. Carras and G. M. Johnson (CSIRO, Melbourne), pp. 393-408.
RRWG (1999): “VOC Reactivity Policy White Paper,” Prepared by the Reactivity Research Work Group Policy Team, October 1. Available at http://www.cgenv.com/Narsto/reactinfo.html.
Schwarzenbach, R. P., P. M. Gschwend, and D. M. Imboden (1993): “Environmental Analytical Chemsitry” John Wiley & Sons.
Zafonte, L., P. L. Rieger, and J. R. Holmes (1977): “Nitrogen Dioxide Photolysis in the Los Angeles Atmosphere,” Environ. Sci. Technol. 11, 483-487.