development and characterization of an extractive-based ... · pei-yu kuo doctor of philosophy...
TRANSCRIPT

Development and Characterization of an
Extractive-based Bio-Epoxy Resin from Beetle-Infested
Lodgepole Pine (Pinus contorta var. latifolia) Bark
By
Pei-Yu Kuo
A thesis submitted in conformity with the requirements for the degree of Doctor of Philosophy
Faculty of Forestry University of Toronto
© Copyright by Pei-Yu Kuo 2016

ii
Development and Characterization of an Extractive-based
Bio-Epoxy Resin from Beetle-Infested Lodgepole Pine
(Pinus contorta var. latifolia) Bark
Pei-Yu Kuo
Doctor of Philosophy
Faculty of Forestry
University of Toronto
2016
Abstract
Deriving chemicals from renewable feedstock has become a necessity to reduce dependency
on petroleum, which release carbon dioxide when burned and aggravate the global warming
and ocean acidification. This work offers a potential alternative - bark extractives based epoxy
resin - to petro-based conventional epoxy. Our results showed successful epoxidation of bark
extractives after reaction with epichlorohydrin. The newly synthesized epoxy (E-epoxy) can
replace 50% of petroleum-based epoxy (P-epoxy) and the blend system displayed thermal
stability and tensile strength comparable to neat P-epoxy, which demonstrates a great promise
in using bark extractives as a substitute for BPA.
An examination of reaction parameters showed that the E-epoxy monomer can be synthesized
with high yield and reactivity using spray-dried extractives as substrates, a dioxane/water
combination as solvent, and tetrabutylammonium hydroxide as the ring-opening catalyst. An
examination of numerical parameters showed the maximum yield with minimum epoxy
equivalent weight was achieved after 4.5 hours reaction time with sodium hydroxide to
hydroxyl value molar ratio of 3.4 at a reaction temperature of 80 °C. The thermal properties of
E-epoxy were studied using TGA, FTIR, and Py-GC/MS, and a new thermal degradation
mechanism was proposed.
Additionally, nanocellulose fibres (NCFs) were incorporated to enhance E-epoxy’s mechanical

iii
performance. Based on an adjusted curing schedule, an E-epoxy/P-epoxy/NCFs composite
with high strength, ductility, thermal stability, and sustainability was developed. With 10% E-
epoxy, the toughness of neat epoxy resins improved 84 %; after incorporating NCFs, the tensile
strength and modulus of composites increased approximately two- and four-fold, respectively.
The maximum degradation peak of the composites was 24 °C higher than for neat epoxy resins.
Overall, bark extractives exhibit great promise to replace petro-based BPA; incorporating
NCFs into E-epoxy/P-epoxy blending system is an effective method to develop a strong and
sustainable bio-nanocomposite.

iv
Acknowledgement
I would like to express my sincere gratitude to my supervisors, Prof. Sain and Prof. Yan, for
their continuous efforts on mentoring me. Without their encouragement, support and guidance,
I would never have overcome many difficulties and completed my PhD. During the past five
years, they led me towards exciting research fields and showed me how to be a successful and
independent scientist. It has been my honour and privilege to work with both of them with their
trust and generosity.
I am also extremely indebted to my thesis committee members, Prof. Copper and Prof. Naguib,
and my thesis examiners, Prof. Dorgan and Prof. Singh, for the stimulating discussions and
their commitment to my professional development.
I would like to thank Andrew, Lindsey, and Mariam for many invaluable discussions on
editorial and scientific questions. I also want to acknowledge the helpful comments made by
Sankar, Shokouh, Nikhil, Javad and Zeen. Dmitry and George, were extremely helpful with
some technical aspects as well.
Particular thanks extend to my friends – Justin, Linghong and Rosanna for their kind
suggestions on editing. I am grateful to have had help from Robert, Shawn, Rujun, Lynn,
Luizmar, Crystal, Prashant, Sharon, Jieming, Rana, YiChun, Miroslava, Wendy, Julie,
Stephanie, Lukas, Julieta and colleagues from labs ES 2008 and ES 3004, for generously
sharing their time, discussions, and their enthusiasms with me.
Finally, I would like to thank my parents and my sisters. Their unconditional love and support
helped me through the toughest times. Without your support, I wouldn’t even be close to
finishing this journey. Thank you.

v
Table of Contents
Acknowledgement .............................................................................................................. iv
Table of Contents ................................................................................................................. v
List of Tables ...................................................................................................................... xi
List of Figures ................................................................................................................... xiii
List of Schemes ................................................................................................................. xvi
List of Abbreviations ...................................................................................................... xviii
Chapter 1 Introduction ......................................................................................................... 1
1.1 Motivation and Significance ..................................................................................... 1
1.2 Objectives .................................................................................................................. 3
1.3 Hypothesis ................................................................................................................. 3
1.4 Scope ......................................................................................................................... 3
Chapter 2 Literature Review ................................................................................................ 8
2.1 Conventional Epoxy Resins ...................................................................................... 8
2.1.1 Common Types of Epoxy Monomers and Curing Agents .............................. 8
2.1.2 Epoxy Monomer Synthesis ............................................................................. 9
2.1.3 Network Forming Mechanism ...................................................................... 11
2.2 Common Bio-based Epoxy Resins Derived from Renewable Resources ............... 15
2.2.1 Oil-based Epoxy Resins ................................................................................ 15
2.2.2 Saccharide-based Epoxy Resins ................................................................... 16
2.2.3 Lignin-based Epoxy Resins .......................................................................... 18
2.2.4 Terpene and Resin Acid-based Epoxy Resins .............................................. 18
2.2.5 Polyphenol-based Epoxy Resins ................................................................... 20
2.2.6 Wood-based Epoxy Resins ........................................................................... 21
2.3 Bark Extractives and Extraction Process ................................................................ 22
2.3.1 Chemical Composition of Pine Bark ............................................................ 22

vi
2.3.2 Extraction Technology .................................................................................. 23
2.4 Reinforced Bio-epoxy Resins ................................................................................. 26
2.4.1 Types of Reinforcements .............................................................................. 26
2.4.2 Cellulose Nanostructure ................................................................................ 27
2.4.3 Past and Current Research of Reinforced Petroleum-based Epoxy Resins
with Cellulose Nanostructure ..................................................................... 28
Chapter 3 Characterization of Bark Extractive-based Bio-epoxy Resins .......................... 35
3.1 Introduction ............................................................................................................. 36
3.2 Materials and Methods ............................................................................................ 37
3.2.1 Materials ....................................................................................................... 37
3.2.2 Methods ......................................................................................................... 38
3.2.2.1 Bark Extraction .............................................................................. 38
3.2.2.2 Synthesis of Bark Extractive Epoxy Resins ................................... 38
3.2.2.3 Curing of the Epoxy Monomers .................................................... 38
3.2.3 Characterization ............................................................................................ 39
3.2.3.1 Epoxy Equivalent Weight (EEW) .................................................. 39
3.2.3.2 Differential Scanning Calorimetry (DSC) ..................................... 39
3.2.3.3 Fourier Transform Infrared Spectroscopy (FTIR) ......................... 39
3.2.3.4 Thermogravimetric Analysis (TGA) .............................................. 39
3.2.3.5 Gel Permeation Chromatography (GPC) ....................................... 39
3.2.3.6 Nuclear Magnetic Resonance (NMR) ............................................ 40
3.2.3.7 Mechanical Universal Testing Machine ........................................ 40
3.3 Results and Discussion ............................................................................................ 40
3.3.1 Yield and Epoxy Equivalent Weight (EEW) ................................................ 40
3.3.2 Spectral Characterization of Bio-epoxy Resins ............................................ 41
3.3.3 Curing Behaviour .......................................................................................... 46
3.3.4 Mechanical Performance .............................................................................. 50

vii
3.3.5 Thermal Degradation and Thermal Stability ................................................ 51
3.4 Summary ................................................................................................................. 54
Chapter 4 Effects of Reaction Parameters on the Glycidyl Etherification of Bark
Extractives during Bio-epoxy Resin Synthesis ............................................................. 58
4.1 Introduction ............................................................................................................. 59
4.2 Materials and Methods ............................................................................................ 61
4.2.1 Materials ....................................................................................................... 61
4.2.2 Methods ......................................................................................................... 61
4.2.2.1 Extraction Procedure ...................................................................... 61
4.2.2.2 Synthesis Procedure ....................................................................... 61
4.2.2.3 Refining Procedure ........................................................................ 62
4.2.3 Characterization ............................................................................................ 62
4.2.3.1 Hydroxyl Value (OHV) Determination ......................................... 62
4.2.3.2 Molecular Weight .......................................................................... 63
4.2.3.3 Epoxy Equivalent Weight (EEW) .................................................. 64
4.2.3.4 Structural Characterization ............................................................ 64
4.2.4 Experimental Design for Response Surface Methodology (RSM) ............... 65
4.3 Results and Discussion ............................................................................................ 65
4.3.1 Categorical Reaction Conditions .................................................................. 65
4.3.1.1 Effect of Substrates ........................................................................ 65
4.3.1.2 Effect of Solvents ........................................................................... 69
4.3.1.3 Effect of Catalysts .......................................................................... 72
4.3.2 Numerical Variables — Reaction Time, Reaction Temperature, and
NaOH/OHV Molar Ratio ........................................................................... 73
4.4 Summary ................................................................................................................. 79
Chapter 5 Thermal Degradation of Extractive-Based Bio-Epoxy Monomer and Network:
Kinetics and Mechanism ............................................................................................... 83
5.1 Introduction ............................................................................................................. 84

viii
5.2 Materials and Methods ............................................................................................ 85
5.2.1 Materials ....................................................................................................... 85
5.2.2 Extraction Procedure ..................................................................................... 85
5.2.3 Synthesis Procedure ...................................................................................... 85
5.2.4 Refining Procedure ....................................................................................... 85
5.2.5 Characterization ............................................................................................ 86
5.2.5.1 Thermogravimetric Analysis (TGA) .............................................. 86
5.2.5.2 Fourier Transform Infrared Spectroscopy (FTIR) ......................... 86
5.2.5.3 Pyrolysis-Gas Chromatography/Mass Spectrometry (Py-GC/MS) 86
5.3 Results and Discussion ............................................................................................ 86
5.3.1 Thermal Stability of Monomers .................................................................... 87
5.3.1.1 Mass Loss of Monomers ................................................................ 87
5.3.1.2 Degradation Kinetics of Monomers ............................................... 89
5.3.1.3 FTIR Residual Analysis of Monomers after Isothermal Thermal
Degradation ................................................................................. 91
5.3.1.4 Py – GC/MS Analysis of Bark Extractives and Uncured E-epoxy
monomer ...................................................................................... 94
5.3.1.5 Proposed Degradation Mechanism for Uncured E-epoxy
monomer ...................................................................................... 97
5.3.2 Thermal Stability of the Cured Epoxy Networks ....................................... 101
5.3.2.1 Mass Loss and Derivative Mass Loss of the Cured Resins ......... 101
5.3.2.2 Degradation Kinetics of the Cured Networks .............................. 103
5.3.2.3 FTIR Residual Analysis of the Cured Resins after Isothermal
Thermal Degradation ................................................................. 104
5.3.2.4 Py-GC/MS Analysis of the Cured E-epoxy Resins ..................... 106
5.3.2.5 Degradation Mechanism .............................................................. 108
5.4 Summary ............................................................................................................... 112
Chapter 6 Influence of Nanocellulose Fibres (NCFs) on the Curing Behaviours of Epoxy
Resins .......................................................................................................................... 118
ix
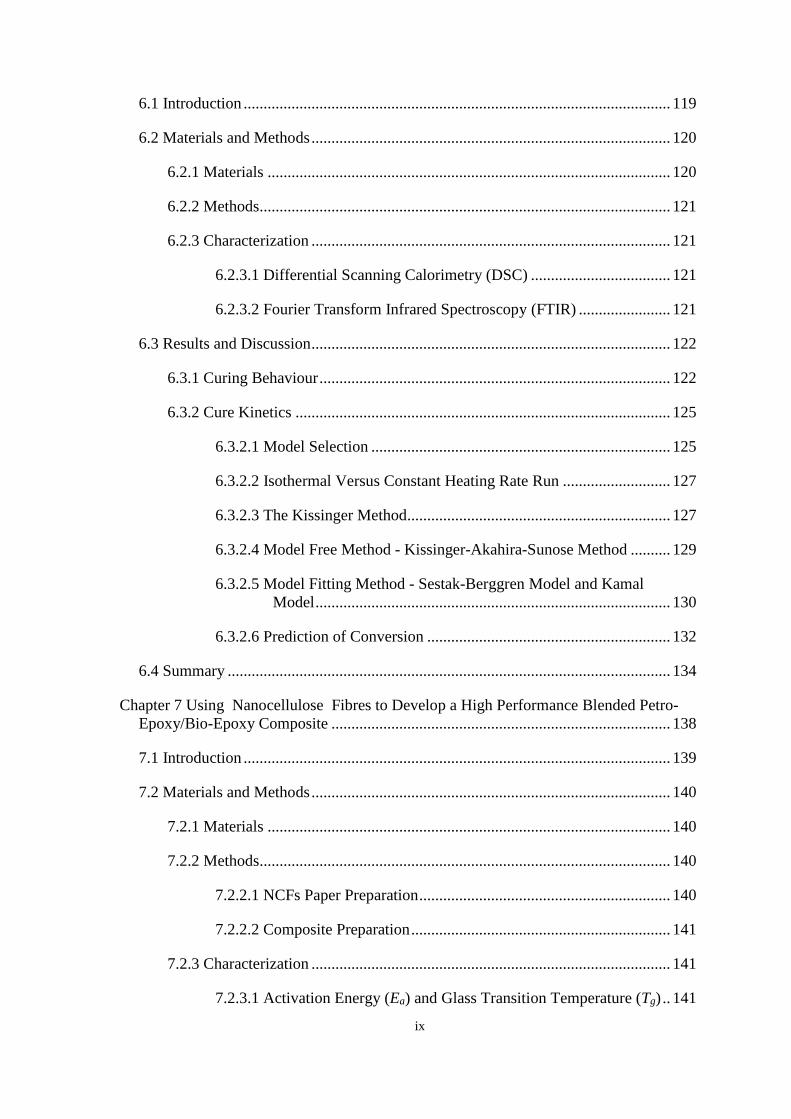
6.1 Introduction ........................................................................................................... 119
6.2 Materials and Methods .......................................................................................... 120
6.2.1 Materials ..................................................................................................... 120
6.2.2 Methods ....................................................................................................... 121
6.2.3 Characterization .......................................................................................... 121
6.2.3.1 Differential Scanning Calorimetry (DSC) ................................... 121
6.2.3.2 Fourier Transform Infrared Spectroscopy (FTIR) ....................... 121
6.3 Results and Discussion .......................................................................................... 122
6.3.1 Curing Behaviour ........................................................................................ 122
6.3.2 Cure Kinetics .............................................................................................. 125
6.3.2.1 Model Selection ........................................................................... 125
6.3.2.2 Isothermal Versus Constant Heating Rate Run ........................... 127
6.3.2.3 The Kissinger Method .................................................................. 127
6.3.2.4 Model Free Method - Kissinger-Akahira-Sunose Method .......... 129
6.3.2.5 Model Fitting Method - Sestak-Berggren Model and Kamal
Model ......................................................................................... 130
6.3.2.6 Prediction of Conversion ............................................................. 132
6.4 Summary ............................................................................................................... 134
Chapter 7 Using Nanocellulose Fibres to Develop a High Performance Blended Petro-
Epoxy/Bio-Epoxy Composite ..................................................................................... 138
7.1 Introduction ........................................................................................................... 139
7.2 Materials and Methods .......................................................................................... 140
7.2.1 Materials ..................................................................................................... 140
7.2.2 Methods ....................................................................................................... 140
7.2.2.1 NCFs Paper Preparation ............................................................... 140
7.2.2.2 Composite Preparation ................................................................. 141
7.2.3 Characterization .......................................................................................... 141
7.2.3.1 Activation Energy (Ea) and Glass Transition Temperature (Tg) .. 141

x
7.2.3.2 Tensile Mechanical Properties ..................................................... 142
7.2.3.3 Morphology .................................................................................. 142
7.2.3.4 Thermal Stability ......................................................................... 142
7.3. Results and Discussion ......................................................................................... 142
7.3.1 The Effect of Nanocellulose Fibres on Activation Energies of Epoxy
Resins ....................................................................................................... 142
7.3.2 Mechanical Performance of Epoxy Resins and Epoxy/NCFs composites . 144
7.3.3 Morphological Characterization of NCFs Reinforced Epoxy Resins ......... 148
7.3.4 Thermal Stability ........................................................................................ 151
7.4 Summary ............................................................................................................... 153
Chapter 8 Conclusions, Contributions and Future Work ................................................. 157
8.1 Conclusions ........................................................................................................... 157
8.2 Scientific Contributions and Engineering Prospects ............................................. 158
8.3 Future Work .......................................................................................................... 159
Appendix A (Chapter 3) ................................................................................................... 161
Appendix B (Chapter 4) ................................................................................................... 163
Appendix C (Chapter 6) ................................................................................................... 164

xi
List of Tables
Table 2-1 Typical properties of some epoxy resins ............................................................. 9
Table 2-2 Advantages, disadvantages, and applications of common epoxy curing agents . 9
Table 2-3 Yield and major components of lodgepole pine bark extractives. .................... 24
Table 2-4 Extraction amounts of various extraction solvents and tree barks .................... 26
Table 3-1 Molecular weight and polydispersity of E-epoxy and L-epoxy ........................ 45
Table 3-2 TGA data of the cured epoxy resins .................................................................. 53
Table 4-1 Variables and their levels for Box–Behnken design. ........................................ 65
Table 4-2 OHV and molecular weight of two types of extractives. .................................. 66
Table 4-3 OHV from bark extractives using 31P-NMR. .................................................... 68
Table 4-4 Yield and EEW value of two types of E-epoxy monomers. .............................. 68
Table 4-5 Chemical and physical properties of common solvents for epoxy monomer
synthesis. ....................................................................................................................... 70
Table 4-7 Yield and EEW value of two types of epoxy monomers through two synthetic
paths. ............................................................................................................................. 73
Table 4-8 The B-B matrix and output responses. .............................................................. 75
Table 4-9 ANOVA results of the quadratic model for the yield of reaction. .................... 76
Table 4-10 ANOVA results of the quadratic model for the EEW value. .......................... 76
Table 4-11 Verification of the proposed optimal synthesis conditions. ............................ 78
Table 5-1 TGA data of the bio-based epoxy monomers. ................................................... 89
Table 5-2 Peak assignments of the FTIR spectra of monomers. ....................................... 93
Table 5-4 Peak assignments of the pyrolysis products of uncured bio-epoxy monomer as
detected by Py-GC-MS. ................................................................................................ 97
Table 5-5 TGA data of the cured epoxy resins. ............................................................... 103
Table 5-6 Peak assignments of the FTIR spectra of cured resins. ................................... 106
Table 5-7 Peak assignments of the cured bio-epoxy resins pyrolysis products detected by
Py-GC-MS................................................................................................................... 108
Table 6-1 Composition of samples .................................................................................. 121

xii
Table 6-2 Thermal characteristics of samples from the dynamic DSC analysis ............. 124
Table 6-3 Cure kinetics parameters by Kissinger Eq. and Sestak-Berggren empirical
Eq. ............................................................................................................................... 129
Table 6-4 Cure kinetics parameters by Kamal Equation ................................................. 132
Table 7-1 Sample compositions ....................................................................................... 141
Table 7-2 Tensile properties of neat epoxies ................................................................... 144
Table 7-3 Tensile strength and modulus of two types of reinforcement and two types of
resin compositions ....................................................................................................... 145
Table 7-4 Tensile strength and modulus of various E-epoxy replacements .................... 148

xiii
List of Figures
Fig. 2-1 TEM image of (a) nanocellulose whiskers and (b) nanocellulose fibres. ............ 28
Fig. 3-1 Effect of reaction temperature (a) and catalyst amount (b) on the product yield
and EEW value .............................................................................................................. 41
Fig. 3-2 FTIR spectra of (a) bark extractives, epoxidized bark extractives and commercial
epoxy resin, (b) bio-epoxy resins .................................................................................. 42
Fig. 3-3 Liquid state NMR spectrum of the E-epoxy monomers ...................................... 44
Fig. 3-4 Liquid state NMR spectrum of the bark extractives ............................................ 44
Fig. 3-5 Liquid state NMR spectrum of the L-epoxy monomers ...................................... 44
Fig. 3-6 Liquid state NMR spectrum of the C-epoxy monomers ...................................... 45
Fig. 3-7 GPC traces of uncured bio-epoxy resins .............................................................. 46
Fig. 3-8 Dependence of the activation energy on the extent of conversion evaluated from
non-isothermal DSC data .............................................................................................. 49
Fig. 3-9 Model-free prediction of isothermal cure from 140 to 170 °C using KAS method
(The experimental data are shown by line. The points correspond to the predicted
time) .............................................................................................................................. 49
Fig. 3-10 Evolution of oxirane functional group during curing......................................... 50
Fig. 3-11 Tensile strength and modulus of the neat P-epoxy, 10, 30, and 50% E-epoxy
replacement of P-epoxy ................................................................................................. 51
Fig. 3-12 Thermal degradation of the cured epoxy resins with various E-epoxy
replacements (0-50%) under air .................................................................................... 52
Fig. 3-13 Thermal stability of the cured P-epoxy, E-epoxy and L-epoxy under nitrogen
atmosphere .................................................................................................................... 53
Fig. 4-1 SEC traces of bark extractives. ............................................................................ 67
Fig. 4-2 31P-NMR analysis of (a) ODE and (b) SDE. ........................................................ 68
Fig. 4-3 13C-NMR spectra of E-epoxy monomers synthesized in various solvent
systems. ......................................................................................................................... 71
Fig. 4-4 Effect of catalyst types on functional groups of E-epoxy products observing by
FTIR (left) and NMR (right): (a) TBAH/NaOH and (b) twofold NaOH. ..................... 73
Fig. 4-5 Normal probability plot of (a) yield and (b) EEW value of E-epoxy monomer. . 76

xiv
Fig. 4-6 Response surface plots of various parameters on the product yield and reactivity :
(a) Effects of time and temperature, (b) Effects of temperature and NaOH/OHV ratio,
and (c) Effects of time and NaOH/OHV ratio. ............................................................. 78
Fig. 5-1 Thermal degradation of the P-epoxy monomer and E-epoxy monomer under
nitrogen environment by TGA, showing the (a) mass curves and (b) derivative of the
mass loss curves. ........................................................................................................... 87
Fig. 5-2 Deconvolution of the multi-peaks of the E-epoxy monomer DTGA results. ...... 88
Fig. 5-3 DTGA curves of the two model bio-based epoxy monomers: (a) lignin-based
monomer and (b) abietic acid-based monomer. ............................................................ 89
Fig. 5-4 Dependence of the Ea on the extent of conversion evaluated from non-isothermal
TGA data. ...................................................................................................................... 91
Fig. 5-5 FTIR spectra of the commercial monomer and bio-epoxy monomer after TGA in
nitrogen or air atmospheres at various temperatures: (a) P-epoxy under nitrogen, (b) P-
epoxy under air, (c) E-epoxy under nitrogen, (d) E-epoxy under air. ........................... 93
Fig. 5-6 Py-GC/MS chromatogram of bark extractives and uncured bio-epoxy
monomer ....................................................................................................................... 95
Fig.5-7 Thermal degradation of the P-epoxy resin and E-epoxy resin under nitrogen: (a)
mass loss curves and (b) derivative mass loss curves. ................................................ 102
Fig. 5-8 Dependence of the Ea on the extent of conversion evaluated from non-isothermal
TGA data. .................................................................................................................... 104
Fig. 5-9 FTIR spectra of the cured P-epoxy and cured E-epoxy after TGA in nitrogen or
air atomosphere at various temperatures: (a) P-epoxy under nitrogen, (b) P-epoxy
under air, (c) E-epoxy under nitrogen, (d) E-epoxy under air. .................................... 105
Fig. 5-10 Py-GC/MS chromatograms of the cured bio-epoxy resins. ............................. 108
Fig. 6-1 FTIR spectra obtained at different times for BiF-Aliph sample cured at 100°C.
(a) Spectrum from 4000-3000 cm-1, (b) Spectrum from 1000-500 cm-1 ..................... 123
Fig. 6-2 Model selection by (a) reaction rate and (b) Malek’s method ........................... 126
Fig. 6-3 Onset of diffusion control, w= 𝑙𝑛(𝑑𝛼/𝑑𝑡)/1 − 𝛼𝑛 − 𝑘1 .................................. 127
Fig. 6-4 Dependence of the activation energy on the extent of conversion evaluated from
non-isothermal DSC data ............................................................................................ 130
Fig. 6-5 Model-free prediction of isothermal cure at 140°C and 170 °C from KAS
method. (The experimental data are shown by line. The points correspond to the
predicted time.) ........................................................................................................... 133
Fig. 7-1 Dependence of the 𝐸 𝑎 on the extent of conversion evaluated from non-
isothermal DSC data. .................................................................................................. 143

xv
Fig. 7-2 SEM images of cellulose nano-paper before oven-drying (a) and after oven-
drying (b) ..................................................................................................................... 145
Fig. 7-3 Tensile stress-strain curves of (a) P-epoxy and (b) 10%E-epoxy and their
reinforced composites ................................................................................................. 146
Fig. 7-4 Tensile properties of NCFs reinforced composites compared to literature data 147
Fig. 7-5 Tensile properties of NCFs reinforced composites compared to theoretical
data .............................................................................................................................. 148
Fig. 7-6 SEM images of fracture surface in cross-sections. P-epoxy/DNCF(a) and P-
epoxy/SNCF (b) showing the difference in nanopaper thickness caused by resin
penetration. A clear boundary was observed between DNCF and epoxy (c), but not at
SNCF/epoxy (d) .......................................................................................................... 149
Fig. 7-7 SEM images of fracture surface in cross-sections of P-Epoxy/SNCF (a) and
10%E-Epoxy/SNCF(b) showing that the diameter of nanocellulose fibres (white spots)
in 10%E-epoxy blending system is smaller compared to neat P-epoxy. .................... 150
Fig. 7-8 Thermal degradation of P-epoxy and P-epoxy/NCFs with various E-epoxy
replacement (a)(b) in nitrogen environment (c)(d) in air environment ....................... 152

xvi
List of Schemes
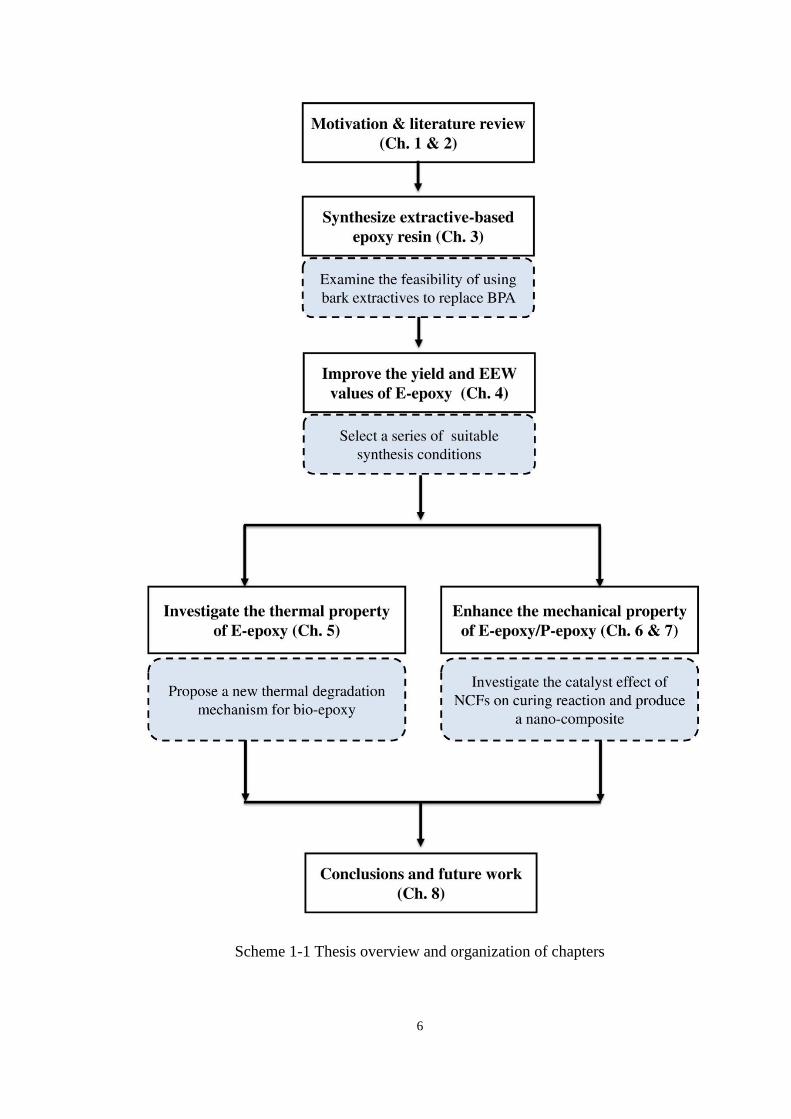
Scheme 1-1 Thesis overview and organization of chapters ................................................. 6
Scheme 2-1 Bisphenol A diglycidyl ether (BADGE) .......................................................... 8
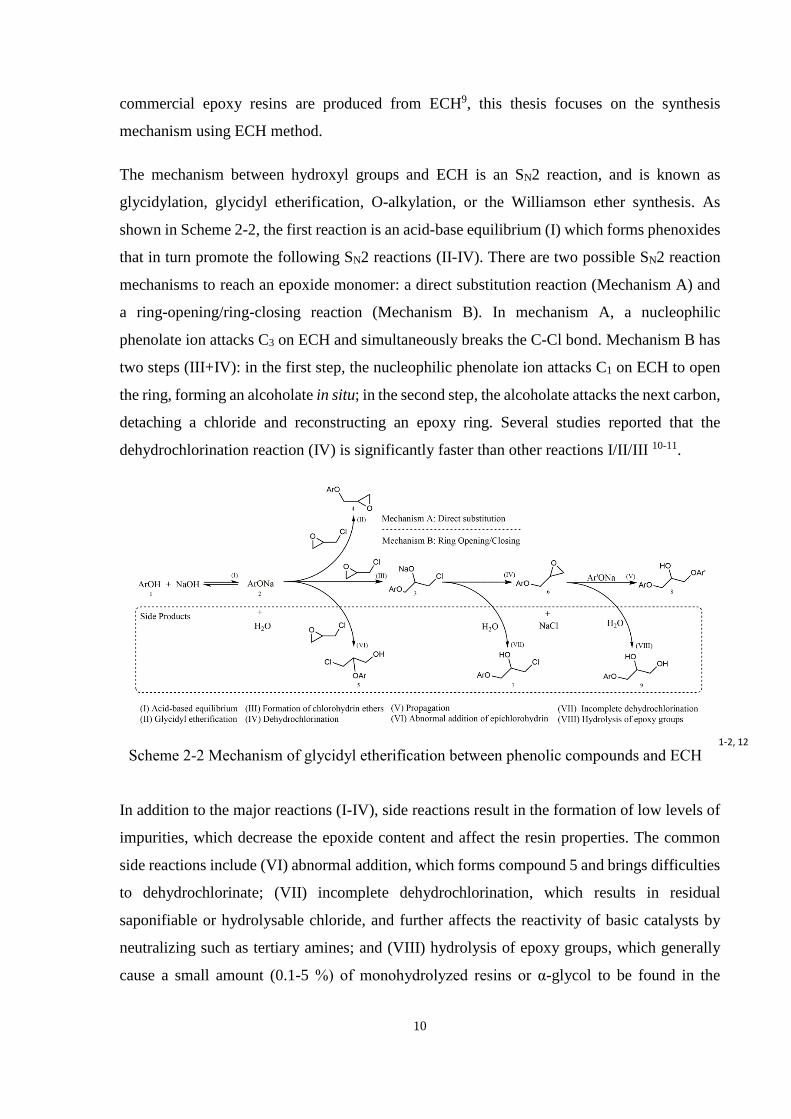
Scheme 2-2 Mechanism of glycidyl etherification between phenolic compounds and
ECH ............................................................................................................................... 10
Scheme 2-3 Addition reaction of an epoxy resins with amine type curing agent .............. 12
Scheme 2-4 (a) Epoxidized palm oil, (b) epoxidized linseed oil ....................................... 15
Scheme 2-5 Synthesis of diglycidyl ether of isosorbide by various methods .................... 17
Scheme 2-6 A new synthesis method for epoxy monomer, using lactide as an example .. 17
Scheme 2-7 Three synthesis routes for vanillin-based epoxy resins ................................. 18
Scheme 2-8 Synthesis of epoxy monomer from abietic acid ............................................. 19
Scheme 2-9 Epoxidized imidodicarboxylic resinic of maleic anhydride (a) and
epoxidized ..................................................................................................................... 20
levopimaric acid (b) ........................................................................................................... 20
Scheme 2-10 Major composition of pine bark ................................................................... 23
Scheme 2-11 Major extractives based on the literature ..................................................... 25
Scheme 4-1 Mechanism of glycidyl etherification between phenolic compounds and
ECH ............................................................................................................................... 61
Scheme 4-2 Mechanism of glycidyl etherification catalyzed by tetrabutylammonium
hydroxide (TBAH) ........................................................................................................ 72
Scheme 5-1 Three dominant thermal degradation mechanisms of epoxy monomer. ........ 99
Scheme 5-2 Proposed degradation mechanism of E-epoxy resins (The solid coloured
rounded rectangular with the compound numbers refer to the results from Py-GC/MS;
the yellow highlight circles refer to the results from FTIR and the rest parts are
supported by literature). .............................................................................................. 101
Scheme 5-3 Thermoxidation mechanism of epoxy monomer. ........................................ 101
Scheme 5-4 Three scission positions on vinylene ethers. ................................................ 109
Scheme 5-5 Three possible scission reactions on cured epoxy resins. ............................ 110
Scheme 5-6 Thermal oxidative mechanism based on the free radical mechanism. ......... 111
Scheme 5-7 Cope reaction proposed by Burton and Conley ........................................... 111

xvii
Scheme 6-1 Trimolecular transition state suggested by Smith. ....................................... 125
Scheme 7-1 Reaction between epoxy and hydroxyl groups: (a) catalyst effect and (b)
etherification. .............................................................................................................. 144

xviii
List of Abbreviations
A-epoxy Abietic acid based bio-epoxy
BADGE Bisphenol A diglycidyl ether
BFDGE Bisphenol F diglycidyl ether
BPA Bisphenol A
C-epoxy Cellulose based bio-epoxy
DCM Dichloromethane
DNCF Oven-dried nanocellulose fibre
DMBD Diethyl-methyl-benzene-diamine
DSC Differential scanning calorimetry
Ea Activation energy
ECH Epichlorohydrin
E-epoxy Bark extractive based bio-epoxy
EEW Epoxy equivalent weight
EHS Environment, health and safety
FTIR Fourier transform infrared spectroscopy
GPC Gel permeation chromatography
HTM Halpin-Tsai model
KAS Kissinger-Akahira-Sunose model
L-epoxy Lignin based bio-epoxy
MeOH Methanol
Mn Number average molecular weight
Mw Weight average molecular weight
NCFs Nanocellulose fibres
NMR Nuclear magnetic resonance
ODE Oven-dried bark extractives
OHV Hydroxyl value
PDI Polydispersity index
P-epoxy Petroleum based epoxy
PTC Phase transfer catalyst
Py-GC/MS Pyrolysis-gas chromatography-mass spectrometry
ROM Rule of mixture
RSM Response surface methodology
S-B Sestak-Berggren model
SNCF Solvent-exchanged nanocellulose fibre
SDE Spray-dried extractives
SEM Scanning electron microscope
SPI Solvent polarity index

xix
TBAH Tetrabutylammonium hydroxide
Tg Glass transition temperature
TGA Thermogravimetric analysis
Ts Statistic heat-resistant index temperature

1
Chapter 1 Introduction
1.1 Motivation and Significance
Epoxy resins are a class of high-performance thermosetting precursors, containing oxirane
groups that can be cured by a diversity of co-agents, such as amines and anhydrides, to form
three-dimensional networks. The cured epoxy resins, also called epoxies, hold a dominant
position in the polymer market - especially in the automotive, construction, electronic and
aerospace industries - due to their high strength, superior chemical-resistance, good
compatibility with other materials, and minimum shrinkage and volatility of by-products after
curing. The global demand of epoxy resin was estimated at roughly US$18.6 billion in 2013
and was forecasted to reach US$25.8 billion by 20181. This increase in value reflects the
increasing demand of epoxy resins in the global market over the coming years.
Additionally, the major component of epoxy resins, bisphenol A (BPA), is considered a toxic
substance, and is included in Schedule 1 of the Canadian Environmental Protection Act2 for
declaring the necessity to substitute BPA. In conjunction with the scarcity of crude oil,
replacing BPA with natural resources is evident, and thus many natural resources have been
explored to determine their feasibilities as alternatives. Vegetable oil3-5, liquefied wood6-7 and
lignin8-9 are considered as the most promising materials with which to synthesize bio-based
epoxy resins. Although epoxidized vegetable oils are already commercialized and commonly
used as plasticizers, the structure of vegetable oil, containing only aliphatic chains, limits its
mechanical strength and thermal stability10. Moreover, liquefied biomass contains more
aromatic structures compared to epoxidized oil, but the liquefaction process is energy-intensive
and uses toxic solvents like phenol11. Furthermore, lignin, a by-product of the paper industry,
has abundant aromatic structures, but its viscosity and the molecular weight create difficulties
during the manufacturing process. Therefore, finding a suitable natural resource to produce
bio-epoxy resins remains one of the most important areas of interest.
To address this issue, bark extractives have emerged as promising candidates to produce a new
type of bio-epoxy resins. Some of the major benefits of using tree bark include its abundance,
renewability, and its richness in phenolic compounds. The annual bark yield in Canada12 is as
much as 17 million m3; however, most tree bark is under-used, and is either left in the stands
after harvest or burned as low-efficiency fuels. Furthermore, the recent ongoing epidemic of
pine beetle infested trees provides an abundant resource to investigate the utility of tree bark.

2
Since early 1990, mountain pine beetle (MPB; Dendroctonus ponderosae) has destroyed more
than 19 million hectares of forest in B.C.13 and 36 million hectares of that in USA14. In attempts
to salvage these dead trees, the government of Canada has invested over $100 million to
develop new bio-derived products and the U. S. Forest Service has spent $30 million in
cellulosic ethanol plant, which converts beetle-infested biomass into bio-ethanol. In addition,
many technologies and researches are being applied and studied in order to find a suitable
solution to convert the waste bark into useful products and one of most promising application
is to convert bark into valuable chemicals.
Compared to wood, bark has more phenolic compounds such as tannins, flavonoids and lignin
oligomers, which can be developed into various polymers, including novolac15, resol16 type
phenol formaldehyde resins, and polyurethane17. Among all of the extraction processes,
alkaline extraction is able to dissolve most of the phenolic compounds18 and the remaining
sodium hydroxide can be used as catalyst to promote the synthesis procedure. For these reasons,
the potential of bark extractives should be exploited as a replacement for BPA. However, to
the best of our knowledge, few researches have explored the feasibility of developing bio-
epoxy resins from bark extractives.
The most common approach to synthesize epoxy monomers is to etherify the phenolic hydroxyl
groups using epichlorohydrin (ECH). The mechanism involves using the hydroxyl groups as
nucleophiles to attack carbons on ECH. Compared to other methods, such as double bond
oxidation, the ECH method is more cost-effective, industrially-preferred, and has a simpler
purification process19. Although many bio-epoxy resins have been produced through the ECH
procedure, bark extractives contain complex and diverse compounds resulting in irregular
reactivity. A suitable synthesis procedure must be formulated in order to ensure that bark
extractive-based epoxy (E-epoxy) monomer has a high yield and reactivity.
A potential bio-epoxy not only requires high yield and reactivity of monomer, but also demands
good mechanical and thermal properties of cured resin. As the literature indicates, many bio-
epoxy resins have been successfully synthesized, but their performance is often insufficient for
the high-performance material industry. In order to broaden applications of bio-epoxy resins,
this thesis presents an in-depth investigation into the thermal and mechanical properties, which
may provide some guidance for producing a bio-epoxy resin with superior quality.

3
1.2 Objectives
The overall objective of this study is to better understand the performance of extractive-based
epoxy resin (E-epoxy), and its feasibilities to replace petroleum-based epoxy resins (P-epoxy).
Each chapter of this present study was designed to reach the following sub-objectives:
1. Examining the feasibility of epoxidation reaction between bark extractives and ECH,
which leads to the development of an innovative bio-epoxy;
2. Studying the effect of synthesis conditions on the yield, reactivity and molecular
structures of E-epoxy;
3. Understanding the thermal stability and degradation kinetics of E-epoxy compared with
other types of epoxy resins;
4. Investigating the influence of NCFs on the curing behaviour of P-epoxy; and
5. Assessing the effect of NCFs on mechanical strength of E-epoxy/P-epoxy blended
system.
1.3 Hypothesis
The overall hypothesis of this study is that alkaline bark extractives contain a sufficient amount
of polyphenols to react with ECH, and produce novel bio-epoxy monomers.
1.4 Scope
This thesis outlines the characterization of a bio-epoxy resin produced from tree bark
extractives. Chapter 1 discusses the necessity to find an alternative to the toxic BPA and to
decrease the cost of BPA raw materials. In conjunction with the scarcity of petroleum resource,
it is evident there is a need to develop a new E-epoxy resin from natural materials. Specifically,
tree bark, a waste material from the lumber industry, is used in this study to produce low-
molecular-weight polyphenols as BPA substitutes. The goal of the thesis is to provide
information on deriving a bio-based epoxy resin from tree bark and characterize the newly
synthesized E-epoxy.
Chapter 2 provides a summary of the literature comparing the synthesis pathways of petro-
and bio-based epoxy resins, chemical compositions of bark, extraction technologies, and
reinforced bio-epoxy composites. In order to develop a bio-based material, it is essential to

4
study all the synthesis routes and understand the effects of synthesis conditions on the
properties of the final product. Furthermore, bark extractives have a variety of chemical
components including polysaccharides, degraded lignin, and terpenes, which show different
reaction rates toward ECH reagent. Thus, in order to predict the possible synthesis products, it
is critical to identify the chemical composition of bark extractives. Finally, one of the remaining
challenges from the literature is the insufficient mechanical strength of bio-based epoxy resin.
To address this issue, NCFs are applied as reinforcement to analyse the strengthening effect on
mechanical properties.
Throughout the following five chapters (Chapter 3-7), several aspects of E-epoxy resins were
analyzed. These chapters were written as self-contained manuscripts including Introduction
and Methods sections for each with some overlapping content. However, efforts were made to
minimize these reiterations.
Chapter 3 tests the feasibility of developing bio-epoxy resins from bark extractives. The
hypothesis of this study is that the polyphenols in bark extractives can react with
epichlorohydrin through a conventional glycidyl etherification. The first finding is that the
oxirane groups were successfully grafted on the bark extractives as confirmed by Fourier
transform infrared spectroscopy (FTIR) and nuclear magnetic resonance (NMR). In addition,
the molecular weight of the newly synthesized E-epoxy resin was significantly lower than that
of lignin-based epoxy resin. Lastly, the thermal and mechanical performances of the cured
blend system (E-epoxy/P-epoxy) were slightly lower than those of the petroleum-based epoxy
resins. The results in this chapter provide the basis of E-epoxy resin and indicate that more
work is required on understanding and improving the thermal and mechanical properties.
Chapter 4 investigates the effects of synthesis conditions on the yield and epoxy equivalent
weight (EEW) of the E-epoxy resin. According to the reaction mechanism, six parameters
(substrates, solvents, catalyst, reaction time, reaction temperature and catalyst amount) are
assumed as influential factors to cause significant differences on the production of E-epoxy
resin. The best combination of substrate/solvent/catalyst was spray-dried extractives/dioxane
with water/ phase transfer catalyst. The maximum yield with minimum epoxy equivalent
weight was achieved after 4.5 hours reaction time with sodium hydroxide to hydroxyl value
molar ratio of 3.4 at 80 °C reaction temperature. These results provide information that will
assist in establishing a synthesis protocol for E-epoxy resin, and also provide the guidance for
future scale-up production.

5
Chapter 5 further investigates the thermal stability of E-epoxy, and proposes a new thermal
degradation mechanism. As reported in Chapter 3, blending E-epoxy into petro-based epoxy
resin has a detrimental effect, which instigated us to explore the backbone structures of E-
epoxy. The major component identified by pyrolysis-gas chromatography-mass spectrometry
(Py-GC/MS) of E-epoxy resin was abietic acid, which has a mono-functionalized diterpene
structure. Other mono-functionalized compounds in E-epoxy were epimanool and steric acid,
which can decrease the crosslinking density and reduce the thermal stability due to their
aliphatic structures. In addition, a new thermal degradation mechanism was proposed to link
the observation from FTIR and volatile compounds from Py-GC/MS. The results provide some
insight into the thermal degradation mechanism of E-epoxy resin, which sheds light on the
thermal properties of E-epoxy and also provides directions for future thermal enhancement.
Chapter 6 explores the influences of NCFs on the curing behaviours of petroleum-based epoxy
resins. Prior to evaluating the mechanical enhancement of NCFs, it is necessary to examine the
effect of NCFs on the network forming behaviours. The catalyst effect of NCFs was observed
on the specific epoxy/amine system. Several models were applied to describe the curing
behaviour of epoxy/amine resin systems. We found that the Sestak-Berggren model better fitted
the experimental data than the Kamal model.
Chapter 7 combines the NCFs and P-epoxy/E-epoxy resins in order to increase the mechanical
performance of the blending system. The major hypothesis of this chapter is that incorporating
NCFs can significantly increase the mechanical performance of the blending system, while
enhancing the toughness by E-epoxy resin. A significant improvement on both tensile strength
and modulus of E-epoxy/P-epoxy blending system was observed as they were close to their
respective theoretical values. The toughness of 10% E-epoxy replacement was 80% higher than
the neat P-epoxy resin. These results show that adding NCFs into bio-epoxy resin can be an
efficient way to improve its mechanical performance without any chemical treatment.
The overall findings of the thesis demonstrate the potential of using bark extractives to replace
BPA and develop a bio-epoxy with superior mechanical and chemical properties. The final
chapter (Chapter 8) summarizes the results and conclusions of each chapter and the scientific
contributions of the work, and discusses the directions of future research. These include:
increasing the yield using different synthesis methods, examining the crosslinking density of
E-epoxy resin using NMR or DMA, and developing a fully bio-based epoxy resin with bio-
epichlorohydrin and bio-curing agent.
6
Scheme 1-1 Thesis overview and organization of chapters

7
References
1. A. M. Intelligence, Market report: global epoxy resin market, 2014.
2. M. Burgham and A. Sheffield, ed. E. C. a. H. Canada, Canada Gazette, Gatineau and
Ottawa, 2010, vol. 144, p. 21.
3. A. E. Gerbase, C. L. Petzhold and A. P. O. Costa, J Am Oil Chem Soc, 2002, 79, 797-802.
4. J. Nichols and E. Schipper, J Am Chem Soc, 1958, 80, 5711-5713.
5. P. B. Chakrawarti and V. Mehta, Indian J Technol, 1987, 25, 109-113.
6. T. Asano, M. Kobayashi, B. Tomita and M. Kajiyama, Holzforschung, 2007, 61, 14-18.
7. H. Pan, Renew Sust Energ Rev, 2011, 15, 3454-3463.
8. C. Sasaki, M. Wanaka, H. Takagi, S. Tamura, C. Asada and Y. Nakamura, Ind Crop
Prod, 2013, 43, 757-761.
9. E. Windeisen and G. Wegener, in Polymer science: A Comprehensive Reference, ed. M.
M. K. Matyjaszewski, Elsevier, Oxford, 2012, vol. 10, ch. 15, pp. 255-266.
10. J. M. Raquez, M. Deleglise, M. F. Lacrampe and P. Krawczak, Prog Polym Sci, 2010, 35,
487-509.
11. S. N. Cheng, I. D'cruz, M. C. Wang, M. Leitch and C. B. Xu, Energ Fuel, 2010, 24, 4659-
4667.
12. C. Xing, J. Deng, S. Y. Zhang, B. Riedl and A. Cloutier, Forest Prod J, 2006, 56, 64-69.
13. N. Staff, in University of Alberta News, University of Alberta, Edmonton, 2014.
14. A. Watts, in Climate News, 2015.
15. M. H. Alma and S. S. Kelley, Polym Degrad Stabil, 2000, 68, 413-418.
16. Y. Zhao, N. Yan and M. Feng, Int J Adhes Adhes, 2010, 30, 689-695.
17. J. D'Souza and N. Yan, Acs Sustain Chem Eng, 2013, 1, 534-540.
18. E. Aspe and K. Fernandez, Ind Crop Prod, 2011, 34, 838-844.
19. R. Auvergne, S. Caillol, G. David, B. Boutevin and J.-P. Pascault, Chemical Reviews,
2013, 114, 1082-1115.

8
Chapter 2 Literature Review
2.1 Conventional Epoxy Resins
In section 2.1, we briefly introduced the background information on conventional epoxy resins,
as a reference point with which to establish the foundation for preparing bio-epoxy resins. This
section includes discussion of the most common epoxy resins/curing agents, the synthesis path
of epoxy precursor, and the network formation. A full description of both the chemistry and
the properties of conventional epoxy can be found in several books and published peer-review
papers1-3.
2.1.1 Common Types of Epoxy Monomers and Curing Agents
The term epoxy refers to a broad group of reactive compounds, characterized by the presence
of an oxirane or epoxy group. This is represented by a three-member ring containing an oxygen
atom that is bonded with two carbon atoms. Epoxy groups are capable of forming a cross-
linked high molecular weight polymer. A general formula for an epoxy resin can be represented
by a linear polyether with terminal epoxy groups and interval secondary hydroxyl groups
(Scheme 2-1).
Scheme 2-1 Bisphenol A diglycidyl ether (BADGE) 2
The first commercial production of epoxy resin occurred simultaneously in Europe and in the
United States, beginning in the early 1940s. To date, several different types of epoxy resins -
bisphenol A epoxy, bisphenol F epoxy, novolacs epoxy, tetraphenolethane epoxy,
cycloaliphatic epoxy, and waterborne epoxy - have been developed (Table 2-1). Similarly,
curing agents come in many varieties, such as aliphatic amines, cycloaliphatic amines, aromatic
polyamines, carboxylic acid, anhydrides, etc. (Table 2-2). Thousands of combinations can
occur between epoxy monomers and curing agents, so the design and manufacture of epoxy
resins is complex, but also flexible.
9
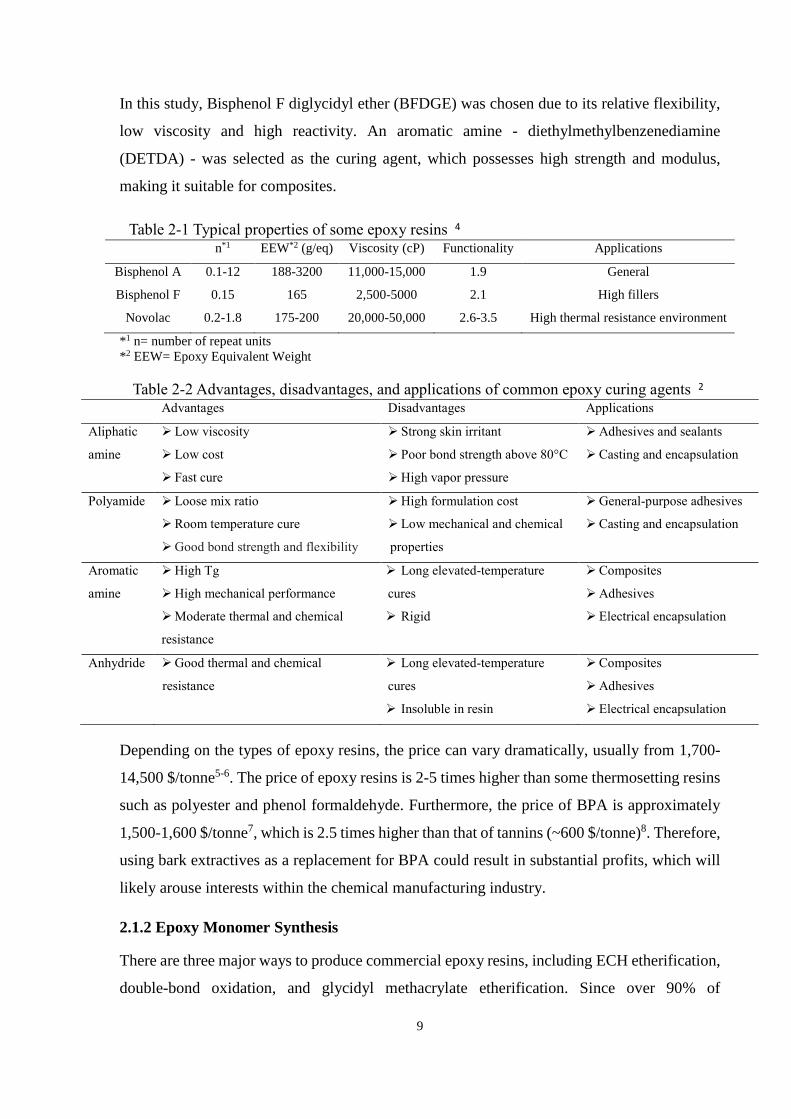
In this study, Bisphenol F diglycidyl ether (BFDGE) was chosen due to its relative flexibility,
low viscosity and high reactivity. An aromatic amine - diethylmethylbenzenediamine
(DETDA) - was selected as the curing agent, which possesses high strength and modulus,
making it suitable for composites.
Table 2-1 Typical properties of some epoxy resins 4 n*1 EEW*2 (g/eq) Viscosity (cP) Functionality Applications
Bisphenol A 0.1-12 188-3200 11,000-15,000 1.9 General
Bisphenol F 0.15 165 2,500-5000 2.1 High fillers
Novolac 0.2-1.8 175-200 20,000-50,000 2.6-3.5 High thermal resistance environment
*1 n= number of repeat units
*2 EEW= Epoxy Equivalent Weight
Table 2-2 Advantages, disadvantages, and applications of common epoxy curing agents 2 Advantages Disadvantages Applications
Aliphatic
amine
Low viscosity
Low cost
Fast cure
Strong skin irritant
Poor bond strength above 80°C
High vapor pressure
Adhesives and sealants
Casting and encapsulation
Polyamide Loose mix ratio
Room temperature cure
Good bond strength and flexibility
High formulation cost
Low mechanical and chemical
properties
General-purpose adhesives
Casting and encapsulation
Aromatic
amine
High Tg
High mechanical performance
Moderate thermal and chemical
resistance
Long elevated-temperature
cures
Rigid
Composites
Adhesives
Electrical encapsulation
Anhydride Good thermal and chemical
resistance
Long elevated-temperature
cures
Insoluble in resin
Composites
Adhesives
Electrical encapsulation
Depending on the types of epoxy resins, the price can vary dramatically, usually from 1,700-
14,500 $/tonne5-6. The price of epoxy resins is 2-5 times higher than some thermosetting resins
such as polyester and phenol formaldehyde. Furthermore, the price of BPA is approximately
1,500-1,600 $/tonne7, which is 2.5 times higher than that of tannins (~600 $/tonne)8. Therefore,
using bark extractives as a replacement for BPA could result in substantial profits, which will
likely arouse interests within the chemical manufacturing industry.
2.1.2 Epoxy Monomer Synthesis
There are three major ways to produce commercial epoxy resins, including ECH etherification,
double-bond oxidation, and glycidyl methacrylate etherification. Since over 90% of
10
commercial epoxy resins are produced from ECH9, this thesis focuses on the synthesis
mechanism using ECH method.
The mechanism between hydroxyl groups and ECH is an SN2 reaction, and is known as
glycidylation, glycidyl etherification, O-alkylation, or the Williamson ether synthesis. As
shown in Scheme 2-2, the first reaction is an acid-base equilibrium (I) which forms phenoxides
that in turn promote the following SN2 reactions (II-IV). There are two possible SN2 reaction
mechanisms to reach an epoxide monomer: a direct substitution reaction (Mechanism A) and
a ring-opening/ring-closing reaction (Mechanism B). In mechanism A, a nucleophilic
phenolate ion attacks C3 on ECH and simultaneously breaks the C-Cl bond. Mechanism B has
two steps (III+IV): in the first step, the nucleophilic phenolate ion attacks C1 on ECH to open
the ring, forming an alcoholate in situ; in the second step, the alcoholate attacks the next carbon,
detaching a chloride and reconstructing an epoxy ring. Several studies reported that the
dehydrochlorination reaction (IV) is significantly faster than other reactions I/II/III 10-11.
Scheme 2-2 Mechanism of glycidyl etherification between phenolic compounds and ECH 1-2, 12
In addition to the major reactions (I-IV), side reactions result in the formation of low levels of
impurities, which decrease the epoxide content and affect the resin properties. The common
side reactions include (VI) abnormal addition, which forms compound 5 and brings difficulties
to dehydrochlorinate; (VII) incomplete dehydrochlorination, which results in residual
saponifiable or hydrolysable chloride, and further affects the reactivity of basic catalysts by
neutralizing such as tertiary amines; and (VIII) hydrolysis of epoxy groups, which generally
cause a small amount (0.1-5 %) of monohydrolyzed resins or α-glycol to be found in the
11
products. The occurrence of these reactions results in mono- and zero-functional epoxide
oligomers.
Based on this mechanism, two common methods were developed to synthesize liquid epoxy
resins. The first method is called the caustic coupling process (ring-opening process), which
uses only sodium hydroxide as a catalyst. Typically, to produce low molecular weight liquid
epoxy, the ECH/BPA ratio is controlled at 10:1, with 20-50 % NaOH(aq) slowly added into the
solution, which may take 2-3 hours; the temperature is maintained at approximately 50-100
°C2. The water content of the mixture is controlled between 0.3-2 %. After the reaction is
complete (the entire reaction can take 6−20 h at reflux1), the mixture usually separates into two
layers. The heavier aqueous layer is discarded, and the viscous product is washed with water
until the wash water is neutral.
The second method for synthesizing liquid epoxy resins is called the phase-transfer catalyst
(PTC) process. Different from the caustic coupling reaction, the PTC process uses ammonium
salts (e.g. triethylbenzyl-, trioctylbenzyl-, tributylbenzylammonium chlorides as well as
cetyltrimethylammonium bromide) to complete the coupling reaction, and adds sodium
hydroxide in order to dehydrochlorinate. In a typical PTC reaction, the ECH/BPA ratio can be
reduced from 10:1 to 3:113. The PTC catalyst is added around 2-10 wt% into a biphase solvent
system (e.g. dichloroform/water). Then, a concentrated (50%) aqueous solution of NaOH is
added dropwise within 2 hours, at room temperature. After introducing the entire amount of
NaOH, the solution is continuously stirred for 2 hours. Finally, the reaction is stopped by the
addition of water, and the organic phase is separated.
Based on the reaction scheme and the above discussion, three points should be noted: (1) the
dominant step is glycidyl etherification, which determines the reaction rate and properties of
the products; (2) pKa values of the substrate and types of catalyst determine the formation rate
of phenoxides; (3) water is the major source to form by-products during synthesis. Thus, it is
essential to choose the right catalyst, and remove water from the synthesis reaction system.
2.1.3 Network Forming Mechanism
Epoxy resins can be transformed from a liquid monomer into a tough and hard cross-linked
material through an anionic or cationic reaction with curing agents. In this study, amine type
of curing agent was selected due to its simplicity of reaction mechanism compared to anhydride
curing agent. The network forming mechanism between epoxy resins and amine type curing

12
agents is an anionic addition reaction, described in the following scheme:
Scheme 2-3 Addition reaction of an epoxy resins with amine type curing agent
The curing agent can be considered as a co-monomer in the polymerization reaction. The first
cross-linking reaction is to react with primary amines, where K1 is the rate constant for the
catalyzed reaction by hydroxyl groups. The reacted epoxy group then act as a hydroxyl group,
making the reaction autocatalytic, with the rate equation containing a rate constant K11. The
reaction mechanism of secondary amines is similar to that of the primary amines, and the rate
constants can be written as, K2, and K22. Other reactions may also occur, such as the reaction
between epoxy and hydroxyl groups (KOH) and epoxy itself (KE). If we assume only the
catalyzed reactions are important14, then the rate equations between epoxy groups with amines
could be:
-dE/dt = K1 [C0] [E][A1] + K11 [E][A1 ][P-OH] + K2 [C0][E][A2] + K22[E][A2][P-OH] Eq. (2-
1)
where [E], [A1], [A2], [C], and [P-OH] represent the concentrations of epoxy monomer, the
primary amine, the secondary amine, hydroxyl groups from catalyst and hydroxyl groups from
curing reaction. By controlling the concentrations of epoxy and curing agent, the rate constant
ratio between secondary and primary amine can be 0.514. Then, the resulting equation could be
written as
dα/dt = [κ1+κ2 α] (1-α)2 Hc Eq. (2-2)
where α is fractional conversion of epoxy groups, κ1=1/2(K1[C0][E0]), κ2=1/2(K11[E0]2), E0 is
the concentration of epoxy groups present initially and Hc is the Horie connection factor. This
model was also modified by Kamal15. The phenomenological Kamal model of cure kinetics is
one of the most frequently cited models in the literature on epoxy systems. This model was,

13
therefore, chosen in this study and is expressed by Eq. (2-3).
dα/dt = (k1 + k2 αm) (1 - α)n Eq.(2-3)
where m and n are the kinetic exponents of the reactions. To determine the parameters of Eq.
(2-3) m, n, k1, k2 were estimated without any constraints by fitting the experimental data using
a graphical method and nonlinear curve fitting.
Using the graphical method, the constant k1 in Eq. (2-3) can be calculated from the initial
reaction rate at α = 0. The kinetic constant is assumed to be of the Arrhenius form, k1 = A exp
(-E1/RT), where A, is the pre-exponential constant, and E1 is the activation energy. Thus, Eq.
(2-3) could be rewritten in the following form:
ln (dα/dt) = ln (k1 + k2αm) + n(1 – α) Eq.(2-4)
Except for the initial region, a plot of ln(dα/dt) versus ln(1-α) is expected to be linear with a
slope n. Eq. (2-4) thus be further rearranged to give:
ln [(dα/dt)/(1 - α)n - k1 ] = ln (k2) + m ln (α) Eq.(2-5)
The first term of Eq. (2-5) can be computed from the above estimated values of k1 and n. If the
left term of Eq. (2-5) is plotted against ln(α), a straight line is produced with a slope and
intercept approximated to m and k2, respectively. To obtain more precise values, an iterative
procedure is used until n, m, Ea1, Ea2 reach a convergent point.
Other common models with which to calculate the kinetic parameters include the Kissinger’s
equation16, the Sestak-Berggren (S-B) empirical equation17, the Kissinger-Akahira-Sunose's
(KAS) isoconversional equation18 and the Friedman differential isoconversional equation19.
The Kissinger’s equation is a common and simple method to calculate the activation energy
and pre-exponential factor using Eq. (2-6). However, it assumes the reaction is a simplified
first order reaction instead of an autocatalytic reaction, which may not well describe the curing
behaviour of epoxy resins accurately.
ln (β/Tp2 ) = ln (AR/Ea ) - (Ea /RTp) Eq.(2-6)
where β is the heating rate; Tp is the temperature at which the maximum heat flow rate occurs;
A is the pre-exponential factor, also called the Arrhenius factor; R is the gas constant; Ea is the
activation energy.
The Sestak-Berggren (S-B) empirical equation is a kinetic model introduced jointly by
14
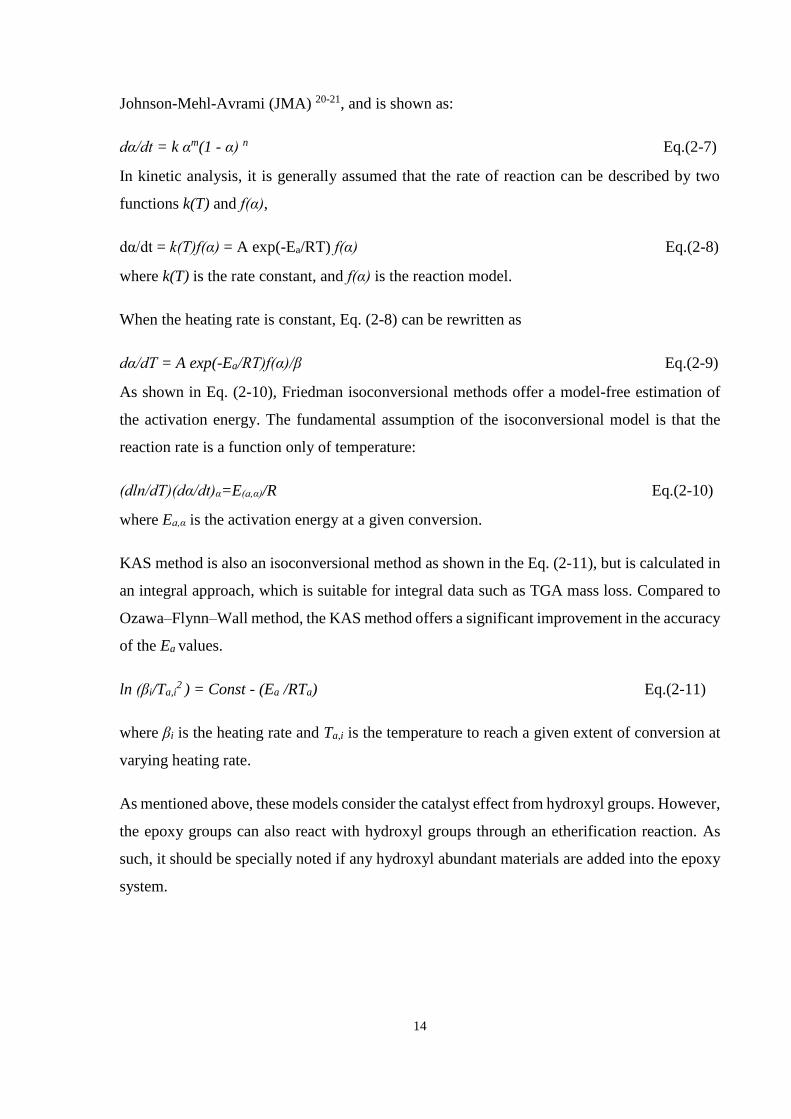
Johnson-Mehl-Avrami (JMA) 20-21, and is shown as:
dα/dt = k αm(1 - α) n Eq.(2-7)
In kinetic analysis, it is generally assumed that the rate of reaction can be described by two
functions k(T) and f(α),
dα/dt = k(T)f(α) = A exp(-Ea/RT) f(α) Eq.(2-8)
where k(T) is the rate constant, and f(α) is the reaction model.
When the heating rate is constant, Eq. (2-8) can be rewritten as
dα/dT = A exp(-Ea/RT)f(α)/β Eq.(2-9)
As shown in Eq. (2-10), Friedman isoconversional methods offer a model-free estimation of
the activation energy. The fundamental assumption of the isoconversional model is that the
reaction rate is a function only of temperature:
(dln/dT)(dα/dt)α=E(a,α)/R Eq.(2-10)
where Ea,α is the activation energy at a given conversion.
KAS method is also an isoconversional method as shown in the Eq. (2-11), but is calculated in
an integral approach, which is suitable for integral data such as TGA mass loss. Compared to
Ozawa–Flynn–Wall method, the KAS method offers a significant improvement in the accuracy
of the Ea values.
ln (βi/Ta,i2 ) = Const - (Ea /RTa) Eq.(2-11)
where βi is the heating rate and Ta,i is the temperature to reach a given extent of conversion at
varying heating rate.
As mentioned above, these models consider the catalyst effect from hydroxyl groups. However,
the epoxy groups can also react with hydroxyl groups through an etherification reaction. As
such, it should be specially noted if any hydroxyl abundant materials are added into the epoxy
system.
15
2.2 Common Bio-based Epoxy Resins Derived from Renewable Resources
Many natural resources have been assessed as replacements for BPA. In this section, we outline
the properties and synthesis methods of various types of bio-based epoxy resins, and also
compare these to the petro-based epoxy resins.
2.2.1 Oil-based Epoxy Resins
Vegetable oils, such as linseed oil, soybean oil, and castor oil, appear to be excellent renewable
raw materials for thermosetting polymers, as they are expected to be inexpensive as well as
abundant, and possess low viscosity at room temperature. Vegetable oils have become the most
popular renewable resources in the chemical industry22. These plant oils have been widely
applied in polyurethane synthesis, and epoxidized plants oils have rapidly been developed.
Some bio-epoxy commercialized products are already available in the market such as Vikoflex
from Arkema Co. However, one major concern with oil-based bio-epoxy resins is their
mechanical performance for industrial and commercial uses.
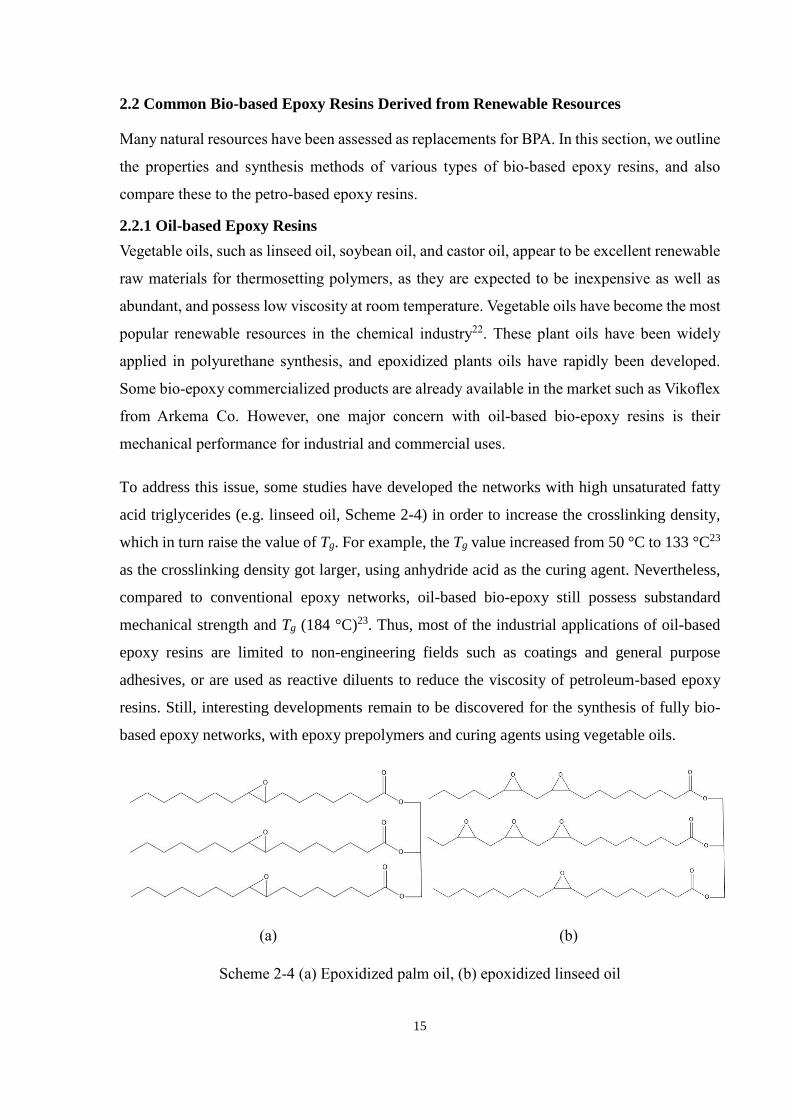
To address this issue, some studies have developed the networks with high unsaturated fatty
acid triglycerides (e.g. linseed oil, Scheme 2-4) in order to increase the crosslinking density,
which in turn raise the value of Tg. For example, the Tg value increased from 50 °C to 133 °C23
as the crosslinking density got larger, using anhydride acid as the curing agent. Nevertheless,
compared to conventional epoxy networks, oil-based bio-epoxy still possess substandard
mechanical strength and Tg (184 °C)23. Thus, most of the industrial applications of oil-based
epoxy resins are limited to non-engineering fields such as coatings and general purpose
adhesives, or are used as reactive diluents to reduce the viscosity of petroleum-based epoxy
resins. Still, interesting developments remain to be discovered for the synthesis of fully bio-
based epoxy networks, with epoxy prepolymers and curing agents using vegetable oils.
(a)
(b)
Scheme 2-4 (a) Epoxidized palm oil, (b) epoxidized linseed oil

16
2.2.2 Saccharide-based Epoxy Resins
Carbohydrates are also a renewable resource with potential to be used as a petroleum-based
polymers alternative. Some sugar-based building blocks have been studied intensively, such as
monosaccharide (sorbitol), disaccharides (sucrose and isosorbide) and derived acid compounds
(lactic acid, succinic acid, itaconic acid, and levulinic acid). However, the hydroxyls on
saccharide compounds have high pKa values compared to phenolic hydroxyls, which means
the reactivity of alcohol groups toward ECH is lower than that of phenol groups. These alcohol
groups have to compete with the new generated hydroxyls from the reactions with ECH, which
results in incomplete dehydrochlorination reactions. Thus, saccharide-based epoxy resins
require a different technique to synthesize high quality products.
Sorbitol is a hydrogenized alcohol sugar of glucose and has been selected as one of the top 12
potential bio-based platform chemicals by the U.S Department of Energy24. Sorbitol
polyglycidyl ether has been produced as well-established commercial products such as
DENACOL™ and ERISYSTM. However, due to the incompleteness of the dehydrochlorination
reaction, these commercial products contain about 10−20 wt % chlorine, which embrittles the
epoxy network, and undergoes HCl formation1. Furthermore, compared to DGEBA, its Tg and
mechanical performance remain low25.
Sucrose, commonly known as table sugar, is a disaccharide composed of glucose and fructose
units, and is produced from sugarcane or beets, yielding an annual production of approximately
175 million tons26. Different from sorbitol, the epoxidized sucrose is usually synthesized using
double bond oxidation, which usually requires excess amounts of oxidative agents. A previous
study27 indicates that not all the oxidative agents produce satisfactory results. Peracetic acid
can offer a better ratio of substitution than magnesium peroxyphthalate, m-chlroperozybenzoic
acid, phosphotungstic acid with hydrogen peroxide and molybdenum hexacarbonyl with tert-
butyl hydroperoxide. The final functionality of sucrose-based epoxy monomer can reach 3.7
(octa-allyl sucrose)-7.2(crotonyl sucrose)27.
Isosorbide is prepared from sorbitol with an annual production capacity of 1.7 million tons28.
Isosorbide is also known to be one of the building blocks for chemical syntheses such as
polyesters or polycarbonates. Many reports29-30 detail different methods of preparing
epoxidized isosorbide, which are illustrated in the Scheme 2-5. However, the thermal stability
of epoxidized isosorbide can be an issue, as it contains large amount of oxygen in its ring

17
structures and two hydroxyl groups in each repeat unit. Based on the thumb rule of structure-
stability relationship, these oxgen-containing groups are weak links which can significantly
reduce the thermal stability of epoxidized isosorbide.
Scheme 2-5 Synthesis of diglycidyl ether of isosorbide by various methods 29-30
Scheme 2-6 A new synthesis method for epoxy monomer, using lactide as an example 31
Sugar-based acids are high-potential candidates for green chemistry, and their acid groups have
a strong tendency to react with ECH groups. Surprisingly, few research studies have focused
18
on developing epoxidized sugar-based acid. Assessing the literature, there is one interesting
potential, proposed by Pitet et al.31 as shown in Scheme 2-6.
2.2.3 Lignin-based Epoxy Resins
Lignin is the most abundant aromatic polymer, and has a highly branched and irregular
structure, which varies among the species or extraction technologies. Its basic building blocks
can be schematically simplified into “C9” units, comprised of phenolic moiety bearing three
aliphatic carbons. Based on the C9 unit, lignin possesses the advantage of both aliphatic and
phenolic hydroxyl groups, in variable proportions, which can be exploited to synthesize bio-
based polymers. However, lignin is usually disposed as a waste material or is seen as a low
energy intensive byproduct in the pulping industry. In fact, less than 5 % of lignin is used for
other purposes32. Currently, many companies and research institutions have developed and
patented epoxidized lignin-based resins or curing agents, including Hitachi Co., CIMV Co.,
Araco Co., and Industrial Technology Research Institute of Taiwan. The industrial lignin-based
epoxy resins have been well summarized in the literature33 and most of them require
pretreatments on lignin.
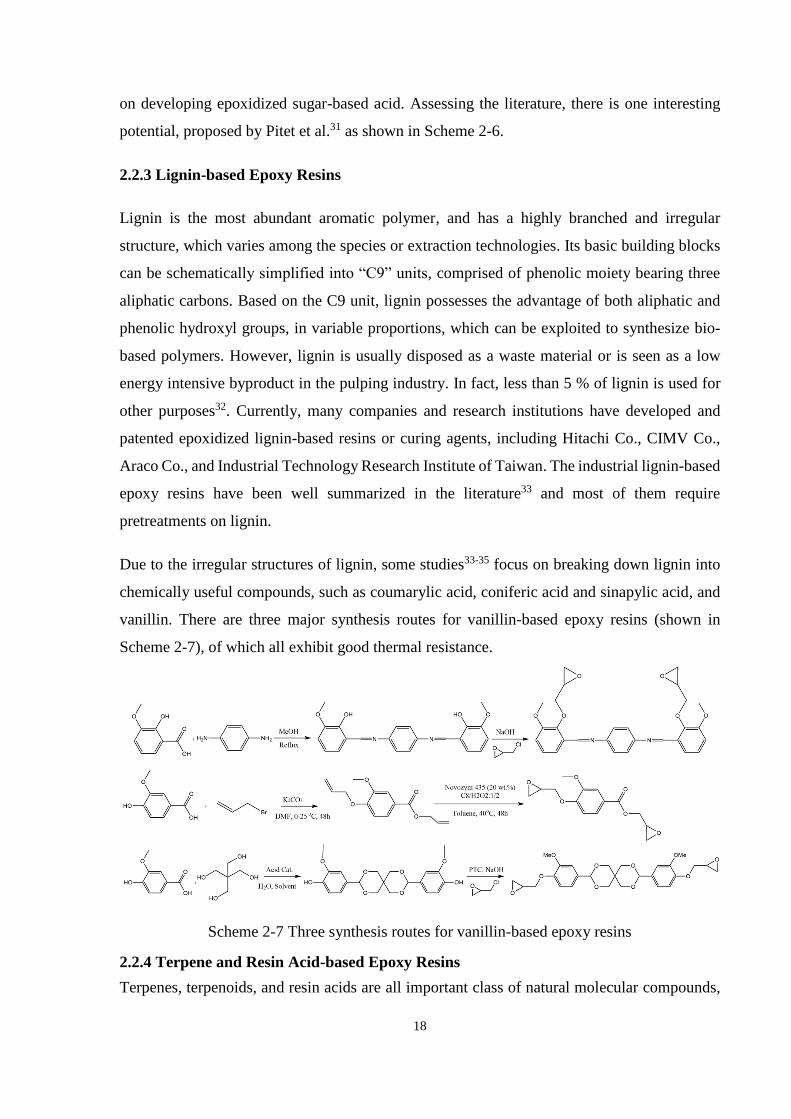
Due to the irregular structures of lignin, some studies33-35 focus on breaking down lignin into
chemically useful compounds, such as coumarylic acid, coniferic acid and sinapylic acid, and
vanillin. There are three major synthesis routes for vanillin-based epoxy resins (shown in
Scheme 2-7), of which all exhibit good thermal resistance.
Scheme 2-7 Three synthesis routes for vanillin-based epoxy resins
2.2.4 Terpene and Resin Acid-based Epoxy Resins
Terpenes, terpenoids, and resin acids are all important class of natural molecular compounds,
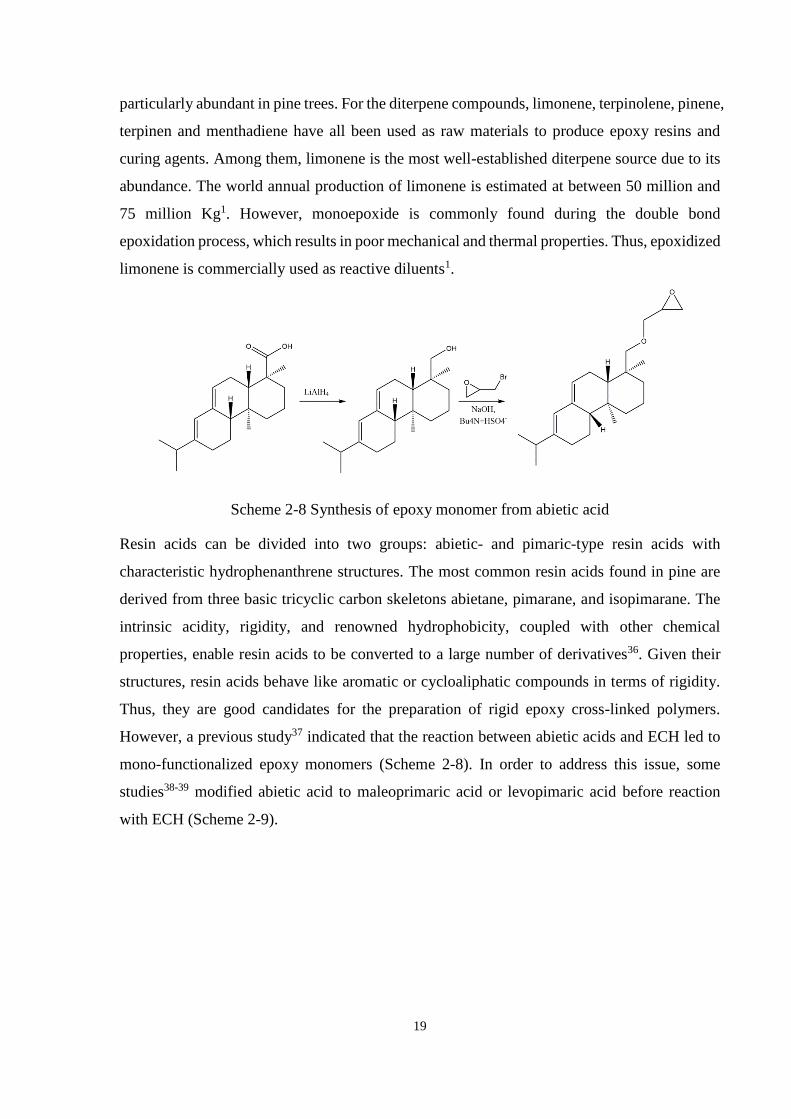
19
particularly abundant in pine trees. For the diterpene compounds, limonene, terpinolene, pinene,
terpinen and menthadiene have all been used as raw materials to produce epoxy resins and
curing agents. Among them, limonene is the most well-established diterpene source due to its
abundance. The world annual production of limonene is estimated at between 50 million and
75 million Kg1. However, monoepoxide is commonly found during the double bond
epoxidation process, which results in poor mechanical and thermal properties. Thus, epoxidized
limonene is commercially used as reactive diluents1.
Scheme 2-8 Synthesis of epoxy monomer from abietic acid
Resin acids can be divided into two groups: abietic- and pimaric-type resin acids with
characteristic hydrophenanthrene structures. The most common resin acids found in pine are
derived from three basic tricyclic carbon skeletons abietane, pimarane, and isopimarane. The
intrinsic acidity, rigidity, and renowned hydrophobicity, coupled with other chemical
properties, enable resin acids to be converted to a large number of derivatives36. Given their
structures, resin acids behave like aromatic or cycloaliphatic compounds in terms of rigidity.
Thus, they are good candidates for the preparation of rigid epoxy cross-linked polymers.
However, a previous study37 indicated that the reaction between abietic acids and ECH led to
mono-functionalized epoxy monomers (Scheme 2-8). In order to address this issue, some
studies38-39 modified abietic acid to maleoprimaric acid or levopimaric acid before reaction
with ECH (Scheme 2-9).

20
(a)
(b)
Scheme 2-9 Epoxidized imidodicarboxylic resinic of maleic anhydride (a) and
epoxidized
levopimaric acid (b) 38-39
2.2.5 Polyphenol-based Epoxy Resins
In the past five years, using polyphenols to produce bio-epoxy resins has received much
attention in academia. The most commonly studied polyphenol compounds include gallic acid,
catechin, curcumin, resveratrol, green tea tannins and cardanol.
Gallic acid can be easily isolated from gallotannins by oxidation reaction. The epoxidation
reaction between gallic acid and ECH was first reported by Tomita1, 40. The addition reaction
occurs at both the carboxylic acid group and at least one phenol group in the presence of an
ammonium type phase transfer catalyst. However, Tomita's results only achieved an average
epoxy functionality of 2 despite 4 per gallic acid. Nouailhas et al. proposed another synthetic
pathway leading to the functionality of gallic acid up to 3: gallic acid first reacts with allyl
bromide, followed by double bond oxidation by using m-chloroperbenzoic acid40. Recently,
Aouf et al. reported an adjusted synthesis condition allowing for the synthesis of
tetraepoxygallic acid41, which includes two steps: first, gallic acid reacts with ECH at 100 ºC
with the presence of benzyltriethylammonium chloride (BnEt3NCl) as the PTC catalyst for one
hour; secondly, the reaction temperature is reduced to 30 ºC and then NaOH(aq)/PTC are added
into the solution to react for 90 min.
Catechin was epoxidized either by reaction with ECH, or by alkylation with an unsaturated
halogenated compound followed by oxidation. A full characterization of the compounds shows
the presence of by-products with benzodioxane groups42, which then decreases the average
epoxy functionality. These byproducts result from an internal cyclization reaction between
phenolic alcohol in an ortho position and ECH after addition by an SN2 mechanism.

21
Some other polyphenols were investigated in the hopes to provide new biobased epoxy
monomers, such as curcumin and resveratrol43. The double bonds can be epoxidized by reaction
with m-chlorobenzoic acid, resulting in glycidyl ether compounds, thus enabling cross-linking
to provide epoxy cross-linked polymers.
The above compounds are both used in a pure state without any impurity. However, the
extraction of a single compound is very complex and not environmentally friendly, and so the
availability of these renewable resources is rather sparse. Currently, a new approach was tested,
using inexpensive green tea tannins44, which contained at least five different structures. The
resulting polymers showed an interesting Tg of between 140–190 °C, but no static mechanical
performance was reported.
The last example is of cardanol, which is a mixture of four malkylphenols differing by
unsaturation degree of aliphatic chain: 3% 3-(pentadecyl)phenol, 42% 3-(8Z-pentadecenyl)-
phenol, 17% 3-(8Z,11Z-pentadecadienyl)phenol, and 38% 3-(8Z,11Z,14Z-
pentadecatrienyl)phenol, with mainly cis conformation45. Cardanol is mainly produced from
the liquid of cashew nut shells (CNSL). The total production of CNSL approached 2.8 million
tons in 201046, and CNSL is one of the few major and economically-viable sources of naturally-
occurring phenols. CNSL can thus be regarded as a versatile and valuable raw material for
polymer production, and represents a good natural alternative to petrochemically derived
phenols. By a purifying distillation process, an industrial grade cardanol can be obtained (~90
%)47 in the form of yellow oil.
Due to its both aromatic and aliphatic structures, cardanol seems to be a promising candidate
for a substitution of petroleum-based phenol derivatives. Furthermore, cardanol enhances
coating properties, chemical and mechanical resistances, anticorrosion, and flexibility. A patent
by Cardolite Co. indicates that the epoxidized cardanol has been developed and the structure
of diepoxy cardanol can be optimized in order to get the best performance48.
2.2.6 Wood-based Epoxy Resins
For wood-based epoxy resins, all raw materials are derived from a liquefaction process such as
polyethylene glycol liquefaction49-51, and resorcinol liquefaction52. The synthesis routes follow
the ECH method. Their cured properties all seem slightly lower than petro-based epoxy resins,
such as Tg, shear strength, tensile/flexural strength and thermal resistance. An interesting

22
observation52 showed that wood-based epoxy resins had better compatibility with reinforced
fibre than the petroleum-based epoxy resins according to the composite fracture surfaces.
Considering the information above, we note that many individual components from bark
extractives such as catechin and resin acids have been used to synthesize new types of bio-
epoxy resins. However, no research has mentioned the feasibility of using bark extractives
mixture. Thus, this thesis study focuses on using bark extractives to replace BPA and develop
a novel bio-epoxy resin. The following section examines bark compositions in detail and selects
a suitable extraction process with a reasonable amount of polyphenols.
2.3 Bark Extractives and Extraction Process
Compared to wood, bark usually contains a higher percentage of extractives53-54, which are
essential phenolic resources for producing epoxies. In addition, many bark components have
been photo-degraded before timber harvesting that facilitates the subsequent extraction and
synthesis process. Thus, bark can be a suitable raw material to produce bio-based polymers.
The chemical composition of bark is diverse, significantly depending on species, growing
conditions, extraction methods, temperature, and particle size; thus obtaining analytical data
on bark samples is difficult. For that reason, the following discussion focuses only on the
chemical composition of lodgepole pine bark.
2.3.1 Chemical Composition of Pine Bark
Generally, the chemical composition of bark can be divided into four categories, cellulose,
hemicellulose, lignin and extractives (fatty acids, terpenes, resin acids, tannins, flavonoids,
lignans, stilbene etc.) as shown in Scheme 2-10. As reported by Huang and Yan55, lodgepole
pine bark (LPB) is composed of lignin (8.9 %), holocellulose (28.9 %), hexane, ethanol and
1% sodium hydroxide extractives (62.2 %). This thesis study used LPB as the raw material due
to its high concentration of extractives.
(a) Cellulose (b) Lignin unit - e.g. coniferyl alcohol

23
(c) Sugar from hemicellulose - e.g. xylose (d) Extractives - e.g. epimamool
Scheme 2-10 Major composition of pine bark
2.3.2 Extraction Technology
In order to gain access to target compounds in the bark with high yield, a suitable extraction
process is important. In the past few decades, numerous studies have conducted extraction with
traditional methods (solvent extraction), as well as novel techniques, such as ultrasound-
assisted extraction, microwave-assisted extraction, supercritical fluid extraction, and
accelerated solvent extraction. These techniques have been used to recover bioactive molecules
from plants to completely extract the compounds of interest without altering their properties;
however, these methods increase the cost of manufacturing and decrease the yield of extraction.
Thus, this thesis study only reviews the conventional solvent extraction process.
In the literature, six common solvent extraction fractions of pine bark have been examined:
hexane, benzene, acetone, methanol, water steam, and 1% sodium hydroxide. The extraction
compounds can vary significantly based on the solvent polarity. The polarity of hexane is only
0.1, but the extractive yield from LPB is around 15-16.4 %55-56 and the major compounds
include diterpene (>1,344 μg/g), fatty acid (> 432 μg/g) and wax ester (>248 μg/g). Among all
the diterpene, resin acids such as pimaral, andrographolide and dehydroabietal are the most
abundant categories56 (these structures are listed in the Scheme 2-11, a-c). Compared to other
organic solvents, hexane has the highest extractive yield from LPB.
Hergert57 studied lodgepole pine bark in the 1950s and demonstrated that it is richer in
flavonoids than the bark of other pine species. Five solvents were tested and their target
compounds and yield are as shown in Table 2-3. For the detailed chemical composition analysis,
the pine bark was pre-extracted with benzene, and then extracted with ether and acetone. It was
discovered that myricetin (Scheme 2-11d) accounts for 90 % of the total flavonoid fraction.

24
Table 2-3 Yield and major components of lodgepole pine bark extractives.
Solvents Target Compounds Yield (%)
Petroleum Ether Wax, resin acids 5.53 ± 1.87
Benzene Wax, oxidized resin acids 2.43 ± 0.39
Ethyl Ether Flavonoids, phenolic wax 1.59 ± 1.10
Ethanol Phlobaphene 2.05 ± 0.24
Hot water Tannin and carbohydrates 16.1 ± 3.04
To increase the yield of diterpene, Rowe and Scroggins58 used a combination process to extract
lodgepole pine bark. The ground pine bark were first extracted by benzene and then followed
by 1 N NaOH (~ 4 wt.% NaOH), extracting 28.7 % of lodgepole pine bark, which was 10 times
higher than the previous study. Based on the total extractives, 20% was epimanool; 42.6 % was
free acids (linoleic acid and oleic acid were the two major compounds) and 9.4 % was combined
acids.
Shrimpton59 studied the three solvent systems (steam/acetone/methanol) on mountain pine
beetle infested wound response bark. Compared to the non-infested pine bark, the former
wound tissues contain more resin acid. Shrimpton determined that steam-volatile fraction
consisted mainly of monoterpenes; acetone fraction was dominant by resin acid; and methanol
fraction was mainly sugars. The reported compounds are in agreement with the results from
Rowe and Scroggins58 and Backlund et al.56. However, the yield of extractives in each fraction
was less than 7 %, which was lower than expected.
(a) Pimaral (b) Andrographolide
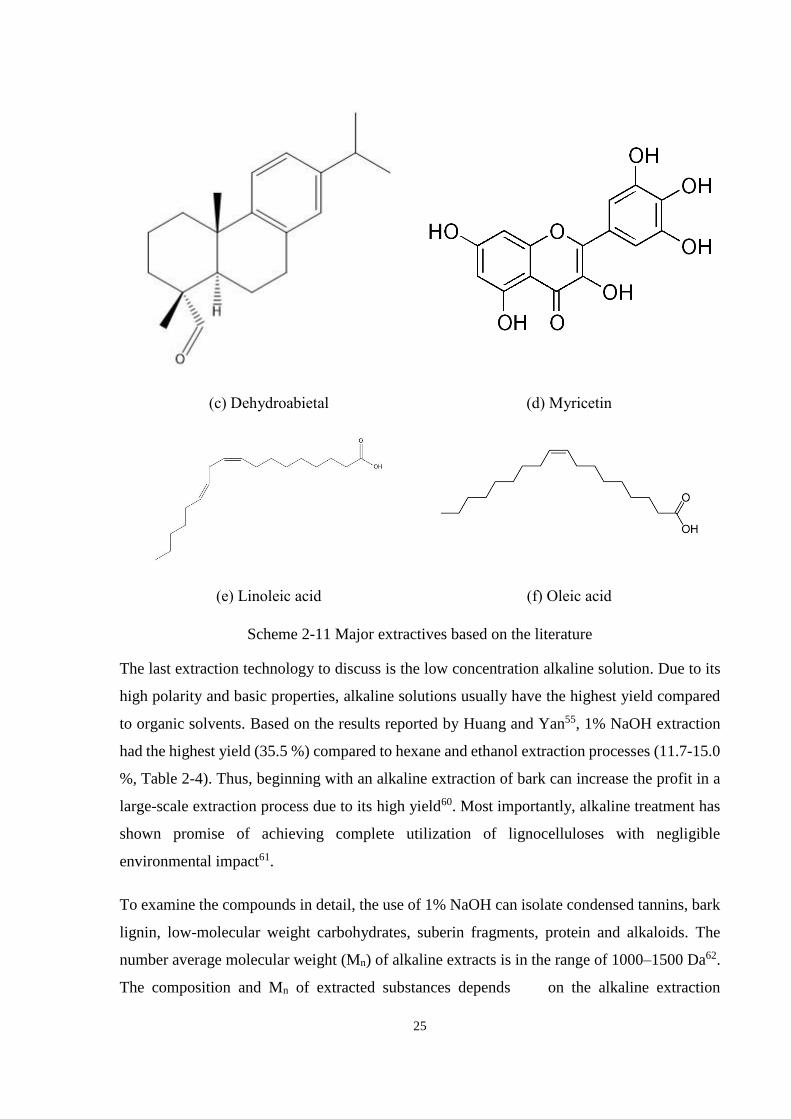
25
(c) Dehydroabietal (d) Myricetin
(e) Linoleic acid (f) Oleic acid
Scheme 2-11 Major extractives based on the literature
The last extraction technology to discuss is the low concentration alkaline solution. Due to its
high polarity and basic properties, alkaline solutions usually have the highest yield compared
to organic solvents. Based on the results reported by Huang and Yan55, 1% NaOH extraction
had the highest yield (35.5 %) compared to hexane and ethanol extraction processes (11.7-15.0
%, Table 2-4). Thus, beginning with an alkaline extraction of bark can increase the profit in a
large-scale extraction process due to its high yield60. Most importantly, alkaline treatment has
shown promise of achieving complete utilization of lignocelluloses with negligible
environmental impact61.
To examine the compounds in detail, the use of 1% NaOH can isolate condensed tannins, bark
lignin, low-molecular weight carbohydrates, suberin fragments, protein and alkaloids. The
number average molecular weight (Mn) of alkaline extracts is in the range of 1000–1500 Da62.
The composition and Mn of extracted substances depends on the alkaline extraction

26
conditions. Compared to lignin, the molecular weight of alkaline extraction is lower.
Furthermore, some polyphenols cannot be extracted with neutral organic solvents or hot water,
but are soluble in 1% NaOH at an elevated temperature. For the above reasons, 1 % NaOH
extraction process is an ideal approach to isolate the polyphenols from bark, and also facilitate
the epoxidation synthesis with ECH.
Table 2-4 Extraction amounts of various extraction solvents and tree barks 63 Bark Hexane
solubles (%)
Ethanol
solubles (%)
1% NaOH
solubles (%)
Formaldehyde-condensable
polyphenols in 1% NaOH
solubles
Lodgepole pine 15.0 11.7 35.5 8.3
Aspen 8.6 22.3 26.2 3.7
White birch 1.9 3.1 23.7 6.8
Sugar maple 2.3 5.5 20.5 2.6
Balsam fir 8.9 4.5 32.6 12.5
2.4 Reinforced Bio-epoxy Resins
Synthesis of bio-epoxy resins is the first step towards developing a green material. After
synthesis, the overall properties should also be considered in order to prepare green materials
with well-defined applications. Among all the properties, mechanical performance is one of the
most important criteria from an industry point of view. As mentioned above, most bio-epoxy
resins act as reactive diluents, which can improve toughness, reduce viscosity, and give better
wetting and impregnation of fibre, while it can also compensate some mechanical properties.
To address this issue, the most common approach to enhance the overall mechanical
performance of the epoxy resins is to add reinforcements.
2.4.1 Types of Reinforcements
In order to improve their properties, bio-based epoxy networks have been reinforced with
various materials, including glass fibre, natural fibres, nanoclays, and nanofibres. Glass fibre
is one of the most common reinforcing fibres for epoxy resins as several studies64-65 have shown
that glass fibres can significantly improve the tensile strength and modulus of bio-based epoxy
composites. However, previous studies have shown that glass fibres have higher environmental
impacts during the manufacturing process compared to the natural fibres. To address this issue,
many bio-fibres have been incorporated into bio-based epoxy resins, such as wheat straw66,
flax yarn/woven fabric67, corn stover68, regenerated cellulose69, hemp fibre62, banana fibre70,
and wood flour71. Compared to glass fibre, the reinforcement effect of natural fibre is slightly

27
lower. Among all the natural fibre reinforced biocomposites, flax yarn composites67 exhibit the
highest tensile strength of 298 MPa and flexural strength of 117 MPa. However, these micro-
scale fibres are opaque, which may limit their applications.
In the past two decades, nanocomposites have drawn much attention from academia and
industry. Nanoclay has occupied a large portion of nanocomposites research due to the low
cost of silicates. However, the mechanical improvement of nanoclays on bio-based epoxy resin
is limited owing to its layered structure. Most studies focus on its thermal resistance, catalytic
effect, and water resistance72-73. Currently, reinforcing bio-polymers NCFs have become more
popular. Masoodi et al.74 reported a bio-epoxy resin reinforced by NCFs. Although this study
provided a high amount of swelling test data, no mechanical improvements were observed in
this study. The potential of using NCFs thus requires further study.
2.4.2 Cellulose Nanostructure
Since 1985, the cellulosic nanostructure has been studied as reinforcement in nano-
composites75. Various terms were used to describe those cellulosic nanostructures, including
nano-whiskers, nano-crystals, micro-fibrils, micro-crystals, or micro-crystallites. These
terminologies may have led to some misunderstandings and ambiguities. Recently, several
review reports75-77 have sought to organize these descriptors. There are basically two families
of nanosized cellulosic structures, nanocellulose crystals and NCFs.
In morphology, NCFs are long and flexible with the length generally in the micrometer scale,
consisting of alternating crystalline and amorphous domains. Another noteworthy difference
between these two kinds of nanostructures is that NCFs display a web-like structure. Compared
with nanocellulose crystals, NCFs have a higher amorphous content and can be extracted via
mechanical processing of various natural materials. Nowadays, NCFs are usually obtained by
a homogenization or a refining process that displays high elastic modulus and high aspect ratio,
greater than 100, with diameters that range from 10-40 nm. In this study, NCFs were selected,
and their production process has been reported in other research78.
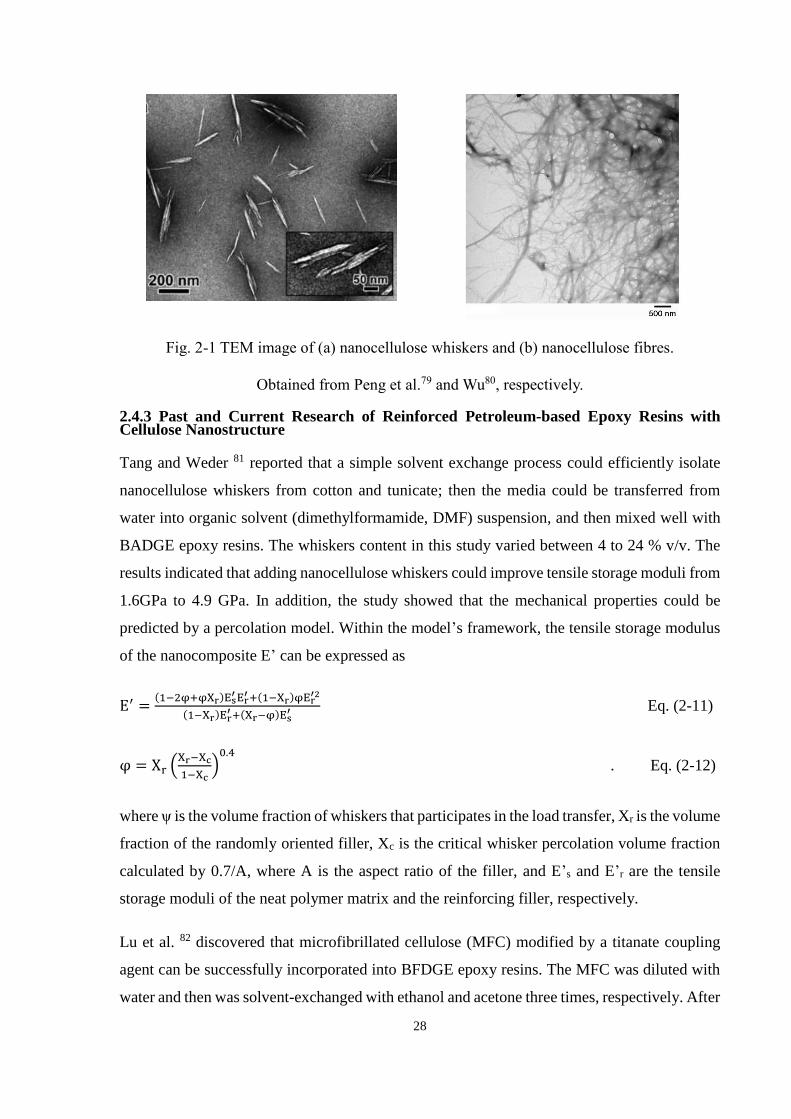
28
Fig. 2-1 TEM image of (a) nanocellulose whiskers and (b) nanocellulose fibres.
Obtained from Peng et al.79 and Wu80, respectively.
2.4.3 Past and Current Research of Reinforced Petroleum-based Epoxy Resins with Cellulose Nanostructure
Tang and Weder 81 reported that a simple solvent exchange process could efficiently isolate
nanocellulose whiskers from cotton and tunicate; then the media could be transferred from
water into organic solvent (dimethylformamide, DMF) suspension, and then mixed well with
BADGE epoxy resins. The whiskers content in this study varied between 4 to 24 % v/v. The
results indicated that adding nanocellulose whiskers could improve tensile storage moduli from
1.6GPa to 4.9 GPa. In addition, the study showed that the mechanical properties could be
predicted by a percolation model. Within the model’s framework, the tensile storage modulus
of the nanocomposite E’ can be expressed as
E′ =(1−2φ+φXr)Es
′ Er′ +(1−Xr)φEr
′2
(1−Xr)Er′ +(Xr−φ)Es
′ Eq. (2-11)
φ = Xr (Xr−Xc
1−Xc)
0.4
. Eq. (2-12)
where ψ is the volume fraction of whiskers that participates in the load transfer, Xr is the volume
fraction of the randomly oriented filler, Xc is the critical whisker percolation volume fraction
calculated by 0.7/A, where A is the aspect ratio of the filler, and E’s and E’r are the tensile
storage moduli of the neat polymer matrix and the reinforcing filler, respectively.
Lu et al. 82 discovered that microfibrillated cellulose (MFC) modified by a titanate coupling
agent can be successfully incorporated into BFDGE epoxy resins. The MFC was diluted with
water and then was solvent-exchanged with ethanol and acetone three times, respectively. After

29
solvent-exchange, the desired amounts of epoxy resin were added into MFC acetone
suspension. The tensile storage modulus of modified MFC/Epoxy composites increased by
approximately 20% compared with that of untreated samples. In addition, titanate modified
MFC showed a higher binding energy than silane modified MFC using XPS analysis.
Ohinish et al. 83 improved the tensile strength of UV-light curing epoxy from 8-17% by adding
MFC, which was solvent-exchanged by ethanol. The fibre loading amount was 0.5 w.t % and
the test specimens were cured by conventional UV curing technique. In addition, this report
mentioned that higher curing temperature can increase tensile strength and interfacial strength,
which was calculated by the average broken fibre length, nominal tensile strength and the
diameter of MFC.
Ruiz et al. 84 produced a new waterborne epoxy coating based on cellulose nano-crystals, which
contributed to an important improvement of the storage modulus of the composite. In addition,
the authors noted that the addition of cellulose dramatically increased the viscosity and that
increasing the amount of emulsifier, shear rate, and time of mixing could reduce the emulsion
droplet diameter.
Shimazaki et al. 85 used a NCFs membrane and then immersed it in BADGE epoxy resins to
produce a transparent and an excellent thermal conductive film. The in-plane thermal
conductivity of the nano-composite was over 1.0 W m-1 K-1, which was 3-5 times higher than
that of conventional transparent resins. The crystalline nature of the NCFs provided excellent
phonon pathways through the nano-composite. The tensile modules of films also increased
from 3.7 GPa (neat polymer) to 5 GPa.

30
References
1. R. Auvergne, S. Caillol, G. David, B. Boutevin and J.-P. Pascault, Chemical Reviews,
2013, 114, 1082-1115.
2. E. Petrie, Epoxy adhesive formulations, McGraw-Hill, 2005.
3. J.-P. Pascault and R. J. J. Williams, Epoxy polymers : new materials and innovations,
Wiley-VCH, Weinheim, 2009.
4. J. D. Durig, Comparisons of epoxy technology for protective coatings and linings in
wastewater facilities, Houston, 1999.
5. A. E. Fletcher, Elsevier Advanced Technology Oxford, 1992.
6. C. Red, in High-Performance Composites, Ryan Delahanty, CW Compositesworld, 2014.
7. T. Orbichem, CHEM-NET FACTS CHEMICAL MARKET INSIGHT AND
FORESIGHT - ON A SINGLE PAGE- Bisphenol A,
http://www.orbichem.com/userfiles/CNF%20Samples/bpa_13_11.pdf.
8. V. Technical Research Centre of Finland, New products from bark to replace fossil
compounds: Adhesives and insulating foams from softwood bark tannins.,
http://www.sciencedaily.com/releases/2015/02/150223084051.htm.
9. M. Greenberg, R. Hamilton, S. Phillips and G. J. McCluskey, Occupational, Industrial,
and Environmental Toxicology, Mosby, Philadelphia, 1997.
10. H. Batzer and S. A. Zahir, J Appl Polym Sci, 1977, 21, 1843-1857.
11. N. S. Enikolopyan, M. A. Markevitch, L. S. Sakhonenko, S. Z. Rogovina and V. G.
Oshmyan, Journal of Polymer Science: Polymer Chemistry Edition, 1982, 20, 1231-1245.
12. B. Ellis, Chemistry and Technology of Epoxy Resins, Springer Netherlands, 1993.
13. J. Pielichowski and P. Czub, Angew Makromol Chem, 1997, 251, 1-12.
14. K. Horie, H. Hiura, M. Sawada, I. Mita and H. Kambe, J Polym Sci A1, 1970, 8, 1357-&.
15. S. Sourour and M. R. Kamal, Thermochim Acta, 1976, 14, 41-59.
16. H. E. Kissinger, J Res Nat Bur Stand, 1956, 57, 217-221.
17. J. B. Sestak, G., Thermochim, 1971, 274, 173-177.
18. T. A. a. T. Sunose, Method of determining activation deterioration constant of electrical
insulating materials, Chiba Institution, 1971.
19. H. L. Friedman, Journal of Polymer Science Part C: Polymer Symposia, 1964, 6, 183-
195.
20. M. Avrami, J Chem Phys, 1939, 7, 1103-1112.
31
21. M. Avrami, J Chem Phys, 1941, 9, 177-184.
22. T. W. Abraham and R. Hofer, in Polymer science: A comprehensive reference, ed. M. M.
K. Matyjaszewski, Elsevier, Oxford, 2012, vol. 10, ch. 3, pp. 15-58.
23. J. D. Earls, J. E. White, L. C. Lopez, Z. Lysenko, M. L. Dettloff and M. J. Null, Polymer,
2007, 48, 712-719.
24. T. Werpy, G. Petersen, A. B. Aden, J., J. Holladay, J. White, A. Manheim, D. Eliot, L.
Lasure and S. Jones, ed. U. S. D. o. Energy, U.S. Department of Energy, WASHINGTON
DC, 2004, vol. 1.
25. M. Shibata, S. Yoshihara, M. Yashiro and Y. Ohno, J Appl Polym Sci, 2013, 128, 2753-
2758.
26. U. S. D. o. Agriculture, ed. Agriculture, USDA, Washington, D.C., 2015.
27. N. D. Sachinvala, D. L. Winsor, R. K. Menescal, I. Ganjian, W. P. Niemczura and M. H.
Litt, Journal of Polymer Science Part A: Polymer Chemistry, 1998, 36, 2397-2413.
28. TransparencyMarketResearch, Global Sorbitol Market – Isosorbide, Propylene Glycol,
Glycerol & Other Downstream Opportunities, Applications (Toothpaste, Vitamin C,
Sweetener Etc.), Size, Share, Growth, Trends And Forecast 2012–2018, 2013.
29. M. Chrysanthos, J. Galy and J. P. Pascault, Polymer, 2011, 52, 3611-3620.
30. D. Achet, M. Delmas and A. Gaset, Biomass, 1986, 9, 247-254.
31. L. M. Pitet, S. B. Hait, T. J. Lanyk and D. M. Knauss, Macromolecules, 2007, 40, 2327-
2334.
32. M. Kleinert and T. Barth, Chemical Engineering & Technology, 2008, 31, 736-745.
33. T. Koike, Polymer Engineering & Science, 2012, 52, 701-717.
34. M. Ochi, T. Shiba, H. Takeuchi, M. Yoshizumi and M. Shimbo, Polymer, 1989, 30, 1079-
1084.
35. M. Fache, E. Darroman, V. Besse, R. Auvergne, S. Caillol and B. Boutevin, Green Chem,
2014, 16, 1987-1998.
36. H. Wang, X. Liu, B. Liu, J. Zhang and M. Xian, Polym Int, 2009, 58, 1435-1441.
37. H. H. Wang, B. Liu, X. Q. Liu, J. W. Zhang and M. Xian, Green Chem, 2008, 10, 1190-
1196.
38. A. M. Atta, R. Mansour, M. I. Abdou and A. M. Sayed, Polym Advan Technol, 2004, 15,
514-522.
39. F. Mustata and I. Bicu, Eur Polym J, 2010, 46, 1316-1327.

32
40. H. Nouailhas, C. Aouf, C. Le Guerneve, S. Caillol, B. Boutevin and H. Fulcrand, Journal
of Polymer Science Part A: Polymer Chemistry, 2011, 49, 2261-2270.
41. C. Aouf, H. Nouailhas, M. Fache, S. Caillol, B. Boutevin and H. Fulcrand, Eur Polym J,
2013, 49, 1185-1195.
42. C. Aouf, C. Le Guernevé, S. Caillol and H. Fulcrand, Tetrahedron, 2013, 69, 1345-1353.
43. F. Dasgupta, Google Patents, 2013.
44. S. Benyahya, C. Aouf, S. Caillol, B. Boutevin, J. P. Pascault and H. Fulcrand, Ind Crop
Prod, 2014, 53, 296-307.
45. M. Sultania, J. S. P. Rai and D. Srivastava, Journal of Hazardous Materials, 2011, 185,
1198-1204.
46. C. S. a. C. R. K. Prabakaran Golden Research Thoughts Journal 2014, 3.
47. P. Phani Kumar, R. Paramashivappa, P. J. Vithayathil, P. V. Subba Rao and A. Srinivasa
Rao, J Agr Food Chem, 2002, 50, 4705-4708.
48. Z. Dai and M. J. Chen, Google Patents, 2001.
49. M. Kobayashi, K. Tukamoto and B. Tomita, Holzforschung, 2000, 54, 93-97.
50. T. Asano, M. Kobayashi, B. Tomita and M. Kajiyama, Holzforschung, 2007, 61, 14-18.
51. C. C. Wu and W. J. Lee, J Appl Polym Sci, 2010, 116, 2065-2073.
52. H. Kishi and A. Fujita, Environ Eng Manag J, 2008, 7, 517-523.
53. T. Filbakk, R. Jirjis, J. Nurmi and O. Hoibo, Biomass Bioenerg, 2011, 35, 3342-3349.
54. I. Miranda, J. Gominho and H. Pereira, Bioresources, 2012, 7, 4350-4361.
55. Z. Huang and N. Yan, Wood and fiber science, 2014, 46, 167-174.
56. I. Backlund, M. Arshadi, A. J. Hunt, C. R. McElroy, T. M. Attard and U. Bergsten, Ind
Crop Prod, 2014, 58, 220-229.
57. H. L. Hergert, J Org Chem, 1956, 21, 534-537.
58. J. W. Rowe and Scroggin.Jh, J Org Chem, 1964, 29, 1554-&.
59. Shrimpto.Dm, Can J Bot, 1973, 51, 527-535.
60. G. Vazquez, G. Antorrena and J. C. Parajo, Wood Sci Technol, 1987, 21, 155-166.
61. B. Xiao, X. F. Sun and R. C. Sun, Polym Degrad Stabil, 2001, 74, 307-319.
62. D. M. Fradinho, C. P. Neto, D. Evtuguin, F. C. Jorge, M. A. Irle, M. H. Gil and J. P. de
Jesus, Ind Crop Prod, 2002, 16, 23-32.

33
63. Z. Huang and N. Yan, Wood and fiber science, 2014, 46, 8.
64. S. N. Khot, J. J. Lascala, E. Can, S. S. Morye, G. I. Williams, G. R. Palmese, S. H.
Kusefoglu and R. P. Wool, J Appl Polym Sci, 2001, 82, 703-723.
65. Y. S. Lu and R. C. Larock, Macromol Mater Eng, 2007, 292, 1085-1094.
66. D. P. Pfister and R. C. Larock, J Appl Polym Sci, 2012, 123, 1392-1400.
67. X. S. Huang and A. Netravali, Compos Sci Technol, 2007, 67, 2005-2014.
68. D. P. Pfister and R. C. Larock, Bioresource Technol, 2010, 101, 6200-6206.
69. K. Adekunle, C. Patzelt, A. Kalantar and M. Skrifvars, J Appl Polym Sci, 2011, 122,
2855-2863.
70. C. Merlini, V. Soldi and G. M. O. Barra, Polym Test, 2011, 30, 833-840.
71. M. Mosiewicki, J. Borrajo and M. I. Aranguren, Polym Int, 2005, 54, 829-836.
72. Z. S. Liu, S. Z. Erhan and J. Y. Xu, Polymer, 2005, 46, 10119-10127.
73. Y. S. Lu and R. C. Larock, Biomacromolecules, 2006, 7, 2692-2700.
74. R. Masoodi, R. F. El-Hajjar, K. M. Pillai and R. Sabo, Mater Design, 2012, 36, 570-576.
75. S. J. Eichhorn, A. Dufresne, M. Aranguren, N. E. Marcovich, J. R. Capadona, S. J.
Rowan, C. Weder, W. Thielemans, M. Roman, S. Renneckar, W. Gindl, S. Veigel, J.
Keckes, H. Yano, K. Abe, M. Nogi, A. N. Nakagaito, A. Mangalam, J. Simonsen, A. S.
Benight, A. Bismarck, L. A. Berglund and T. Peijs, J Mater Sci, 2010, 45, 1-33.
76. S. J. Eichhorn, Soft Matter, 2011, 7, 303-315.
77. I. Siro and D. Plackett, Cellulose, 2010, 17, 459-494.
78. Q. X. Xu, J. Yi, X. F. Zhang and H. L. Zhang, Eur Polym J, 2008, 44, 2830-2837.
79. B. L. Peng, N. Dhar, H. L. Liu and K. C. Tam, Can J Chem Eng, 2011, 89, 1191-1206.
80. N. C. Wu, Master, University of Toronto, 2010.
81. L. M. Tang and C. Weder, Acs Appl Mater Inter, 2010, 2, 1073-1080.
82. J. Lu, T. Wang and L. T. Drzal, Compos Part a-Appl S, 2008, 39, 738-746.
83. Y. Ohnishi, T. Fujii and K. Okubo, Wit Trans Built Env, 2008, 97, 139-148.
84. M. M. Ruiz, J. Y. Cavaille, A. Dufresne, C. Graillat and J. F. Gerard, Macromol Symp,
2001, 169, 211-222.
85. Y. Shimazaki, Y. Miyazaki, Y. Takezawa, M. Nogi, K. Abe, S. Ifuku and H. Yano,
Biomacromolecules, 2007, 8, 2976-2978.

34

35
Chapter 3 Characterization of Bark Extractive-based Bio-epoxy
Resins
Abstract
This chapter outlines the synthesis and characterization of bio-based epoxy resins derived from
bark extractives. The resins were prepared at various temperatures and catalyst amounts to
determine an optimal for the yield and epoxy equivalent weight value. FTIR and NMR
techniques were used to characterize the chemical structures of E-epoxy monomers.
Measurement results indicated a successful epoxidation of bark extractives after reaction with
epichlorohydrin. GPC results revealed that the molecular weights and polydispersities of E-
epoxy monomers were lower than those of lignin epoxy (L-epoxy) monomers. The curing
kinetic parameters calculated with the Kissinger method and the Model-Free method showed
that E-epoxy had a lower curing activation energy value than petroleum-based epoxy (P-
epoxy). Compared to P-epoxy, E-epoxy/P-epoxy blending system displayed comparable tensile
strength and thermal stability. Research outcome demonstrated promises of using bark
extractives to synthesize epoxy resins replacing toxic BPA.
___________________________________________________________________________
A version of this chapter was published in Green Chemistry (2014) DOI: 10.1039/c4gc00459k

36
3.1 Introduction
Epoxy resins have widespread uses ranging from sealing integrated circuits to rocket coatings
due to their high strength, good compatibility with most materials, and great thermal stability.
However, with the recent awareness of toxicity associated with BPA, a key ingredient of epoxy
resin, there is a need to develop alternative safe raw materials for the resin synthesis. During
the past decade, researchers have explored several natural resources to replace BPA, such as
vegetable oil (soybean oil1-2, linseed oil3, palm oil4, castor oil5 and cashew nut shell liquid6),
simple polyols7, lignin8-9, rosin10, and liquefied biomass11-13. These polymers can reduce
dependency of the resin synthesis on petroleum resources and have the potential to be also
biodegradable. Among these alternatives, vegetable oil, liquefied biomass, and lignin have
emerged as the most promising materials, mainly owing to their commercial feasibility14.
Nevertheless, these renewable resource-derived polymers have limitations. For example, the
aliphatic structure of epoxidized oil results in low mechanical strength and poor thermal
stability15. In order to improve these properties, liquefied biomass, with a high aromatic ring
structure content, is used to enhance polymer mechanical and thermal performance16. However,
the liquefaction process is energy intensive and requires toxic solvents, like phenol17. Lignin,
the major waste material from the pulping industry, has been used to produce lignin-based
epoxy with good mechanical performance and thermal stability. However, the molecular
weight of lignin ranges from 2,000 Da to 50,000 Da18, leading to high viscosities that may
cause difficulties during manufacturing or use since a major application of epoxy resins is in
adhesives which require moderate viscosities in order to perfectly wet the substrate surfaces19.
On the other hand, bark extractives contain large amounts of low molecular weight polyphenols
and require less energy to extract. They have good potential to be used as alternative materials
to replace BPA. However, there is no reported work on bark extractive-based epoxy resin in
the literature.
Tree bark, a waste material of timber processing, is abundant, renewable, and rich in phenolic
compounds. Compared to wood, bark contains a higher amount of lignin and polyphenols (42-
55%)20. However, bark is usually considered to be a waste and is used as firelogs or burnt as
hog fuel, despite having a heating value two times lower than fuel oil21. Recently, various
polymers have been developed from bark, including novolac22 and resol-type23 phenol
formaldehyde resins (PF) as well as polyurethane24. Low molecular weight polyphenolic
compounds can be extracted from bark using various solvents, such as acetone, ethanol,
methanol, organic solvent mixtures, and 1 % NaOH(aq). Among these extraction, 1 % NaOH(aq)
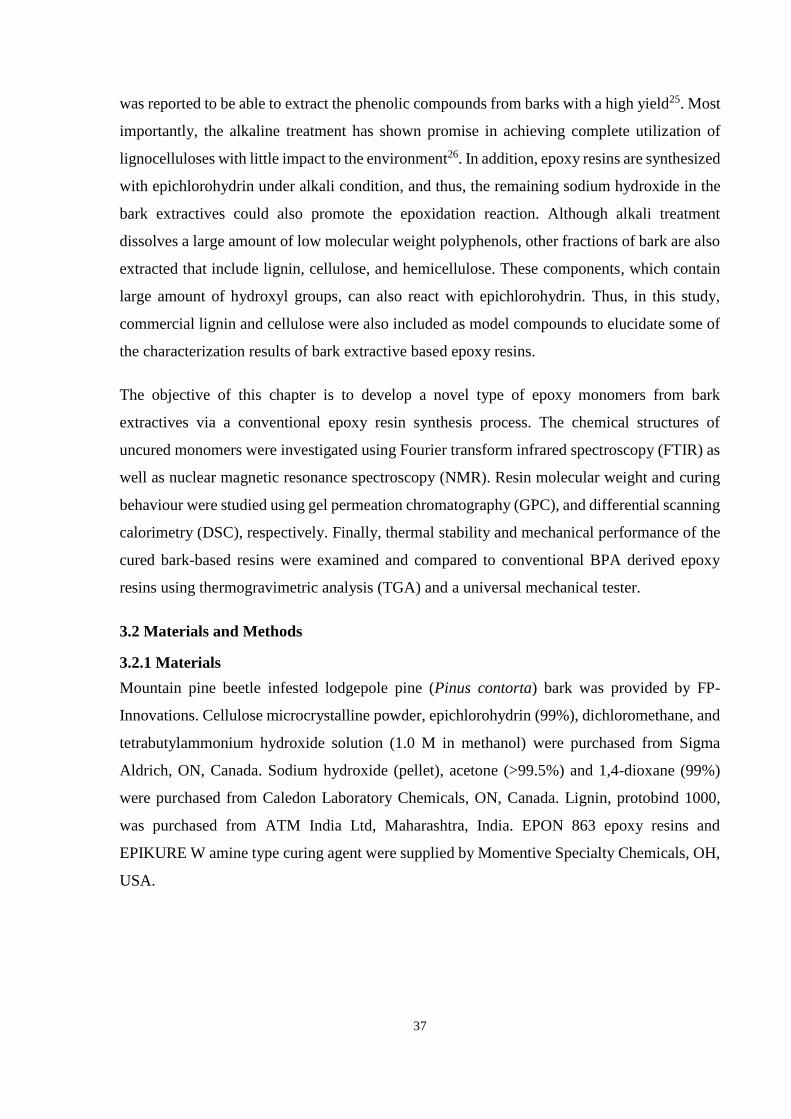
37
was reported to be able to extract the phenolic compounds from barks with a high yield25. Most
importantly, the alkaline treatment has shown promise in achieving complete utilization of
lignocelluloses with little impact to the environment26. In addition, epoxy resins are synthesized
with epichlorohydrin under alkali condition, and thus, the remaining sodium hydroxide in the
bark extractives could also promote the epoxidation reaction. Although alkali treatment
dissolves a large amount of low molecular weight polyphenols, other fractions of bark are also
extracted that include lignin, cellulose, and hemicellulose. These components, which contain
large amount of hydroxyl groups, can also react with epichlorohydrin. Thus, in this study,
commercial lignin and cellulose were also included as model compounds to elucidate some of
the characterization results of bark extractive based epoxy resins.
The objective of this chapter is to develop a novel type of epoxy monomers from bark
extractives via a conventional epoxy resin synthesis process. The chemical structures of
uncured monomers were investigated using Fourier transform infrared spectroscopy (FTIR) as
well as nuclear magnetic resonance spectroscopy (NMR). Resin molecular weight and curing
behaviour were studied using gel permeation chromatography (GPC), and differential scanning
calorimetry (DSC), respectively. Finally, thermal stability and mechanical performance of the
cured bark-based resins were examined and compared to conventional BPA derived epoxy
resins using thermogravimetric analysis (TGA) and a universal mechanical tester.
3.2 Materials and Methods
3.2.1 Materials
Mountain pine beetle infested lodgepole pine (Pinus contorta) bark was provided by FP-
Innovations. Cellulose microcrystalline powder, epichlorohydrin (99%), dichloromethane, and
tetrabutylammonium hydroxide solution (1.0 M in methanol) were purchased from Sigma
Aldrich, ON, Canada. Sodium hydroxide (pellet), acetone (>99.5%) and 1,4-dioxane (99%)
were purchased from Caledon Laboratory Chemicals, ON, Canada. Lignin, protobind 1000,
was purchased from ATM India Ltd, Maharashtra, India. EPON 863 epoxy resins and
EPIKURE W amine type curing agent were supplied by Momentive Specialty Chemicals, OH,
USA.

38
3.2.2 Methods
3.2.2.1 Bark Extraction
Bark extractives were obtained from bark chips using 1% NaOH(aq) solution at 90 °C for two
hours with a 10 : 1 solvent/bark weight ratio. After filtering the residue fraction, the
concentrated extractives were spray-dried using a laboratory spray drier (Yamato GB210)
under the following conditions: inlet temperature of 160 °C, outlet temperature of 60 °C and
air pressure of 0.1 MPa.
3.2.2.2 Synthesis of Bark Extractive Epoxy Resins
E-epoxy was prepared following a similar method to that reported for commercially available
resins. Bark extractives (15 g), epichlorohydrin (150 g), solvent (1,4-dioxane, 150 g) and phase
transfer catalyst (tetrabutylammonium hydroxide solution, 2 mL) were placed in a round
bottom 3-neck glass flask and the temperature was raised to 60 °C while stirring. An excess of
epichlorohydrin was used in a mass ratio of bark extractives to epichlorohydrin of 1 to 10. The
experiments were carried out following a two-factor design, including three synthesis
temperatures (40 °C, 60 °C, 100 °C) and three sodium hydroxide amounts (0.5 mol, 1 mol, 2
mol). 50% w/w sodium hydroxide(aq) was then slowly added to the mixture using a pressure-
equalizing dropping funnel while stirring. The flask was kept at 60 °C for a total of 6 hours to
achieve the addition reaction of epichlorohydrin and the ring formation of epoxy groups. The
products were then diluted and washed with acetone, and the solution was filtered to remove
salt. The acetone and non-reacted epichlorohydrin in the filtered resin solution were evaporated
using a rotary evaporator at 120 °C under reduced pressure. Lignin-based epoxy resins and
cellulose-based epoxy resins were prepared following the same extraction and synthesis
procedure as that described. The replicate of each sample is one.
3.2.2.3 Curing of the Epoxy Monomers
Samples used for the physical testing were prepared by solvent casting and the amount of curing
agent was adjusted according to the resin’s epoxy equivalent weight (EEW) value. EPIKURE
W was used as a curing agent, and the resins were then placed in an oven for curing. The cure
profile was designed as follows: 80 °C for 1 hour followed by 121 °C for 1 hour and 177 °C
for 2 hours. Five samples were prepared and the average value of tensile properties was
reported.

39
3.2.3 Characterization
3.2.3.1 Epoxy Equivalent Weight (EEW)
The epoxy content of the synthesized resin was determined according to ASTM D1652. 0.2–
0.8 g of epoxy resin was placed in a 50 mL flask and dissolved in 10–15 mL of methylene
chloride. Crystal violet at 0.1% w/w 4,4′,4″-methylidynetris-(N,N-dimethylaniline) in glacial
acetic acid was used as the indicator. The solution was titrated with 0.1 N of hydrogen bromide
in acetic acid. The hydrogen bromide solution was standardized by 0.4 g of potassium hydrogen
phthalate each time before EEW determination.
3.2.3.2 Differential Scanning Calorimetry (DSC)
The curing behaviour and glass transition temperature (Tg) of the bio-epoxy resins were
evaluated with a differential scanning calorimeter (DSC) model Q 100 from TA Instruments
under a nitrogen atmosphere. Dynamic DSC measurements were carried out at a ramp rate of
5, 10, 15, and 20 °C min−1 in the temperature range of 30 to 300 °C to obtain curing heat-flow
curves of the liquid samples. Isothermal measurements were carried out from 140 to 170 °C.
After this, the cured samples were heated to 300 °C at 10 °C min−1 to obtain the Tg of the fully
cured samples.
3.2.3.3 Fourier Transform Infrared Spectroscopy (FTIR)
FTIR analysis was performed on a Bruker Tensor 27 spectrometer with a temperature controller
– I0977. Samples were sandwiched between two KBr pellets. All FTIR spectra were recorded
over 4000–400 cm−1 wave numbers at a resolution of 4 cm−1 with 28 scans.
3.2.3.4 Thermogravimetric Analysis (TGA)
Thermogravimetric analysis was performed using a TGA 2950 from 25 °C to 800 °C at a
heating rate of 10 °C min−1 under air and nitrogen flow.
3.2.3.5 Gel Permeation Chromatography (GPC)
Gel permeation chromatography (GPC) analysis was conducted on a Waters 2695 separation
module with a Waters 2998 photodiode array, a Waters 2414 refractive index detector, and two
Waters Styragel 5 μm, HR 4E 7.8 × 300 mm columns in series. The mobile phase used was
HPLC grade THF, at a flow rate of 1.2 mL min−1. The calibration curve was generated by
narrow disperse polystyrene standard from 156 000 Da to 580 Da in THF.

40
3.2.3.6 Nuclear Magnetic Resonance (NMR)
NMR spectra were obtained from a Varian NMR System 500 MHz spectrometer using a 5 mm
carbon detection probe. 50 mg of samples were dissolved in deuterated solvents in the presence
of 0.05% sodium 3-trimethylsilylpropionate-d4 (TMSP) as an internal reference. Heavy water
(D2O) was chosen to dissolve bark extractives and deuterated chloroform (CDCl3) was used to
dissolve the rest of the epoxidized samples. All spectra were referenced to the 1H and 13C
signals of TMSP at 0 ppm. The 1H spectrum was recorded at 25 °C after 526 scans. 30° pulse
flipping angle, 3.98 s acquisition time, and 1 s relaxation delay time were used. The 13C NMR-
1D NMR spectra were recorded at 25 °C after 1000 scans. 30° pulse flipping angle, 1.67 s
acquisition time, and 2 s relaxation delay time were used.
3.2.3.7 Mechanical Universal Testing Machine
The tensile properties of the cured epoxy resins were tested at room temperature using ASTM
type E tensile specimens. A standard computerized testing machine (Instron Model 20) was
used in accordance with the ASTM D-638 procedure with a load cell of 2 kN and a cross head
speed of 2.5 mm min−1. Five specimens were measured for each formulation and analyzed
using one way ANOVA.
3.3 Results and Discussion
3.3.1 Yield and Epoxy Equivalent Weight (EEW)
The efficiency of the addition reaction of the epoxy group was significantly influenced by the
reaction temperature and the amount of catalyst. Fig. 3-1 (a) shows the relationship between
the yield and the reaction temperature for the E-epoxy synthesis. When the synthesis
temperature increased, the yield of bio-resins also increased. However, higher temperatures
resulted in more side reactions, which led to difficulties during the subsequent washing steps.
In the solvent washing steps, acetone was first utilized to dissolve the crude products and
remove the by-product, salt. To complete the purification and remove the remaining unreacted
extractives, chloroform and water were then used for the liquid-liquid extraction. When the
reaction temperature was at 100 °C, the emulsion layer of liquid-liquid extraction became
thicker and remained longer due to the higher number of hydrolyzed epoxy rings. We also
found that the EEW values reduced as the heating temperature increased, likely due to a higher
substitution epoxidation.
The relationship between the yield and the catalyst amount is shown in Fig. 3-1 (b). When the
NaOH amount was equal to half of a mole, the epoxidation reaction proceeded minimally. In
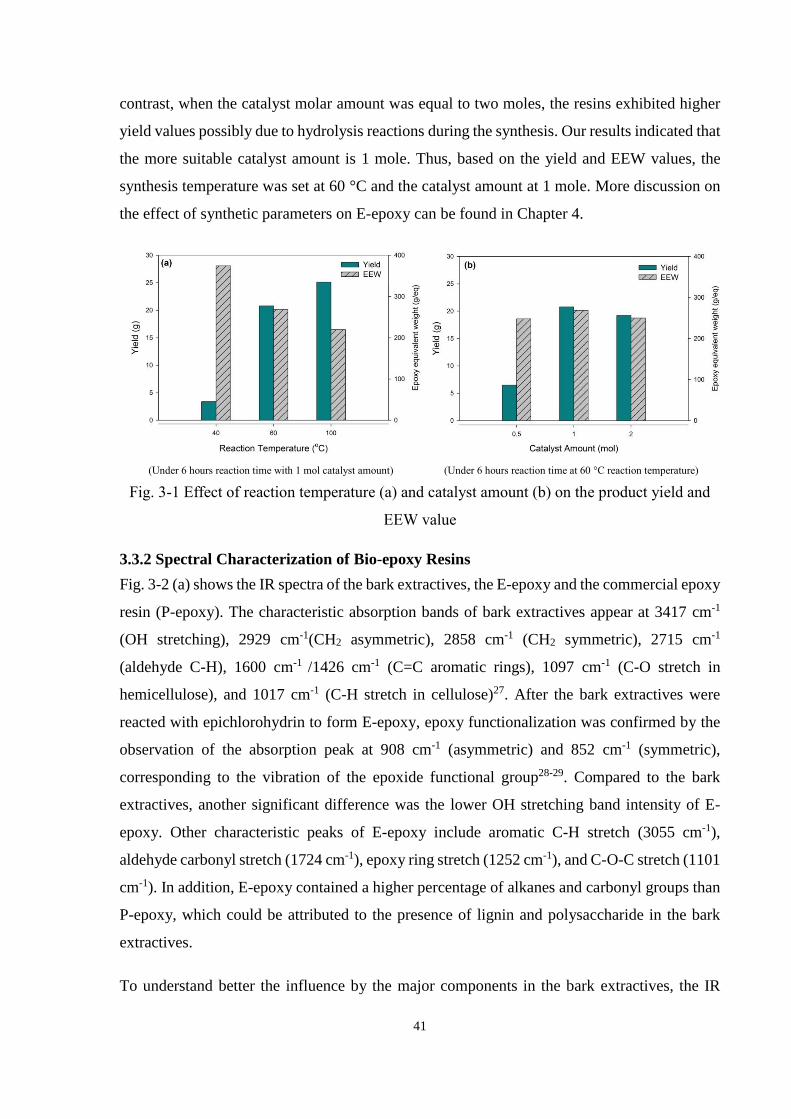
41
contrast, when the catalyst molar amount was equal to two moles, the resins exhibited higher
yield values possibly due to hydrolysis reactions during the synthesis. Our results indicated that
the more suitable catalyst amount is 1 mole. Thus, based on the yield and EEW values, the
synthesis temperature was set at 60 °C and the catalyst amount at 1 mole. More discussion on
the effect of synthetic parameters on E-epoxy can be found in Chapter 4.
(Under 6 hours reaction time with 1 mol catalyst amount)
(Under 6 hours reaction time at 60 °C reaction temperature)
Fig. 3-1 Effect of reaction temperature (a) and catalyst amount (b) on the product yield and
EEW value
3.3.2 Spectral Characterization of Bio-epoxy Resins
Fig. 3-2 (a) shows the IR spectra of the bark extractives, the E-epoxy and the commercial epoxy
resin (P-epoxy). The characteristic absorption bands of bark extractives appear at 3417 cm-1
(OH stretching), 2929 cm-1(CH2 asymmetric), 2858 cm-1 (CH2 symmetric), 2715 cm-1
(aldehyde C-H), 1600 cm-1 /1426 cm-1 (C=C aromatic rings), 1097 cm-1 (C-O stretch in
hemicellulose), and 1017 cm-1 (C-H stretch in cellulose)27. After the bark extractives were
reacted with epichlorohydrin to form E-epoxy, epoxy functionalization was confirmed by the
observation of the absorption peak at 908 cm-1 (asymmetric) and 852 cm-1 (symmetric),
corresponding to the vibration of the epoxide functional group28-29. Compared to the bark
extractives, another significant difference was the lower OH stretching band intensity of E-
epoxy. Other characteristic peaks of E-epoxy include aromatic C-H stretch (3055 cm-1),
aldehyde carbonyl stretch (1724 cm-1), epoxy ring stretch (1252 cm-1), and C-O-C stretch (1101
cm-1). In addition, E-epoxy contained a higher percentage of alkanes and carbonyl groups than
P-epoxy, which could be attributed to the presence of lignin and polysaccharide in the bark
extractives.
To understand better the influence by the major components in the bark extractives, the IR

42
spectra of epoxidized lignin extractives (L-epoxy) and epoxidized cellulose extractives (C-
epoxy) are shown in Fig. 3-2 (b). L-epoxy showed strong aromatic stretch absorption bands at
3052 cm-1 (C-H stretch), 2263 cm-1 / 2033 cm-1 (Ring substitution pattern), and 1632 cm-1 /1501
cm-1 (Ring stretch). In contrast, C-epoxy had a long-chain band absorption at 710 cm-1 and a
strong alcohol vibration at 1113 cm-1 which also appeared on the E-epoxy IR spectrum.
(a) (b)
Fig. 3-2 FTIR spectra of (a) bark extractives, epoxidized bark extractives and commercial
epoxy resin, (b) bio-epoxy resins
Successful functionalization of the bark extractives was also supported through 1H NMR and
13C NMR spectroscopy. Epoxidized bark extractives (Fig. 3-3) showed fewer OH hydrogens
from shifts at 3.6 ppm to 3.9 ppm and showed the appearance of signals at chemical shifts of
2.58, 2.77, and 3.13 ppm representing the epoxy rings and 3.3 and 3.6 ppm from the protons
attached to an ether bond, differing from the bark extractives (Fig. 3-4). The chemical shifts at
9.8 ppm and 9.7 ppm were attributed to the protons attached on the aldehyde groups. Other
aromatic ring protons are shown at 6.3-7.8 ppm, with the signal at 6.8 ppm particularly assigned
to the aromatic protons in the guaiacyl unit30.
The difficulty of analyzing the E-epoxy by 1H NMR was mainly caused by overlapping signals;
therefore, 13C NMR was used for further investigation. In the 13C NMR spectra, the aromatic
structures from extractives and lignin were observed between 174.3 and 106.6 ppm as shown
in Fig. 3-3 (b). The chemical shift at 174.3 ppm belongs to the carbonyl group on the linkage
between catechin and gallic acid of the extractives31. The chemical shifts at 150.2-147.4 ppm,
represent C5 and C7 attached with phenolic hydroxyl groups on the A ring, while chemical
shifts at 146.7-144.6 ppm represent C4’ and C5’ attached with phenolic hydroxyl groups on the

43
B ring. Other aromatic carbons in flavonoids structures show their chemical shifts at 130 ppm
for the C1′, at 115-110 ppm for C8 (interflavonoid bond C4–C8) and at 105 ppm for the C6
(interflavonoid bond C4–C6)32. The absence of the C4 – C6 interflavonoid band at 95 ppm and
the presence of the C4 – C8 interflavonoid band at 105 ppm suggested that the units are
exclusively linked to C4–C8, a classical pattern for a procyanidin. When C4 connects with ring
A, its chemical shift would be observed at 36.5 ppm and when C4 is free, its chemical shift
would be located at 29 ppm33.
In addition, lignin fragments were observed in both the aromatic region (150-110 ppm) and the
aliphatic region (72-54 ppm). These peaks were also confirmed by comparing with the lignin-
based epoxy resin (Fig. 3-5). The major mono-lignin unit in pine bark is guaiacyl (G) and the
dilignin that commonly contains beta-O-4 bonding (48%) and biphenyl bonding (9.5-11%)34.
The chemical shifts at 150-145 ppm were assigned to the C3 and C4 on the G unit. The chemical
shifts at 134 ppm, 132 ppm, and 126 ppm correspond to C1, C5 (etherified), and C5 (non-
etherified), respectively. Other aromatic carbons in the lignin fraction include chemical shifts
at 123 ppm (C1 and C6 in φ–C(=O)C–C units), 113ppm (C5 in G units), and 110 ppm (C2 in G
units). In the aliphatic region, Cα (71.8 and 71.2 ppm), Cβ (129 and 54 ppm), and Cγ (63 and 62
ppm) were also observed30.
Furthermore, the chemical shifts at 44.1 ppm, 50.7 ppm, and 69.3 ppm are related to the epoxy
rings. Note that the absence of chemical shift at 45.2 ppm implies that there is an undetectable
level of residual or unreacted level of epichlorohydrin in our bio-resins. Therefore, the liquid-
state NMR confirmed that the bark extractives were successfully epoxidized with
epichlorohydrin and that by NMR the backbone structures are more similar to lignin than to
cellulose (Fig. 3-6).

44
(a) 1H NMR (b) 13C NMR
Fig. 3-3 Liquid state NMR spectrum of the E-epoxy monomers
(a) 1H NMR (b) 13C NMR
Fig. 3-4 Liquid state NMR spectrum of the bark extractives
(a) 1H NMR (b) 13C NMR
Fig. 3-5 Liquid state NMR spectrum of the L-epoxy monomers

45
(a) 1H NMR (b) 13C NMR
Fig. 3-6 Liquid state NMR spectrum of the C-epoxy monomers
GPC was used to evaluate the molecular weights of the E-epoxy and L-epoxy. In Table 3-1,
the number average molecular weight (Mn) of E-epoxy is shown to be 588 Da and the
polydispersity to be 1.36, while that of L-epoxy are 1071 Da and 2.06, respectively. Compared
to L-epoxy, E-epoxy exhibited a lower molecular weight and narrower polydispersity, which
may offer more uniform performance of the cured resin. Note that the average molecular weight
of liquid type commercial epoxy is about 377 Da, which is smaller than both bio-based epoxy
resins.
Origin software (version 8.6; Microcal Software Inc., Northampton, MA) was used to separate
the multi-peaks in the GPC results. Three peaks were identified in E-epoxy and four peaks were
identified in L-epoxy. Comparing Fig. 3-7 (a) with (b), the first peak of L-epoxy is 3891 Da,
which is similar to the molecular weight reported for alkali lignin by other researchers26, 35. We
suggest that the first peak of E-epoxy (1071 Da) and the second peak of L-epoxy (1396 Da) are
from epoxidized lignin fragments with 5 or 6 monolignol monomers. The second peak of E-
epoxy (513 Da) may be an epoxidized catechin which reacted with four epichlorohydrin units.
This is a likely explanation since the peak of 528-529 Da is the most common repeating unit
shown in commercial tannins31. The third peak (345 Da/372 Da) and fourth peak (277 Da)
might be assigned to the epoxidized resin acid and epoxidized coniferyl alcohol, respectively.
Table 3-1 Molecular weight and polydispersity of E-epoxy and L-epoxy
Mn Mw PDI Peak1 Peak2 Peak3 Peak4
E-epoxy 588 (26) 796(21) 1.36 1071 513 345 -
L-epoxy 1071(43) 2210(39) 2.06 3891 1396 372 277

46
(a) E-epoxy monomers
(b) L-epoxy monomers
Fig. 3-7 GPC traces of uncured bio-epoxy resins
3.3.3 Curing Behaviour
DSC is a useful technique for studying cross-linking reactions of thermosetting epoxy resins.
Non-isothermal DSC analysis was chosen in this study to avoid diffusion control, which can
affect the calculation of kinetic parameters. As in many thermosetting polymers, diffusion and
vitrification also occur in epoxy systems. Performing the analysis with a constant heating rate
can improve segment mobility, which lessens the effect of these phenomena. The raw DSC
plots are shown in appendix A.
Among the various multiple heating rate methods, the Kissinger equation is the most
extensively used method to calculate the activation energy, which is expressed as:
𝑙𝑛(𝛽/𝑇𝑝2) = 𝑙𝑛(𝐴 × 𝑅/𝐸𝑎) − (𝐸𝑎/𝑅𝑇𝑝) Eq. (3 − 1)
where, β is the heating rate, Tp is the temperature at which the maximum heat flow rate occurs,
A is the pre-exponential factor (Arrhenius factor), R is the gas constant, and Ea is the activation
energy.
Using the Kissinger equation, the estimated Ea for commercial resin was 52.0 kJ/mol and Ea
for the bio-resins was 42.0 kJ/mol, both of which fall in the typical range of Ea for common
epoxy-amine polymerization systems (40-70 kJ/mol). The E-epoxy has a lower activation
energy and a higher reactivity compared to the commercial products, possibly due to the
abundant hydroxyl groups in the bark components enhancing the autocatalytic reactions in the
bio-epoxy system.
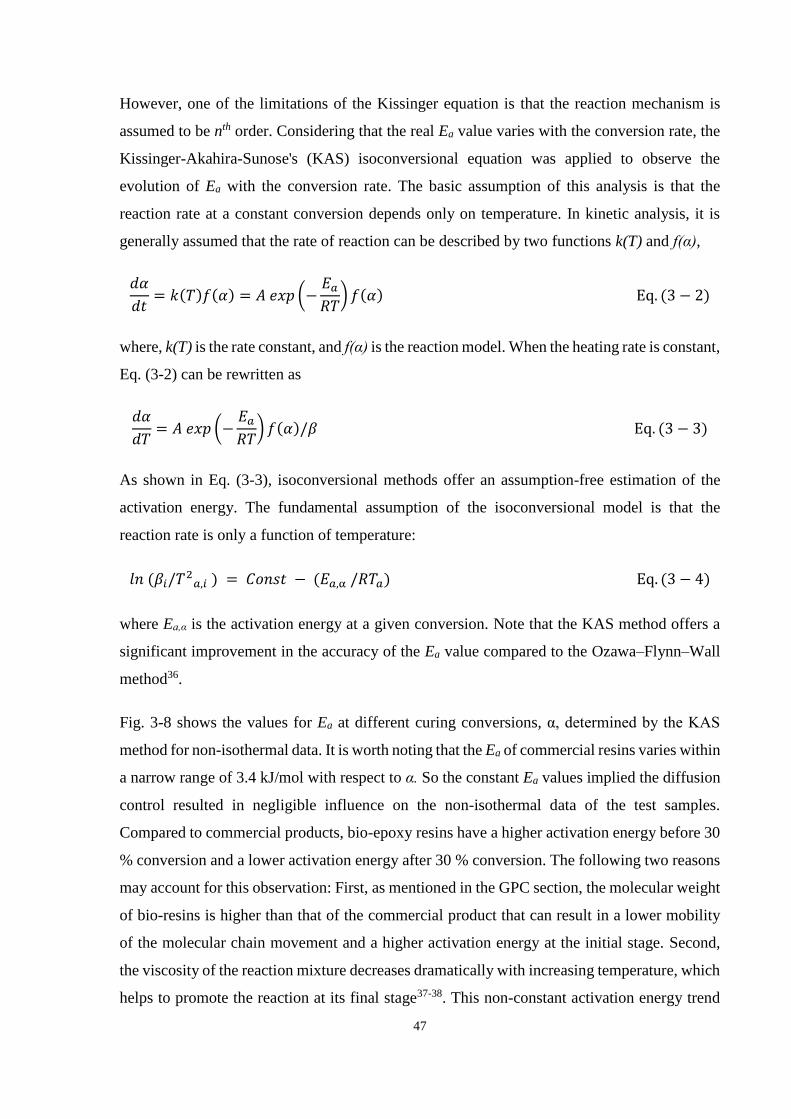
47
However, one of the limitations of the Kissinger equation is that the reaction mechanism is
assumed to be nth order. Considering that the real Ea value varies with the conversion rate, the
Kissinger-Akahira-Sunose's (KAS) isoconversional equation was applied to observe the
evolution of Ea with the conversion rate. The basic assumption of this analysis is that the
reaction rate at a constant conversion depends only on temperature. In kinetic analysis, it is
generally assumed that the rate of reaction can be described by two functions k(T) and f(α),
𝑑𝛼
𝑑𝑡= 𝑘(𝑇)𝑓(𝛼) = 𝐴 𝑒𝑥𝑝 (−
𝐸𝑎
𝑅𝑇) 𝑓(𝛼) Eq. (3 − 2)
where, k(T) is the rate constant, and f(α) is the reaction model. When the heating rate is constant,
Eq. (3-2) can be rewritten as
𝑑𝛼
𝑑𝑇= 𝐴 𝑒𝑥𝑝 (−
𝐸𝑎
𝑅𝑇) 𝑓(𝛼)/𝛽 Eq. (3 − 3)
As shown in Eq. (3-3), isoconversional methods offer an assumption-free estimation of the
activation energy. The fundamental assumption of the isoconversional model is that the
reaction rate is only a function of temperature:
𝑙𝑛 (𝛽𝑖/𝑇2𝑎,𝑖 ) = 𝐶𝑜𝑛𝑠𝑡 − (𝐸𝑎,α /𝑅𝑇𝑎) Eq. (3 − 4)
where Ea,α is the activation energy at a given conversion. Note that the KAS method offers a
significant improvement in the accuracy of the Ea value compared to the Ozawa–Flynn–Wall
method36.
Fig. 3-8 shows the values for Ea at different curing conversions, α, determined by the KAS
method for non-isothermal data. It is worth noting that the Ea of commercial resins varies within
a narrow range of 3.4 kJ/mol with respect to α. So the constant Ea values implied the diffusion
control resulted in negligible influence on the non-isothermal data of the test samples.
Compared to commercial products, bio-epoxy resins have a higher activation energy before 30
% conversion and a lower activation energy after 30 % conversion. The following two reasons
may account for this observation: First, as mentioned in the GPC section, the molecular weight
of bio-resins is higher than that of the commercial product that can result in a lower mobility
of the molecular chain movement and a higher activation energy at the initial stage. Second,
the viscosity of the reaction mixture decreases dramatically with increasing temperature, which
helps to promote the reaction at its final stage37-38. This non-constant activation energy trend

48
indicates that the non-isothermal reaction of bio-resins/amine curing agent probably follows a
multi-step mechanism38.
In addition, an important aim of the curing study was to predict the curing behaviour of the bio-
epoxy resins. After obtaining the values for the kinetic parameters by the KSA method, we
plotted the predicted rate curve for isothermal data, as shown in Fig. 3-9. Compared to the
ASTM E698 method, several studies have indicated that the Vyazovkin method is more precise
and suitable for epoxy-amine curing kinetics prediction39-40. The Vyazovkin method uses the
following equations36:
𝑔(𝛼) = 𝑡𝛼𝐴𝛼𝑒𝑥𝑝(−𝐸𝑎,α/𝑅𝑇0) Eq. (3 − 5)
𝑔(𝛼) = (𝐴𝛼 /𝛽) ∫ 𝑒𝑥𝑝𝑇𝛼
𝑇0
(−𝐸𝑎,α
𝑅𝑇) 𝑑𝑇 Eq. (3 − 6)
Eq. (3-5) and (3-6) stand for the isothermal cure at Tc = T0 and non-isothermal cure at heating
rate β, respectively. To obtain tα, Eq. (3-6) can be divided by Eq. (3-5):
tα = [∫ expTα
T0
(−𝐸𝑎,α
𝑅𝑇) dT] /βexp (
−𝐸𝑎,α
𝑅𝑇0) Eq. (3 − 7)
Eq. (3-7) enables the determination of time for a given conversion. Fig. 3-9 shows the
isothermal epoxy cure from 140 to 170 °C as predicted by using the Ea dependence derived
earlier. The experimental results are shown as curves and the prediction values are shown as
dots. Since the Ea was offered at every 10 % of the conversion rate, the KAS prediction points
were also offered as discrete data. The overall model prediction gave satisfactory agreement
with the experimental isothermal measurements. The same observation was reported by other
groups39, 41.
49
Fig. 3-8 Dependence of the activation energy on the extent of conversion evaluated from
non-isothermal DSC data
Fig. 3-9 Model-free prediction of isothermal cure from 140 to 170 °C using KAS method
(The experimental data are shown by line. The points correspond to the predicted time)
Furthermore, FTIR was used to monitor the concentration of epoxy functional groups during
the formation of networks, as shown in Fig. 3-10. The spectra were normalized to a reference
absorption at 1184 cm-1 that represents the C-C stretch of bisphenol42. The signal reduction at
908 cm-1 as well as at 880 cm-1 displayed the consumption of epoxy groups, whereas the signal
increase at 940 cm-1 revealed the formation of a new bond.

50
Fig. 3-10 Evolution of oxirane functional group during curing
3.3.4 Mechanical Performance
Bio-epoxy resins were blended with commercial epoxy resins (at 10 %, 30 %, and 50 % w/w
of E-epoxy) and then cured with the hardener EPIKURE W at 80 °C for 1 hour, 121 °C for 1
hour and 177 °C for 2 hours. The hardener EPIKURE W is an aromatic-type curing agent,
providing samples with low viscosity and high strength. Fig. 3-11 shows the tensile properties
of the cured 10 %, 30 %, and 50 % bio-epoxy resins, which display comparable properties to
commercial products. Based on one-way ANOVA, there is no significant difference in the
tensile strengths among the four groups (p=0.087).
Compared to the literature data, E-epoxy blending system (50% E-epoxy/50% P-epoxy) has a
higher tensile strength (63 MPa) than 50% epoxidized soybean oil-based epoxy (18 MPa)43.
The high strength of the bark-based epoxy resin is an attractive property of an alternatve
product. Moreover, compared to the long chain structure of epoxidized soybean oil, bark-based
epoxy has higher potential to be applied in the automobile or aerospace industries. The lower
tensile modulus of E-epoxy resin might be attributed to the bulky ring structures in extractives,
which decreases the crosslink density of the system44.

51
Fig. 3-11 Tensile strength and modulus of the neat P-epoxy, 10, 30, and 50% E-epoxy
replacement of P-epoxy
3.3.5 Thermal Degradation and Thermal Stability
TGA is used to evaluate thermal oxidation and thermal stability of the polymers. The
experiments were conducted under air and inert gas, respectively. Fig. 3-12 displays the TGA
plots obtained from testing commercial epoxy resins and bio-epoxy resins in air, while Fig. 3-
13 shows the results of TGA tests under a nitrogen atmosphere.
The commercial product has a strong degradation peak for thermal oxidation at about 382°C.
The bio-epoxy resins exhibited similar thermal degradation patterns. But bio-epoxy also shows
the presence of new peaks at temperatures of 310°C and 345 °C, which can be caused by phase
separation occurring in the network. The combustion process can be divided into three stages:
between 300-340 °C, 340-390 °C, and 480-600 °C. For the commercial samples and 10 % and
30 % bio-epoxy samples, the first stage showed a mass loss of 0.8-0.9 %, the second stage
showed 64-67 % mass loss and the last stage showed a mass loss of 32-35 %. However, for the
50 % bio-epoxy samples, the mass loss at the first stage increased to 17 % and at the second
stage decreased to 41 %, suggesting that more thermally sensitive compounds exist in the bio-
epoxy resins. Some other bio-based epoxy resins also displayed their degradation temperatures
at around 274-305 °C.7
To understand the thermal stability of the novel epoxy resins, the P-epoxy, E-epoxy and L-
epoxy were heated in a nitrogen atmosphere, the results of which are shown in Fig. 3-13. The
black line represents the mass loss of the cured resins. Compared to the petro-based epoxy, the

52
mass loss of bio-based epoxy was faster between 250 to 400°C. The mass loss curves were
transformed into their first derivative (green lines), which indicates the points of highest rate
of change in the mass loss. The commercial epoxies only showed one degradation peak at
392°C, which corresponds to the HCN bond breaking 45. In comparison, the E-epoxy exhibited
two degradation peaks. The first peak is at 349 °C, which is the same as the shoulder shown in
the curve for the L-epoxy, and the second peak was presented at 392°C, which is the same as
the degradation peak of HCN bonding. In addition, the statistic heat-resistant index temperature
(Ts) is given in Table 3-2. This value was determined from the temperatures at 5 % mass loss
(Td5) and 30 % mass loss (Td30) of the sample obtained by TGA, following Eq. (3-8):
Ts = 0.49(Td5 + 0.6(Td30 − Td5)) Eq. (3 − 8)
The values of the heat-resistance of the E-epoxy were similar to the L-epoxy but lower
compared to the commercial product. Several studies reported that bio-based resins exhibited
lower thermal degradation temperature compared to that of the petroleum resins44. Compared
to other bio-epoxy resins, however, E-epoxy showed comparable performance. Therefore,
additional refining steps, such as extraction of unreacted monomers, might be beneficial to
further improve thermal properties of the E-epoxy.
(a) Mass loss curves
(b) Deriv. mass loss curves
Fig. 3-12 Thermal degradation of the cured epoxy resins with various E-epoxy
replacements (0-50%) under air

53
Fig. 3-13 Thermal stability of the cured P-epoxy, E-epoxy and L-epoxy under nitrogen
atmosphere
Table 3-2 TGA data of the cured epoxy resins
Td onset (°C) Td5 (°C) Td30 (°C) Ts (°C) Char700 (%)
P-epoxy 369 353 383 182 12.2
E-epoxy 294 272 337 152 4.6
L-epoxy 297 277 346 156 18.1

54
3.4 Summary
This chapter examined the feasibility of using bark extractives to formulate bio-epoxy resins.
FTIR, NMR, and GPC methods were applied to identify the chemical structures and molecular
weights of the epoxies synthesized in this study. For uncured bio-epoxy monomers, the
absorption of epoxy groups was observed at 908 cm-1 in the FTIR spectrum and the same
groups were seen at 45 and 51 ppm in the 13C NMR spectrum. Both analyses indicated
successful glycidylation on bark extractives after reaction with epichlorohydrin. Furthermore,
the GPC results showed that E-epoxy has a lower molecular weight (588 Da) compared to the
L-epoxy (1071 Da). Based on the Kissinger kinetic analysis, the activation energy of the E-
epoxy is lower than that of the commercial products due to the abundant hydroxyl groups in
extractive promoting the autocatalytic network formation. The curing time of the bio-epoxy
resin was successfully predicted using non-isothermal data analyzed by the KAS method. For
the cured epoxy resins, mechanical performance and thermal properties showed that the novel
synthesized bio-epoxy resin blended with commercial epoxy displayed mostly comparable
properties as the commercial product. Therefore, bark extractives have great promise to be used
as the raw material to synthesize epoxy resins replacing toxic BPA.

55
References
1. A. E. Gerbase, C. L. Petzhold and A. P. O. Costa, J Am Oil Chem Soc, 2002, 79, 797-802.
2. H. Miyagawa, A. K. Mohanty, R. Burgueno, L. T. Drzal and M. Misra, J Polym Sci Pol
Phys, 2007, 45, 698-704.
3. A. Overeem, G. J. H. Buisman, J. T. P. Derksen, F. P. Cuperus, L. Molhoek, W. Grisnich
and C. Goemans, Ind Crop Prod, 1999, 10, 157-165.
4. S. Hirose, J Oil Palm Res, 2011, 23, 1110-1114.
5. T. R. Cuadrado and R. J. J. Williams, Polym Commun, 1989, 30, 239-240.
6. T. W. Abraham and R. Hofer, in Polymer science: A comprehensive reference, ed. M. M.
K. Matyjaszewski, Elsevier, Oxford, 2012, vol. 10, ch. 3, pp. 15-58.
7. D. Fourcade, B. S. Ritter, P. Walter, R. Schonfeld and R. Mulhaupt, Green Chem, 2013,
15, 910-918.
8. Y. Hasegawa, K. Shikinaka, Y. Katayama, S. Kajita, E. Masai, M. Nakamura, Y. Otsuka,
S. Ohara and K. Shigehara, Sen-I Gakkaishi, 2009, 65, 359-362.
9. C. Sasaki, M. Wanaka, H. Takagi, S. Tamura, C. Asada and Y. Nakamura, Ind Crop
Prod, 2013, 43, 757-761.
10. Q. Q. Ma, X. Q. Liu, R. Y. Zhang, J. Zhu and Y. H. Jiang, Green Chem, 2013, 15, 1300-
1310.
11. H. Kishi and A. Fujita, Environ Eng Manag J, 2008, 7, 517-523.
12. H. Kishi, A. Fujita, H. Miyazaki, S. Matsuda and A. Murakami, J Appl Polym Sci, 2006,
102, 2285-2292.
13. H. Pan, Renew Sust Energ Rev, 2011, 15, 3454-3463.
14. S. G. Tan and W. S. Chow, J Am Oil Chem Soc, 2011, 88, 915-923.
15. J. M. Raquez, M. Deleglise, M. F. Lacrampe and P. Krawczak, Prog Polym Sci, 2010, 35,
487-509.
16. T. Koike, Polym Eng Sci, 2012, 52, 701-717.
17. S. N. Cheng, I. D'cruz, M. C. Wang, M. Leitch and C. B. Xu, Energ Fuel, 2010, 24, 4659-
4667.
18. E. Windeisen and G. Wegener, in Polymer science: A Comprehensive Reference, ed. M.
M. K. Matyjaszewski, Elsevier, Oxford, 2012, vol. 10, ch. 15, pp. 255-266.
19. J. O. Wegner, ed. R. Höfer, Royal Society of Chemistry, Cambridge, 2009, ch. 11, pp.
425-435.
56
20. G. K. Gupta, Master Thesis, University of Toronto, 2009.
21. D. G. Briggs, University of Washington Institute of Forest Resources, Seattle, 1994, ch. 9,
pp. 106-110.
22. M. H. Alma and S. S. Kelley, Polym Degrad Stabil, 2000, 68, 413-418.
23. Y. Zhao, N. Yan and M. Feng, Int J Adhes Adhes, 2010, 30, 689-695.
24. J. D'Souza and N. Yan, Acs Sustain Chem Eng, 2013, 1, 534-540.
25. E. Aspe and K. Fernandez, Ind Crop Prod, 2011, 34, 838-844.
26. B. Xiao, X. F. Sun and R. C. Sun, Polym Degrad Stabil, 2001, 74, 307-319.
27. Y. Zhao, Ph.D. Thesis, University of Toronto, 2013.
28. S. Q. Ma, X. Q. Liu, Y. H. Jiang, Z. B. Tang, C. Z. Zhang and J. Zhu, Green Chem, 2013,
15, 245-254.
29. D. L. Pavia, G. M. Lampman and G. S. Kriz, in Introduction to Spectroscopy: A Guide
for Students of Organic Chemistry, Saunders (W.B.) Co Ltd, Philadelphia, 1979, ch. 2.
30. J. Z. Mao, L. M. Zhang and F. Xu, Cell Chem Technol, 2012, 46, 193-205.
31. P. Navarrete, A. Pizzi, H. Pasch, K. Rode and L. Delmotte, Ind Crop Prod, 2010, 32, 105-
111.
32. I. Wawer, M. Wolniak and K. Paradowska, Solid State Nuclear Magnetic Resonance,
2006, 30, 106-114.
33. K. Lorenz and C. M. Preston, Journal of Environmental Quality, 2002, 31, 431-437.
34. E. Adler, Wood Sci Technol, 1977, 11, 169-218.
35. S. Tsuda, K. Nakagawa, T. Oyama, A. Takahashi, Y. Okabe, H. Kagawa, S. Yamada and
Y. Okabe, J. Network Polym. Jpn., 2010, 31, 701-717.
36. S. Vyazovkin, A. K. Burnham, J. M. Criado, L. A. Perez-Maqueda, C. Popescu and N.
Sbirrazzuoli, Thermochim Acta, 2011, 520, 1-19.
37. G. Vazquez, J. Gonzalez-Alvarez, F. Lopez-Suevos, S. Freire and G. Antorrena, J Therm
Anal Calorim, 2002, 70, 19-28.
38. S. Vyazovkin and N. Sbirrazzuoli, Macromol Rapid Comm, 2006, 27, 1515-1532.
39. S. Vyazovkin and N. Sbirrazzuoli, Macromolecules, 1996, 29, 1867-1873.
40. V. P. Privalko, V. Y. Kramarenko, V. L. Sokol and A. M. Karateev, Polym Polym
Compos, 1998, 6, 331-336.
41. L. Gan, Z. J. Sun, Y. Z. Gu, M. Li and Z. G. Zhang, Acta Polym Sin, 2010, 8, 1016-1022.

57
42. D. W. Sohn and K. J. Ko, Korea Polym J, 1999, 7, 181-188.
43. X. J. Yang, S. H. Li, J. L. Xia, J. Song, K. Huang and M. Li, Bioresources, 2015, 10,
2130-2142.
44. X. Q. Liu, W. B. Xin and J. W. Zhang, Green Chem, 2009, 11, 1018-1025.
45. J. Madarasz and G. Pokol, J Therm Anal Calorim, 2007, 88, 329-336.
58
Chapter 4 Effects of Reaction Parameters on the Glycidyl
Etherification of Bark Extractives during Bio-epoxy Resin
Synthesis
Abstract
This chapter outlines the influence of a series of reaction conditions on the yield and reactivity
of the glycidyl etherification reaction of the bark extractive-based bio-epoxy monomer (E-
epoxy). To maximize the yield and epoxy content, the glycidylation reaction was examined
with various substrates, solvents, catalysts, time periods, reaction temperatures, and sodium
hydroxide/hydroxyl (NaOH/OHV) molar ratios. Spray-dried bark extractives were used as
substrates due to their higher hydroxyl group content and lower molecular weight compared to
the oven-dried bark extractives. A dioxane/water combination was selected from among four
solvents based on the yield and epoxy equivalent weight of the final product, and
tetrabutylammonium hydroxide was chosen as a ring-opening catalyst due to its effect of
suppressing hydrolysis. Furthermore, a response surface methodology (RSM) was applied to
find the effect on yield and reactivity of the E-epoxy monomer. Paramount to this the adequacy
of the RSM models and data were examined by the coefficients of determination and the
normalized probability plots of residuals. The maximum extent of conversion with minimum
epoxy equivalent weight was achieved after 4.5 hours reaction time with a NaOH/OHV molar
ratio of 3.4 at 80 °C reaction temperature.
___________________________________________________________________________
A version of this chapter was submitted to ACS Sustainable Chemistry & Engineering, Manuscript ID: sc-2015-
01098t
59
4.1 Introduction
Recent developments1-3 in bio-thermoset polymers suggest that renewable resources can
partially or fully replace petroleum-based polymers with comparable properties at reasonable
costs and with lower ecological impact. Among various types of bio-thermoset polymers, bio-
epoxy resins attract considerable attention from both academia and industry since the cost of
conventional epoxy resins is often higher than other thermosets such as polyester and
vinylesters. In addition, these environmentally friendly bio-polymers can reduce the usage of
bisphenol A (BPA), which is the compound used to synthesize 90% of the world's production
of petroleum-based epoxy resins3. The health concerns of BPA remain a subject for debate4-5;
however, there is a strong interest to replace BPA with natural resources. Various renewable
materials have been explored, including liquefied wood6-7, cashew nutshell liquid8, lignin9-11,
furan12-13, vanillin14-15 flavonoids16-17, and tree bark18.
Although many studies have reported promising results, there remains little systematic research
on synthetic routes19 for these bio-based epoxy resins. Currently, the most common synthesis
method of phenol-type epoxy is to etherify the hydroxyl groups using epichlorohydrin (ECH)
as shown in Scheme 4-1. The mechanism as a whole is an SN2 reaction, and is known as the
glycidyl etherification synthesis. Phenolic hydroxyl groups act as nucleophiles to attack the
alpha carbon on ECH. In contrast to BPA, the natural phenolic hydroxyl groups have
asymmetric structures and different acidity on their hydroxyl groups, which results in their own
distinctive reactivity. For example, in a standard synthetic condition, BPA usually has 85-95%
yield20, which is higher than gallic acid (68%)17 or catechin (48%)21. Furthermore, these bio-
derived epoxy monomers may have their epoxy content decreased along with their
benxodioxane derivatives19. For these reasons, it is important to select suitable reaction
conditions for each bio-based phenolic compound for epoxy resin synthesis.
Factors that can influence epoxy synthesis can be very diverse. Some key parameters are related
to substrate and solvent type, catalyst type and amount, and reaction time and temperature.
Bark extractives are used as the substrate for this study since our previous research18 has shown
that bark extractives can be a good candidate to replace BPA. Two types of substrates with
various hydroxyl values (OHV) and molecular weights were prepared using different drying
techniques. For a typical glycidylation reaction, a wide range of solvents have been reported
for both single-phase systems (methanol22, dimethylformamide23, dimethyl sulfoxide20,
hexane20, benzene20, water24, water/dioxane25-26, water/acetone27, water/ethanol27, as well as

60
water-toluene-butanol28), and biphasic solvent systems (water/dichloromethane20 and
water/hexane20, 29). The effects of solvent on the yield and reactivity could be further linked to
its solute solubility and pKa value. Another important factor must be considered in the selection
process is the environment, health, and safety impacts (EHS) of the solvents. A biphasic
solvent system generally requires phase transfer catalysts (PTCs) to accelerate the ring-opening
reaction for producing an epoxy monomer with low molecular weight, narrow polydispersity,
high yield, and elevated purity19. To subsequently close the ring, sodium hydroxide (NaOH) is
added to remove hydrogen and chlorine. Since the price of PTCs is higher than NaOH, the
other long-established option to catalyze the reaction is adding two-fold NaOH, which is
commonly practiced in industrial scale synthesis.
In addition, it is well known that numerical response variables (such as reaction time and
temperature) should not be investigated independently. Interactions may exist among the
variables and can render such univariate investigations meaningless. Response surface
methodology (RSM) is one of the most widely used methods to optimize the multiple process
parameters. According to the literature, the temperature was varied from 25-100 °C20, 22 for the
reaction liquid-type epoxy monomers, the reaction time ranged from 0.5 to 20 hours at reflux,
or 24 to 26 hours at room temperature3, 30, and the molar ratio between NaOH/OHV was in the
range of 0.12 to 1020, 24, 31.
The purpose of this chapter is to further investigate the reaction of extractive-based bio-epoxy
monomer (E-epoxy) and to identify an optimized set of synthetic conditions for E-epoxy
monomer with maximized yield and reactivity. Six parameters (substrates, solvents, catalysts,
time periods, temperatures, and NaOH/OHV ratios) were examined in this study. Two types of
extractives (spray-dried and oven-dried) were compared to observe the effect of OHV and
molecular weight on the yield and reactivity of E-epoxy. Four types of solvent systems
(water/dichloromethane, methanol, dimethylformamide, dimethyl sulfoxide, and
water/dioxane) were selected, and their target product structures were studied using nuclear
magnetic resonance (13C NMR). Tetrabutylammonium hydroxide (TBAH) was used as a PTC
instead of the two-fold alkaline addition, and the synthesized products were analyzed using
Fourier Transform Infrared Spectroscopy (FTIR) and 1H-NMR. In addition, three sets of
reaction variables (2-10 hour reaction time, 60-100 °C reaction temperatures and 1.4-4.2
NaOH/OHV molar ratios) for glycidylation reaction were optimized based on the yield and
reactivity of the resulting E-epoxy.
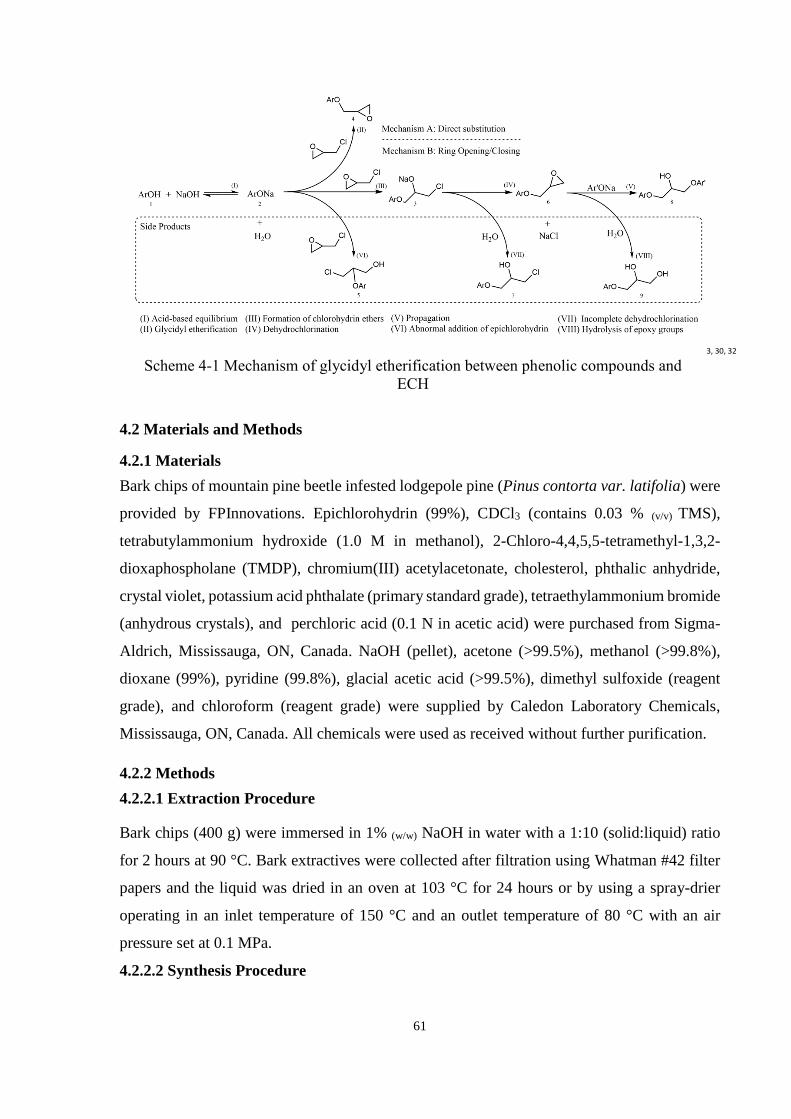
61
Scheme 4-1 Mechanism of glycidyl etherification between phenolic compounds and
ECH
3, 30, 32
4.2 Materials and Methods
4.2.1 Materials
Bark chips of mountain pine beetle infested lodgepole pine (Pinus contorta var. latifolia) were
provided by FPInnovations. Epichlorohydrin (99%), CDCl3 (contains 0.03 % (v/v) TMS),
tetrabutylammonium hydroxide (1.0 M in methanol), 2-Chloro-4,4,5,5-tetramethyl-1,3,2-
dioxaphospholane (TMDP), chromium(III) acetylacetonate, cholesterol, phthalic anhydride,
crystal violet, potassium acid phthalate (primary standard grade), tetraethylammonium bromide
(anhydrous crystals), and perchloric acid (0.1 N in acetic acid) were purchased from Sigma-
Aldrich, Mississauga, ON, Canada. NaOH (pellet), acetone (>99.5%), methanol (>99.8%),
dioxane (99%), pyridine (99.8%), glacial acetic acid (>99.5%), dimethyl sulfoxide (reagent
grade), and chloroform (reagent grade) were supplied by Caledon Laboratory Chemicals,
Mississauga, ON, Canada. All chemicals were used as received without further purification.
4.2.2 Methods
4.2.2.1 Extraction Procedure
Bark chips (400 g) were immersed in 1% (w/w) NaOH in water with a 1:10 (solid:liquid) ratio
for 2 hours at 90 °C. Bark extractives were collected after filtration using Whatman #42 filter
papers and the liquid was dried in an oven at 103 °C for 24 hours or by using a spray-drier
operating in an inlet temperature of 150 °C and an outlet temperature of 80 °C with an air
pressure set at 0.1 MPa.
4.2.2.2 Synthesis Procedure

62
The synthetic route followed has been reported in detail in our previous research18 and was
adapted as circumstances required. Briefly, extractives (15 g) were mixed with epichlorohydrin
(150 g), solvent (50 mL) and PTC (2 mL) in a three-neck round-bottom flask and the
temperature of the mixture was raised to the reaction temperature between 40-100 °C
depending on each experimental run. NaOH (pellets) was added slowly to the solution to
catalyze the reaction. The synthesis proceeded for between 2 and 10 hours in a nitrogen
atmosphere.
4.2.2.3 Refining Procedure
The reaction products were diluted with excess acetone, and filtered to remove salt by-products.
Phase separation was then conducted on the resulting solution using water and chloroform in a
separatory funnel. The chloroform-miscible compounds were retained. The unreacted
epichlorohydrin and residual solvents were removed using a rotary evaporator at 120 °C under
reduced pressure via water aspirator.
4.2.3 Characterization
4.2.3.1 Hydroxyl Value (OHV) Determination
The OHV of bark extractives was determined by both ASTM D4274 Test method B and 31P
NMR analysis. The two techniques are complementary. The ASTM method measures the total
hydroxyl amount of a sample, but this method cannot identify the types of hydroxyl groups,
which can be aliphatic, aromatic or carboxylic acids. The 31P NMR analysis indicates the types
of the hydroxyl groups, but do not necessary give accurate indicate of the total hydroxyl number
since some fraction of the bark extractives may not have totally dissolved in
pyridine/chloroform solvent used for the NMR analysis.
4.2.3.1.1 ASTM D4274 Test Method B
Bark extractives (1 g) and the phthalation reagent (25 mL) were heated at 100 °C for 2 hours.
The phthalation reagent was a solution of phthalic anhydride (113 g) in pyridine (700 mL).
After the reaction finished and the bottle cooled to room temperature, pyridine (50 mL) was
added, and then titrated with 0.5 N NaOH to its equivalence point. The calculation of hydroxyl
number is shown in Eq. (4-1).
Raw hydroxyl number = (B − A)(56.1)(N)/W………………………………………Eq. (4-1)
Where A and B are the milliliters at the equivalence point of the sample and blank, respectively;
N is normality of NaOH; and W is the weight of the sample.

63
Since the bark extractives are basic, the raw hydroxyl number has to be corrected by the
following steps: Bark extractives (1 g), pyridine (75 mL), and water (75 mL) were mixed, and
then the mixture was titrated by HCl to its equivalence point. After that, the solution was back
titrated with 0.1 N NaOH. A blank titration was titrated in the same manner. The alkalinity
correction was calculated using Eq. (4-1). Then, a corrected hydroxyl number was obtained as
follows:
Corrected hydroxyl number = raw hydroxyl number – alkalinity……………………Eq. (4-2)
The unit of hydroxyl number is mg KOH per gram of sample. In order to unify the units from
different OHV measuring methods, the corrected hydroxyl number was transformed as in Eq.
(4-3).
OHV = corrected hydroxyl number/ 56.1 (the mass of KOH)………………………Eq. (4-3)
4.2.3.1.2 31P Nuclear Magnetic Resonance (31P-NMR)
31P NMR analysis was done on an Agilent NMR System 500 MHz spectrometer using a 5 mm
oneNMR H/F probe with an acquisition time of 1.5 s, relaxation delay of 0.1 s, 30° pulse
flipping angle, and 2,000 scans. Samples were pre-treated based on the phosphitylation method
using 2-chloro-4,4,5,5-tetramethyl-1,3,2-dioxaphospholane (TMDP)33. The first step was to
develop a stock solution by mixing pyridine-deuterated chloroform (1:1.6, v/v), which was then
used to prepare a relaxation solution using chromium (III) acetylacetonate (5 mg/mL) as well
as a standard solution of cholesterol (5 mg/mL). Note that all the solutions were dried with
molecular sieves before use. The 31P NMR solutions were produced by mixing the sample (15
mg), relaxation solution (0.1 mL), standard solution (0.1 mL), and stock solution (0.8 mL).
Finally, TMDP (0.1 mL) was added, shaken vigorously, and then was transferred to an NMR
tube for analysis. All spectra were referenced to the (TMDP)2O peak at 132.2 ppm, which was
formed from the reaction of 1 mol of water with 2 mol of TMDP34 and had a peak for excess
TMDP (at 174.9 ppm) to ensure that all reactive species had been completely phosphitylated.
The OHV was integrated relative to the cholesterol standard.
4.2.3.2 Molecular Weight
The molecular weights of bark extractives were determined using a size exclusion column
(SEC) MCX 8-300 mm equipped with a Dionex DX600 ion chromatography and a UV detector

64
at 280 nm. The column was packed with sulfonated styrene-divinylbenzene copolymer-
network of 10 μm particles, and the separation range is from 100 Da to 70,000 Da. The mobile
phase used was 0.1 M NaOH, at a flow rate of 1 mL/min. The calibration curve was generated
by polystyrene sulfonate standard from 6,430 Da to 890 Da in 0.1 M NaOH. The concentration
of standards and samples were 1 mg/mL and all the samples were filtered before conducting
the experiments. Mn, Mw and polydispersity were calculated following ASTM D5296-11.
4.2.3.3 Epoxy Equivalent Weight (EEW)
EEW means the molecular weight of epoxy divided by its molar number of the oxirane. High
EEW value means that low concentration of epoxy group terminates at the molecular chain end.
The EEW of the synthesized resin was determined according to ASTM D1652-11. Epoxy resin
(0.4-2.3 g) was placed in a 50 mL flask and dissolved in 10-15 mL of chloroform. The
tetraethylammonium bromide reagent (10 mL) was added and the solution was mixed using a
magnetic stirring bar. Crystal violet at 0.1 % w/w in glacial acetic acid was used as the indicator
to determine the endpoints of titration. The solution was titrated with 0.1 N of perchloric acid
in acetic acid. The perchloric acid reagent was standardized by 0.4 g of potassium hydrogen
phthalate each time before EEW determination.
4.2.3.4 Structural Characterization
4.2.3.4.1 1H and 13C NMR
1H and 13C NMR spectra were obtained from an Agilent NMR System 500 MHz spectrometer
using a 5 mm Xsens Cold probe. Samples (50 mg) were dissolved in deuterated solvents in the
presence of 0.03% sodium 3-trimethylsilylpropionate-d4 (TMSP) as an internal reference.
Deuterated chloroform (CDCl3) was used to dissolve the epoxidized samples. All spectra were
referenced to the 1H and 13C signals of TMSP at 0 ppm. The 1H spectrum was recorded at 25
°C after 64 scans. The pulse flipping angle was 45°, with 4.5 s acquisition time and 1 s
relaxation delay time. The 13C NMR-1D NMR spectra were recorded at 25 °C after 1,000 scans.
The pulse flipping angle was 30°, with 2 s acquisition time and 1 s relaxation delay time.

65
4.2.3.4.2 Fourier Transform Infrared Spectroscopy (FTIR)
Samples were studied with a Bruker Tensor 27 spectrometer in an environmental chamber.
Liquid samples were placed between two KBr crystals, while solid samples were mixed with
KBr powder to form a pellet. All spectra were recorded over 4000-600 cm-1 at a resolution of
4 cm-1 with 32 scans.
4.2.4 Experimental Design for Response Surface Methodology (RSM)
Many studies have shown that RSM is more reliable than the one-variable-at-a-time (OVAT)
method. OVAT can lead to totally erroneous conclusions when parameters are dependent on
each other. In this case, the time, temperature, and catalyst used are all dependent parameters,
leading to the use of response surface analysis in this study. The process optimization for
maximizing the yield and reactivity of the E-epoxy monomers was carried out by Box–
Behnken design (BBD) with 3 variables. Each factor, or variable, is placed at one of three
equally spaced values, usually coded as -1, 0, +1. BBD requires only 17 experimental runs and
avoids the extreme treatment combinations compared to other RSM designs. The three
independent variables considered were the reaction time, reaction temperature, and
NaOH/hydroxyl group molar ratio. The ranges of these three parameters were chosen based on
our preliminary experiments and on the literature 19-20, 24, 35. The variables and their levels
selected for this study are shown in Table 4-1.
Table 4-1 Variables and their levels for Box–Behnken design.
Variables Term Level
-1 0 +1
Reaction time (hours) X1 2 4 6
Reaction temperature (°C) X2 60 80 100
NaOH/OHV molar ratio X3 1.4 2.8 4.2
4.3 Results and Discussion
4.3.1 Categorical Reaction Conditions
4.3.1.1 Effect of Substrates
Scheme 4-1 shows the phenolate ions act as nucleophiles to attack ECH, which transforms
hydroxyl groups to ether groups. Since the reaction initiates from hydroxyl groups, it is
necessary to measure the OHV of substrates. In addition, the reactivity of hydroxyl groups also
depends on their concentration and acidity. Higher acidity and lower pKa values can promote
the reaction rate. If the substrates do not contain sufficient hydroxyl groups, side reactions may

66
take place between ECH and a second hydroxyl group, which results in higher chlorine content
and more impurities. Therefore, an understanding at the molecular level of the reactivity of
phenolic monomers toward glycidylation represents a crucial step in the development of bio-
based epoxy monomers19.
In order to understand the effect of hydroxyl groups of substrates on the synthesis, two types
of alkaline bark extractives were prepared with different OHV and Mw by different drying
processes. The alkaline extraction process was chosen due to its high yield compared to other
extraction methods. In addition, the alkaline extractives are readily available, non-toxic, and
cost-effective. The most common drying method is oven drying, which is cost-effective and no
investment on special equipment. This drying process usually continues for 24 to 48 hours, and
it may decrease the reactivity of extracts. The spray-drying method can convert fluid into
uniform spherical shape powders in a short time, and it is widely applied on heat sensitive
materials such as milk or tea extracts.
The OHV and molecular weights of bark extractives were measured using the standard
esterification-phthalic method and SEC, respectively. Their results are shown in Table 4-2. The
OHV of spray-dried extractives (SDE) was 9.29 mmol/g, while the OHV of oven-dried
extractives (ODE) was only 7.66 mmol/g. SDE had significantly higher OHV than ODE (p <
0.01). In the literature, the OHV of oven-dried extractives varies from 367-440 mgKOH/g, equal
to 6.54-7.84 mmol/g36-37 akin to our ODE result. These oven-dried bark extractives may have
a further crosslinking reaction between these hydroxy groups due to a long period of
dehydration, which is consistent with the results from SEC. As shown in Fig. 4-1, the retention
time of ODE was shorter than SDE, which indicated the number molecular weight (Mn) and
the weight molecular weight (Mw) of ODE are both larger than that of SDE. To provide insight
into each type of hydroxy group present, a 31P NMR method was applied (Fig. 4-2).
Table 4-2 OHV and molecular weight of two types of extractives.
OHV (mmol/g) Mn Mw PDI Peak 1 Peak 2
ODE 7.66 ± 0.78 1,343 4,442 3.31 10,112 1,254
SDE 9.29 ± 0.90 1,196 3,979 3.32 9,115 1,010

67
(a) ODE
(b) SDE
Fig. 4-1 SEC traces of bark extractives.
The results from 31P NMR agreed with the investigation above that SDE had higher OHV than
ODE. However, the detected concentration of hydroxy groups using 31P NMR was much lower
than that using the esterification-phthalic method since the bark extractives were not fully
soluble in the pyridine/CDCl3 solution. Based on the soluble fraction, five types of hydroxy
groups are reported in Table 4-3, including aliphatic OH, condensed OH, guaiacyl OH, p-
hydroxyphenyl OH, and carboxylic OH. ODE exhibited low concentrations of carboxylic acid
hydroxy groups and aliphatic hydroxy groups, but its concentration of condensed OH was
approximately 14 times higher compared to SDE. The high concentration of condensed OH
was likely due to the prolonged dehydration process in the oven. In addition, these hydroxy
groups have their own distinct reactivities to ECH based on their pKa values and steric
hindrance. The pKa value of aliphatic hydroxyl is between 16 and 18; aromatic hydroxyl is
approximately 10; carbonyl hydroxyl is from 3.4 to 4.519, 38. Thus, carbonyl hydroxyl (e.g., in
resin acid or fatty acids) had the highest reactivity, the aromatic hydroxyl (e.g., in degraded
lignin or flavonoids) had moderate reactivity, and the aliphatic hydroxyl (e.g., in
polysaccharides) had the lowest reactivity, which has a similar probability as water to react
with ECH. Based on the above, SDE was assumed to be a better substrate than ODE.

68
Fig. 4-2 31P-NMR analysis of (a) ODE and (b) SDE.
Table 4-3 OHV from bark extractives using 31P-NMR.
OH (mmol/g) COOH
(mmol/g)
Total
(mmol/g) Aliphatic Condensed Guaiacyl P-hydroxyl
ODE 0.180 0.286 0.015 0.010 0.262 0.753
SDE 1.251 0.020 0.012 0.022 0.449 1.754
To confirm that SDE was indeed a better substrate than ODE, both extractives were used to
synthesize bio-epoxy monomers (Table 4-4). The yield of epoxy monomer from ODE was
lower than that from SDE (p = 0.03) because the high molecular weight of the ODE-based
monomer precipitated during the synthesis process. The average EEW value of the ODE-based
monomer was slightly higher than that of SDE-based monomer; however, there was no
statistical difference in the EEW values between the two types of drying technologies (p =
0.21). The EEW value indicates the concentration of epoxy groups on monomers, which
represents its reactivity for the subsequent crosslinking reactions. A lower EEW value
corresponds to a higher concentration of oxirane and higher reactivity.
Table 4-4 Yield and EEW value of two types of E-epoxy monomers.
Yield*1 (%) EEW (g/eq)
SDE-based monomer 48.1 ± 6.9 338 ± 38.4
ODE-based monomer 41.2 ± 4.9 366 ± 37.5
*1 The yield is estimated based on the Eq. (4)
* The replication of each experimental condition is three
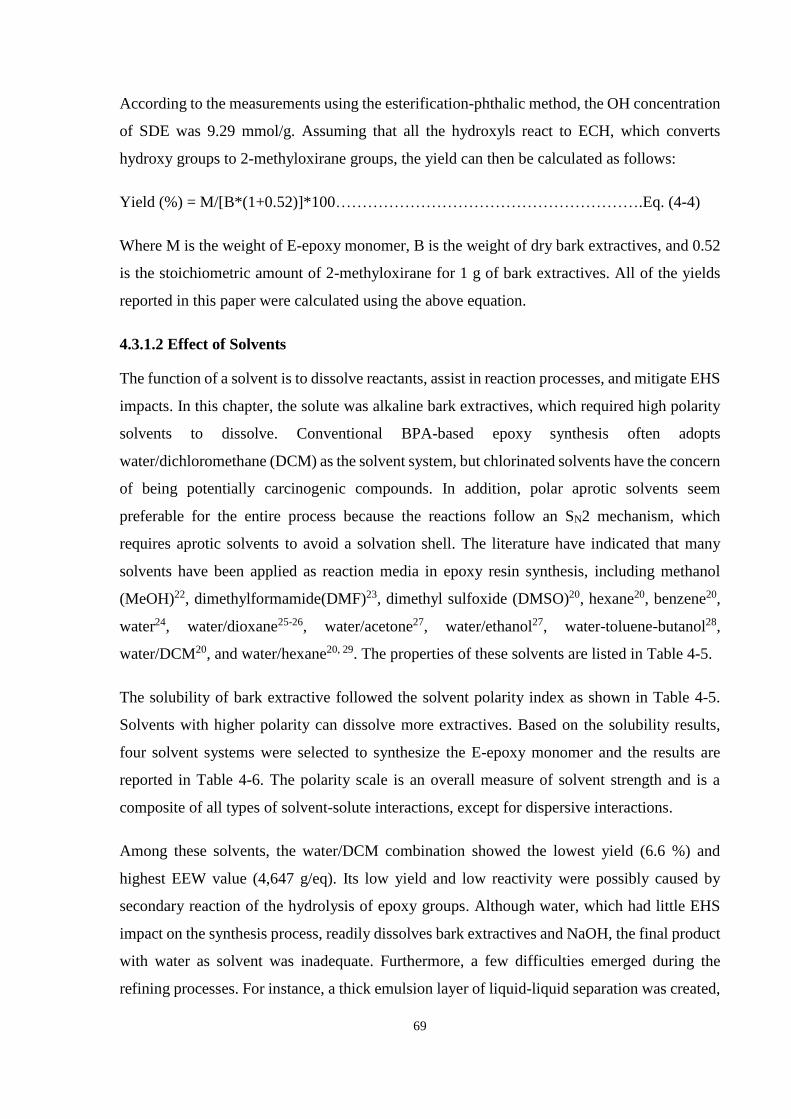
69
According to the measurements using the esterification-phthalic method, the OH concentration
of SDE was 9.29 mmol/g. Assuming that all the hydroxyls react to ECH, which converts
hydroxy groups to 2-methyloxirane groups, the yield can then be calculated as follows:
Yield (%) = M/[B*(1+0.52)]*100………………………………………………….Eq. (4-4)
Where M is the weight of E-epoxy monomer, B is the weight of dry bark extractives, and 0.52
is the stoichiometric amount of 2-methyloxirane for 1 g of bark extractives. All of the yields
reported in this paper were calculated using the above equation.
4.3.1.2 Effect of Solvents
The function of a solvent is to dissolve reactants, assist in reaction processes, and mitigate EHS
impacts. In this chapter, the solute was alkaline bark extractives, which required high polarity
solvents to dissolve. Conventional BPA-based epoxy synthesis often adopts
water/dichloromethane (DCM) as the solvent system, but chlorinated solvents have the concern
of being potentially carcinogenic compounds. In addition, polar aprotic solvents seem
preferable for the entire process because the reactions follow an SN2 mechanism, which
requires aprotic solvents to avoid a solvation shell. The literature have indicated that many
solvents have been applied as reaction media in epoxy resin synthesis, including methanol
(MeOH)22, dimethylformamide(DMF)23, dimethyl sulfoxide (DMSO)20, hexane20, benzene20,
water24, water/dioxane25-26, water/acetone27, water/ethanol27, water-toluene-butanol28,
water/DCM20, and water/hexane20, 29. The properties of these solvents are listed in Table 4-5.
The solubility of bark extractive followed the solvent polarity index as shown in Table 4-5.
Solvents with higher polarity can dissolve more extractives. Based on the solubility results,
four solvent systems were selected to synthesize the E-epoxy monomer and the results are
reported in Table 4-6. The polarity scale is an overall measure of solvent strength and is a
composite of all types of solvent-solute interactions, except for dispersive interactions.
Among these solvents, the water/DCM combination showed the lowest yield (6.6 %) and
highest EEW value (4,647 g/eq). Its low yield and low reactivity were possibly caused by
secondary reaction of the hydrolysis of epoxy groups. Although water, which had little EHS
impact on the synthesis process, readily dissolves bark extractives and NaOH, the final product
with water as solvent was inadequate. Furthermore, a few difficulties emerged during the
refining processes. For instance, a thick emulsion layer of liquid-liquid separation was created,
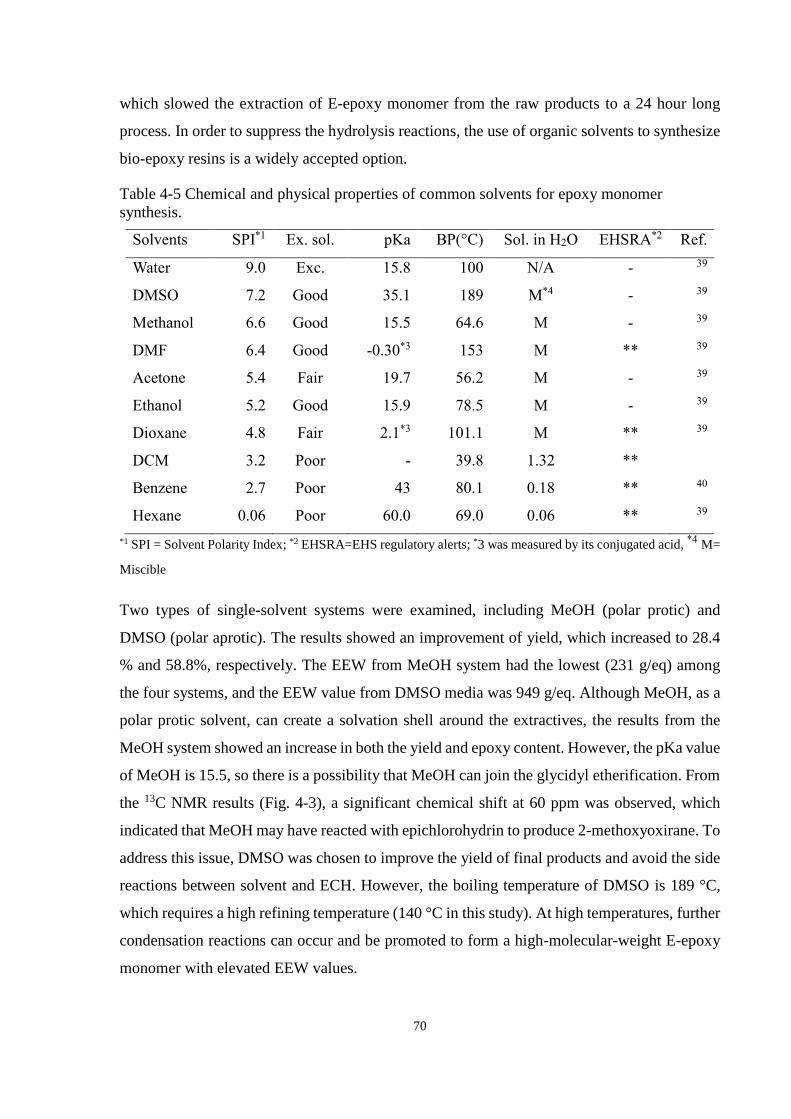
70
which slowed the extraction of E-epoxy monomer from the raw products to a 24 hour long
process. In order to suppress the hydrolysis reactions, the use of organic solvents to synthesize
bio-epoxy resins is a widely accepted option.
Table 4-5 Chemical and physical properties of common solvents for epoxy monomer
synthesis.
Solvents SPI*1 Ex. sol. pKa BP(°C) Sol. in H2O EHSRA*2 Ref.
Water 9.0 Exc. 15.8 100 N/A - 39
DMSO 7.2 Good 35.1 189 M*4 - 39
Methanol 6.6 Good 15.5 64.6 M - 39
DMF 6.4 Good -0.30*3 153 M ** 39
Acetone 5.4 Fair 19.7 56.2 M - 39
Ethanol 5.2 Good 15.9 78.5 M - 39
Dioxane 4.8 Fair 2.1*3 101.1 M ** 39
DCM 3.2 Poor - 39.8 1.32 **
Benzene 2.7 Poor 43 80.1 0.18 ** 40
Hexane 0.06 Poor 60.0 69.0 0.06 ** 39
*1 SPI = Solvent Polarity Index; *2 EHSRA=EHS regulatory alerts; *3 was measured by its conjugated acid, *4 M=
Miscible
Two types of single-solvent systems were examined, including MeOH (polar protic) and
DMSO (polar aprotic). The results showed an improvement of yield, which increased to 28.4
% and 58.8%, respectively. The EEW from MeOH system had the lowest (231 g/eq) among
the four systems, and the EEW value from DMSO media was 949 g/eq. Although MeOH, as a
polar protic solvent, can create a solvation shell around the extractives, the results from the
MeOH system showed an increase in both the yield and epoxy content. However, the pKa value
of MeOH is 15.5, so there is a possibility that MeOH can join the glycidyl etherification. From
the 13C NMR results (Fig. 4-3), a significant chemical shift at 60 ppm was observed, which
indicated that MeOH may have reacted with epichlorohydrin to produce 2-methoxyoxirane. To
address this issue, DMSO was chosen to improve the yield of final products and avoid the side
reactions between solvent and ECH. However, the boiling temperature of DMSO is 189 °C,
which requires a high refining temperature (140 °C in this study). At high temperatures, further
condensation reactions can occur and be promoted to form a high-molecular-weight E-epoxy
monomer with elevated EEW values.

71
Table 4-6 Yield and EEW value of bio-epoxy monomer synthesized in different media.
Solvents Yield (%) EEW (g/eq)
Water/DCM 6.6 ± 3.2 4,647 ± 743
MeOH 28.4 ± 8.2 231 ± 76
DMSO 58.8 ± 7.5 949 ± 46
Water/Dioxane 48.1 ± 6.9 338 ± 38
*1 All the synthesis were conducted for six hours with 4.2 NaOH/OHV ratios at 60 °C
The last solvent system was water/dioxane combination, which can dissolve more extractives
than a single water phase. The yield of the final product was 48.1 % and the EEW value was
338 g/eq. Although its yield and EEW values were only second best among the four types of
solvents, the advantage of using water/dioxane combination was its well-balanced properties,
including its moderate boiling temperature (approximately 100 °C), no side reactions observed,
and stability in a high pH environment. Furthermore, the concentration of oxirane peaks on E-
epoxy monomer was more significant than any above solvent system according to the 13C NMR
results (Fig. 4-3). For these reasons, the water/dioxane combination was chosen for this study
and for the following experiment.
Fig. 4-3 13C-NMR spectra of E-epoxy monomers synthesized in various solvent systems.
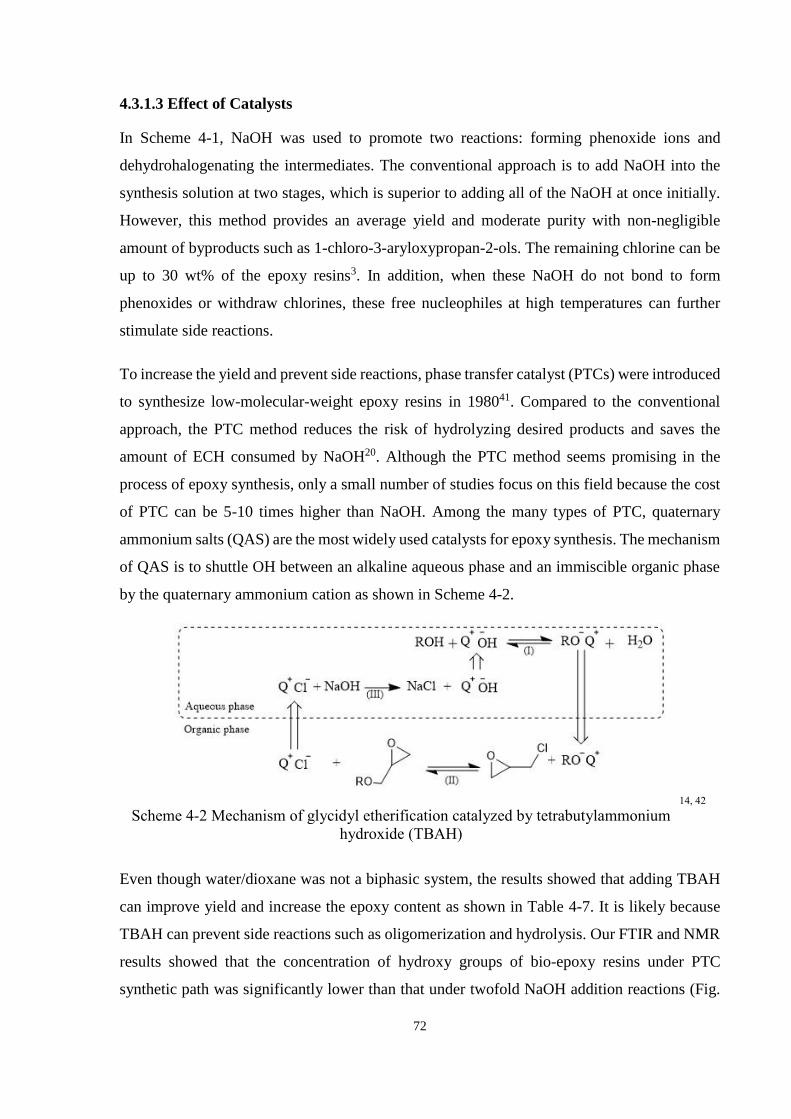
72
4.3.1.3 Effect of Catalysts
In Scheme 4-1, NaOH was used to promote two reactions: forming phenoxide ions and
dehydrohalogenating the intermediates. The conventional approach is to add NaOH into the
synthesis solution at two stages, which is superior to adding all of the NaOH at once initially.
However, this method provides an average yield and moderate purity with non-negligible
amount of byproducts such as 1-chloro-3-aryloxypropan-2-ols. The remaining chlorine can be
up to 30 wt% of the epoxy resins3. In addition, when these NaOH do not bond to form
phenoxides or withdraw chlorines, these free nucleophiles at high temperatures can further
stimulate side reactions.
To increase the yield and prevent side reactions, phase transfer catalyst (PTCs) were introduced
to synthesize low-molecular-weight epoxy resins in 198041. Compared to the conventional
approach, the PTC method reduces the risk of hydrolyzing desired products and saves the
amount of ECH consumed by NaOH20. Although the PTC method seems promising in the
process of epoxy synthesis, only a small number of studies focus on this field because the cost
of PTC can be 5-10 times higher than NaOH. Among the many types of PTC, quaternary
ammonium salts (QAS) are the most widely used catalysts for epoxy synthesis. The mechanism
of QAS is to shuttle OH between an alkaline aqueous phase and an immiscible organic phase
by the quaternary ammonium cation as shown in Scheme 4-2.
Scheme 4-2 Mechanism of glycidyl etherification catalyzed by tetrabutylammonium
hydroxide (TBAH)
14, 42
Even though water/dioxane was not a biphasic system, the results showed that adding TBAH
can improve yield and increase the epoxy content as shown in Table 4-7. It is likely because
TBAH can prevent side reactions such as oligomerization and hydrolysis. Our FTIR and NMR
results showed that the concentration of hydroxy groups of bio-epoxy resins under PTC
synthetic path was significantly lower than that under twofold NaOH addition reactions (Fig.
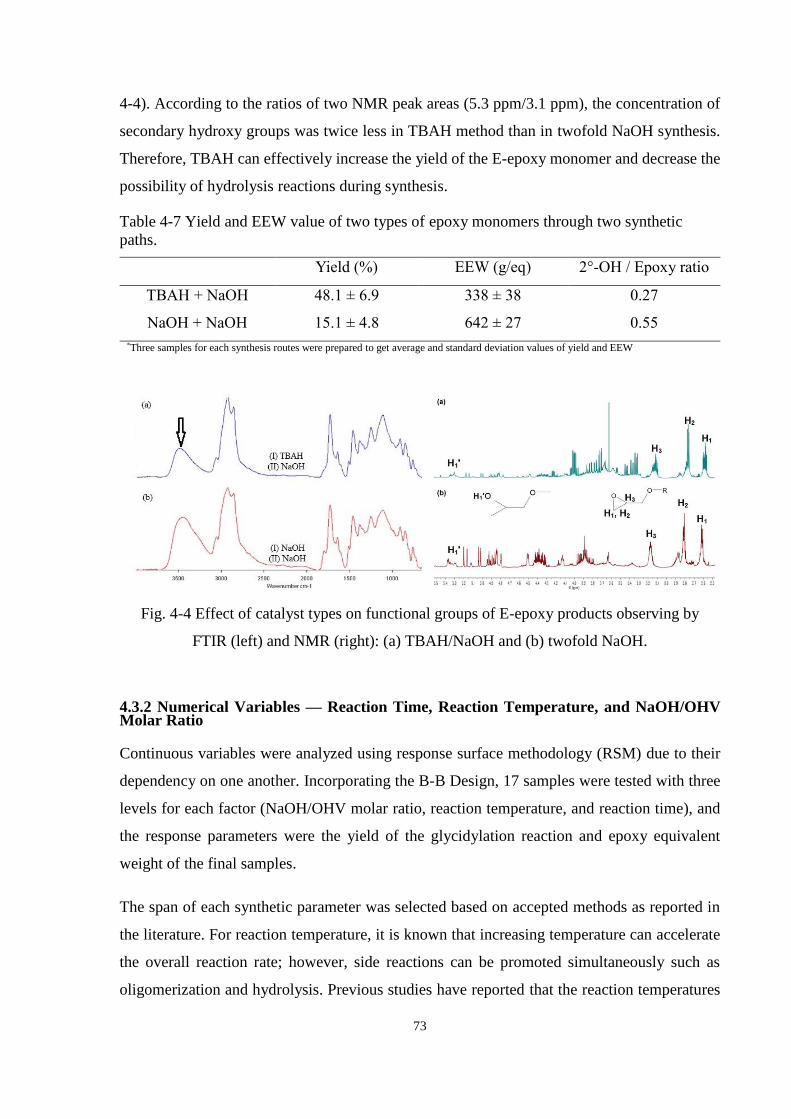
73
4-4). According to the ratios of two NMR peak areas (5.3 ppm/3.1 ppm), the concentration of
secondary hydroxy groups was twice less in TBAH method than in twofold NaOH synthesis.
Therefore, TBAH can effectively increase the yield of the E-epoxy monomer and decrease the
possibility of hydrolysis reactions during synthesis.
Table 4-7 Yield and EEW value of two types of epoxy monomers through two synthetic
paths.
Yield (%) EEW (g/eq) 2°-OH / Epoxy ratio
TBAH + NaOH 48.1 ± 6.9 338 ± 38 0.27
NaOH + NaOH 15.1 ± 4.8 642 ± 27 0.55
*Three samples for each synthesis routes were prepared to get average and standard deviation values of yield and EEW
Fig. 4-4 Effect of catalyst types on functional groups of E-epoxy products observing by
FTIR (left) and NMR (right): (a) TBAH/NaOH and (b) twofold NaOH.
4.3.2 Numerical Variables — Reaction Time, Reaction Temperature, and NaOH/OHV Molar Ratio
Continuous variables were analyzed using response surface methodology (RSM) due to their
dependency on one another. Incorporating the B-B Design, 17 samples were tested with three
levels for each factor (NaOH/OHV molar ratio, reaction temperature, and reaction time), and
the response parameters were the yield of the glycidylation reaction and epoxy equivalent
weight of the final samples.
The span of each synthetic parameter was selected based on accepted methods as reported in
the literature. For reaction temperature, it is known that increasing temperature can accelerate
the overall reaction rate; however, side reactions can be promoted simultaneously such as
oligomerization and hydrolysis. Previous studies have reported that the reaction temperatures
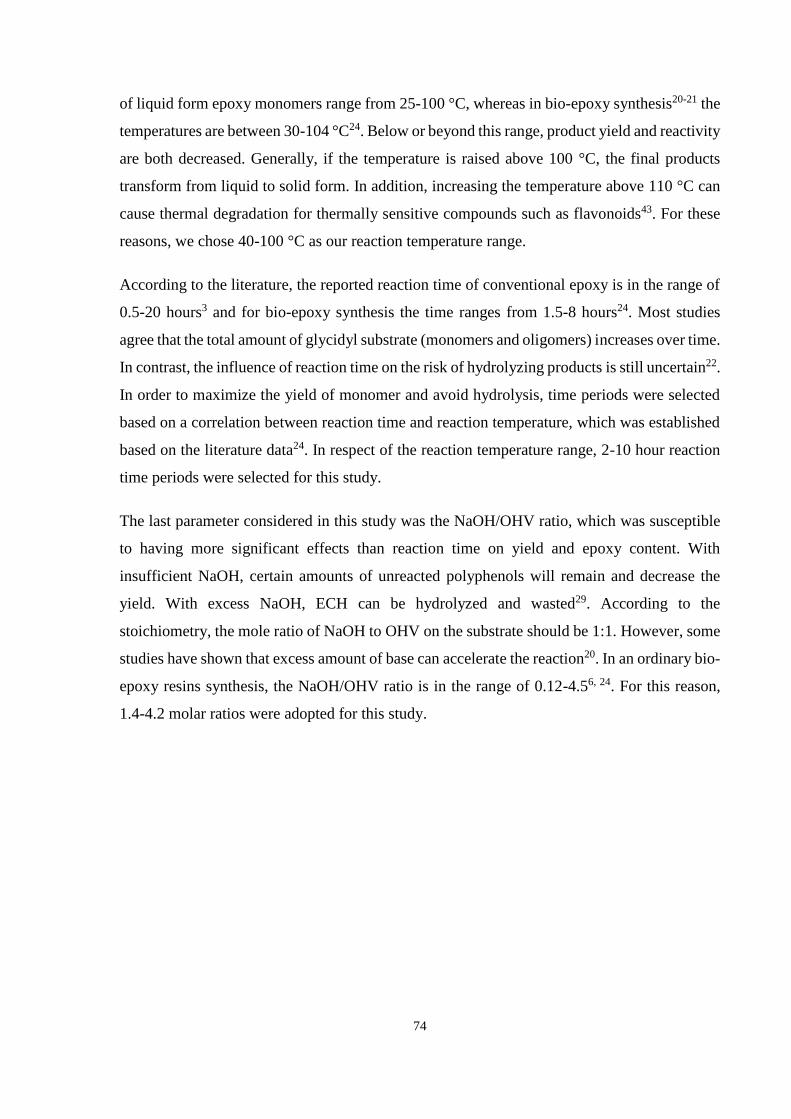
74
of liquid form epoxy monomers range from 25-100 °C, whereas in bio-epoxy synthesis20-21 the
temperatures are between 30-104 °C24. Below or beyond this range, product yield and reactivity
are both decreased. Generally, if the temperature is raised above 100 °C, the final products
transform from liquid to solid form. In addition, increasing the temperature above 110 °C can
cause thermal degradation for thermally sensitive compounds such as flavonoids43. For these
reasons, we chose 40-100 °C as our reaction temperature range.
According to the literature, the reported reaction time of conventional epoxy is in the range of
0.5-20 hours3 and for bio-epoxy synthesis the time ranges from 1.5-8 hours24. Most studies
agree that the total amount of glycidyl substrate (monomers and oligomers) increases over time.
In contrast, the influence of reaction time on the risk of hydrolyzing products is still uncertain22.
In order to maximize the yield of monomer and avoid hydrolysis, time periods were selected
based on a correlation between reaction time and reaction temperature, which was established
based on the literature data24. In respect of the reaction temperature range, 2-10 hour reaction
time periods were selected for this study.
The last parameter considered in this study was the NaOH/OHV ratio, which was susceptible
to having more significant effects than reaction time on yield and epoxy content. With
insufficient NaOH, certain amounts of unreacted polyphenols will remain and decrease the
yield. With excess NaOH, ECH can be hydrolyzed and wasted29. According to the
stoichiometry, the mole ratio of NaOH to OHV on the substrate should be 1:1. However, some
studies have shown that excess amount of base can accelerate the reaction20. In an ordinary bio-
epoxy resins synthesis, the NaOH/OHV ratio is in the range of 0.12-4.56, 24. For this reason,
1.4-4.2 molar ratios were adopted for this study.

75
Table 4-8 The B-B matrix and output responses.
X1 Temperature X2 Time X3 NaOH/Substrate Y1 Yield Y2 EEW
(°C) (hour) molar ratio (%) (g/eq)
60 2 2.8 10.5 351
60 6 1.4 15.2 899
60 6 4.2 34.2 382
60 10 2.8 21.2 317
80 2 1.4 22.5 449
80 2 4.2 51.0 398
80 6 2.8 54.5 348
80 6 2.8 51.0 398
80 6 2.8 54.0 468
80 6 2.8 57.5 444
80 6 2.8 59.0 368
80 10 1.4 38.9 693
80 10 4.2 50.5 1625
100 2 2.8 36.4 498
100 6 1.4 33.2 1045
100 6 4.2 64.0 2240
100 10 2.8 37.9 1771
The yield and the EEW values of the E-epoxy monomer based on B-B design are shown in
Table 4-9. The ranges of yields and EEW values were 10.5-64.0 % and 317-2,240 g/eq,
respectively. Although the yield can be up to 64 % based on the dry weight of spray-dried bark
extractives, the yield of bio-epoxy resin based on the dry bark chips was only between 2-14 %.
In addition, based on our previous research18, the average molecular weight of bio-epoxy resins
was 796 Da. Thus, the functionality per molecule was approximately 0.36-2.51.
Prior to analyzing the influence of the parameters, the model adequacy was examined and
results are listed in Table 4-9 and Table 4-10. The responses were fitted with various functions
such as linear, two-factor interaction (2FI), and quadratic models in order to find the best-fit
model. Among the models, the quadratic model responded best to both the yield and EEW
values according to their coefficients of determination (R2 = 0.96 and R2 = 0.98, respectively)
and their p-values of lack of fit (p = 0.71 and p = 0.09, respectively).
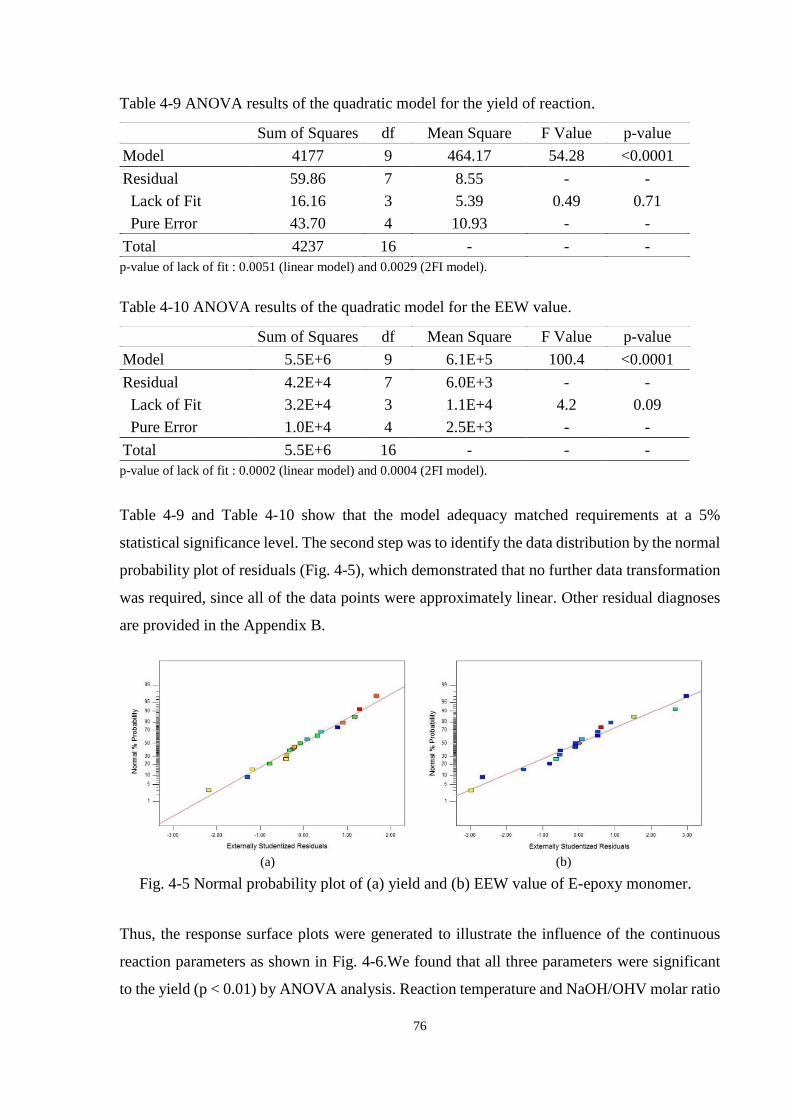
76
Table 4-9 ANOVA results of the quadratic model for the yield of reaction.
Sum of Squares df Mean Square F Value p-value
Model 4177 9 464.17 54.28 <0.0001
Residual 59.86 7 8.55 - -
Lack of Fit 16.16 3 5.39 0.49 0.71
Pure Error 43.70 4 10.93 - -
Total 4237 16 - - -
p-value of lack of fit : 0.0051 (linear model) and 0.0029 (2FI model).
Table 4-10 ANOVA results of the quadratic model for the EEW value.
Sum of Squares df Mean Square F Value p-value
Model 5.5E+6 9 6.1E+5 100.4 <0.0001
Residual 4.2E+4 7 6.0E+3 - -
Lack of Fit 3.2E+4 3 1.1E+4 4.2 0.09
Pure Error 1.0E+4 4 2.5E+3 - -
Total 5.5E+6 16 - - -
p-value of lack of fit : 0.0002 (linear model) and 0.0004 (2FI model).
Table 4-9 and Table 4-10 show that the model adequacy matched requirements at a 5%
statistical significance level. The second step was to identify the data distribution by the normal
probability plot of residuals (Fig. 4-5), which demonstrated that no further data transformation
was required, since all of the data points were approximately linear. Other residual diagnoses
are provided in the Appendix B.
(a)
(b)
Fig. 4-5 Normal probability plot of (a) yield and (b) EEW value of E-epoxy monomer.
Thus, the response surface plots were generated to illustrate the influence of the continuous
reaction parameters as shown in Fig. 4-6.We found that all three parameters were significant
to the yield (p < 0.01) by ANOVA analysis. Reaction temperature and NaOH/OHV molar ratio

77
had the highest effects on yield compared to reaction time. Temperature and time both followed
a quadratic path, as shown in the 3D plots (Fig. 4-6). At higher temperatures, the yield decrease
was likely due to further oligomer formation between E-epoxy monomers. Many studies have
shown that oligomers will solidify when they have very high molecular weight29, 44. These
oligomers can precipitate with salt to the bottom of a reaction flask, which might be left out of
subsequent work up and decrease the total yield. As opposed to time and temperature, the yield
increased with an increasing NaOH/OHV molar ratio, which had a positive linear effect. It is
well known that the rate determining step in a glycidylation reaction is reaction II in Scheme
4-145. More catalyst can promote the first equilibrium reaction, accelerate reaction II, and
increase the total yield. A previous study24 also showed that the yield of a reaction generally
increased with the increase of NaOH/OHV ratio and that the optimal NaOH/OHV ratio was
1.5. According to the ANOVA analysis, we found the final model to predict the yield is as
follows:
Yield (Y1) = 55.1 + 11.3X1 + 3.58X2 + 11.3X3– 16.4X12
– 12.2X22 …………………Eq. (4-5)
Based on a confidence interval of 99%, the significant terms are X1, X2, X3, X12, and X2
2. Since
the constants of Xn2 in yield model are negative, the parabola open down and there is maximum
vertex point for extent of conversion.
On the right side of Fig. 4-6, the influence of reaction conditions on EEW values is shown.
Unlike the results for yield, those for EEW showed different trends at different levels. If we
fixed two parameters at a relatively low level, the last parameter followed a quadratic path due
to incomplete dehydrochlorination or propagation. On the other hand, in an opposite situation,
the last parameter showed a linear positive relationship. Previous studies have indicated that at
lower temperatures, the effects of NaOH is not as significant as at high temperatures24. The
final model to predict the EEW is as follows:
EEW (Y2) = 405.2 + 450.63 X1 + 338.75X2 + 194.88X3 + 326.75X1X2 + 428X1X3 + 245.75
X2X3 + 339.65X12
+ 396.65X32………………………………….……………………Eq. (4-6)
Based on a confidence interval of 99%, all of the terms are significant except for X22. The
constants of X12 and X3
2 are positive in the EEW model so there is a minimum of the value of
EEW.
To match the maximum point of yield and the minimum EEW value, we can reach an optimal
point for both equations. The optimal conditions were 80°C, 4.5 hour and 3.4 NaOH/OHV
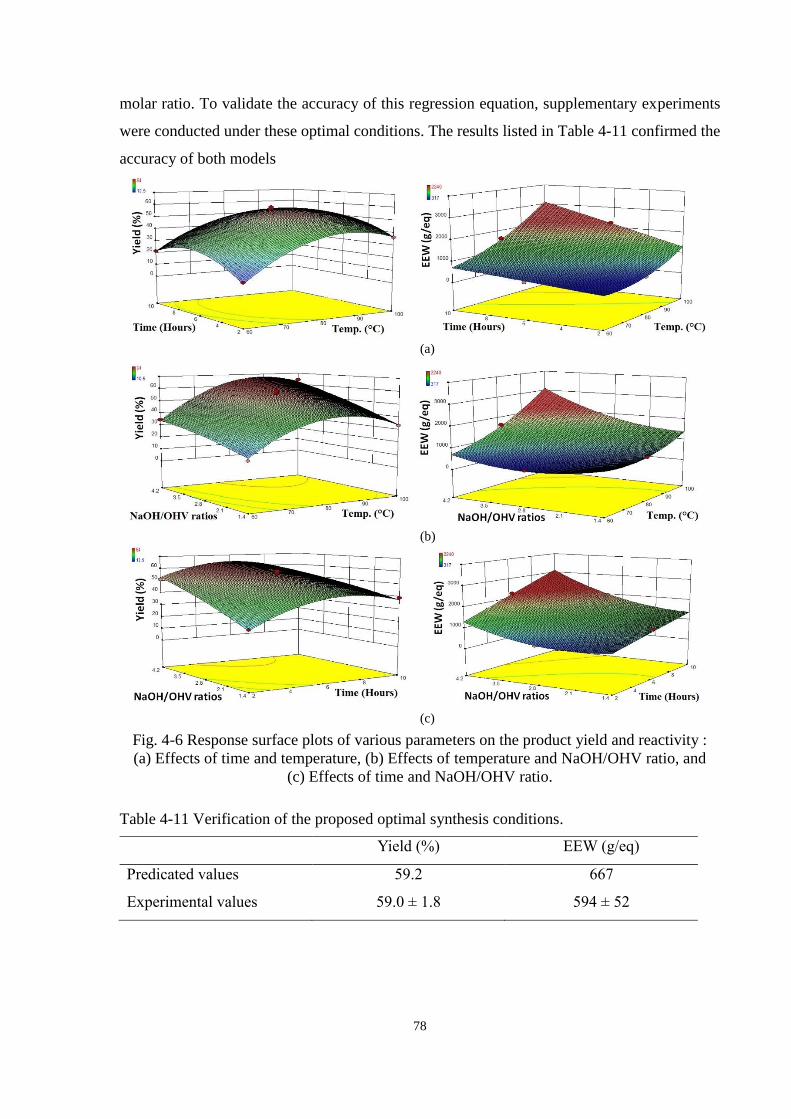
78
molar ratio. To validate the accuracy of this regression equation, supplementary experiments
were conducted under these optimal conditions. The results listed in Table 4-11 confirmed the
accuracy of both models
(a)
(b)
(c)
Fig. 4-6 Response surface plots of various parameters on the product yield and reactivity :
(a) Effects of time and temperature, (b) Effects of temperature and NaOH/OHV ratio, and
(c) Effects of time and NaOH/OHV ratio.
Table 4-11 Verification of the proposed optimal synthesis conditions.
Yield (%) EEW (g/eq)
Predicated values 59.2 667
Experimental values 59.0 ± 1.8 594 ± 52
79
4.4 Summary
In this chapter, we tested three categorical parameters (substrates, solvents, and catalysts) and
three numerical parameters (reaction time periods, reaction temperatures, and NaOH/OHV
ratios). Our results showed spray-dried extractives are a good substrate, with both high
hydroxyl content (9.29 mmol/g) and low molecular weight (Mw = 3,979 Da). Among four types
of solvent systems, a water/dioxane combination was selected for this study owing to its
balanced properties on each perspective such as yield (48.1 %), reactivity (EEW = 338 g/eq),
boiling temperature (approximately 100°C), no side reactions observed, and stability in a high
pH environment. To avoid hydrolysis reactions occurring, tetrabutylammonium hydroxide
(TBAH) was added at the first stage as a ring-opening catalyst. According to our 1H NMR
results, the use of TBAH can significantly decrease the hydrolyzed by-products. To optimize
the yield and reactivity, the experiment should be conducted for 4.5 hours with 3.4 NaOH/OHV
molar ratio at 80 °C reaction temperature.
80
References
1. J. M. Raquez, M. Deléglise, M. F. Lacrampe and P. Krawczak, Prog Polym Sci, 2010, 35,
487-509.
2. T. Koike, Polymer Engineering & Science, 2012, 52, 701-717.
3. R. Auvergne, S. Caillol, G. David, B. Boutevin and J.-P. Pascault, Chemical Reviews,
2013, 114, 1082-1115.
4. L. L. Ferreira, R. Couto and P. J. Oliveira, European Journal of Clinical Investigation,
2015, 45, 32-36.
5. E. EFSA Panel on Food Contact Materials, Flavourings and Processing Aids (CEF),
EFSA Journal, 2015, 13.
6. H. Kishi, A. Fujita, H. Miyazaki, S. Matsuda and A. Murakami, J Appl Polym Sci, 2006,
102, 2285-2292.
7. T. Asano, M. Kobayashi, B. Tomita and M. Kajiyama, Holzforschung, 2007, 61, 14-18.
8. S. Gunasekaran, T. B. Gorczyca and H. S. Cole, Google Patents, 2003.
9. Y. Hasegawa, K. Shikinaka, Y. Katayama, S. Kajita, E. Masai, M. Nakamura, Y. Otsuka,
S. Ohara and K. Shigehara, Sen-I Gakkaishi, 2009, 65, 359-362.
10. E. Windeisen and G. Wegener, in Polymer science: A Comprehensive Reference, ed. M.
M. K. Matyjaszewski, Elsevier, Oxford, 2012, vol. 10, ch. 15, pp. 255-266.
11. C. Sasaki, M. Wanaka, H. Takagi, S. Tamura, C. Asada and Y. Nakamura, Ind Crop
Prod, 2013, 43, 757-761.
12. F. S. Hu, J. J. La Scala, J. M. Sadler and G. R. Palmese, Macromolecules, 2014, 47, 3332-
3342.
13. J. Deng, X. Liu, C. Li, Y. Jiang and J. Zhu, Rsc Adv, 2015, 5, 15930-15939.
14. M. Fache, E. Darroman, V. Besse, R. Auvergne, S. Caillol and B. Boutevin, Green Chem,
2014, 16, 1987-1998.
15. M. Fache, R. Auvergne, B. Boutevin and S. Caillol, Eur Polym J.
16. S. Benyahya, C. Aouf, S. Caillol, B. Boutevin, J. P. Pascault and H. Fulcrand, Ind Crop
Prod, 2014, 53, 296-307.
17. C. Aouf, H. Nouailhas, M. Fache, S. Caillol, B. Boutevin and H. Fulcrand, Eur Polym J,
2013, 49, 1185-1195.
18. P. Y. Kuo, M. Sain and N. Yan, Green Chem, 2014, 16, 3483 - 3493.
19. C. Aouf, C. Le Guernevé, S. Caillol and H. Fulcrand, Tetrahedron, 2013, 69, 1345-1353.

81
20. J. Pielichowski and P. Czub, Angew Makromol Chem, 1997, 251, 1-12.
21. H. Nouailhas, C. Aouf, C. Le Guerneve, S. Caillol, B. Boutevin and H. Fulcrand, J Polym
Sci Pol Chem, 2011, 49, 2261-2270.
22. H. Batzer and S. A. Zahir, J Appl Polym Sci, 1977, 21, 1843-1857.
23. C. S. Wang and Z. K. Liao, Polym Bull, 1991, 25, 559-565.
24. F. Ferdosian, Z. S. Yuan, M. Anderson and C. Xu, Rsc Adv, 2014, 4, 31745-31753.
25. A. K. Banthia, D. Lunsford, D. C. Webster and J. E. Mcgrath, J Macromol Sci Chem,
1981, A15, 943-966.
26. G. Jungang, J Appl Polym Sci, 1993, 48, 237-241.
27. S. Z. Rogovina, O. B. Salamatina, M. A. Markevich, A. I. Nepomnyashchii and N. S.
Enikolopyan, B Acad Sci Ussr Ch+, 1975, 24, 1626-1629.
28. M. A. Markevich, A. I. Kuzaev, L. S. Sakhonenko, L. V. Vladimorov, V. A. Pekarskii
and M. G. Brusilovskii, Vysokomol Soedin a+, 1984, 26, 615-622.
29. H.-C. Kang, B. Lee, J. Yoon and M. Yoon, J Amer Oil Chem Soc, 2001, 78, 423-429.
30. E. Petrie, Epoxy adhesive formulations, McGraw-Hill, 2005.
31. H. Kishi, Y. Akamatsu, M. Noguchi, A. Fujita, S. Matsuda and H. Nishida, J Appl Polym
Sci, 2011, 120, 745-751.
32. B. Ellis, Chemistry and Technology of Epoxy Resins, Springer Netherlands, 1993.
33. A. Granata and D. S. Argyropoulos, J Agr Food Chem, 1995, 43, 1538-1544.
34. A. W. T. King, I. Kilpelainen, S. Heikkinen, P. Jarvi and D. S. Argyropoulos,
Biomacromolecules, 2009, 10, 458-463.
35. N. S. Enikolopyan, M. A. Markevitch, L. S. Sakhonenko, S. Z. Rogovina and V. G.
Oshmyan, Journal of Polymer Science: Polymer Chemistry Edition, 1982, 20, 1231-1245.
36. S. Hartman and N. Y. Mahopac, Manufacture of Polyurethanes from bark, Champion
International Corporation, Stamford, Conn. ,UNITED STATES Pat., 1977.
37. K. Kemppainen, M. Siika-Aho, S. Pattathil, S. Giovando and K. Kruus, Ind Crop Prod,
2014, 52, 158-168.
38. W. Bradley, J. Forrest and O. Stephenson, J Chem Soc, 1951, 1589-1598.
39. V. T. Wyatt, J Appl Polym Sci, 2014, 131.
40. A. J. Gordon and R. A. Ford, The Chemist's Companion: A Handbook of Practical Data,
Techniques, and References, John Wiley & Sons Inc., New York, 1973.

82
41. A. K. Banthia, D. Lunsford, D. C. Webster and J. E. McGrath, Journal of
Macromolecular Science: Part A - Chemistry, 1981, 15, 943-966.
42. D. Mandal and J. A. Gladysz, Tetrahedron, 2010, 66, 1070-1077.
43. J. H. Bridson, Master, University of Waikato 2007.
44. D. R. Medjitov, L. G. Shode and G. M. Tseitlin, Polym Bull, 1998, 40, 509-516.
45. G. Rokicki and W. Kuran, Polymer, 1980, 21, 1069-1072.

83
Chapter 5 Thermal Degradation of Extractive-Based Bio-Epoxy
Monomer and Network: Kinetics and Mechanism
Abstract
In order to broaden the applications of bio-epoxy resins in high performance sector, an
understanding of thermal behaviour of these environmentally-friendly biopolymers is essential.
This chapter investigates the thermal degradation mechanism of a bio-epoxy resin (E-epoxy)
derived from bark extractives in comparison with a petroleum-based epoxy resin. The
thermogravimetric analysis (TGA) results show that the activation energy of E-epoxy varied
significantly with the extent of degradation indicating a multistage degradation mechanism
involving a variety of compounds. According to Fourier transform infrared spectroscopy
(FTIR) analysis, the dehydration and crosslinking reactions occurred at low temperatures,
while the Claisen chain rearrangement and chain-scission reactions dominated at high
temperatures. The pyrolysis-gas chromatography-mass spectrometry (Py-GC/MS) results show
that a significant amount of methyl abieta-8,11,13-trien-18-oate, diethyl phthalate, 2,2'-
isopropylidenebis(3,5-dimethylbenzofuran), and epimanool were detected in the bio-epoxy
resins. The newly proposed degradation mechanism of bio-epoxy resins based on structural
illustration through FTIR and Py-GC/MS can provide guidance for design of high performance
bio-based epoxies.
___________________________________________________________________________
A version of this chapter has been submitted to Journal of Analytical and Applied Pyrolysis,
JAAP-D-15-00326

84
5.1 Introduction
Epoxy resins have versatile molecular structures and well-established properties to match many
applications, ranging from traditional wood finishing to solar cell coating. However, due to the
health concerns of bisphenol A (BPA), a major ingredient of epoxy resins, there is a growing
interest in finding alternative synthetic precursors from renewable resources. In the last decade,
significant efforts have been made to substitute BPA with natural products such as vegetable
oils1-5, liquefied biomass6-7, lignin8-10, and rosin11-12. These bio-based polymers not only reduce
dependency on petroleum resources, but are also compatible with existing processes of epoxy
synthesis.
However, the use of bio-based epoxy resins at high temperatures limits their applications13-16.
For example, the aerospace industry has used epoxy resins for making fuselage parts for over
forty years, and the service temperature in that application is between 115°C and 311°C17. Most
current bio-based epoxy resins cannot withstand these high temperatures. In order to expand
the range of applications of bio-based epoxy resins, thermal stability must be considered as a
necessary factor. Nevertheless, there has been limited research focused on systematic studying
of thermal degradation behaviour of bio-based epoxy resins18.
Thermal degradation is widely studied via thermogravimetric analysis (TGA), which
characterizes the chemically stable temperature of materials and provides an understanding of
the degradation kinetics. Kinetic analysis of the dynamic TGA data can offer an estimation of
activation energy as a function of the conversion rate, and can also predict the degradation time
in an isothermal mode. As recommended by the ICTAC Kinetic Committee19, the integral
isoconversional method – Kissinger-Akahira-Sunose (KAS) – provides a more accurate
measurement than the Kissinger method or the Ozawa-Flynn-Wall method. However, the
chemical components of bio-epoxy resins are complex that cause difficulties on TGA data
interpretation.
In order to provide insight into the thermal degradation process and better link molecular
structure to thermal stability, the use of model compounds is commonly adopted to infer the
activation energy of epoxy resins20-22. Other techniques such as pyrolysis–gas
chromatography–mass spectrometry (Py-GC/MS) and FTIR can also provide degradation
information by detecting degraded volatile gas and chemical changes in the degraded solid
residuals, respectively. A detailed understanding of the decomposition pathways and
degradation by-products can offer directions for developing heat resistant bio-based epoxy
resin products.
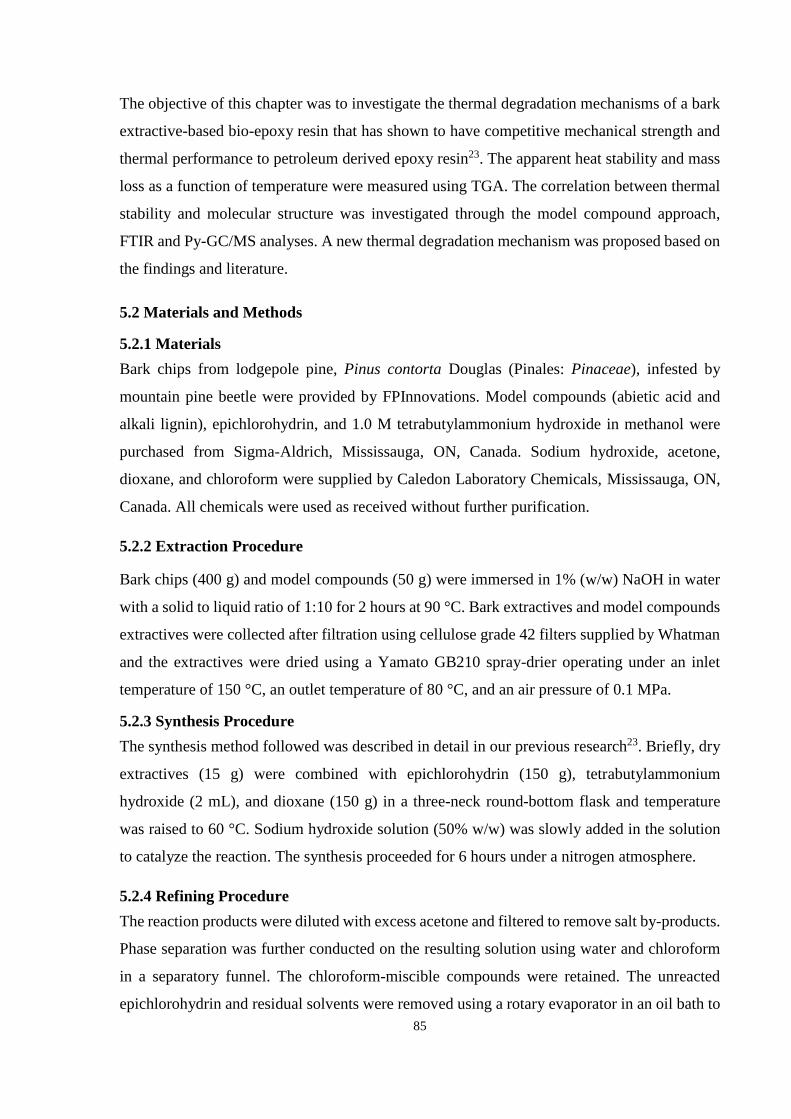
85
The objective of this chapter was to investigate the thermal degradation mechanisms of a bark
extractive-based bio-epoxy resin that has shown to have competitive mechanical strength and
thermal performance to petroleum derived epoxy resin23. The apparent heat stability and mass
loss as a function of temperature were measured using TGA. The correlation between thermal
stability and molecular structure was investigated through the model compound approach,
FTIR and Py-GC/MS analyses. A new thermal degradation mechanism was proposed based on
the findings and literature.
5.2 Materials and Methods
5.2.1 Materials
Bark chips from lodgepole pine, Pinus contorta Douglas (Pinales: Pinaceae), infested by
mountain pine beetle were provided by FPInnovations. Model compounds (abietic acid and
alkali lignin), epichlorohydrin, and 1.0 M tetrabutylammonium hydroxide in methanol were
purchased from Sigma-Aldrich, Mississauga, ON, Canada. Sodium hydroxide, acetone,
dioxane, and chloroform were supplied by Caledon Laboratory Chemicals, Mississauga, ON,
Canada. All chemicals were used as received without further purification.
5.2.2 Extraction Procedure
Bark chips (400 g) and model compounds (50 g) were immersed in 1% (w/w) NaOH in water
with a solid to liquid ratio of 1:10 for 2 hours at 90 °C. Bark extractives and model compounds
extractives were collected after filtration using cellulose grade 42 filters supplied by Whatman
and the extractives were dried using a Yamato GB210 spray-drier operating under an inlet
temperature of 150 °C, an outlet temperature of 80 °C, and an air pressure of 0.1 MPa.
5.2.3 Synthesis Procedure
The synthesis method followed was described in detail in our previous research23. Briefly, dry
extractives (15 g) were combined with epichlorohydrin (150 g), tetrabutylammonium
hydroxide (2 mL), and dioxane (150 g) in a three-neck round-bottom flask and temperature
was raised to 60 °C. Sodium hydroxide solution (50% w/w) was slowly added in the solution
to catalyze the reaction. The synthesis proceeded for 6 hours under a nitrogen atmosphere.
5.2.4 Refining Procedure
The reaction products were diluted with excess acetone and filtered to remove salt by-products.
Phase separation was further conducted on the resulting solution using water and chloroform
in a separatory funnel. The chloroform-miscible compounds were retained. The unreacted
epichlorohydrin and residual solvents were removed using a rotary evaporator in an oil bath to

86
120 °C under reduced pressure.
5.2.5 Characterization
5.2.5.1 Thermogravimetric Analysis (TGA)
The thermal stability of epoxy resins was investigated using a thermal gravimetric analyzer
(TGA-Q500, TA Instruments, USA). Approximately 10-15 mg of sample was weighed in a
platinum pan and operated under a continuous flux of air or nitrogen (60 cm3/min). Under
dynamic analysis, all of the samples were heated from room temperature to 700 °C with 5, 10,
15, and 20 °C/min ramp; under isothermal conditions, samples were heated under 100, 200,
300, 400, or 500 °C for 90 min, respectively.
5.2.5.2 Fourier Transform Infrared Spectroscopy (FTIR)
Degraded epoxy residuals were studied using a Bruker Tensor 27 spectrometer in an
environmental chamber. Liquid samples were placed between two KBr crystal discs, while
solid samples were mixed with KBr powder to form a pellet. All spectra were recorded between
4000-600 cm-1 at a resolution of 4 cm-1 with 32 scans.
5.2.5.3 Pyrolysis-Gas Chromatography/Mass Spectrometry (Py-GC/MS)
The apparatus of Py-GC/MS consists of a multi-shot pyrolysis (PY-3030D Model, Frontier Lab
Ltd., Japan) coupled to a gas chromatography (MS5973 Model, Agilent Technologies, USA).
In each test, approximately 0.1-0.2 mg of samples were decomposed into volatile compounds
or fragments. The entire pyrolysis process was divided into three heating stages, 70 ºC-300 ºC,
300 ºC-450 ºC and 450 ºC-550 ºC with 20 ºC/min ramp. The carrier gas was helium at a flow
rate of 13.3 ml/min. The transfer line temperature was set at 320 ºC to keep the chemicals
volatile during transport from the pyrolyzer to the GC column. The stationary phase of the GC
column was dimethyl polysiloxane (UA-1 model, Frontier Lab Ltd., Japan). The GC
temperature was initially held at 50 ºC for 1 minute and then ramped to 320 ºC at 20 ºC /min
with a soak for 5 minute. The mass spectra were measured using electron impact ionization
energy of 70 eV. The mass detector was focused on 230 m/z at scan rate of 2 scans per second.
The data were searched using the NIST MS library.
5.3 Results and Discussion
TGA is used primarily to determine the composition of materials and to predict their thermal
stability at elevated temperatures in inert/air environment. Many researchers have reported that
thermal stability of epoxy resins is mainly affected by their monomeric structure. Therefore,

87
we looked first at the thermal stability of the monomers and then at the thermal stability of the
cured resins with network structures.
5.3.1 Thermal Stability of Monomers
5.3.1.1 Mass Loss of Monomers
The mass losses as a function of temperature for petroleum-based epoxy (P-epoxy) monomer
and extractive-based epoxy (E-epoxy) monomer and their derivatives are shown in Fig. 5-1 (a)
and (b). The P-epoxy monomer was used as the reference and its degradation occurred from
150 °C to 450 °C. There are three major degradation peaks in the derived mass loss curve of
P-epoxy, 307 °C (79%), 354 °C (12%), and 413 °C (9%). By contrast, E-epoxy monomer
degradation initiated earlier starting from 50 °C, and there is no single identifiable peak. The
continuous degradation process of the E-epoxy resins was likely caused by the complexity of
the bark extractive components. This broad decomposition pattern also implies that the E-
epoxy resin contains not only aromatic extractive compounds, but also aliphatic fractions,
which reduce the overall thermal stability.
Fig. 5-1 Thermal degradation of the P-epoxy monomer and E-epoxy monomer under nitrogen
environment by TGA, showing the (a) mass curves and (b) derivative of the mass loss curves.
In order to separate the broad peaks of E-epoxy monomer in the derivative TGA (DTGA)
results, Origin (version 8.6; Microcal Software Inc., Northampton, MA) was used to identify
six major peaks from the E-epoxy resins, shown in Fig. 5-2. The R2 of this fitting model is
0.999 and the residuals sum of square is only 0.06, which is lower than five-peaks fitting (0.14)
and seven-peaks fitting (0.21). Compared to Lorentzian and Voigt models, we found that Gauss
curves fit our experimental data best. These peaks, ranging from low to high temperatures, were
at 157 °C (24.3%), 242°C (26.2%), 280 °C (9.9%), 318 °C (14.2%), 352 °C (6.6%) and 391 °C
(18.8%), respectively. The percentage shown in the parentheses are the ratios of the single peak

88
area to the total area.
Fig. 5-2 Deconvolution of the multi-peaks of the E-epoxy monomer DTGA results.
To understand these deconvoluted peaks of the E-epoxy monomer, abietic acid-based epoxy
(abbreviated as A-epoxy) and alkaline lignin-based epoxy (abbreviated as L-epoxy) were
synthesized as model compounds, and their peaks were compared with the E-epoxy. Abietic
acid and alkaline lignin represent two major extractive categories, resin acid and degraded
lignin, respectively. Fig. 5-3 shows that A-epoxy had one major decomposition temperature at
285 °C and L-epoxy had two major decomposition temperatures at high temperature (358 °C
and 394 °C). The degradation temperature patterns of the model compounds suggest that the
fifth and sixth peak of the E-epoxy resins were from degraded lignin and the third peak was
from abietic acid. The heat-resistant index temperature (Ts) is given in Table 5-1. This value
was determined from the temperatures at 5% mass loss (Td5) and 30% mass loss (Td30) of the
sample as obtained by TGA, following Eq. (5-1):
Ts = 0.49 (Td5 + 0.6 (Td30 − Td5)) Eq. (5-1)
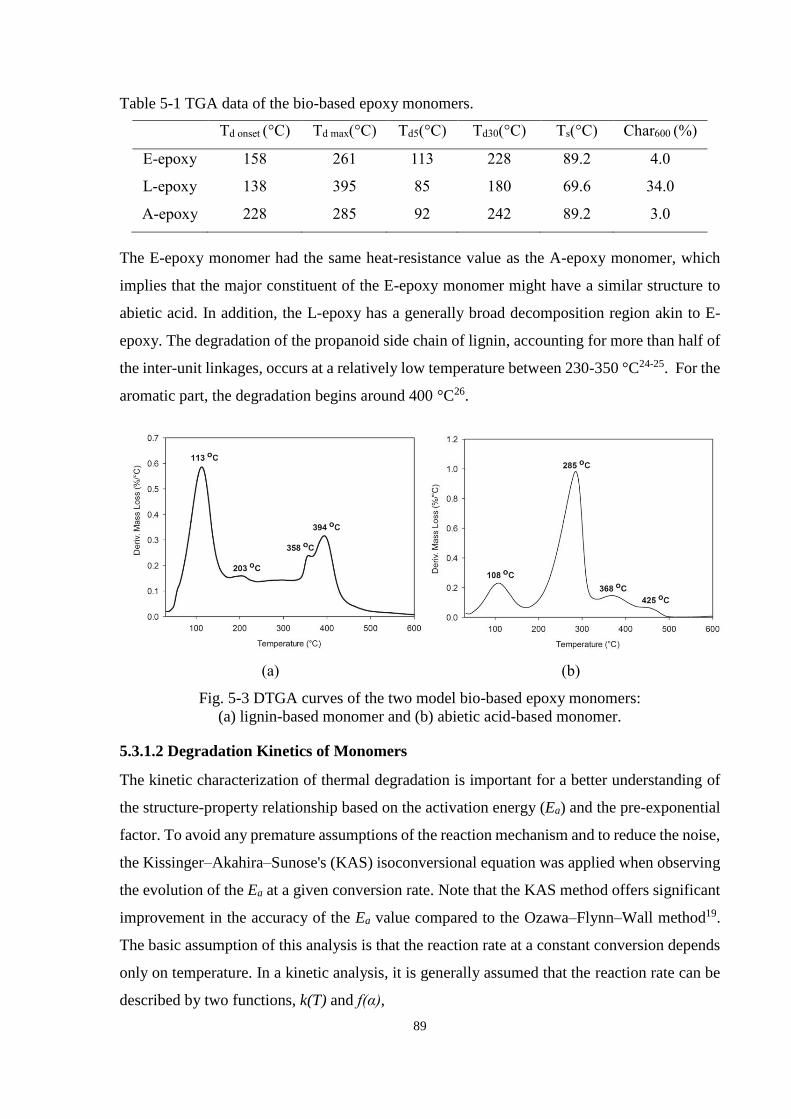
89
Table 5-1 TGA data of the bio-based epoxy monomers.
Td onset (°C) Td max(°C) Td5(°C) Td30(°C) Ts(°C) Char600 (%)
E-epoxy 158 261 113 228 89.2 4.0
L-epoxy 138 395 85 180 69.6 34.0
A-epoxy 228 285 92 242 89.2 3.0
The E-epoxy monomer had the same heat-resistance value as the A-epoxy monomer, which
implies that the major constituent of the E-epoxy monomer might have a similar structure to
abietic acid. In addition, the L-epoxy has a generally broad decomposition region akin to E-
epoxy. The degradation of the propanoid side chain of lignin, accounting for more than half of
the inter-unit linkages, occurs at a relatively low temperature between 230-350 °C24-25. For the
aromatic part, the degradation begins around 400 °C26.
(a)
(b)
Fig. 5-3 DTGA curves of the two model bio-based epoxy monomers:
(a) lignin-based monomer and (b) abietic acid-based monomer.
5.3.1.2 Degradation Kinetics of Monomers
The kinetic characterization of thermal degradation is important for a better understanding of
the structure-property relationship based on the activation energy (Ea) and the pre-exponential
factor. To avoid any premature assumptions of the reaction mechanism and to reduce the noise,
the Kissinger–Akahira–Sunose's (KAS) isoconversional equation was applied when observing
the evolution of the Ea at a given conversion rate. Note that the KAS method offers significant
improvement in the accuracy of the Ea value compared to the Ozawa–Flynn–Wall method19.
The basic assumption of this analysis is that the reaction rate at a constant conversion depends
only on temperature. In a kinetic analysis, it is generally assumed that the reaction rate can be
described by two functions, k(T) and f(α),

90
𝑑𝛼/𝑑𝑡=k(𝑇)𝑓(𝛼)=𝐴𝑒𝑥𝑝(−𝐸𝑎/𝑅𝑇)𝑓(𝛼) Eq. (5-2)
where k(T) is the rate constant and f(α) is the reaction model. When the heating rate (𝛽) is
constant, Eq. (5-2) can be rewritten as
𝑑𝛼/𝑑𝑇=(−𝐸𝑎/𝑅𝑇)𝑓(𝛼)/𝛽 Eq. (5-3)
As shown in Eq. (5-3), the isoconversional method offers an assumption-free estimate of the
Ea.
(𝑑𝑙𝑛/𝑑𝑇)(𝑑𝛼/𝑑𝑡)𝛼=𝐸𝑎,α/𝑅 Eq. (5-4)
where Ea,α is the activation energy at a given conversion. Note that the KAS method offers
significant improvement in the accuracy of the Ea,α value compared to the Ozawa–Flynn–Wall
method19.
It was found that the Ea of the P-epoxy monomer remained at a constant value of approximately
105 kJ/mol before 70% conversion, and then it abruptly increased to 200 kJ/mol (Fig. 5-4a).
The growing change in Ea was likely due to the carbonized bonds in the degraded molecules.
Compared to the P-epoxy monomer, the E-epoxy monomer shows larger changes in Ea and a
higher overall Ea after 60% conversion. The Ea of the E-epoxy monomer shows a two-stage
increase, which in turn suggests a complex multi-step degradation mechanism. Owing to its
multiplicity, neither nth order nor autocatalytic reactions were used to calculate the value of Ea.
Please note the average activation energy of E-epoxy (121 kJ/mol) is higher than that of P-
epoxy (118 kJ/mol). In addition, to better understand the degradation mechanism, the Ea of A-
epoxy and L-epoxy were also investigated, as shown in Fig. 5-4b. Due to its simpler structure,
A-epoxy had a more consistent Ea compared to E-epoxy resin and L-epoxy resins. Among the
three epoxy resins, the Ea of E-epoxy changes the most with temperature, from 64 kJ/mol to
240 kJ/mol, due to its complex structures. Because of the high viscosity of L-epoxy which
hindered the solvent drying process, the Ea can also be influenced by the remaining volatilized
solvent, which decreased the activation energy at 40% conversion27. However, since thermal
kinetic analysis is not species specific, it is difficult to draw a solid conclusion about which
molecules are in the resins. For this reason, we further explored the residuals after degradation
using FTIR.

91
(a)
(b)
Fig. 5-4 Dependence of the Ea on the extent of conversion evaluated from non-isothermal
TGA data.
5.3.1.3 FTIR Residual Analysis of Monomers after Isothermal Thermal Degradation
The structural changes of monomers at different thermal degradation stages were characterized
by FTIR as shown in Fig. 5-5. The tentative assignments of the peaks observed in the diverse
temperature spectra of the monomers are reported in Table 5-2.
P-epoxy monomer was relatively stable compared to E-epoxy monomer, which contained a
high percentage of alkane (2928 cm-1 and 2854 cm-1) and carbonyl groups (1724 cm-1). Based
on FTIR analysis, no functional groups were found to be significantly changed after P-epoxy
was heated up to 200 °C in a nitrogen environment. Note that the total mass loss of P-epoxy
had already reached 10% at 200 °C, but the only difference in the FTIR was the slight increase
of hydroxyl group absorption band caused by hydrolyzed ether groups. When the temperature
increased further, the intensity of epoxy group absorption band decreased until it vanished at
400 °C. As the P-epoxy monomer was heated up to 300 °C which gave a mass loss around
80%, a new carbonyl absorption band was observed at 1721 cm-1, which was assigned to the
isomerization of ether bonds.
Different from the FTIR spectrum of P-epoxy, the carbonyl absorption band of E-epoxy was
not caused by thermal degradation. The high concentration of carbonyl groups is a specific
feature of the bark alkaline extractives, owing to the oxidation reaction between polyflavonoids
and air during the extraction process 28-29. Furthermore, E-epoxy showed several changes in the
functional groups even at 200 °C, including an increase in the intensity of a carbon-carbon
double bond absorption (1642 cm-1), which indicates a dehydration reaction was occurring, and
a decrease of epoxy absorption (1101 cm-1, 912 cm-1, and 841 cm-1). When the temperature

92
reached 400 °C, the E-epoxy appeared to have carboxylic acid absorption from 3300 to 2500
cm-1. There are two general points noted in both monomers when tested under a nitrogen
atmosphere: (a) the intensity of the hydroxyl group absorption peak progressively increased
with the increasing temperature, and (b) at 400 °C the total mass loss of both monomers reached
90%, at that point most of the absorption features were removed from the fingerprint region.
On the other hand, the decomposition process in air was faster and showed differences when
compared to that in a nitrogen environment. The effect of oxygen led to changes in both the
reaction rate and kinetic order of the reaction. Even at 200 °C, two increasing absorption bands
were observed when heating in air, including the hydroxyl groups at 3448 cm-1 and carbonyl
group at 1655 cm-1, as shown in Fig. 5-5b. Many studies have indicated that hydroperoxide
groups are produced during heating of epoxy in an air environment, which in turn form a strong
carboxylic acid absorption band ranging from 3500 to 2500 cm-1 above or equal to 300 °C30.
These acid compounds might be formed from the degraded phenolic compounds. In E-epoxy,
the most significant absorption band after degradation at 100 °C was at 757 cm-1, which was
likely associated with the residual chlorine on the hydrolyzed products. The effect of the
residual chlorine on the thermal stability was found to be negative due to its low bond energy31.
At 200 °C, the growing absorptions at 940, 880, and 700 cm-1 suggest asymmetric and
symmetric carbon double bonds32. Most aliphatic C-H absorption bands had disappeared at 300
°C, and the carboxylic acid absorption appeared at 400 °C. Furthermore, there is no residual
char observed at the end of the degradation process, which is common for most epoxy resins33.

93
Fig. 5-5 FTIR spectra of the commercial monomer and bio-epoxy monomer after TGA in
nitrogen or air atmospheres at various temperatures: (a) P-epoxy under nitrogen, (b) P-
epoxy under air, (c) E-epoxy under nitrogen, (d) E-epoxy under air.
Table 5-2 Peak assignments of the FTIR spectra of monomers.
Wavenumber (cm-1) Peak assignments Ref.
3640-3530 υ (Ph-O-H) 34
3570-3200 υ (O-H); Hydrogen Bonded 33-34
3130-3006 υ (Ar-H) 33-34
2980-2780 υ C-(C-H) and υ C=(C-H2) 33
3300-2500 υ (O-H), Carboxylic acid 34
1740-1694 υ (C=O), Aldehyde or acid 33
1642-1580/1510-1450 υ (C=C-C), Aromatic ring 35
1475-1450/1380-1360 δ (C-H2) 33
1250-1237 υ (Ar-O-C) 35
1176-1169/1113-1108 δ Ar-(C-H) 33
1135-1024 υ C-(C-O) 33
915-905 υ (C-O), oxirane 34, 36
839-822 υ (C-O-C), oxirane 34, 36
814-807 δ (Ar-H) 34
783-621 γ (Ar-CH2) 34
757 υ (C-Cl) 35
υ:stretching; δ: in-plane bending; γ:out-plane bending
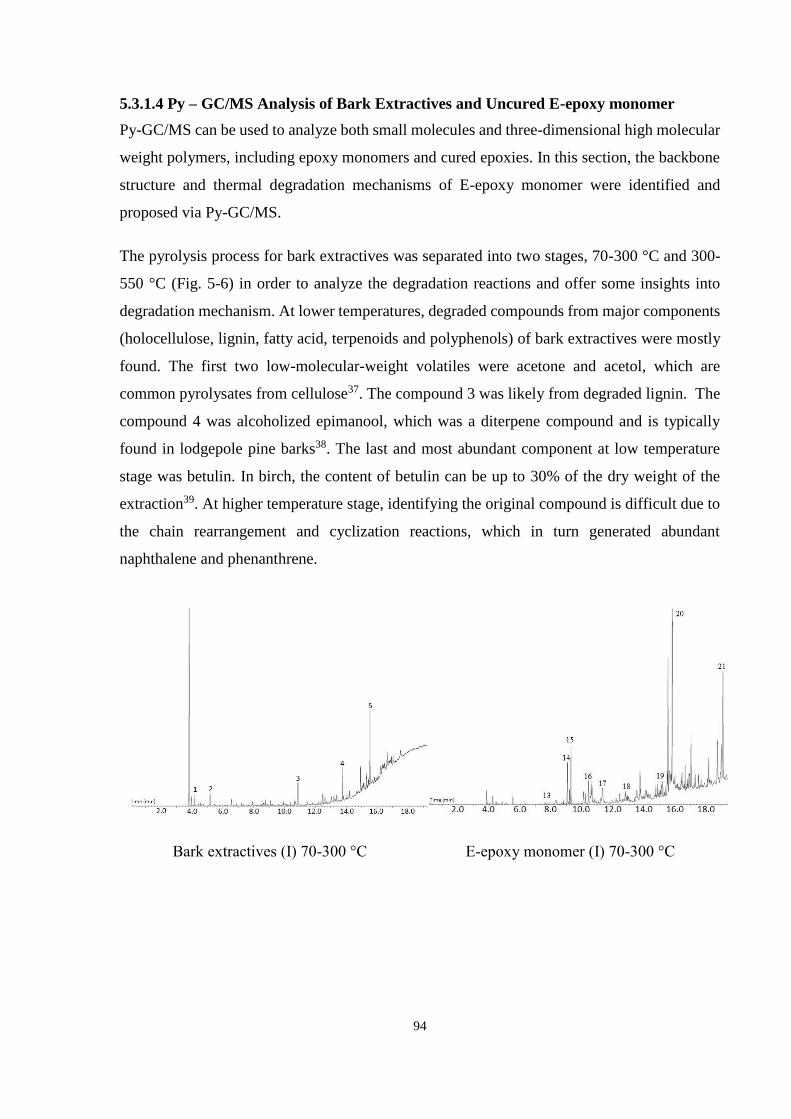
94
5.3.1.4 Py – GC/MS Analysis of Bark Extractives and Uncured E-epoxy monomer
Py-GC/MS can be used to analyze both small molecules and three-dimensional high molecular
weight polymers, including epoxy monomers and cured epoxies. In this section, the backbone
structure and thermal degradation mechanisms of E-epoxy monomer were identified and
proposed via Py-GC/MS.
The pyrolysis process for bark extractives was separated into two stages, 70-300 °C and 300-
550 °C (Fig. 5-6) in order to analyze the degradation reactions and offer some insights into
degradation mechanism. At lower temperatures, degraded compounds from major components
(holocellulose, lignin, fatty acid, terpenoids and polyphenols) of bark extractives were mostly
found. The first two low-molecular-weight volatiles were acetone and acetol, which are
common pyrolysates from cellulose37. The compound 3 was likely from degraded lignin. The
compound 4 was alcoholized epimanool, which was a diterpene compound and is typically
found in lodgepole pine barks38. The last and most abundant component at low temperature
stage was betulin. In birch, the content of betulin can be up to 30% of the dry weight of the
extraction39. At higher temperature stage, identifying the original compound is difficult due to
the chain rearrangement and cyclization reactions, which in turn generated abundant
naphthalene and phenanthrene.
Bark extractives (I) 70-300 °C
E-epoxy monomer (I) 70-300 °C

95
Bark extractives (II) 300-550 °C
E-epoxy monomer (II) 300-450 °C
E-epoxy monomer (III) 450-550 °C
Fig. 5-6 Py-GC/MS chromatogram of bark extractives and uncured bio-epoxy monomer
The E-epoxy contains a variety of pyrolysates, including 20 recognizable compounds based on
the Py-GC/MS spectra (Fig. 5-6). There were three stages for E-epoxy monomer pyrolysis: 70-
300 °C, 300-450 °C and 450 °C-550 °C. At lower pyrolysis temperatures, dehydroabietic acid
and BPA were identified as major products. Consistent with the TGA results, abietic acid is
one of the primary components of E-epoxy. Moreover, abietic acid can be increased in infested
lodgepole pine as a defense mechanism against mountain pine beetle attack40. Therefore, it is
highly possible that abietic acid is one of the major backbone structures of E-epoxy. The
bisphenol A/F/P structure seen in the Py-GC/MS spectra may come from reconstructed lignin
fractions or a recombination between acetone and phenols. It is very unlikely that the bio-based
epoxy resin contains some bisphenol A and F during synthesis. These compounds were
generated as byproducts during pyrolysis. Some by-products produced from synthesis process,
such as hydrolyzed epichlorohydrin and polymerized epichlorohydrin were also observed. In
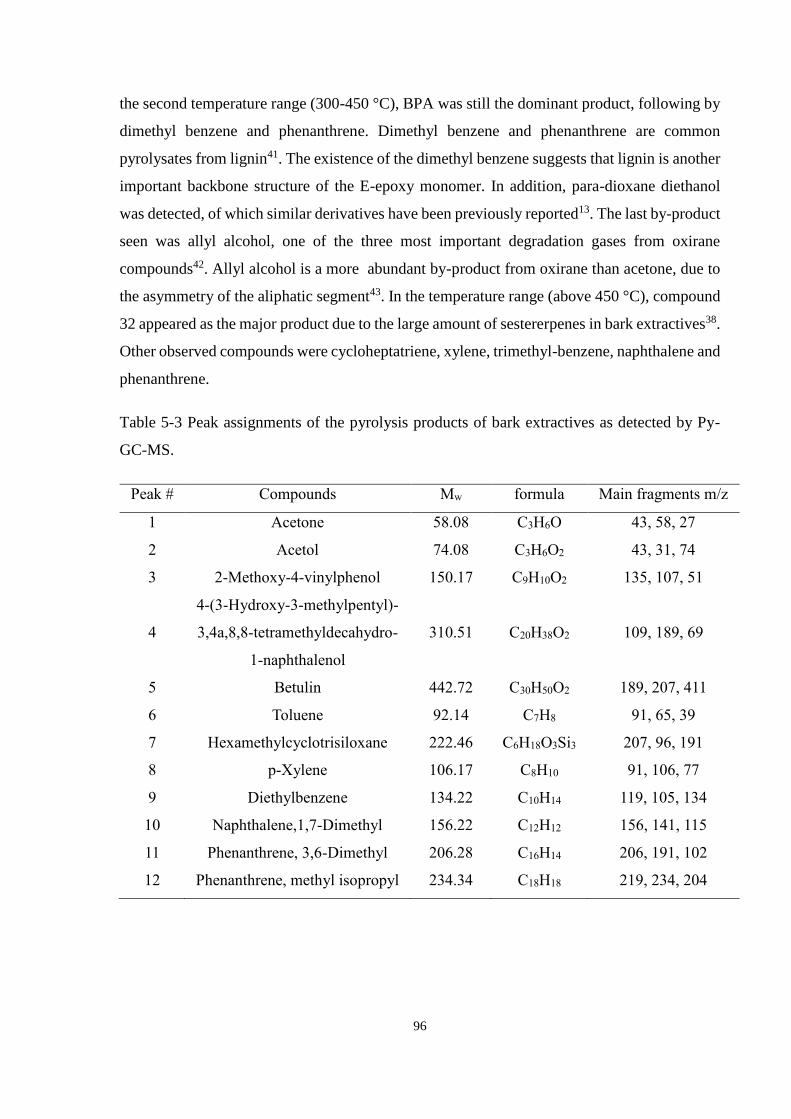
96
the second temperature range (300-450 °C), BPA was still the dominant product, following by
dimethyl benzene and phenanthrene. Dimethyl benzene and phenanthrene are common
pyrolysates from lignin41. The existence of the dimethyl benzene suggests that lignin is another
important backbone structure of the E-epoxy monomer. In addition, para-dioxane diethanol
was detected, of which similar derivatives have been previously reported13. The last by-product
seen was allyl alcohol, one of the three most important degradation gases from oxirane
compounds42. Allyl alcohol is a more abundant by-product from oxirane than acetone, due to
the asymmetry of the aliphatic segment43. In the temperature range (above 450 °C), compound
32 appeared as the major product due to the large amount of sestererpenes in bark extractives38.
Other observed compounds were cycloheptatriene, xylene, trimethyl-benzene, naphthalene and
phenanthrene.
Table 5-3 Peak assignments of the pyrolysis products of bark extractives as detected by Py-
GC-MS.
Peak # Compounds Mw formula Main fragments m/z
1 Acetone 58.08 C3H6O 43, 58, 27
2 Acetol 74.08 C3H6O2 43, 31, 74
3 2-Methoxy-4-vinylphenol 150.17 C9H10O2 135, 107, 51
4
4-(3-Hydroxy-3-methylpentyl)-
3,4a,8,8-tetramethyldecahydro-
1-naphthalenol
310.51 C20H38O2 109, 189, 69
5 Betulin 442.72 C30H50O2 189, 207, 411
6 Toluene 92.14 C7H8 91, 65, 39
7 Hexamethylcyclotrisiloxane 222.46 C6H18O3Si3 207, 96, 191
8 p-Xylene 106.17 C8H10 91, 106, 77
9 Diethylbenzene 134.22 C10H14 119, 105, 134
10 Naphthalene,1,7-Dimethyl 156.22 C12H12 156, 141, 115
11 Phenanthrene, 3,6-Dimethyl 206.28 C16H14 206, 191, 102
12 Phenanthrene, methyl isopropyl 234.34 C18H18 219, 234, 204

97
Table 5-4 Peak assignments of the pyrolysis products of uncured bio-epoxy monomer as
detected by Py-GC-MS.
Peak # Compounds Mw formula Main fragments m/z
13 α-Chlorohydrin 110.54 C3H7ClO2 44, 61, 79
14 n-Butyl glycidyl ether 130.19 C7H14O2 29, 57, 41
15 1,2,4-Butanetriol 106.12 C4H10O3 75, 31, 45
16 2,2'-[1,2-Ethanediylbis
(oxymethylene)]dioxirane 174.19 C8H14O4 57, 31, 45
17 2,2'-Isopropylidenebis(3,5-
dimethylbenzofuran) 332.44 C23H24O2 317, 171, 210
18 Bisphenol P 346.19 C24H26O2 331, 158, 135
19 Bisphenol F 200.23 C13H12O2 107, 200, 77
20 Bisphenol A 228.29 C15H16O2 213, 119, 91
21 Methyl abieta-8,11,13-trien-18-oate 314.46 C21H30O2 239, 299, 43
22 Allyl alcohol 58.08 C3H6O 57, 29
23 1,4-Dimethyl-2-ethylbenzene 134.22 C10H14 119, 134, 91
24 1,4-Dioxane-2,6-diyldimethanol 148.16 C6H12O4 57, 31, 117
25 Bisphenol A 228.29 C15H16O2 213, 119, 91
26 Phenanthrene, methyl isopropyl 234.36 C18H18 219, 102
27 Cycloheptatriene 92.14 C7H8 91, 65, 39
28 p-Xylene 106.17 C8H10 91, 106, 77
29 1,2,4-Trimethylbenzene 120.19 C9H12 105, 120, 77
30 Naphthalene, 2,6-Dimethyl 156.22 C12H12 156, 115, 77
31 Phenanthrene, 2,7-Dimethyl 206.29 C16H14 206, 102
32
3-isopropyl-6a,10b-dimethyl-8-(2-oxo-2-
phenylethyl)dodecahydro-7H-
benzo[f]chromen-7-one
396.57 C26H36O3 105, 207, 77
5.3.1.5 Proposed Degradation Mechanism for Uncured E-epoxy monomer
Many studies have proposed possible degradation mechanisms for epoxy resins, both under
inert and air conditions42, 44. In general, there are two categories of reactions during thermal
decomposition: chain rearrangement reactions and cleavage reactions.
The chain rearrangement in epoxy systems is known to occur over a wide temperature range

98
through common rearrangement reactions such as isomerization and Claisen rearrangement43.
The isomerization of the epoxy group to an aldehyde occurs at around 300 °C44-45, and during
this reaction carbon dioxide is released from the carboxyl groups, water from the hydroxyl
groups, carbon monoxide from the weakly bound oxygen groups, and hydrogen from the
aliphatic and methoxy groups45. The Claisen rearrangement is expected to happen at higher
temperatures, and during this reaction allyl vinyl ether is converted to γ, δ-unsaturated
carbonyl46.
For the cleavage reactions, they can be divided into two categories: non-chain scission reactions
and chain scission reactions. The two ordinary non-chain scission reactions of epoxy systems
are dehydration, and dehydrogenation47 while the three typical chain scission reactions are
named based on the position at which they occur: random-chain scission, side-chain scission,
and end-chain scission48. Other possible reactions are etherification, crosslinking reactions and
cyclization reactions, which occur along with the aforementioned reactions. For example, a
chain broken by random-chain scission can immediately crosslink with other broken chains, or
it may lose small fragments from secondary reactions.
There are several thermal decomposition theories in the literature that link degradation
reactions of uncured epoxy resins with degradation by-products are summarized in Scheme 5-
135, 42, 44-45. Based on the starting reactions, we named the following three theories for epoxy
resins including chain rearrangement mechanism, etherification mechanism, and ring-opening
mechanism. The rearrangement reaction mechanism occurs initially followed by a cleavage
reaction, which produces the principal volatile compound of conventional epoxy - acrolein.
The second mechanism begins with an etherification reaction and then the products are
dehydrated or rearranged, followed by cleavage reactions, which produces allyl alcohol,
acetone, and simple phenolic compounds. With a cyclization reaction, the final products can
be relatively high molecular weight compounds, which may remain as residuals. The last
mechanism includes first a ring-opening reaction, followed by a rearrangement or a cleavage
reaction, and then produces allyl alcohol and acetone.

99
Scheme 5-1 Three dominant thermal degradation mechanisms of epoxy monomer. 35, 42, 44-45
These theories and our findings on both P-epoxy and E-epoxy are in good agreement, which
form the foundation of our newly proposed mechanism for uncured bio-epoxy monomer
(Scheme 5-2). Some important findings based on our FTIR and Py-GC/MS results are
summarized below: (1) In the low temperature ( ≤ 200 °C), there was an increasing amount of
hydroxyl groups in FTIR spectra and the E-epoxy changed from liquid to solid form, which
was likely caused by the etherification. As stated by the second theory, the first degradation
reaction is etherification at the very beginning. Previous study32 showed that the initial
temperature of crosslinking reaction begins from 220°C, which is close to our observed
temperature (200°C). (2) A strong chloride peak appeared in the FTIR absorption at 200 °C,
and volatile chlorine derivatives were detected by Py-GC/MS. (3) Double bond absorption
bands were observed at 200 °C using FTIR. Likely these unsaturated bonds were created from
dehydration reactions. Most studies36, 41, 43 agree that the dehydration reaction is dominant and
necessary for inducing further scission reactions. A thermal breakdown process is believed to
be initiated at the weakest link along the chain and an unsaturated bond can weaken the adjacent
C-O bond and initiate the scission reaction from there. These observations are consistent with
the theory. (4) The intensity of the aldehyde and alkane absorption bands dramatically
decreased on heating from 200 to 300 °C, which suggests decarbonylation and fragment

100
cleavage, respectively. These scission reactions can create small volatile gases such as acrolein,
allyl alcohol, and acetone. Allyl alcohol was detected by Py-GC/MS. Some studies showed that
these volatile products were mostly produced at 280 °C32. Additionally, these principal volatile
products can degrade further to other low molecular weight gases, such as monoxides, ethylene,
methane, and carbon dioxide. Although these volatile gases could be detected, the dominant
decomposition compounds were phenol and cresols based on the results of Py-GC/MS. (5)
From 350 to 550 °C, rearrangement reactions and cyclization were both observed on the lignin
unit and extractives. Compiling the above information, we propose the following mechanism
to describe the degradation behaviour of E-epoxy (the epoxidized dilignol and epoxidized
abietic acid were chosen as the example):
We applied the same concept developed from the theory 2 and 3 in our proposed mechanism.
The top reaction is a ring-opening reaction to open the epoxide group and produce allyl alcohol
(Compound 22 detected by Py-GC/MS). The second reaction is used to explain the chlorine
containing pyrolysates (Compound 13-15) since small amounts of chlorine were detected. The
third reaction is based on chain scission reaction and Claisen chain rearrangement to produce
xylene (Compound 28) and 1, 2, 4, - trimethylbenzene (Compound 29). The fourth reaction is
an etherification to further crosslink the bio-epoxy monomer and form a network structure,
which changes the sample form from liquid to solid. In the Scheme 2(V), we proposed A-epoxy
is one major component of E-epoxy. Its decomposition reactions include cleavage and
aromatization. In the Py-GC/MS analysis, compound 21 was detected at first heating stage (70-
300 °C) and compound 26 was detected at second heating stage (300-450 °C).

101
Scheme 5-2 Proposed degradation mechanism of E-epoxy resins (The solid coloured rounded
rectangular with the compound numbers refer to the results from Py-GC/MS; the yellow
highlight circles refer to the results from FTIR and the rest parts are supported by literature).
In an air environment, the theory mainly focuses on peroxide oxidation since oxygen can easily
initiate free radical reactions49, which was found using electron spin resonance during the
thermal degradation49. Free radicals can be detected even at low temperatures (e.g. 20 °C)50.
An increased number of free radicals are formed by the thermal cleavage of bonds, and then
they react with oxygen to yield peroxides or hydroperoxides. Park and Blount51 first suggested
the two mechanisms for these reactions, which were later modified by Lee44. The Scheme
below shows the yield of carbon dioxide, vinylphenol, and unsaturated acid. Based on the FTIR
residual analysis, acid absorption bands were observed at approximately 300 °C in an air
environment, the trials for which were run at a lower temperature than those under an inert
environment.
Scheme 5-3 Thermoxidation mechanism of epoxy
monomer.
44, 51
5.3.2 Thermal Stability of the Cured Epoxy Networks
5.3.2.1 Mass Loss and Derivative Mass Loss of the Cured Resins

102
In order to form a 3D network, epoxy monomers were cured with diethyl-methyl-benzene-
diamine (DMBD). Generally, the thermal stability of epoxy resins is mainly affected by the
structure of the curing agents. DMBD is an aromatic structure hardener, which was chosen in
this study to improve the thermal stability. Compared to uncured E-epoxy monomer, its
statistical heat resistance index temperature increased by 63 °C, which was also more than the
increase of P-epoxy (54 °C) with DMBD added. On the other hand, the crosslinking density is
a debatable factor affecting thermal stability shown by many studies52-55. Therefore, the effect
of crosslinking density on thermal resistance was not considered here.
In the thermal stability measurements, the most significant difference between the two samples
is at the initial stage, as shown in Fig. 5-7. The temperature of the onset degradation of E-epoxy
is 86 °C, much lower than that of P-epoxy, which can be explained by the aliphatic chains from
degraded lignin and diterpene. Overall, we found the thermal performance of P-epoxy is more
stable than that of E-epoxy. A single sharp derivative decomposition temperature of P-epoxy
appeared at 382 °C, while two derivative degradation peaks of cured E-epoxy resins were seen
at 330 °C and 392 °C. The second peak, at 392°C, is close to the degradation peak of HCN
bonds. In addition, since epoxy is rigid and brittle, the surface of epoxy resins is usually full of
cracks. These cracks can contribute more continued burning54, which is why the residuals of
epoxy resins were less than other thermoset resins.
Fig.5-7 Thermal degradation of the P-epoxy resin and E-epoxy resin under nitrogen:
(a) mass loss curves and (b) derivative mass loss curves.

103
Table 5-5 TGA data of the cured epoxy resins.
Td onset(°C) Td max(°C) Td5(°C) Td30(°C) Ts(°C) Char600 (%)
Cured E-epoxy 287 392 272 337 152 4.6
Cured P-epoxy 373 387 364 387 185 10.7
5.3.2.2 Degradation Kinetics of the Cured Networks
Following a similar analysis for epoxy monomer, these TGA data were converted by eq. 5-2 to
5-4 to obtain the value of Ea. To date, the kinetic models of cured epoxy resins are still under
debate56-58. Therefore, the model-free method, KAS, was applied in this study to obtain Ea
against the conversion rate. The Ea of these cured epoxy resins were found to be higher
compared to those of the monomers. For P-epoxy resin, its Ea kept a constant value (180-200
kJ/mol) before it reached 70% conversion, and then, it dramatically increased to 269 kJ/mol at
80% conversion. Compared to P-epoxy resins, cured E-epoxy exhibits lower Ea, except
between 50-65% conversion. Before 50% conversion, the Ea value of E-epoxy multi-stage
increased from 148 kJ to 192 kJ. Between 50% and 65% conversion, the Ea of E-epoxy was
higher than that of P-epoxy, which indicates that E-epoxy is relatively stable at certain
conversion stage, but the overall activation energy of E-epoxy (198 kJ/mol) is lower than that
of P-epoxy (211 kJ/mol). Moreover, the Ea value was dynamic in E-epoxy resins, which is
associated with the existence of various weak linkages that give rise to different mechanisms
of initiation. In the literature, the value for Ea can span from 63 kJ/mol to 267 kJ/ mol depending
on the components of the epoxy/amine systems59.

104
Fig. 5-8 Dependence of the Ea on the extent of conversion evaluated from non-
isothermal TGA data.
5.3.2.3 FTIR Residual Analysis of the Cured Resins after Isothermal Thermal
Degradation
Compared to the uncured epoxy monomer, large numbers of hydroxyl groups were observed
at room temperature. These were formed through the curing process. For the cured P-epoxy,
the major change of functional groups began at 300 °C. At 300 °C, the residuals showed fewer
hydroxyl groups (3570-3200 cm-1), fewer ether groups (1237-1108 cm-1/ 915 cm-1), more
amine groups (3400-3000 cm-1), more alkene groups (3032-2966 cm-1), and more carbonyl
groups (1740-1700 cm-1) than before heating. As mentioned before, dehydration reactions
occurred in the early stages of heating, which induced further scission reactions. Owing to the
decreased number of hydroxyl groups, the amine absorption band became apparent. Intact ether
absorption bands affirm that the C-N bond was weaker than the C-O linkage. At 400 °C, a
shoulder due to an amine absorption band was observed next to that of a hydroxyl group at
1628 cm-1. Note that there was no acid peak observed even at the high temperatures.
The cured E-epoxy started to degrade around 200 °C. From 200 to 400 °C, more free phenolic
compounds and carbonyl aldehydes were observed. Since E-epoxy has plenty of OH bonds that
can react with epoxy rings and form ether bonds, there were strong ether absorption bands seen
at 1300-1000 cm-1. Furthermore, bio-epoxy shows a strong absorption at 1000-650 cm-1, which
suggests the existence of aromatic C=C bonds35. E-epoxy has a strong acid peak that formed at
400 °C, and in air the acid peak showed up at 300 °C.

105
Fig. 5-9 FTIR spectra of the cured P-epoxy and cured E-epoxy after TGA in nitrogen or air
atomosphere at various temperatures: (a) P-epoxy under nitrogen, (b) P-epoxy under air, (c) E-
epoxy under nitrogen, (d) E-epoxy under air.

106
Table 5-6 Peak assignments of the FTIR spectra of cured resins.
Wavenumber (cm-1) Peak assignments Ref.
3645-3350 υ (O-H), Non-bonded hydroxyl; υ(Ph-O-H) 34
3570-3200 υ (O-H); Hydrogen Bonded 33
3400-3000 υ (N-H) 34
3032-2966 υ (C=C-H) 33, 35
2980-2780 υ (C-H) and υ(CH2) 33
1740-1700 υ (C=O), ketoaldehyde 33, 60
1650-1590 δ (N-H) 34, 61
1600/1505/1450 υ(Aromatic C=C) 35, 60
1237/1172/1108 υ (Ether C-O-C) 35
1033 δ (C-N) 33
915 δ (Oxirane C-O-C) 34
819/753 δ (Ar-H) 33, 60
876/819 δ (C-O-O-C) 34
721 δ (C-Cl) 35
5.3.2.4 Py-GC/MS Analysis of the Cured E-epoxy Resins
Once epoxy monomers are cured with an amine hardener, their networks are essentially
insoluble in any solvent, which makes many analytical techniques inaccessible for
characterization. To address this issue, pyrolysis analysis was used to characterize these
intractable materials. According to the literature20-21, 62, the major pyrolysis products of cured
epoxy resins are bisphenol A, dimethylaniline, isopropylphenol, acetaldehyde, cresols,
ethylene oxide, and allyl alcohol63. Other minor degradation products are quite complex and
more than 20 compounds have been reported63. This complexity is caused by random bond
breaking and forming during thermal degradation, which suggests that Py-GC/MS may have
challenges in offering precise molecular identification.
The major degradation products of E-epoxy resins between 70 °C to 300 °C were aniline,
epimanool, remaining surfactant, diethyl phthalate, and chlorobutane. Different to the E-epoxy
monomer, the principal products seen in Py-GC/MS were from the curing agent (DMBD). The
structure of DMBD had been rearranged from meta-substitution to para-substitution, which
implies the chain cleavages and isomerization reactions happened simultaneously. At low

107
heating degradation temperature, one major backbone structure of the E-epoxy monomer is
epimanool. However, epimanool and abietic acid are both mono-functional molecules, so some
part of the E-epoxy should contain linear fragments instead of a complete network. This can
partially explain the inferior thermal stabilities of E-epoxy. Diethyl phthalate is the other major
pyrolysate, which is a common degradation product from lignin64.
Between 300 °C and 450 °C, acrolein was found in E-epoxy resin and it is one of the principal
degradation gases in conventional epoxy resins63. The second major decomposition product
was 2-methyl-4-vinylphenol, likely breaking away from lignin41. At the last stage of pyrolysis
(450-550 °C), high amounts of stearic acid were observed, which is usually among the top five
most abundant components of extractives in lodgepole pine38. Previous study has already
confirmed that the amount of stearic acid is increased after attack by the mountain pine beetle40.
(I) 70-300 °C
(II) 300-450 °C

108
(III) 450-550 °C
Fig. 5-10 Py-GC/MS chromatograms of the cured bio-epoxy resins.
Table 5-7 Peak assignments of the cured bio-epoxy resins pyrolysis products detected by Py-
GC-MS.
Peak # Compounds Mw formula Main fragments m/z
33 1-Chlorobutane 92.57 C4H9Cl 56,41,27
34 Tributylamine 185.35 C₁₂H₂₇N 142,100,41
35 Diethyl phthalate 222.24 C12H14O4 149, 177,76
36 N4,N4-Diethyl-2-methyl-1,4-
benzenediamine 178.27 C11H18N2 163, 134,77
37 Epimanool 290.48 C20H34O 137, 81, 95
38 Acrolein 50.06 C3H4O 56, 27
39 2-Methoxy-4-vinylphenol 150.17 C9H10O2 135, 107, 51
40 2-Methoxy-4-vinylphenol 150.17 C9H10O2 135, 107, 51
41 Pentamethylaniline 163.26 C11H17N 163, 91, 131
42 N4,N4-Diethyl-2-methyl-1,4-
benzenediamine 178.27 C11H18N2 163, 178, 134
43 N4,N4-Diethyl-2-methyl-1,4-
benzenediamine 178.27 C11H18N2 163, 178, 134
44 Toluene 92.14 C7H8 91, 65, 39
45 Pentamethylaniline 163.26 C11H17N 163, 148, 91
46 2,3-Bis[(trimethylsilyl)oxy]propyl
(9Z,12Z)-9,12-octadecadienoate 498.89 C27H54O4Si2 73, 207, 147
5.3.2.5 Degradation Mechanism
Although the degradation behaviour of the cured epoxy resins has been extensively studied
since 195025, 27, 35, 44-45, 51, 65, a debate on the degradation mechanism has continued for about
two decades. A nearly complete framework surrounding the mechanism was proposed around
197035. In this theory, the thermal decomposition of epoxy starts from the dehydration of the
secondary alcohol, and is then followed by different scission reactions, including allyl-nitrogen
scission, aryl-methylene scission, and allyl-oxygen scission. As mentioned in the monomer
section, the next reactions include further crosslinking and Claisen rearrangements, which lead

109
to assorted phenols during thermal degradation.
Scheme 5-4 Three scission positions on vinylene ethers. (modified from Peterson-Jones66)
Among these scission reactions, allyl-nitrogen scission is most likely to occur. The weakest
bond among the monomers is the C-O bond. After reacting with the amine curing agent, the
weakest bond changed from C-O bond to C-N bond. Within a cured epoxy network, the C-N
bond dissociation energy is 65 kJ/mol, which is lower than that of the C-O linkage (70 kJ/mol)
33. Additionally, dehydration is a major reaction during degradation61 and it usually occurs next
to an allyl-nitrogen bond, which increases the probability of nitrogen scission reaction. These
nitrogen chain scission can release volatile compounds, such as ammonia and methylamine32.
However, due to the low sensitivity of early instruments in the past, the detection of polar amine
groups was an issue for early studies43, 45, which were unable to detect amine products during
thermal degradation. Consequently, many studies44, 62 incorrectly assumed that nitrogen
fragments stay as residuals on the epoxy and undergo charring. In our Py-GC/MS results, large
amounts of amine curing agents were detected at 350 °C. Allyl-oxygen scission can increase
the concentration of hydroxyl group as shown in the FTIR section and the splitting fraction can
cyclize for the further charring, which also contributes to the thermal stability.
(I) Allyl-Nitrogen Scission and Crosslinking
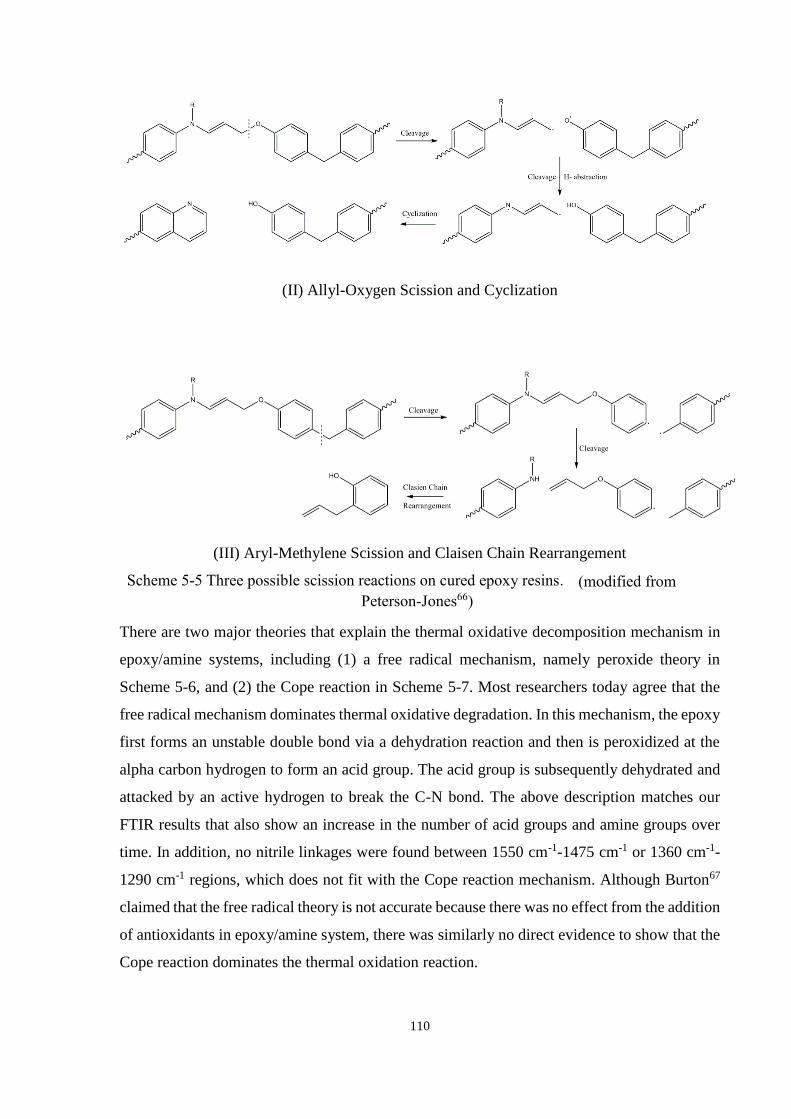
110
(II) Allyl-Oxygen Scission and Cyclization
(III) Aryl-Methylene Scission and Claisen Chain Rearrangement
Scheme 5-5 Three possible scission reactions on cured epoxy resins. (modified from
Peterson-Jones66)
There are two major theories that explain the thermal oxidative decomposition mechanism in
epoxy/amine systems, including (1) a free radical mechanism, namely peroxide theory in
Scheme 5-6, and (2) the Cope reaction in Scheme 5-7. Most researchers today agree that the
free radical mechanism dominates thermal oxidative degradation. In this mechanism, the epoxy
first forms an unstable double bond via a dehydration reaction and then is peroxidized at the
alpha carbon hydrogen to form an acid group. The acid group is subsequently dehydrated and
attacked by an active hydrogen to break the C-N bond. The above description matches our
FTIR results that also show an increase in the number of acid groups and amine groups over
time. In addition, no nitrile linkages were found between 1550 cm-1-1475 cm-1 or 1360 cm-1-
1290 cm-1 regions, which does not fit with the Cope reaction mechanism. Although Burton67
claimed that the free radical theory is not accurate because there was no effect from the addition
of antioxidants in epoxy/amine system, there was similarly no direct evidence to show that the
Cope reaction dominates the thermal oxidation reaction.

111
Scheme 5-6 Thermal oxidative mechanism based on the free radical mechanism. 35, 65
Scheme 5-7 Cope reaction proposed by Burton and Conley 67-68

112
5.4 Summary
This chapter investigated the thermal behaviour and degradation compounds of E-epoxy
monomer and its cured network. TGA, FTIR, and Py-GC/MS provide some insight into its
lower thermal performance in comparison with that of P-epoxy resin. For uncured E-epoxy
monomer, DTGA data shows a similar pattern to alkali lignin and abietic acid. Py-GC/MS
detected significant amounts of dehydroabietic acid and lignin fractions at relatively low
degradation temperatures (70-350 °C). Moreover, other extractive compounds from bark
skeletal structures during the degradation at these temperatures were identified as
cycloheptatriene, and diterpene. Based on the FTIR results, dehydration reactions occurred
when bio-epoxy monomer was heated up to 200 °C. There were also some carboxylic
compounds at high degradation temperatures (300-400 °C). On the other hand, cured E-epoxy
resin shows two distinct degradation peaks in the DTGA analysis, with one of the peaks
appearing at 392 °C, which represents the degradation of HCN bonds. Furthermore, Py-GC/MS
provided more detailed analysis of the cured E-epoxy resin compositions, such as diethyl
phathalic, epimanool, methoxy-vinyl phenol, and stearic acid. Therefore, the substandard
thermal performance of E-epoxy resin can be explained by the presence of these
monofunctionalized diterpene and fatty acid molecules.

113
References
1. B. S. Rao and A. Palanisamy, Eur Polym J, 2013, 49, 2365-2376.
2. S. Hirose, J Oil Palm Res, 2011, 23, 1110-1114.
3. H. Miyagawa, A. K. Mohanty, R. Burgueno, L. T. Drzal and M. Misra, J Polym Sci Pol Phys,
2007, 45, 698-704.
4. A. E. Gerbase, C. L. Petzhold and A. P. O. Costa, J Am Oil Chem Soc, 2002, 79, 797-802.
5. T. R. Cuadrado and R. J. J. Williams, Polym Commun, 1989, 30, 239-240.
6. H. Pan, Renew Sust Energ Rev, 2011, 15, 3454-3463.
7. T. Asano, M. Kobayashi, B. Tomita and M. Kajiyama, Holzforschung, 2007, 61, 14-18.
8. C. Sasaki, M. Wanaka, H. Takagi, S. Tamura, C. Asada and Y. Nakamura, Ind Crop Prod,
2013, 43, 757-761.
9. E. Windeisen and G. Wegener, in Polymer science: A Comprehensive Reference, ed. M. M.
K. Matyjaszewski, ELSEVIER, Oxford, 2012, vol. 10.
10. Y. Hasegawa, K. Shikinaka, Y. Katayama, S. Kajita, E. Masai, M. Nakamura, Y. Otsuka,
S. Ohara and K. Shigehara, Sen-I Gakkaishi, 2009, 65, 359-362.
11. Q. Q. Ma, X. Q. Liu, R. Y. Zhang, J. Zhu and Y. H. Jiang, Green Chem, 2013, 15, 1300-
1310.
12. X. Q. Liu, W. B. Xin and J. W. Zhang, Green Chem, 2009, 11, 1018-1025.
13. H. Nouailhas, C. Aouf, C. Le Guerneve, S. Caillol, B. Boutevin and H. Fulcrand, J Polym
Sci Pol Chem, 2011, 49, 2261-2270.
14. J. L. Qin, H. Z. Liu, P. Zhang, M. Wolcott and J. W. Zhang, Polym Int, 2014, 63, 760-765.
15. J. L. Chen, F. L. Jin and S. J. Park, Macromol Res, 2010, 18, 862-867.
16. S. J. Park, F. L. Jin and J. R. Lee, Mat Sci Eng a-Struct, 2004, 374, 109-114.
17. Q. Guo, ed., Thermosets: structure, properties and applications, Woodhead publishing
limited, 2012.
18. X. Feng, A. East, W. Hammond, Z. Ophir, Y. Zhang and M. Jaffe, J Therm Anal Calorim,
2012, 109, 1267-1275.
19. S. Vyazovkin, A. K. Burnham, J. M. Criado, L. A. Perez-Maqueda, C. Popescu and N.
Sbirrazzuoli, Thermochim Acta, 2011, 520, 1-19.
20. Paterson.Jc, V. A. Percy, R. G. F. Giles and A. M. Stephen, J Appl Polym Sci, 1973, 17,
1867-1876.
114
21. Paterson.Jc, V. A. Percy, R. G. F. Giles and A. M. Stephen, J Appl Polym Sci, 1973, 17,
1877-1887.
22. Y. L. Wang, X. Y. Wang, L. M. Liu and X. Y. Peng, J Mol Model, 2009, 15, 1043-1049.
23. P. Y. Kuo, M. Sain and N. Yan, Green Chem, 2014, 16, 3483 - 3493.
24. R. Wittkowski, J. Ruther, H. Drinda and F. Rafieitaghanaki, Acs Symposium Series, 1992,
490, 232-243.
25. W. Fiddler, W. E. Parker, Wasserma.Ae and R. C. Doerr, J Agr Food Chem, 1967, 15, 757-
&.
26. M. Brebu and C. Vasile, Cell Chem Technol, 2010, 44, 353-363.
27. D. W. Levi, L. Reich and H. T. Lee, Polymer Engineering & Science, 1965, 5, 135–141.
28. R. W. Hemingway and G. W. Mcgraw, J Liq Chromatogr, 1978, 1, 163-179.
29. G. Vázquez, G. Antorrena and J. C. Parajó, Wood Sci Technol, 1987, 21, 155-166.
30. N. Mailhot, S. Morlat-Theias, M. Ouahioune and J. L. Gardette, Macromol Chem Physic,
2005, 206, 575-584.
31. V. V. Korshak and S. V. Vinogradova, Russian Chemical Reviews, 1968, 37, 885-906.
32. N. Grassie, M. I. Guy and N. H. Tennent, Polym Degrad Stabil, 1985, 12, 65-91.
33. P. Musto, G. Ragosta, P. Russo and L. Mascia, Macromol Chem Physic, 2001, 202, 3445-
3458.
34. J. Coates, Appl Spectrosc Rev, 1998, 33, 267-425.
35. M. A. Keenan and D. A. Smith, J Appl Polym Sci, 1967, 11, 1009-&.
36. M. G.González, J. C. Cabanelas and J. Baselga, in Infrared Spectroscopy - Materials
Science, Engineering and Technology, ed. T. M. Theophanides, InTech, 2012, ch. 13.
37. Dekui Shen, Rui Xiao, Sai Gu and H. Zhang, in The Overview of Thermal Decomposition
of Cellulose in Lignocellulosic Biomass, eds. T. v. d. Ven and J. Kadla, InTech, Rijeka,
2013.
38. I. Backlund, M. Arshadi, A. J. Hunt, C. R. McElroy, T. M. Attard and U. Bergsten, Ind
Crop Prod, 2014, 58, 220-229.
39. B. Green, M. D. Bentley, B. Y. Chung, N. G. Lynch and B. L. Jensen, J Chem Educ, 2007,
84, 1985.
40. D. M. Shrimpton, Canadian Journal of Botany, 1973, 51, 527-534.
41. C. A. Mullen and A. A. Boateng, Fuel Process Technol, 2010, 91, 1446-1458.
42. N. Grassie, M. I. Guy and N. H. Tennent, Polym Degrad Stabil, 1985, 13, 11-20.

115
43. D. P. Bishop and D. A. Smith, J Appl Polym Sci, 1970, 14, 205-&.
44. L. H. Lee, J Appl Polym Sci, 1965, 9, 1981-&.
45. L. H. Lee, J Polym Sci Part A, 1965, 3, 859-&.
46. L. Claisen and E. Tietze, Berichte der deutschen chemischen Gesellschaft (A and B Series),
1925, 58, 275-281.
47. J. C. Paterson-Jones, J Appl Polym Sci, 1975, 19, 1539-1547.
48. S. o. F. P. Engineers, ed. P. J. DiNenno, National Fire Protection Association Quincy, 2002,
ch. 7, pp. 110-131.
49. A. P. Meleshevich, R. Y. Strakovskaya and L. M. Kovalenko, Sov Atom Energy+, 1987,
62, 225-227.
50. C. E. Yuan, M. Q. Zhang and M. Z. Rong, J Mater Chem A, 2014, 2, 6558-6566.
51. W. R. R. Park and J. Blount, Ind Eng Chem, 1957, 49, 1897-1902.
52. T. Dyakonov, P. J. Mann, Y. Chen and W. T. K. Stevenson, Polym Degrad Stabil, 1996,
54, 67-83.
53. M. Iji and Y. Kiuchi, Polym Advan Technol, 2001, 12, 393-406.
54. S. V. Levchik and E. D. Weil, Polym Int, 2004, 53, 1901-1929.
55. L. Reich, Journal of Polymer Science: Macromolecular Reviews, 1968, 3, 49-112.
56. A. I. Lesnikovich and S. V. Levchik, J Therm Anal, 1983, 27, 89-94.
57. L. J. Xia, L. Zuo, X. L. Wang, D. P. Lu and R. Guan, J Adhes Sci Technol, 2014, 28, 1792-
1807.
58. L. Barral, J. Cano, J. Lopez, I. Lopez-Bueno, P. Nogueira, M. J. Abad and C. Ramirez, Eur
Polym J, 2000, 36, 1231-1240.
59. V. Bellenger, E. Fontaine, A. Fleishmann, J. Saporito and J. Verdu, Polym Degrad Stabil,
1984, 9, 195-208.
60. T. Sugita, Journal of Polymer Science Part C: Polymer Symposia, 1968, 23, 765-774.
61. N. Grassie, M. I. Guy and N. H. Tennent, Polym Degrad Stabil, 1986, 14, 125-137.
62. Leisegan.Ec and A. M. Stephen, J Appl Polym Sci, 1970, 14, 1961-&.
63. S. Tsuge, H. Ohtani and C. Watanabe, Pyrolysis - GC/MS Data Book of Synthetic Polymers,
Elsevier, 2011.
64. J. Cho, S. Chu, P. J. Dauenhauer and G. W. Huber, Green Chem, 2012, 14, 428-439.
65. M. B. Neiman, A. S. Strizhkova, I. I. Levantovskaia, B. M. Kovarskaia, M. S. Akutin and

116
L. I. Golubenkova, J Polym Sci, 1962, 56, 383-&.
66. T. M. Paterson, R. K. Smalley and H. Suschitzky, Synthesis-Stuttgart, 1975, 187-189.
67. B. L. Burton, J Appl Polym Sci, 1993, 47, 1821-1837.
68. R. T. Conley, Thermal Stability of Polymers, Marcel Dekker Inc, New York, 1970.

117

118
Chapter 6 Influence of Nanocellulose Fibres (NCFs) on the
Curing Behaviours of Epoxy Resins
Abstract
Epoxy composites were prepared using diglycidyl ether bisphenol F and water-dilutable
diglycidyl ether bisphenol A with curing agents, polyoxypropylenediamine and
diethylmethylbenzenediamine, in water or dimethylformamide as a solvent. The influence of
NCFs and solvents on curing kinetics of epoxy composites was investigated. Curing kinetic
parameters were calculated using the model-fitting methods and the isoconversional method.
Among these, the Sestak–Berggren equation best fit the experimental data. Results indicated
that dimethylformamide decreased the reaction rate, whereas water revealed the opposite
pattern. NCFs catalyzed the reaction between bisphenol F resins and the aromatic curing agent.
___________________________________________________________________________
A version of this chapter has been published in European Polymer Journal (2013) 49:3778-
3787

119
6.1 Introduction
The push towards bio-based materials has been evident in the past decade. Numerous efforts
have been focused on developing green materials for various engineering applications,
including building supplies, automotive components as well as electronic devices. NCFs, one
of the representative bio-materials, has attracted a rapid growth of interest in both academia
and industry owing to its excellent engineering properties such as stiffness, Young‘s modulus,
and thermal stability. The high potential of NCFs enables NCFs-based materials to reduce the
usage of petro-based polymers. Although the usage of NCFs would provide significant interest
in terms of mechanical and thermal properties, the water sensitive nature of NCFs caused by
the presence of plentiful hydroxyl groups has limited its application. In order to increase the
usage of NCFs, the incorporation of NCFs with various thermoplastic 1-5 and thermosetting
polymers 6-10 has been developed for tailoring valuable properties, such as excellent optical
characteristics, high thermal conductivity as well as a low absorption of water .
Among polymer matrices, epoxy resins exhibit the lowest shrinkage and the highest diversity
of applications from rocket casings to dental fillings. Epoxies are an important class of high
performance thermosetting polymers and their favorable characteristics result in a global
market of $ 5.5 billion(USD) in 2011 11. The incorporation of nano-fillers into epoxy resins has
shown an excellent combination of high stiffness, strength, and good fatigue resistance.
However, a major drawback of fibre-reinforced epoxy is their incompatible interface, which
has led to a wide body of work in improving the adhesion of cellulose-based fibres with
conventional epoxy resins. Of the several methods proposed, solvent exchange as well as
surface modification 12-16, and water-based resins 17, are the most commonly used modification
to improve adhesion between the fibres and resins. Solvent treated nanocellulose fibres possess
lower surface energy 18, and thus the aggregation of fibres significantly decreased. Of the
commonly used solvents for NCFs 14, 19, dimethylformamide (DMF) was applied in this
research to clarify the solvent effect on NCFs/epoxy composites. In addition, due to the high
cost and long processing time of solvent exchange, water-based epoxy resins appear as a new
alternative, which can emulsify in water, and circumvents using organic solvents. Water-based
epoxy resins have good viscosity control which is an integral part of high surface area nano-
sized materials. These techniques, which were compared in this research, generally lead to a
successful adhesion improvement between the fibres and resins.

120
Although much attention has been given to the influence of these treatments on mechanical
properties 20-23, little is known about their influence on the curing behaviour of epoxy resins.
Understanding curing process is extremely important to obtain consistent products with the
desired physical and mechanical properties. As well, the curing process of epoxy resins can be
significantly affected by these interface treatments. For example, silane treated glass fibers
composites have lower activation energy than that with untreated fibers composites 24. Thus,
understanding the curing behaviour is necessary for manufacturing of NCFs/epoxy composites.
The curing kinetics information is useful in selecting the time-temperature curing regime, and
in controlling the structure of the 3-D network. From a theoretical point of view, many
researchers have proposed modeling techniques regarding curing kinetics of epoxy-based
composite systems 25. Modeling selection depends upon reaction types and resin structures.
The Kissinger equation is widely used to describe simplified first order reactions 26, while the
Sestak-Berggren empirical equation 27, and the Kamal equation 28 are commonly used to
describe autocatalytic systems, which consider hydroxyl groups as a catalyst. Recent kinetic
studies have focused on comparing model-fitting methods with isoconversional methods,
sometimes called model-free methods. The isoconversional methods follow the activation
energy as a function of the extent of reaction conversion without reaction mechanism
assumptions. Among these model-free methods, Kissinger-Akahira-Sunose method (KAS
method) is a common and accurate method that is widely used to describe the curing kinetic of
epoxy-amine systems. The methods mentioned above were compared to select a model that
more accurately describes the epoxy-amine systems curing behaviour and with a better fit to
the experimental data.
The objective of this chapter is to investigate the curing behaviour of NCFs/epoxy composite
systems. The influence of the type of epoxy, curing agent types and solvents was observed.
Significant changes in curing kinetic parameters were observed by means of differential
scanning calorimeter (DSC) and Fourier transform infrared spectroscopy (FTIR). The
correlation between NCFs/solvent addition and activation energy was described by the
Kissinger equation, the Sestak-Berggren equation, the Kamal equation and the KAS equation.
6.2 Materials and Methods
6.2.1 Materials
Two types of epoxy resins (EPON863, WD 510) and two types of amine hardeners (EPIKURE
121
3274, EPIKURE W) were supplied by Momentive Specialty Chemicals, OH, USA. EPON863
is a bisphenol F type epoxy resins, and its epoxy equivalent weight ranges 165-174 g/eq. WD
510 is a water-dilutable bisphenol A type epoxy resin, and its epoxy equivalent weight ranges
190-205 g/eq. EPIKURE 3274 (aliphatic type) and EPIKURE W (aromatic type), were
employed as diamine curing agents. Their major components are polyoxypropylenediamine
(POPDA) and diethylmethylbenzenediamine (DETDA), respectively and their amine hydrogen
equivalent weights are 76 g/eq and 45 g/eq, respectively. Dimethylformamide (DMF) was
purchased from Sigma–Aldrich Canada. These chemicals were used as received without further
purification. NCFs were lab-made and their diameter is between 5 and 60 nm. Additional
information on nanocellulose fibres preparation and characterization has been reported
elsewhere29.
6.2.2 Methods
The samples were prepared according to the formulations in Table 6-1. Prior to composite
preparation, the epoxy resin, curing agent, and nanocellulose fibres (2% w/w) were mixed for
5 min to ensure a homogeneous distribution. The composites were stored in desiccators in order
to prevent moisture absorption.
6.2.3 Characterization
6.2.3.1 Differential Scanning Calorimetry (DSC)
The curing behaviour and glass transition temperature (Tg) of the epoxy composites were
evaluated with a differential scanning calorimeter (DSC) model Q 100 from TA instruments.
Dynamic DSC measurements were carried out at a ramp rate of 5, 10, 15, and 20°C/min from
30 to 300°C to obtain the curing heat-flow curves of liquid samples. Then, the cured samples
were heated up to 300°C at 10°C /min to obtain the Tg of the fully cured samples.
6.2.3.2 Fourier Transform Infrared Spectroscopy (FTIR)
FTIR was performed on a Bruker Tensor 27 spectrometer with temperature controller – I0977
and was carried out with the samples between two KBr pellets. All FTIR absorption spectra
were recorded over 4000–400 cm-1 wavenumbers at a resolution of 4 cm-1 with 28 scans.
Table 6-1 Composition of samples
Samples*1 Resins Curing agents Solvents NCF*2

122
BiF-Aliph 69% BiF 31% POPDA N/A 0%
BiF-Aliph-DMF 35% BiF 15% POPDA 50% DMF 0%
BiF-Aliph-DMF-NCFs 33% BiF 15% POPDA 50% DMF 2%
BiF-Arom 79% BiF 21% DETDA N/A 0%
BiF-Arom-DMF 40% BiF 10% DETDA 50% DMF 0%
BiF-Arom-DMF-NCFs 38% BiF 10% DETDA 50% DMF 2%
BiF-Arom-NCFs 78% BiF 20% DETDA N/A 2%
WD-Aliph 72% WD 28% POPDA N/A 0%
WD-Aliph-Water 36% WD 14% POPDA 50% Water 0%
WD-Aliph-Water-NCFs 35% WD 13% POPDA 50% Water 2%
WD-Arom 81% WD 19% DETDA N/A 0%
WD-Arom-Water 41% WD 9% DETDA 50% Water 0%
WD-Arom-Water-NCFs 39% WD 9% DETDA 50% Water 2%
*1 Bisphenol F epoxy resins abbreviated as BiF; water-dilutable bisphenol A type epoxy resins abbreviated as WD;
aliphatic curing agents abbreviated as Aliph; aromatic curing agents abbreviated as Arom. *2 2% NCFs was calculated based the dry weight percentage
6.3 Results and Discussion
6.3.1 Curing Behaviour
The polymerization process can be monitored by FTIR and DSC. FTIR was used to monitor
the concentration of functional groups as the reaction proceeds via the evolution of
concentration of amino groups, hydroxyl groups or epoxide groups. The active hydrogen of the
amino groups was consumed by the epoxide group of the resin and formed hydroxyl groups
through the ring opening reaction. As shown in Fig. 6-1(a), it was observed that amino groups
(3380-3310 cm-1) decreased and hydroxyl groups (3600-3400 cm-1) increased. However, the
absorption peaks of amino and hydroxyl groups tend to overlap and affect the precision of the
calculation of kinetic parameters. Thus, in this study, the curing process was observed using
the epoxide absorption at 915 cm-1 (Fig. 6-1(b)). The signal reduction at 915 cm-1 shows the
consumption of epoxy groups. The spectra were normalized to the reference absorption at 1184
cm-1(not shown) that represents the C-C stretch at bisphenol 30.

123
Fig. 6-1 FTIR spectra obtained at different times for BiF-Aliph sample cured at 100°C.
(a) Spectrum from 4000-3000 cm-1, (b) Spectrum from 1000-500 cm-1
DSC is another useful technique for studying crosslinking reactions of thermosetting epoxy
resins. Each non-isothermal curve can provide onset cure temperature, Tonset, peak cure
temperature, Tp, Tg, percentage of conversion at peak-temperature and total reaction heat, △H.
The Tonset and Tp were both extrapolated temperature at heating rate=0. Table 6-2 showed the
influence of solvent (DMF or water) and NCFs on curing behaviours.
In the blank resins (without fibre and solvent), WD systems have higher Tg and △H than BiF
systems but both △H of blank resins falls in the typical range (100-118 kJ/mol), which is close
to the heat of epoxy ring opening 31. After the addition of DMF, Tonset and Tp were increased in
both BiF/Aliph and BiF/Arom systems but the addition of water decreased Tonset and Tp in
WD/Aliph and WD/Arom systems. This indicates DMF retards the reactions, but water acts as
a catalyst. Some research also indicated that the time of Tp was delayed and heat of reaction
decreased due to the addition of solvents, like acetone, tetrahydrofuran, as well as toluene in
an open system 32-33. The cure reaction was significantly accelerated with the addition of 3%
of water, which catalyzed the reaction of primary amines with epoxides to form secondary
amines 32-33.
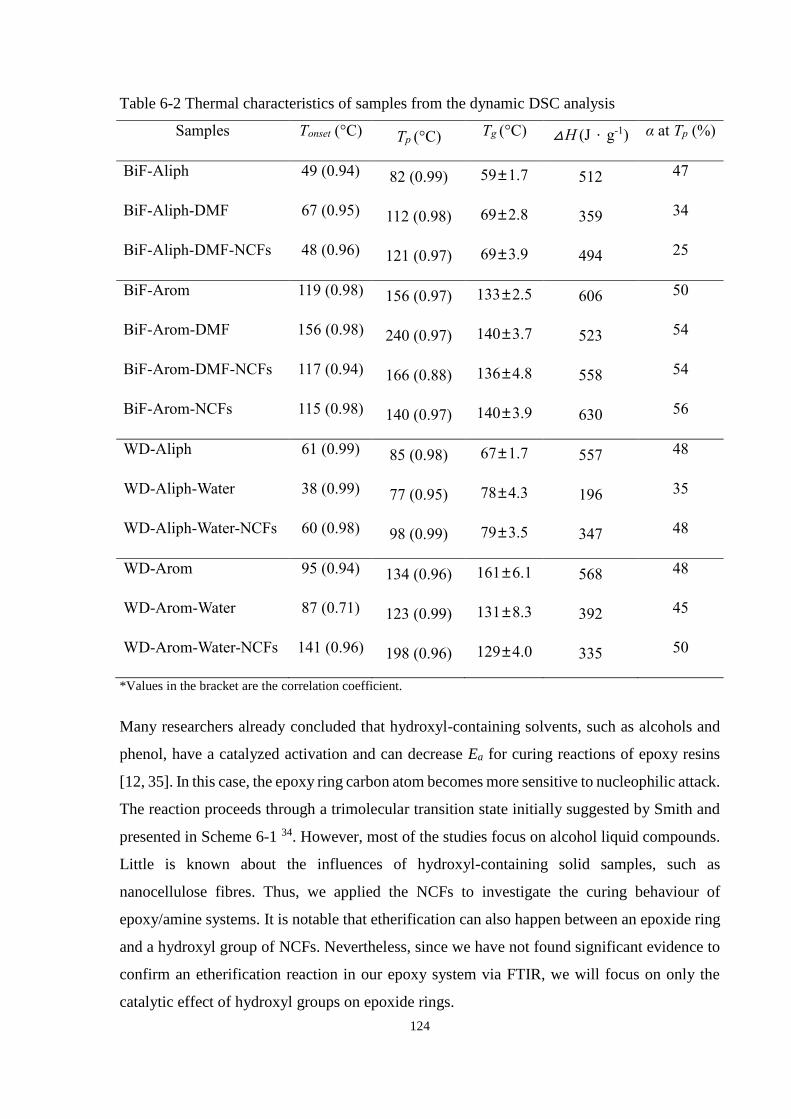
124
Table 6-2 Thermal characteristics of samples from the dynamic DSC analysis
Samples Tonset (°C) Tp (°C) Tg (°C) △H (J.g-1) α at Tp (%)
BiF-Aliph 49 (0.94) 82 (0.99) 59±1.7 512 47
BiF-Aliph-DMF 67 (0.95) 112 (0.98) 69±2.8 359 34
BiF-Aliph-DMF-NCFs 48 (0.96) 121 (0.97) 69±3.9 494 25
BiF-Arom 119 (0.98) 156 (0.97) 133±2.5 606 50
BiF-Arom-DMF 156 (0.98) 240 (0.97) 140±3.7 523 54
BiF-Arom-DMF-NCFs 117 (0.94) 166 (0.88) 136±4.8 558 54
BiF-Arom-NCFs 115 (0.98) 140 (0.97) 140±3.9 630 56
WD-Aliph 61 (0.99) 85 (0.98) 67±1.7 557 48
WD-Aliph-Water 38 (0.99) 77 (0.95) 78±4.3 196 35
WD-Aliph-Water-NCFs 60 (0.98) 98 (0.99) 79±3.5 347 48
WD-Arom 95 (0.94) 134 (0.96) 161±6.1 568 48
WD-Arom-Water 87 (0.71) 123 (0.99) 131±8.3 392 45
WD-Arom-Water-NCFs 141 (0.96) 198 (0.96) 129±4.0 335 50
*Values in the bracket are the correlation coefficient.
Many researchers already concluded that hydroxyl-containing solvents, such as alcohols and
phenol, have a catalyzed activation and can decrease Ea for curing reactions of epoxy resins
[12, 35]. In this case, the epoxy ring carbon atom becomes more sensitive to nucleophilic attack.
The reaction proceeds through a trimolecular transition state initially suggested by Smith and
presented in Scheme 6-1 34. However, most of the studies focus on alcohol liquid compounds.
Little is known about the influences of hydroxyl-containing solid samples, such as
nanocellulose fibres. Thus, we applied the NCFs to investigate the curing behaviour of
epoxy/amine systems. It is notable that etherification can also happen between an epoxide ring
and a hydroxyl group of NCFs. Nevertheless, since we have not found significant evidence to
confirm an etherification reaction in our epoxy system via FTIR, we will focus on only the
catalytic effect of hydroxyl groups on epoxide rings.
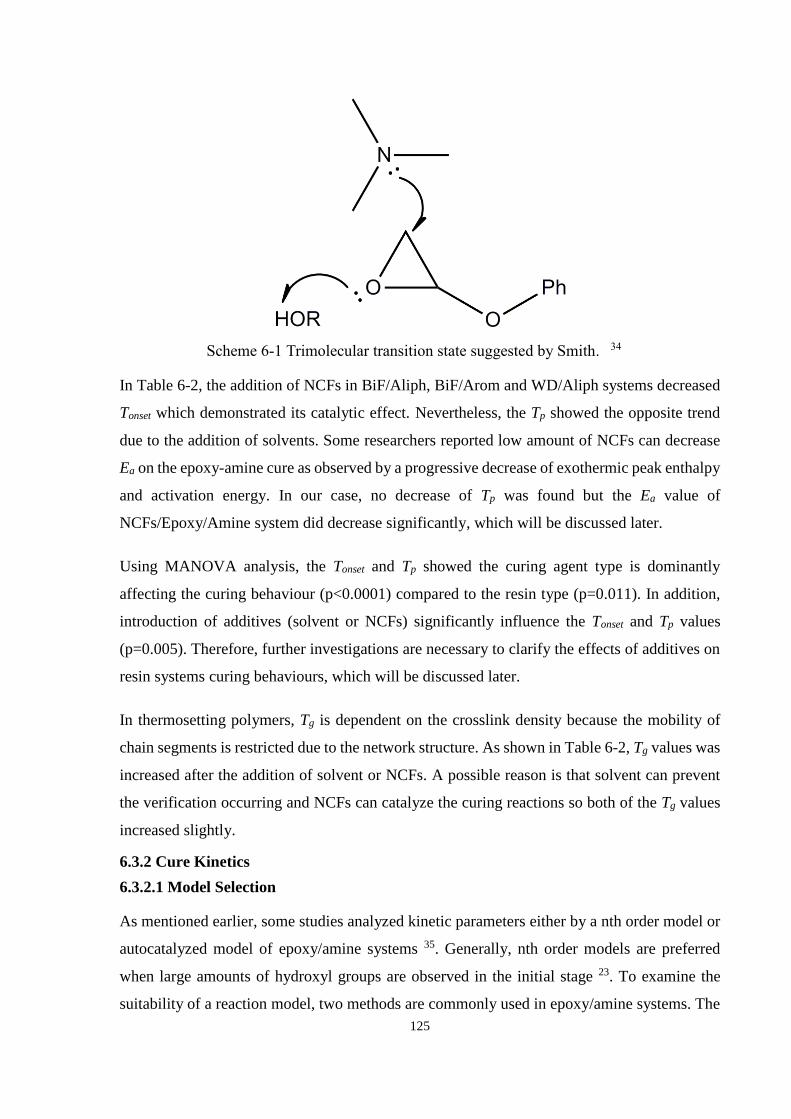
125
Scheme 6-1 Trimolecular transition state suggested by Smith. 34
In Table 6-2, the addition of NCFs in BiF/Aliph, BiF/Arom and WD/Aliph systems decreased
Tonset which demonstrated its catalytic effect. Nevertheless, the Tp showed the opposite trend
due to the addition of solvents. Some researchers reported low amount of NCFs can decrease
Ea on the epoxy-amine cure as observed by a progressive decrease of exothermic peak enthalpy
and activation energy. In our case, no decrease of Tp was found but the Ea value of
NCFs/Epoxy/Amine system did decrease significantly, which will be discussed later.
Using MANOVA analysis, the Tonset and Tp showed the curing agent type is dominantly
affecting the curing behaviour (p<0.0001) compared to the resin type (p=0.011). In addition,
introduction of additives (solvent or NCFs) significantly influence the Tonset and Tp values
(p=0.005). Therefore, further investigations are necessary to clarify the effects of additives on
resin systems curing behaviours, which will be discussed later.
In thermosetting polymers, Tg is dependent on the crosslink density because the mobility of
chain segments is restricted due to the network structure. As shown in Table 6-2, Tg values was
increased after the addition of solvent or NCFs. A possible reason is that solvent can prevent
the verification occurring and NCFs can catalyze the curing reactions so both of the Tg values
increased slightly.
6.3.2 Cure Kinetics
6.3.2.1 Model Selection
As mentioned earlier, some studies analyzed kinetic parameters either by a nth order model or
autocatalyzed model of epoxy/amine systems 35. Generally, nth order models are preferred
when large amounts of hydroxyl groups are observed in the initial stage 23. To examine the
suitability of a reaction model, two methods are commonly used in epoxy/amine systems. The
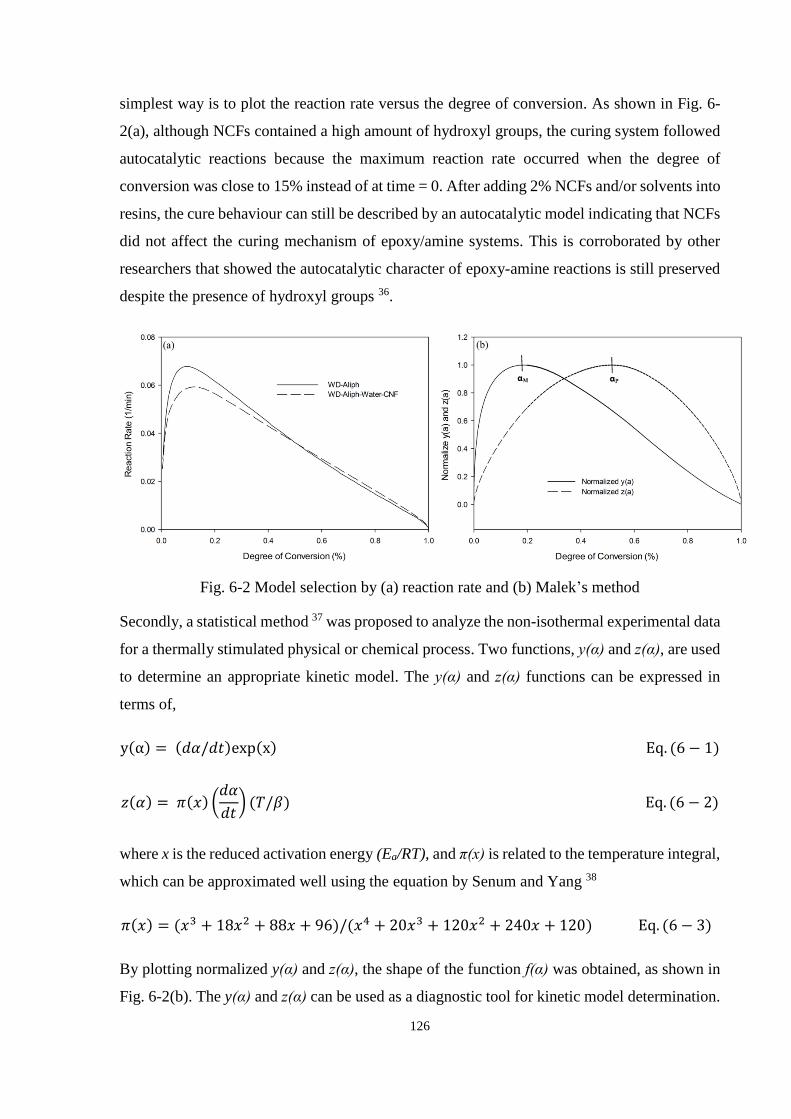
126
simplest way is to plot the reaction rate versus the degree of conversion. As shown in Fig. 6-
2(a), although NCFs contained a high amount of hydroxyl groups, the curing system followed
autocatalytic reactions because the maximum reaction rate occurred when the degree of
conversion was close to 15% instead of at time = 0. After adding 2% NCFs and/or solvents into
resins, the cure behaviour can still be described by an autocatalytic model indicating that NCFs
did not affect the curing mechanism of epoxy/amine systems. This is corroborated by other
researchers that showed the autocatalytic character of epoxy-amine reactions is still preserved
despite the presence of hydroxyl groups 36.
Fig. 6-2 Model selection by (a) reaction rate and (b) Malek’s method
Secondly, a statistical method 37 was proposed to analyze the non-isothermal experimental data
for a thermally stimulated physical or chemical process. Two functions, y(α) and z(α), are used
to determine an appropriate kinetic model. The y(α) and z(α) functions can be expressed in
terms of,
y(α) = (𝑑𝛼/𝑑𝑡)exp(x) Eq. (6 − 1)
𝑧(𝛼) = 𝜋(𝑥) (𝑑𝛼
𝑑𝑡) (𝑇/𝛽) Eq. (6 − 2)
where x is the reduced activation energy (Ea/RT), and π(x) is related to the temperature integral,
which can be approximated well using the equation by Senum and Yang 38
𝜋(𝑥) = (𝑥3 + 18𝑥2 + 88𝑥 + 96)/(𝑥4 + 20𝑥3 + 120𝑥2 + 240𝑥 + 120) Eq. (6 − 3)
By plotting normalized y(α) and z(α), the shape of the function f(α) was obtained, as shown in
Fig. 6-2(b). The y(α) and z(α) can be used as a diagnostic tool for kinetic model determination.

127
The y(α) function has a maximum αM ≠0 and the z(α) has a maximum at αP =0.51. Based on
the selection guide 37, the empirical SB model and JMA model (exponent >1) can give the best
description of the data.
6.3.2.2 Isothermal Versus Constant Heating Rate Run
Diffusion control affects the calculation of kinetic parameters because it will increase the Ea
value which is assumed to be constant. As in many thermosetting polymers, diffusion and
vitrification occur in epoxy systems. Performing the analysis with a constant heating rate can
improve segment mobility, which lessens the effect of these phenomena. In Fig. 6-3, both
isothermal and dynamic modes were used to determine when the systems become diffusion
controlled by observing the onset of curve from linear to nonlinear. When the reaction
temperature is isothermal, the onset of diffusion control occurred at 30 - 40 % degree of
conversion, but in dynamic mode at 80 - 90 % of conversion. Thus, in the following kinetic
study, we used a non-isothermal analysis to determine the kinetic parameters to avoid the
influence from diffusion.
Fig. 6-3 Onset of diffusion control, w= 𝑙𝑛[(𝑑𝛼/𝑑𝑡)/(1 − 𝛼)𝑛 − 𝑘1]
6.3.2.3 The Kissinger Method
Among the various multiple heating rate methods, Kissinger equation is the most extensively
used method to calculate the activation energy. Based on the Kissinger equation for BiF/Aliph
and BiF/Arom systems, the Ea for the blank epoxy resins (without solvent and fibre) was 41.0
and 52.0 kJ/mol, which fell in the typical range of Ea for common epoxy-amine polymerization
systems (40–70 kJ/mol) 39. The addition of DMF only caused negligible effects on the Ea value,
44.3 and 50.5 kJ/mol, because DMF is a polar aprotic solvent which have good dielectric

128
constants and polarity and won’t form the solvent shell. The ring-opening mechanism of
epoxy/amine systems follows certain type of SN2 mechanism and DMF is commonly applied
in SN2 reactions to provide a naked nucleophile. Also, the catalyst effect of NCFs in terms of
providing proton will not be affected by the solvent.
Furthermore, the activation energy was dramatically affected by the addition of NCFs. After
the addition of NCFs, the Ea values of NCFs composites (40.3 and 37.6 kJ/mol) dropped lower
than the blank epoxy composites, which again reveals the catalytic influence of NCFs. When
compared to the NCFs in the neat system, DMF-NCFs can decrease the Ea values even more.
A possible reason is DMF may stabilize the trimolecular transition state mentioned before.
For water dispersible systems, the Ea for the blank WD resins (without solvent and fibre) was
44.8 and 35.4 kJ/mol, respectively. After adding water into the resin systems, the Ea value
dramatically decreased because water is an ideal proton provider to decrease the Ea value (29.1
kJ/mol) and also water can emulsify the resins and trap the resins and curing agent in a restricted
volume which sped up the reaction rate in early stage but reduced the efficiency in the later
stage. However, for the WD/Arom system, the activation energy increased by approximately
50 % which may be caused by the aromatic amine not being compatible with the water. Water
is a stronger catalyst than NCFs so the influence of NCFs became negligible in WD systems.
Therefore, the Ea of the BiF system decreased by adding NCFs and the Ea of WD systems
decreased by adding water.

129
Table 6-3 Cure kinetics parameters by Kissinger Eq. and Sestak-Berggren empirical Eq.
Kissinger Eq. Sestak-Berggren empirical Eq.
Samples Ea (kJ/mol) A (s-1) k (s-1) m n overall
BiF-Aliph 41.0 1.69E+03 2.99E-03 0.70 0.81 1.51
BiF-Aliph-DMF 44.3 2.04E+03 1.25E-03 0.44 0.83 1.27
BiF-Aliph-DMF-NCFs 40.3 3.87E+02 8.60E-04 0.42 0.78 1.20
BiF-Arom 52.0 2.75E+03 4.34E-04 0.72 0.60 1.32
BiF-Arom-DMF 50.5 4.71E+02 1.44E-04 0.88 1.11 1.99
BiF-Arom-DMF-NCFs 37.6 2.41E+01 2.91E-04 0.75 0.58 1.33
BiF-Arom-NCFs 44.0 4.13E+02 7.25E-04 0.97 0.83 1.80
WD-Aliph 44.8 6.99E+03 3.63E-03 0.63 0.66 1.29
WD-Aliph-Water 29.1 3.95E+01 3.27E-03 0.45 1.13 1.58
WD-Aliph-Water-NCFs 37.3 4.60E+02 2.69E-03 0.67 0.96 1.63
WD-Arom 35.4 4.88E+01 1.14E-03 0.62 0.67 1.29
WD-Arom-Water 54.0 1.69E+04 1.46E-03 0.67 0.53 1.20
WD-Arom-Water-NCFs 51.2 4.11E+02 8.25E-05 0.73 0.60 1.33
6.3.2.4 Model Free Method - Kissinger-Akahira-Sunose Method
The limitations of the Kissinger equation include that the reaction mechanism is assumed to be
nth order and the reaction kinetics follows single-step kinetic. Considering that the real Ea value
depends upon the conversion rate, the KAS equation was applied to observe the evolution of
the Ea value with conversion rate. Note that compared to the Ozawa–Flynn–Wall method, the
KAS method offers a significant improvement in the accuracy of the Ea value 40.
Fig. 6-4 exhibits the Ea at the different curing conversion α, determined by the KAS method
for non-isothermal data. It is noteworthy that the Ea of blank resins varies in a narrow range of
3.4 kJ/mol with respect to α, compared to the Ea range when solvent and NCFs are introduced.
The thermal curve also showed that the peaks in four blank resins are symmetric and uniformly
spaced which implied that the Ea values are constant. In addition, the constant Ea values implied
that the diffusion control had negligible influence on non-isothermal data of the blank resins.
Even though the influence of diffusion control in non-isothermal data started from 80-90 %
conversion by observing the onset of curve from linear to nonlinear, the transition from
chemical to diffusion control is very gradual in the KAS method.
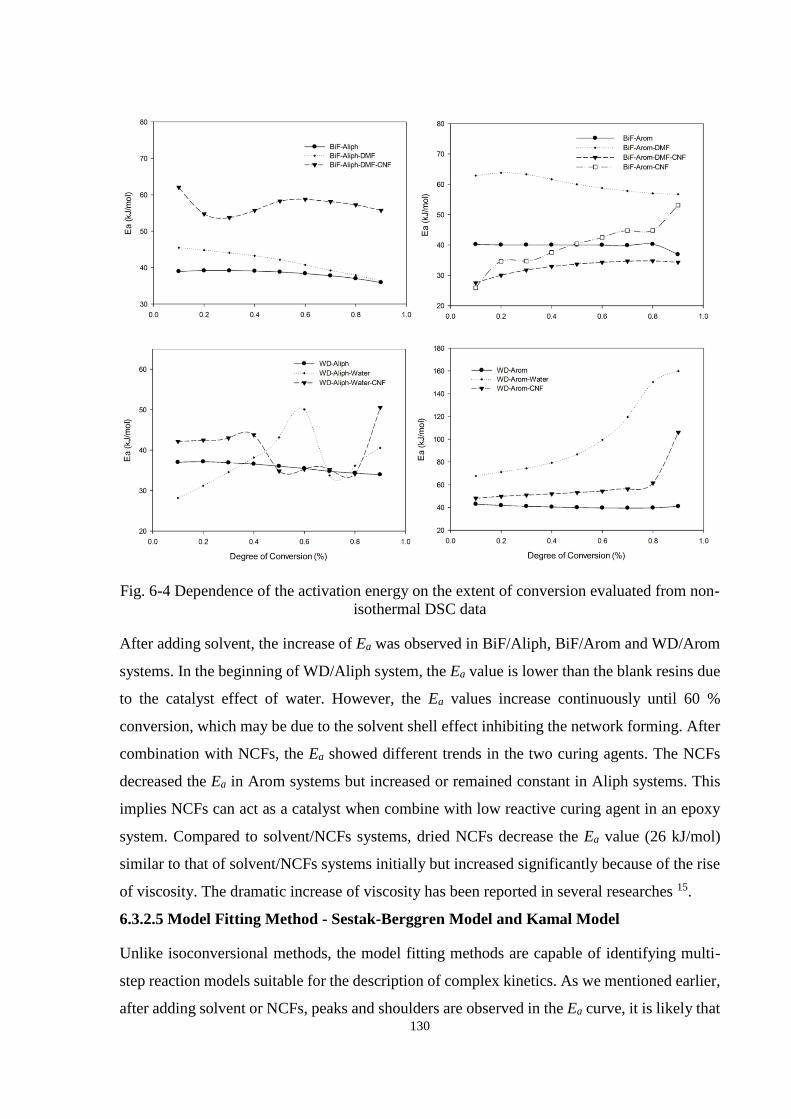
130
Fig. 6-4 Dependence of the activation energy on the extent of conversion evaluated from non-
isothermal DSC data
After adding solvent, the increase of Ea was observed in BiF/Aliph, BiF/Arom and WD/Arom
systems. In the beginning of WD/Aliph system, the Ea value is lower than the blank resins due
to the catalyst effect of water. However, the Ea values increase continuously until 60 %
conversion, which may be due to the solvent shell effect inhibiting the network forming. After
combination with NCFs, the Ea showed different trends in the two curing agents. The NCFs
decreased the Ea in Arom systems but increased or remained constant in Aliph systems. This
implies NCFs can act as a catalyst when combine with low reactive curing agent in an epoxy
system. Compared to solvent/NCFs systems, dried NCFs decrease the Ea value (26 kJ/mol)
similar to that of solvent/NCFs systems initially but increased significantly because of the rise
of viscosity. The dramatic increase of viscosity has been reported in several researches 15.
6.3.2.5 Model Fitting Method - Sestak-Berggren Model and Kamal Model
Unlike isoconversional methods, the model fitting methods are capable of identifying multi-
step reaction models suitable for the description of complex kinetics. As we mentioned earlier,
after adding solvent or NCFs, peaks and shoulders are observed in the Ea curve, it is likely that
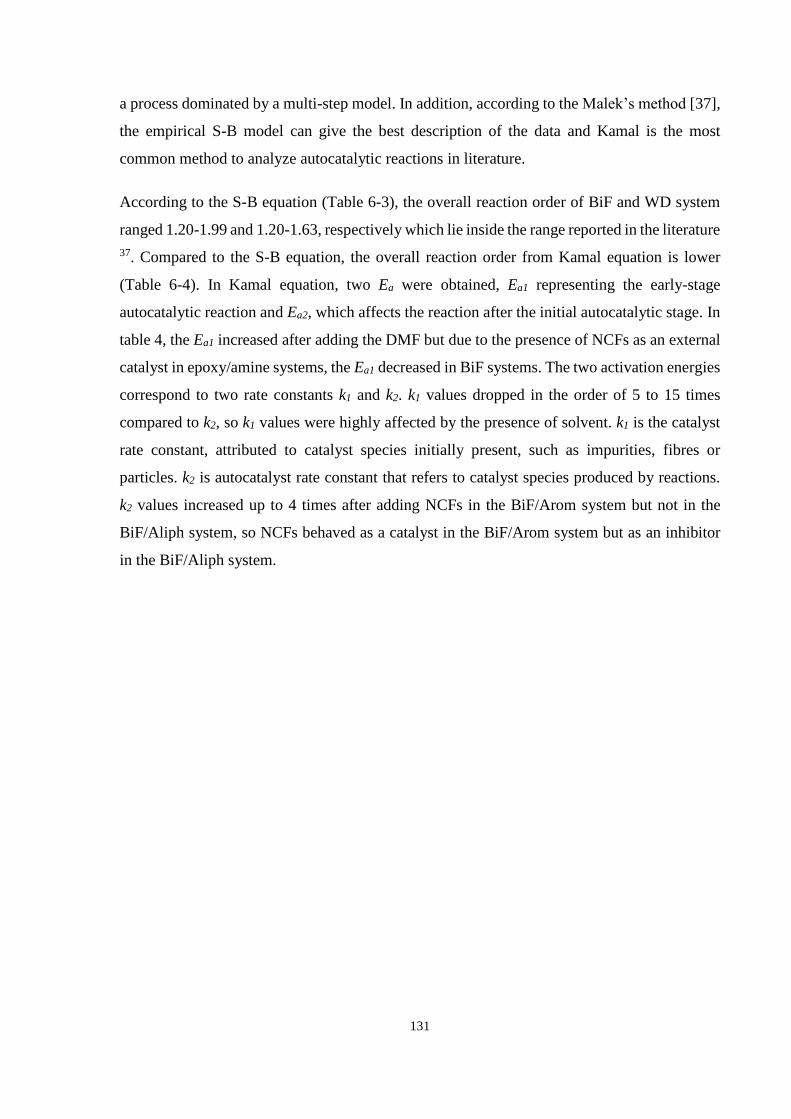
131
a process dominated by a multi-step model. In addition, according to the Malek’s method [37],
the empirical S-B model can give the best description of the data and Kamal is the most
common method to analyze autocatalytic reactions in literature.
According to the S-B equation (Table 6-3), the overall reaction order of BiF and WD system
ranged 1.20-1.99 and 1.20-1.63, respectively which lie inside the range reported in the literature
37. Compared to the S-B equation, the overall reaction order from Kamal equation is lower
(Table 6-4). In Kamal equation, two Ea were obtained, Ea1 representing the early-stage
autocatalytic reaction and Ea2, which affects the reaction after the initial autocatalytic stage. In
table 4, the Ea1 increased after adding the DMF but due to the presence of NCFs as an external
catalyst in epoxy/amine systems, the Ea1 decreased in BiF systems. The two activation energies
correspond to two rate constants k1 and k2. k1 values dropped in the order of 5 to 15 times
compared to k2, so k1 values were highly affected by the presence of solvent. k1 is the catalyst
rate constant, attributed to catalyst species initially present, such as impurities, fibres or
particles. k2 is autocatalyst rate constant that refers to catalyst species produced by reactions.
k2 values increased up to 4 times after adding NCFs in the BiF/Arom system but not in the
BiF/Aliph system, so NCFs behaved as a catalyst in the BiF/Arom system but as an inhibitor
in the BiF/Aliph system.

132
Table 6-4 Cure kinetics parameters by Kamal Equation
Samples
Ea1 Ea2 k1 k2
m n Overall (kJ/mol) (s-1)
BiF-Aliph 83.72 14.82 6.73E-03 1.20E+00 0.59 0.60 1.19
BiF-Aliph-DMF 86.54 18.00 5.33E-04 1.13E+00 0.41 0.45 0.86
BiF-Aliph-DMF-NCFs 80.03 67.18 1.42E-04 7.41E-02 0.49 0.48 0.97
BiF-Arom 67.54 69.13 2.43E-04 8.32E-02 0.57 0.49 1.06
BiF-Arom-DMF 113.40 49.49 7.03E-06 4.18E-02 0.60 0.51 1.11
BiF-Arom-DMF-NCFs 65.11 32.14 2.54E-04 1.26E-01 0.65 0.55 1.20
BiF-Arom-NCFs 62.05 31.59 1.34E-04 3.37E-02 0.69 0.66 1.35
WD-Aliph 90.80 27.94 6.39E-03 6.42E-01 0.56 0.49 1.05
WD-Aliph-Water 25.70 58.36 4.63E-03 2.04E+00 0.66 0.61 1.27
WD-Aliph-Water-NCFs 95.96 45.33 5.24E-03 1.17E+00 0.52 0.55 1.07
WD-Arom 88.78 46.22 7.21E-04 3.03E-01 0.52 0.48 1.00
WD-Arom-Water 136.01 57.02 5.75E-03 3.55E-01 0.53 0.61 1.14
WD-Arom-Water-NCFs 107.91 49.66 3.54E-06 2.86E-02 0.59 0.50 1.09
6.3.2.6 Prediction of Conversion
An important aim of this study was to predict the curing behaviour for epoxy resins. After
obtaining the values of kinetic parameters, we plotted the predicted rate curve for the different
systems in supplementary materials. The S-B model better fitted the experimental data,
especially at low conversion rates. However, due to solvent evaporation, blank epoxy/amine
systems are accurately predicted compare to solvent and NCFs systems. By comparison, the
reaction rate predicted by the S-B model is in good accordance with the experimental rate,
which substantiates that the S-B model is able to give the reliable kinetic rate for describing
the advancement of non-isothermal reactions.
Vyazokin and Lesnikovich 41 proposed a model-free method to predict the isothermal kinetics
from non-isothermal data. The method uses the following equations,
𝑔(𝛼) = 𝑡𝛼𝐴𝛼𝑒𝑥𝑝(−𝐸𝑎/𝑅𝑇0) Eq. (6 − 4)
𝑔(𝛼) = (𝐴𝛼 /𝛽) ∫ 𝑒𝑥𝑝𝑇𝛼
𝑇0
(−𝐸𝑎/𝑅𝑇)𝑑𝑇 Eq. (6 − 5)
133
Eq. (6-4) and (6-5) stand for isothermal cure at Tc=T0 and non-isothermal cure at heating rate
β, respectively. To obtain tα, Eq. (6-6) can be divided by Eq. (6-5).
tα = [∫ expTα
T0
(−𝐸𝑎/𝑅𝑇)dT] /βexp(−𝐸𝑎/𝑅𝑇0) Eq. (6 − 6)
Eq. (6-6) enables one to determine the time at a given conversion. Fig. 6-5 showed the
isothermal epoxy cure at 140 and 170 °C as predicted by using the Ea dependence derived
earlier. We can see the model prediction using the KAS method gave satisfactory agreement
with the experimental isothermal measurements before 80% conversion rate.
Fig. 6-5 Model-free prediction of isothermal cure at 140°C and 170 °C from KAS method.
(The experimental data are shown by line. The points correspond to the predicted time.)

134
6.4 Summary
The curing kinetics of four resins systems (BiF/Aliph, BiF/Arom, WD/Aliph and WD/Arom)
in the presence of diluents (DMF and water) and NCFs were examined by DSC. The evolution
of the maximum reaction rates revealed that the autocatalytic model is better suited than the
nth order model to describe the kinetic behaviour of the resin systems. Also, the non-isothermal
data can avoid the influence of diffusion control. The Ea values derived from the Kissinger
equation, KAS equation and the Kamal equation decreased in the presence of NCFs. However,
the opposite was observed after the addition of DMF. In other words, the catalyst effect of
NCFs was observed in bisphenol F systems; but, no catalytic effect of NCFs was observed in
water-diluable systems because the presence of water dramatically decreased the Ea value in
WD/Aliph systems. Compared to Kamal model, the S–B model was in better agreement with
the experimental data. In addition, the model-free approach could provide the isothermal curing
time of the epoxy system with NCFs addition.

135
References
1. Q. Cheng, S. Q. Wang, T. G. Rials and S. H. Lee, Cellulose, 2007, 14, 593-602.
2. J. Lu, T. Wang and L. T. Drzal, Compos Part a-Appl S, 2008, 39, 738-746.
3. A. N. Nakagaito, A. Fujimura, T. Sakai, Y. Hama and H. Yano, Compos Sci Technol,
2009, 69, 1293-1297.
4. M. Sain and K. Oksman, Cellulose Nanocomposites: Processing, Characterization, and
Properties, 2006, 938, 2-8.
5. G. Siqueira, J. Bras and A. Dufresne, Biomacromolecules, 2009, 10, 425-432.
6. M. Henriksson and L. A. Berglund, J Appl Polym Sci, 2007, 106, 2817-2824.
7. S. Iwamoto, A. N. Nakagaito and H. Yano, Appl Phys a-Mater, 2007, 89, 461-466.
8. A. N. Nakagaito and H. Yano, Cellulose, 2008, 15, 323-331.
9. M. O. Seydibeyoglu and K. Oksman, Compos Sci Technol, 2008, 68, 908-914.
10. Y. Shimazaki, Y. Miyazaki, Y. Takezawa, M. Nogi, K. Abe, S. Ifuku and H. Yano,
Biomacromolecules, 2007, 8, 2976-2978.
11. A. M. Intelligence, Global Epoxy Resin Market By Application & Geography – Forecasts
up to 2017, 2012.
12. A. Sbiai, A. Maazouz, E. Fleury, H. Sautereau and H. Kaddami, Bioresources, 2010, 5,
672-689.
13. J. E. Ehlers, N. G. Rondan, L. K. Huynh, H. Pham, M. Marks and T. N. Truong,
Macromolecules, 2007, 40, 4370-4377.
14. N. E. Marcovich, M. L. Auad, N. E. Bellesi, S. R. Nutt and M. I. Aranguren, J Mater Res,
2006, 21, 870-881.
15. C. Gousse, H. Chanzy, M. L. Cerrada and E. Fleury, Polymer, 2004, 45, 1569-1575.
16. M. Tizzotti, A. Charlot, E. Fleury, M. Stenzel and J. Bernard, Macromol Rapid Comm,
2010, 31, 1751-1772.
17. M. M. Ruiz, J. Y. Cavaille, A. Dufresne, C. Graillat and J. F. Gerard, Macromol Symp,
2001, 169, 211-222.
18. S. Noorani, J. Simonsen and S. Atre, Cellulose, 2007, 14, 577-584.
19. S. Fujisawa, Y. Okita, T. Saito, E. Togawa and A. Isogai, Cellulose, 2011, 18, 1191-1199.
20. A. N. Netravali, X. Huang and K. Mizuta, Adv Compos Mater, 2007, 16, 269-282.
21. R. Masoodi, R. F. El-Hajjar, K. M. Pillai and R. Sabo, Mater Design, 2012, 36, 570-576.
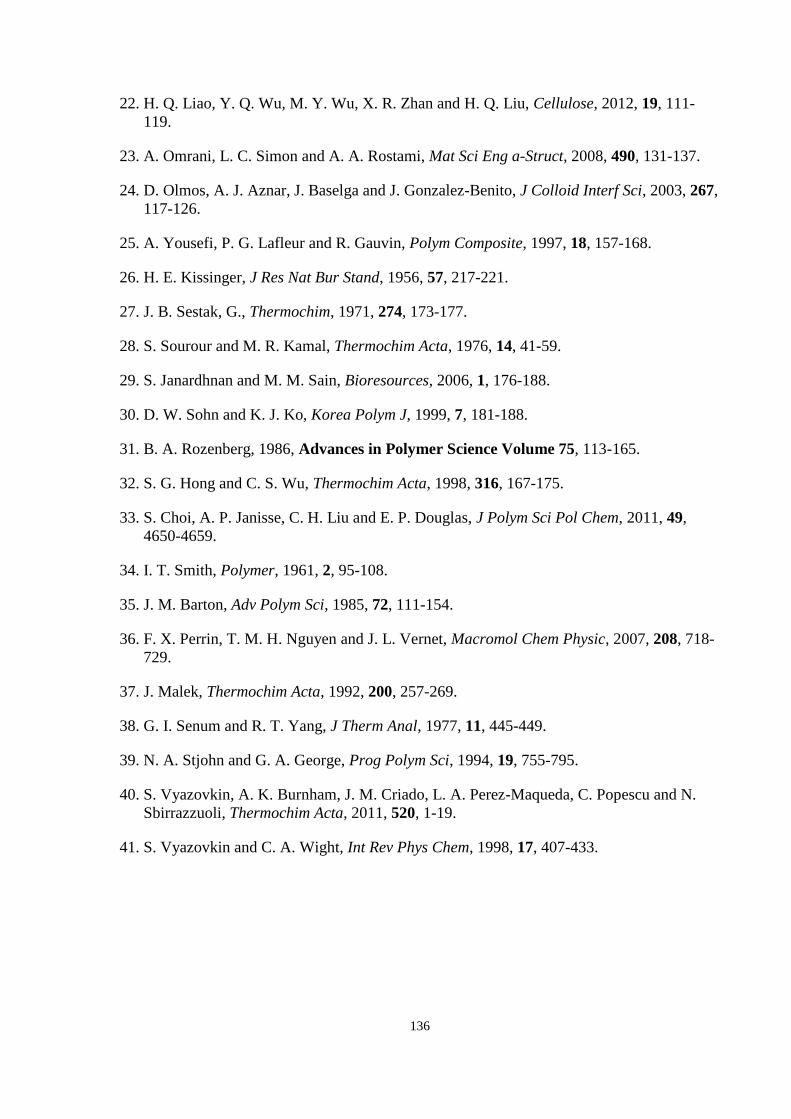
136
22. H. Q. Liao, Y. Q. Wu, M. Y. Wu, X. R. Zhan and H. Q. Liu, Cellulose, 2012, 19, 111-
119.
23. A. Omrani, L. C. Simon and A. A. Rostami, Mat Sci Eng a-Struct, 2008, 490, 131-137.
24. D. Olmos, A. J. Aznar, J. Baselga and J. Gonzalez-Benito, J Colloid Interf Sci, 2003, 267,
117-126.
25. A. Yousefi, P. G. Lafleur and R. Gauvin, Polym Composite, 1997, 18, 157-168.
26. H. E. Kissinger, J Res Nat Bur Stand, 1956, 57, 217-221.
27. J. B. Sestak, G., Thermochim, 1971, 274, 173-177.
28. S. Sourour and M. R. Kamal, Thermochim Acta, 1976, 14, 41-59.
29. S. Janardhnan and M. M. Sain, Bioresources, 2006, 1, 176-188.
30. D. W. Sohn and K. J. Ko, Korea Polym J, 1999, 7, 181-188.
31. B. A. Rozenberg, 1986, Advances in Polymer Science Volume 75, 113-165.
32. S. G. Hong and C. S. Wu, Thermochim Acta, 1998, 316, 167-175.
33. S. Choi, A. P. Janisse, C. H. Liu and E. P. Douglas, J Polym Sci Pol Chem, 2011, 49,
4650-4659.
34. I. T. Smith, Polymer, 1961, 2, 95-108.
35. J. M. Barton, Adv Polym Sci, 1985, 72, 111-154.
36. F. X. Perrin, T. M. H. Nguyen and J. L. Vernet, Macromol Chem Physic, 2007, 208, 718-
729.
37. J. Malek, Thermochim Acta, 1992, 200, 257-269.
38. G. I. Senum and R. T. Yang, J Therm Anal, 1977, 11, 445-449.
39. N. A. Stjohn and G. A. George, Prog Polym Sci, 1994, 19, 755-795.
40. S. Vyazovkin, A. K. Burnham, J. M. Criado, L. A. Perez-Maqueda, C. Popescu and N.
Sbirrazzuoli, Thermochim Acta, 2011, 520, 1-19.
41. S. Vyazovkin and C. A. Wight, Int Rev Phys Chem, 1998, 17, 407-433.

137

138
Chapter 7 Using Nanocellulose Fibres to Develop a High
Performance Blended Petro-Epoxy/Bio-Epoxy Composite
Abstract
In order to develop a strong and ductile bio-based nanocomposite, the present chapter
incorporates 25 wt.% nanocellulose fibres (NCFs) and 10-30 wt.% bio-epoxy monomer (E-
epoxy) into commercial epoxy resin and outlines its mechanical and thermal characterization.
With 10% E-epoxy, the toughness of neat epoxy resins improved 84 %; after embedding NCFs,
the tensile strength and modulus of composites increased approximately twofold and fourfold,
respectively. In a nitrogen environment, the maximum degradation peak of the P-epoxy
composites was detected 24 °C higher than that of neat P-epoxy. The morphological analyses
demonstrated that both P-epoxy and E-epoxy fully covered the NCFs, indicating a superior
interface between them. The average of fibre cluster diameters in commercial resin composites
was significantly larger than that in E-epoxy composites, indicating that E-epoxy can better
penetrate into the NCFs clusters, and form a strong bond with the reinforcements. Thus, this
study provides a unique combination (E-epoxy/P-epoxy/NCFs) of superior mechanical
performance, high thermal stability, and good environmental sustainability.

139
7.1 Introduction
Deriving chemicals from bio-resources is an inevitable trend since the issue of future petroleum
shortage is pressing. Many studies have reported new building blocks to replace conventional
polymers1-2. One current academic research interest concerns substituting BPA with natural
compounds, such as saccharides,3, vegetable oils4, polyphenols5, lignin6 and liquefied
biomass7. BPA is the raw material for epoxy resins and polycarbonates, and has potential risks
to human health8. Currently, the available commercial bio-based epoxy resins include sorbitol
polyglycidyl ether (DENACOL™ and ERISYSTM) and oil-based epoxy resins (Vikoflex®,
Super Sap™, and Senso™). Although many bio-based epoxies seem promising, owing to their
sustainability, their mechanical properties are inadequate for the high-performance material
industry.
In order to address this issue, introducing high strength reinforcements into the epoxy resins is
the most common approach. In conjunction with the concept of green materials, NCFs emerged
as the most promising bio-fibre to enhance the mechanical properties of the matrix. NCFs are
renewable, lightweight, cost-effective, have high aspect ratio, and high specific
strength/modulus (100-160 GPa9), and can be obtained from various resources, such as algae10,
tunicate11, bacteria12, agricultural residuals13, and wood14. Beyond these features, previous
studies indicate that NCFs can shorten the curing process of epoxy resins,15 and that their
mildly-acidic surface shows potential to react with amine type epoxy curing agents16. Thus,
NCFs can be an ideal reinforcement for epoxy systems.
However, due to the high viscosity of NCFs suspension, most studies17-19 add low
concentrations of NCFs into epoxy matrices, which result in a limited improvement on
mechanical performance20-22. To increase the fibre loading, Yano's and Berglund's research
teams applied NCFs paper into epoxy resins, which significantly improved the mechanical
performance of P-epoxy23-24. In addition, several studies used silane25, titanate25, and (2,2,6,6-
tetramethylpiperidin-1-yl) oxyl (TEMPO)18 to pretreat fibres in order to improve the
mechanical performance of P-epoxy. However, the use of NCFs in bio-epoxy resins is hardly
found,18 and to the best of our knowledge, no mechanical improvement of NCFs/bio-based
epoxy is reported. Furthermore, no effect of NCFs on blended P-epoxy/E-epoxy system was
ever investigated.

140
The major advantage of using a resin blend system is its increased toughness compared to
conventional epoxy resins, because the added monomer may reduce the crosslinking density
by inserting into the initial repeating units, or they may form a second network that can create
phase separation. Furthermore, the presence of polar groups in the second phase monomer can
significantly improve the adhesion properties of epoxy resins26. Previous studies indicate that
bio-epoxy resins can improve toughness and adhesion properties27-28. Among all the bio-epoxy
resins, the E-epoxy presents low cost, high mechanical performance, high thermal resistance,
and contains significant amounts of hydroxyls29, as a potentially inexpensive alternative epoxy
resin system. Therefore, the potential impact of adding E-epoxy is a new field requiring more
detailed investigations.
The aim of this chapter is to better understand the reinforcement effect of NCFs on an
epoxy/bio-epoxy blend system. The curing behaviour of both epoxy resins was studied by
differential scanning calorimetry (DSC). The interface between fibre/matrix and fibre
diameters were investigated using a scanning electron microscope (SEM), and the mechanical
property was evaluated using a universal tester. The thermal stabilities of neat resins and
composites were further analyzed using thermogravimetric analysis (TGA).
7.2 Materials and Methods
7.2.1 Materials
NCFs and E-epoxy monomer were both lab-made, and more information regarding preparation
and characterization has been reported elsewhere29-30. Note that the NCF used in this study is
non-acid hydrolyzed cellulose, which is more flexible to form physical entanglements than
nanocellulose whiskers. The commercial epoxy monomer, Epon Resin 863, was used as a
control sample, and its epoxy equivalent weight is 165 - 173 g/eq. Epikure W was applied to
cure epoxy monomer, and its major component is diethylmethylbenzenediamine (DETDA).
The epoxy monomer and the curing agent were obtained from Momentive Specialty Chemicals,
OH, USA. Acetone (> 99.5%) was purchased from Caledon Laboratory Chemicals, ON,
Canada.
7.2.2 Methods
7.2.2.1 NCFs Paper Preparation
10.7g gel-state NCFs (2.5 wt. %) was diluted to reach 0.1 wt. % concentration, and bubbles
were removed from the solution using an ultrasonic bath. To form a paper shape, the suspension
was vacuum-filtered through a Supor-100 membrane filter (pore size = 0.1 µm, Pall

141
Corporation) in a Buchner funnel. After filtration, the wet films were carefully removed from
the membrane, and wet-pressed following a standard paper-drying process. Briefly, the wet
film was placed between two filter membranes and compressed by a dryer with pressure of
approximately 50 psi for seven minutes. The NCFs paper was then removed from the
membrane, and dried in the oven (DNCF) or immersed in acetone overnight (SNCF) in order
to remove all the water, prior to the composite preparation.
7.2.2.2 Composite Preparation
The sample compositions are listed in Table 7-1. All the samples were cut into a dog-bone
shape for tensile testing (ASTMD 638-5) from the DNCF and SNCF and were immersed in
epoxy resins overnight. To reduce the viscosity of the epoxy resins, the mixture of the resin
monomer/curing agent was diluted with acetone. Next, the samples were removed from the
bath, and cured in an oven with the following curing schedule: 1h at 65˚C, 1h at 80˚C, 1h at
121˚C, and 2h at 177˚C for post-cure. All the samples were prepared with one single layer of
NCFs.
Table 7-1 Sample compositions
Monomers
(ratios of P-epoxy : E-epoxy)
Curing
agents
NCFs*1
P-epoxy 79 % (100:0) 21 % -
10%E-epoxy 79 % (90:10) 17 % -
P-epoxy/DNCF 59 % (100:0) 16 % DNCF 25 %
10%E-epoxy/DNCF 62 % (90:10) 13 % DNCF 25 %
P-epoxy/SNCF 59 % (100:0) 16 % SNCF 25 %
10%E-epoxy/SNCF 62 % (90:10) 13 % SNCF 25 %
20%E-epoxy/SNCF 64 % (80:20) 11 % SNCF 25 %
30%E-epoxy/SNCF 66 % (70:30) 9 % SNCF 25 %
*1 DNCF = Oven-dried nanocellulose fibre; SNCF = Solvent-exchanged nanocellulose fibre
7.2.3 Characterization
7.2.3.1 Activation Energy (Ea) and Glass Transition Temperature (Tg)
The Ea and Tg of the epoxy composites were evaluated using a DSC model Q 100 from TA
instruments. Dynamic DSC measurements were carried-out at a ramp rate of 5, 10, 15, and 20
°C/min, from 30 to 300 °C in order to obtain the curing heat-flow curves of liquid samples.
The cured samples were heated to 300 °C at 10°C /min in order to detect the Tg of neat epoxy
and composites.

142
7.2.3.2 Tensile Mechanical Properties
The tensile tests of the specimens were performed using an Instron machine, Model 3367,
equipped with a 2 kN load cell. Samples were cut into dog-bone shaped specimens using an
ASTM specimen-cutting die. The sample thickness was determined using a bench top model
micrometer. The span was 25 mm, with a speed of 2.5 mm/min. Five specimens were measured
for each composite type.
7.2.3.3 Morphology
SEM images were used to study the morphology of NCFs and its composites. All of the images
were acquired using a JEOL JSM6610-Lv with an accelerating voltage 10-15 kV. To visualize
the distinct features of each sample, NCFs papers were frozen by liquid nitrogen to maintain
their surface structure, and avoid cell collapse. Composite samples were examined on their
cross-sections, which were broken by tension force. All the samples were coated with gold.
7.2.3.4 Thermal Stability
The thermal stability of epoxy resins and composites were investigated using a TGA, Q500,
TA Instruments, USA. Approximately 10-15 mg of sample was weighed in a platinum pan,
and operated under a continuous flux of air or nitrogen (60 cm3/min). Under dynamic analysis,
all of the samples were heated from room temperature to 700 °C, with 10 °C/min ramp.
7.3. Results and Discussion
7.3.1 The Effect of Nanocellulose Fibres on Activation Energies of Epoxy Resins
The kinetic characterization of curing behaviour is important to better understand the influence
of NCFs surfaces on network-forming, based on the activation energy (Ea) and the pre-
exponential factor. To avoid any premature assumptions of the reaction mechanism, and to
reduce noise, the Friedman differential isoconversional method was applied to observe the
evolution of the Ea at a given conversion rate. Compared to the Kissinger-Akahira-Sunose and
Ozawa–Flynn–Wall method, the Friedman method offers a significant improvement in the
accuracy of the Ea value31-32. The basic assumption of this analysis is that the reaction rate at a
constant conversion depends only on temperature. In a kinetic analysis, it is generally assumed
that the reaction rate can be described by two functions, k(T) and f(α),
𝑑𝛼/𝑑𝑡 = k(𝑇)𝑓(𝛼) = 𝐴𝑒𝑥𝑝(−𝐸𝑎/𝑅𝑇)𝑓(𝛼) Eq. (7-1)
where k(T) is the rate constant, and f(α) is the reaction model. When the heating rate (𝛽) is
constant, Eq. (7-1) can be rewritten as:

143
𝛽 (𝑑𝛼/𝑑𝑇) = 𝐴𝑒𝑥𝑝 (−𝐸𝑎/𝑅𝑇)(𝛼) Eq. (7-2)
Then, this equation can be easily taken the logarithmic derivative of the reaction rate at
conversion equal to constant:
ln [𝛽(𝑑𝛼/𝑑𝑇)]= ln (𝐴) −𝐸𝑎, α/𝑅𝑇 Eq. (7-3)
where 𝐸𝑎, α is the activation energy at a given conversion.
Fig. 7-1 exhibits the 𝐸𝑎 at the different curing conversion α, for both neat epoxy (solid lines)
and NCFs reinforced epoxy (dotted lines). Since the NCFs contained around 98 % acetone, the
overall 𝐸𝑎 was expected to increase due to the dilution effects on the concentration of the
reactants. Nevertheless, the DSC results showed that the 𝐸𝑎 decreased as a result of the catalytic
effect of NCFs. For the P-epoxy, the 𝐸𝑎 was decreased from 60.6 to 36.6 kJ/mol, while the 𝐸𝑎
of E-epoxy was decreased from 45.4 to 35.8 kJ/mol. The E-epoxy monomer had a lower 𝐸𝑎
than the P-epoxy monomer because of the existing hydroxyl groups in the E-epoxy resins,
which have been studied using FTIR and NMR in our previous research29. The DSC results
indicate that NCFs can act as a catalyst for both epoxy resins to reduce the Ea to approximate
36 kJ/mol.
In addition, when there are excess amounts of epoxy groups, the reaction between epoxy and
hydroxyl group can occur at elevated temperatures as shown in Scheme 7-1. The possibility of
the etherification has been reported by other reports which can explain the good interface
between resins and fibres.
Fig. 7-1 Dependence of the 𝐸 𝑎 on the extent of conversion evaluated from non-isothermal

144
DSC data.
Scheme 7-1 Reaction between epoxy and hydroxyl groups: (a) catalyst effect and (b)
etherification.
7.3.2 Mechanical Performance of Epoxy Resins and Epoxy/NCFs composites
The average tensile strength, modulus, and toughness of neat P-epoxy and 10% E-epoxy are
summarized in Table 7-2. In this study, toughness was estimated by the total area under stress-
strain. After adding 10 % E-epoxy, the tensile strength decreased slightly, from 76 MPa to 70
MPa, but the strain improved from 6.6 % to 12.3 %, which led to a toughness improvement to
84 %. Student pair t-test analysis of P-epoxy and 10%E-epoxy revealed that the differences in
tensile strength/ modulus were not statistically significant (p=0.087/0.111), but there is a
significant increase in the toughness for 10%E-epoxy resins (p=0.005). The improvement in
the toughness suggests that more energy was absorbed prior to fracture which reduced the
brittle cracking.
Table 7-2 Tensile properties of neat epoxies
Tensile Strength (MPa) Tensile Modulus (GPa) Strain (%) Toughness* (MJ/m3)
P-epoxy 76.0 ± 2.88 1.96 ± 0.06 6.6 2.34 ± 0.02
10%E-epoxy 70.2 ± 3.18 1.24 ± 0.14 12.3 4.43 ± 0.06
*= 5% statistically significant difference
E-epoxy monomer acted as a toughener, which improved elongation, but slightly compensated
the strength and modulus. To address this issue, the use of NCFs should increase the tensile
strength, and maintain the toughness. As described in Table 7-3, the strong reinforcement effect
of NCFs was observed in both epoxies, even with DNCF. Note that the fibre loading is only 25
wt. %. Based on the percolation theory, the percolation threshold is less than 6 vol. %33, but
between 6 vol. % to 18 vol. % is not considered as a dense nanopaper network34. Thus, the

145
fibre loading of this study was set at 25 wt. % (equal to 20.1-23.5 vol. % depending on the
NCFs density assumptions). The improvements of tensile strength of P-epoxy and 10%E-epoxy
after incorporating DNCF were 6.0 % and 8.7 %, respectively. With a SNCF, the increase of
tensile strength of P-epoxy and 10%E-epoxy reached 47.4 % and 88.0 %, which is significantly
higher than the reinforcement from DNCF. This is likely due to the surface difference of NCFs,
as shown in Fig. 7-2. The NCFs before the oven-drying process possessed a fibrous structure;
after oven-drying it exhibited a compact and smooth surface. The nano-scale cellulose tends to
collapse by capillary force during the water evaporation, and the deformed condition is fixed
by hydrogen bonds that form between hydroxyl groups of the cellulose35-36, thus producing a
dense surface that restrains the penetration of resins into the NCFs network. DNCF showed an
impenetrable property, but E-epoxy/DNCF exhibited a three-fold and four-fold increase in
tensile modulus, which is significantly higher than SNCF. One of the possible reasons is that
the epoxy/SNCF composites created many voids inside the structure during the solvent
evaporation process, which decreased the modulus of epoxy/SNCF composites. Moreover,
previous research has indicated that the porosity of composites can significantly decrease the
modulus16.
Table 7-3 Tensile strength and modulus of two types of reinforcement and two types of resin
compositions
DNCF SNCF
Strength (MPa) Modulus (GPa) Strength (MPa) Modulus (GPa)
P-epoxy 80.5 ± 8.00 (↑6.0 %) 7.70 ± 0.80 (↑293 %) 112 ± 3.83 (↑47.4 %) 4.19 ± 0.97 (↑114 %)
10% E-epoxy 76.3 ± 9.31 (↑8.7 %) 6.18 ± 1.42 (↑398 %) 132 ± 2.39 (↑88.0 %) 4.94 ± 0.26 (↑298 %)
(a)
(b)
Fig. 7-2 SEM images of cellulose nano-paper before oven-drying (a) and
after oven-drying (b)

146
The stress-strain curves of P-epoxy/SNCF composites show different patterns to 10%E-
epoxy/SNCF composites (Fig. 7-3). First of all, there is a slope change for P-epoxy/SNCF
composite at 2.3 % strain. The reason for this slope change might be the result of debonding
between fibre/matrix interface. Some studies37-38 indicate that before the ultimate strength is
achieved, the composites will reach a stress level where the resin will begin to crack away from
the reinforcing fibre not aligned with the applied load, and these cracks will spread through the
resin matrix. This is known as ‘transverse micro-cracking,’ and although the composite has not
completely failed at this point, the breakdown process has commenced. Secondly, compared to
neat P-epoxy, P-epoxy/SNCF composites showed a very brittle fracture, without yielding or
strain hardening regions, owing to the poor interface between fibre/matrix. By contrast, 10%
E-epoxy/SNCF avoids the micro-cracking problem, which indicates a superior adhesion
bonding between fibres and E-epoxy.
Fig. 7-3 Tensile stress-strain curves of (a) P-epoxy and (b) 10%E-epoxy and their reinforced
composites
According to the literature16, 19, 22-24, 39-40, the average tensile strength and modulus of
epoxy/NCFs composites are 85 MPa and 4.6 GPa, respectively (NCFs from a mechanical
breakdown process). Our findings show a better tensile strength, and a comparable tensile
modulus compared to the literature average (Fig. 7-4, our experimental results were labeled as
red triangle marks). Among the literature, Yano’s research (the points at the right-upper corner
of Fig. 7-4) showed the highest mechanical performance (350 MPa, 14 GPa). There are two
possible reasons to explain this difference. First, our NCFs contain some hemi-celluloses (>10
wt. %), which is an intrinsic amorphous polymer, and can aggregate cellulose fibrils, resulting
a detrimental effect on the composite strength. Secondly, the epoxy resin adopted in Yano’s
research is UV-curable epoxy resin, which might exhibit different properties to conventional
147
epoxy resin. However, his research is not fully explained as the composite strength (350 MPa)
is higher than NCF reinforcement (260 MPa).
Fig. 7-4 Tensile properties of NCFs reinforced composites compared to literature data 16, 19, 22-24, 39-40
In addition, our experimental data was compared to the prediction value based on the rules of
mixture (ROM). A previous review study34 states that the mechanical properties can be better
described by the ROM than other micromechanical models, such as Halpin-Tsai model and
Cox-Krenchel model. In order to verify this, the predicted tensile properties of the
nanocomposites were plotted using the ROM equations:
Ecomposite = VfEf + (1-Vf)Em………………………………………………………….Eq. (7-4)
σcomposite = Vfσf + (1-Vf) σm………………………………………………………….Eq. (7-5)
where Ecomposite and σcomposite represent the predicted tensile modulus and strength, respectively.
Vf denotes the fibre volume fraction; Ef, σf, Em and σm corresponds to the tensile modulus and
tensile strength of NCFs paper and matrix, respectively.
In the prediction section, we applied three tensile strength and modulus of fibre, including the
neat NCFs paper tested in this study (ROM 1, 145 ± 14.1 MPa and 9.5 ± 1.68 GPa), the highest
reported tensile properties of nanopapers (ROM 2, 243 Mpa and 14.9 GPa),24 and the highest
reported tensile strength and modulus of single plant fibre (ROM 3, 1 GPa and 100 GPa)41,
respectively. Our experimental result is higher than the first prediction (ROM1), and close to
the second prediction model (ROM2). Furthermore, the use of single plant fibre in the
prediction model (ROM3) is far higher than the experimental data, since the nanofibres tend to
be curved and randomly oriented in the plane, which results in a significant strength difference
between a single fibre and NCFs film. In order to eliminate the influence of randomly-oriented
fibres, Halpin-Tsai model (HTM) was applied to the single plant fibre data. Nevertheless, the
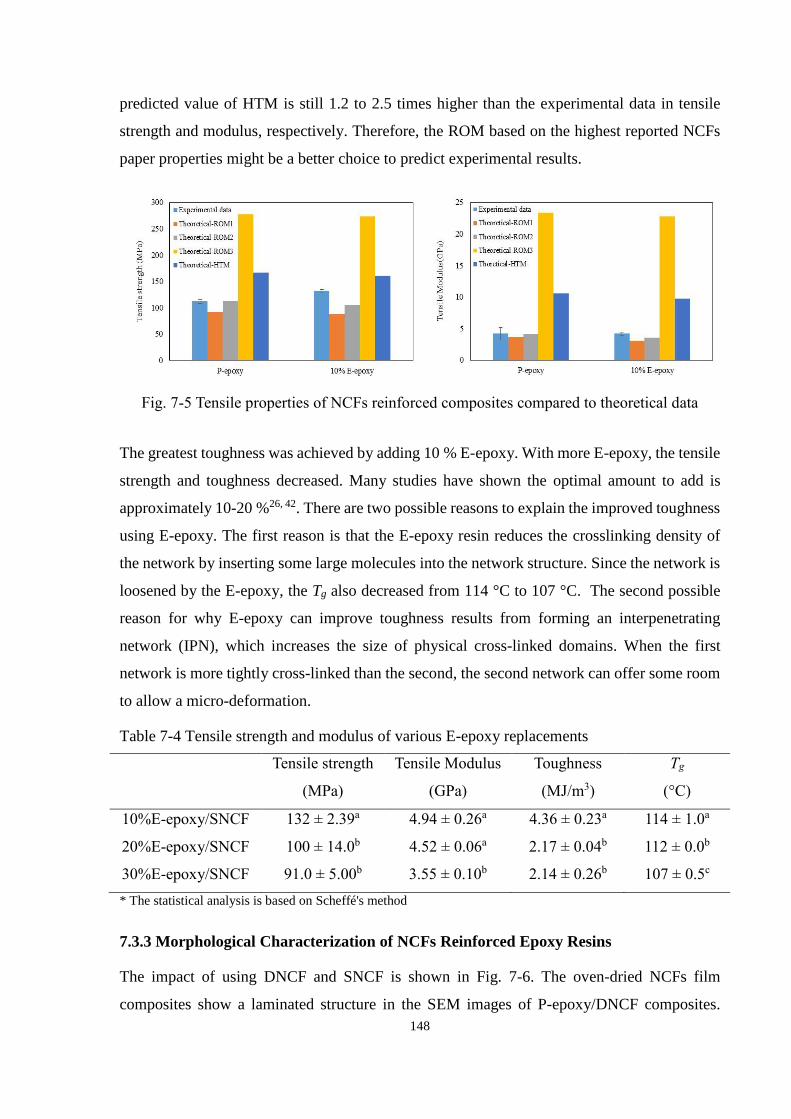
148
predicted value of HTM is still 1.2 to 2.5 times higher than the experimental data in tensile
strength and modulus, respectively. Therefore, the ROM based on the highest reported NCFs
paper properties might be a better choice to predict experimental results.
Fig. 7-5 Tensile properties of NCFs reinforced composites compared to theoretical data
The greatest toughness was achieved by adding 10 % E-epoxy. With more E-epoxy, the tensile
strength and toughness decreased. Many studies have shown the optimal amount to add is
approximately 10-20 %26, 42. There are two possible reasons to explain the improved toughness
using E-epoxy. The first reason is that the E-epoxy resin reduces the crosslinking density of
the network by inserting some large molecules into the network structure. Since the network is
loosened by the E-epoxy, the Tg also decreased from 114 °C to 107 °C. The second possible
reason for why E-epoxy can improve toughness results from forming an interpenetrating
network (IPN), which increases the size of physical cross-linked domains. When the first
network is more tightly cross-linked than the second, the second network can offer some room
to allow a micro-deformation.
Table 7-4 Tensile strength and modulus of various E-epoxy replacements
Tensile strength
(MPa)
Tensile Modulus
(GPa)
Toughness
(MJ/m3)
Tg
(°C)
10%E-epoxy/SNCF 132 ± 2.39a 4.94 ± 0.26a 4.36 ± 0.23a 114 ± 1.0a
20%E-epoxy/SNCF 100 ± 14.0b 4.52 ± 0.06a 2.17 ± 0.04b 112 ± 0.0b
30%E-epoxy/SNCF 91.0 ± 5.00b 3.55 ± 0.10b 2.14 ± 0.26b 107 ± 0.5c
* The statistical analysis is based on Scheffé's method
7.3.3 Morphological Characterization of NCFs Reinforced Epoxy Resins
The impact of using DNCF and SNCF is shown in Fig. 7-6. The oven-dried NCFs film
composites show a laminated structure in the SEM images of P-epoxy/DNCF composites.

149
There are plenty of layers of NCFs in the middle, and the thickness is approximately 20 μm.
The P-epoxy/SNCF composites show a homogeneous middle layer, and the thickness of the
NCFs swells to 90-100 μm due to the resin penetration (Fig. 7-6 b). With closer observation of
the tensile fracture cross-section (Fig. 7-6 c, 7-6 d), the fibrous and layer structure of NCFs
paper are still obvious, while the SNCF paper composites show a matrix-covered appearance,
with many white spots, which is possibly the fracture surface of single or bundle of NCFs. As
reported in many research studies34, the individual fractured NCFs appear as white dots in SEM
images. Their extremely short pullout length indicate strong interfacial adhesion, and strong
molecular interactions, probably because the surface hydroxyls of NCFs react with the oxirane
group through an etherification reaction, or due to the secondary bonding between these
hydroxyls.
Fig. 7-6 SEM images of fracture surface in cross-sections. P-epoxy/DNCF(a) and P-
epoxy/SNCF (b) showing the difference in nanopaper thickness caused by resin
penetration. A clear boundary was observed between DNCF and epoxy (c), but not at
SNCF/epoxy (d)
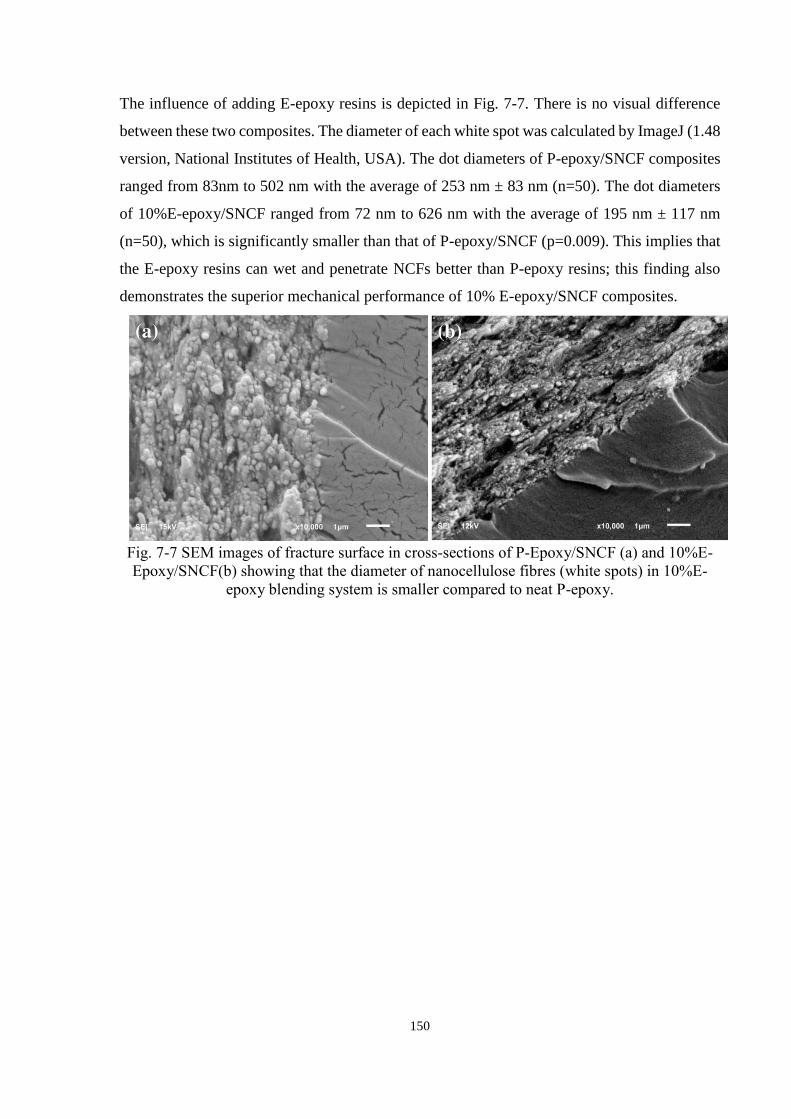
150
The influence of adding E-epoxy resins is depicted in Fig. 7-7. There is no visual difference
between these two composites. The diameter of each white spot was calculated by ImageJ (1.48
version, National Institutes of Health, USA). The dot diameters of P-epoxy/SNCF composites
ranged from 83nm to 502 nm with the average of 253 nm ± 83 nm (n=50). The dot diameters
of 10%E-epoxy/SNCF ranged from 72 nm to 626 nm with the average of 195 nm ± 117 nm
(n=50), which is significantly smaller than that of P-epoxy/SNCF (p=0.009). This implies that
the E-epoxy resins can wet and penetrate NCFs better than P-epoxy resins; this finding also
demonstrates the superior mechanical performance of 10% E-epoxy/SNCF composites.
Fig. 7-7 SEM images of fracture surface in cross-sections of P-Epoxy/SNCF (a) and 10%E-
Epoxy/SNCF(b) showing that the diameter of nanocellulose fibres (white spots) in 10%E-
epoxy blending system is smaller compared to neat P-epoxy.

151
7.3.4 Thermal Stability
The mass loss as a function of temperature for P-epoxy/SNCF and E-epoxy/SNCF are shown
in Fig. 8. The maximum degradation temperature of reference P-epoxy sample was 387°C;
after incorporating NCF, the maximum degradation temperature increased to 411°C, which is
likely due to formation of porous structures, or associated with strong interactions between
fibres and the matrix43. The porous structures are formed after thermal degradation of the NCF,
and the remaining matrix forms a porous structure that can decelerate thermal conductivity.
However, due to a lower thermal stability value of NCF compared to epoxy resins, the initial
decomposition temperature of composites decreased from 373 °C to 337 °C. According to
cellulose decomposition mechanism, cellulose dehydrates between 200 and 280 °C; the
extensive degradation of cellulose occurs when the temperature is more than 300 °C44. Thus,
the heat-resistance index temperature (Ts) of P-epoxy and P-epoxy/SNCF is 185°C and 181°C,
respectively. Adding E-epoxy slightly decreased thermal resistance, which formed a
degradation shoulder at around 356 °C. Based on our previous report, the first shoulder of E-
epoxy resin is around 330 °C29, which is due to the thermal sensitive compounds, such as abietic
acid and fatty acid. The second degradation temperature is around 416 °C, which is slightly
higher than the P-epoxy resin due to the cross-linked lignin.
In an air environment (Fig. 7c, 7d), the decomposition patterns seem more complex than in a
nitrogen environment, as the former involves oxidative reactions. There are three major peaks
for P-epoxy decomposition, while there are five peaks for P-epoxy/SNCF composites. From
300-500 °C, these degradation peaks of P-epoxy/SNCF all overlapped, and the onset
temperature is the same as that of P-epoxy resins. However, the last degradation peak of P-
epoxy/SNCF composites is 64 °C higher than that of neat P-epoxy resins. Adding E-epoxy
resins increased the degradation ratio at low temperature range (300-350 °C), but the high
temperature regions (550-650 °C) are almost intact. Furthermore, no cellulose degradation
peaks can be distinguished from the overlapping peaks.
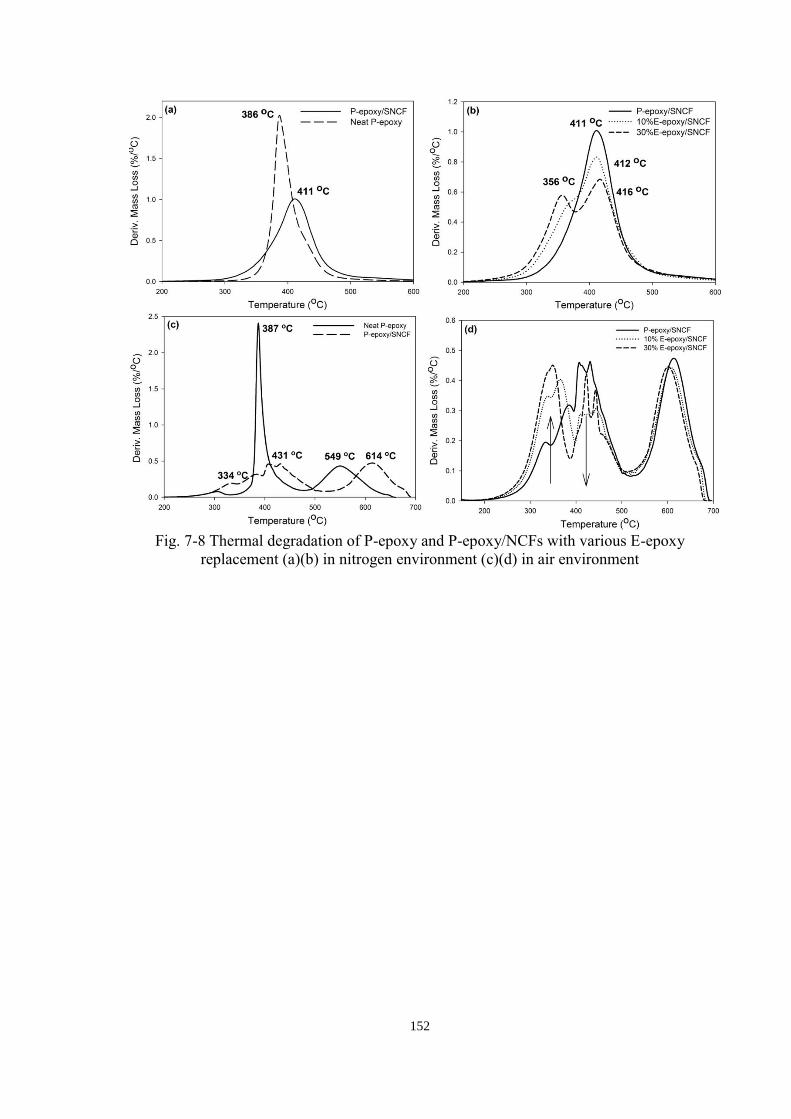
152
Fig. 7-8 Thermal degradation of P-epoxy and P-epoxy/NCFs with various E-epoxy
replacement (a)(b) in nitrogen environment (c)(d) in air environment

153
7.4 Summary
This chapter investigated the influence of incorporating nanocellulose fibres on epoxy/bio-
epoxy blending systems. Adding 10 wt.% bio-epoxy resins improved toughness significantly
from 2.34 to 4.48 MJ/m3, while adding solvent-exchanged nanocellulose fibres (25 wt.%)
increased the tensile strength and modulus by 88 % and 298 %, respectively. Although E-epoxy
resin can improve toughness, excess amounts of E-epoxy can have an adverse effect on its
mechanical performance and Tg. Consequently, the highest mechanical strength was obtained
with 10% E-epoxy replacement. Compared to data in research literature, our mechanical
performance is above the average line (85 MPa for tensile strength and 4.6GPa for tensile
modulus), and close to the prediction values using the rule of mixture; this indicates a
satisfactory interface between fibre and the matrix. Based on SEM results, the resin/SNCF
demonstrates a good interface compared to the resin/DNCF. The poor interface of
epoxy/DNCF can be explained by the collapsed fibrous structure during water evaporation.
The fibre diameter of P-epoxy/SNCF is around 253 nm, and the fibre diameter of blending
system is around 195 nm, which implies that E-epoxy resins have a better penetrating ability
than P-epoxy. In addition, incorporating NCF can postpone the maximum degradation rate;
however, the initial degradation temperature decreases. Thus, this chapter successfully
provides a strong and ductile NCF reinforced epoxy/ bio-epoxy composite, without using any
chemical surface pretreatment on NCF.

154
References
1. E. de Jong, A. Higson, P. Walsh and M. Wellisch, Biofuel Bioprod Bior, 2012, 6, 606-
624.
2. A. J. Ragauskas, C. K. Williams, B. H. Davison, G. Britovsek, J. Cairney, C. A. Eckert,
W. J. Frederick, J. P. Hallett, D. J. Leak, C. L. Liotta, J. R. Mielenz, R. Murphy, R.
Templer and T. Tschaplinski, Science, 2006, 311, 484-489.
3. F. S. Hu, J. J. La Scala, J. M. Sadler and G. R. Palmese, Macromolecules, 2014, 47, 3332-
3342.
4. S. Gunasekaran, T. B. Gorczyca and H. S. Cole, Google Patents, 2003.
5. S. Benyahya, C. Aouf, S. Caillol, B. Boutevin, J. P. Pascault and H. Fulcrand, Ind Crop
Prod, 2014, 53, 296-307.
6. C. Sasaki, M. Wanaka, H. Takagi, S. Tamura, C. Asada and Y. Nakamura, Ind Crop
Prod, 2013, 43, 757-761.
7. H. Kishi, Y. Akamatsu, M. Noguchi, A. Fujita, S. Matsuda and H. Nishida, J Appl Polym
Sci, 2011, 120, 745-751.
8. L. L. Ferreira, R. Couto and P. J. Oliveira, European Journal of Clinical Investigation,
2015, 45, 32-36.
9. S. Tanpichai, F. Quero, M. Nogi, H. Yano, R. J. Young, T. Lindstrom, W. W. Sampson
and S. J. Eichhorn, Biomacromolecules, 2012, 13, 1340-1349.
10. S. J. Hanley, J. Giasson, J. F. Revol and D. G. Gray, Polymer, 1992, 33, 4639-4642.
11. P. Terech, L. Chazeau and J. Y. Cavaille, Macromolecules, 1999, 32, 1872-1875.
12. M. Grunert and W. T. Winter, J Polym Environ, 2002, 10, 27-30.
13. A. Alemdar and M. Sain, Bioresource Technol, 2008, 99, 1664-1671.
14. S. Janardhnan and M. Sain, Int J Polym Sci, 2011.
15. P. Y. Kuo, N. Yan and M. Sain, Eur Polym J, 2013, 49, 3778-3787.
16. K. Y. Lee, T. Tammelin, K. Schulfter, H. Kiiskinen, J. Samela and A. Bismarck, Acs Appl
Mater Inter, 2012, 4, 4078-4086.
17. M. Matos Ruiz, J. Y. Cavaillé, A. Dufresne, J. F. Gérard and C. Graillat, Compos
Interface, 2000, 7, 117.
18. R. Masoodi, R. F. El-Hajjar, K. M. Pillai and R. Sabo, Mater Design, 2012, 36, 570-576.
19. M. Nuruddin, T. H. Mahdi, M. V. Hosur and S. Jeelani, presented in part at the ASC 29th
Technical Conference, UC San Diego, 2014.
155
20. M. Matos Ruiz, J. Y. Cavaillé, A. Dufresne, J. F. Gérard and C. Graillat, Compos
Interface, 2000, 7, 117-131.
21. L. M. Tang and C. Weder, Acs Appl Mater Inter, 2010, 2, 1073-1080.
22. H. Q. Liao, Y. Q. Wu, M. Y. Wu and H. Q. Liu, Polym Composite, 2011, 32, 837-845.
23. H. Yano, J. Sugiyama, A. N. Nakagaito, M. Nogi, T. Matsuura, M. Hikita and K. Handa,
Adv Mater, 2005, 17, 153-+.
24. F. Ansari, S. Galland, M. Johansson, C. J. G. Plummer and L. A. Berglund, Compos Part
a-Appl S, 2014, 63, 35-44.
25. J. Lu, P. Askeland and L. T. Drzal, Polymer, 2008, 49, 1285-1296.
26. D. Ratna, J Adhes Sci Technol, 2003, 17, 1655-1668.
27. F. Isabelle, M. Patrick and D. Stoil, in Interpenetrating Polymer Networks, American
Chemical Society, 1994, vol. 239, ch. 26, pp. 539-556.
28. L. Di Landro and G. Janszen, Composites Part B: Engineering, 2014, 67, 220-226.
29. P. Y. Kuo, M. Sain and N. Yan, Green Chem, 2014, 16, 3483-3493.
30. N. C. Wu, Master, University of Toronto, 2010.
31. S. Vyazovkin, A. K. Burnham, J. M. Criado, L. A. Perez-Maqueda, C. Popescu and N.
Sbirrazzuoli, Thermochim Acta, 2011, 520, 1-19.
32. A. Ortega, Thermochim Acta, 2008, 474, 81-86.
33. G. Siqueira, J. Bras and A. Dufresne, Polymers-Basel, 2010, 2, 728-765.
34. K. Y. Lee, Y. Aitomaki, L. A. Berglund, K. Oksman and A. Bismarck, Compos Sci
Technol, 2014, 105, 15-27.
35. H. Yano and S. Nakahara, J Mater Sci, 2004, 39, 1635-1638.
36. M. Nogi, S. Iwamoto, A. N. Nakagaito and H. Yano, Abstr Pap Am Chem S, 2009, 237.
37. D. J. Kim, S. H. Kang and T. H. Ahn, Materials, 2014, 7, 508-526.
38. P. Palmero, L. Montanaro, H. Reveron and J. Chevalier, Materials, 2014, 7, 5012-5037.
39. D. M. Bruce, R. N. Hobson, J. W. Farrent and D. G. Hepworth, Composites Part A:
Applied Science and Manufacturing, 2005, 36, 1486-1493.
40. H. Liao, Y. Wu, M. Wu, X. Zhan and H. Liu, Cellulose, 2012, 19, 111-119.
41. W. S. Beck, Bioscience, 1983, 33, 662-662.
42. D. Ratna and A. K. Banthia, J Adhes Sci Technol, 2000, 14, 15-25.

156
43. K. A. Sindhu, R. Prasanth and V. K. Thakur, in Medical Applications of Cellulose and Its
Derivatives: Present and Future, ed. V. K. Thakur, John Wiley & Sons, Inc, Hoboken,
2014.
44. Y. Peng, D. Gardner, Y. Han, A. Kiziltas, Z. Cai and M. Tshabalala, Cellulose, 2013, 20,
2379-2392.

157
Chapter 8 Conclusions, Contributions and Future Work
This chapter summarizes the characterization of extractive-based epoxy resins, presents our
scientific contribution to the field of bio-epoxy resins and engineering prospects of our newly
developed materials, and provides some future directions for further investigations or scale-up
applications.
8.1 Conclusions
The necessary transition from fossil-based BPA towards the development of sustainable
building blocks has become evident. The renewable alkaline bark extractives are uniquely
suited to replace BPA due to their akin polyphenol structures. This thesis endeavours to provide
a comprehensive and systematic study on the development and characterization of bio-based
epoxy resins from tree bark and improves the yield, reactivity, thermal resistance, and
mechanical properties of bio-epoxy resin in order to enlarge its future applications.
The major findings are summarized as follows:
1. The epoxidation reaction occurred successfully between bark extractives and ECH as
confirmed by FTIR and NMR.
2. The activation energy of extractive-based epoxy resin was lower than petroleum-based
epoxy resin, which implies extractive-based epoxy resin demands less energy to trigger the
reaction.
3. To produce E-epoxy efficiently, the best combination of reaction parameters is using
spray-dried extractives as substrates, a dioxane/water combination as solvent, and
tetrabutylammonium hydroxide as a ring-opening catalyst. The maximum extent of
conversion with minimum epoxy equivalent weight was achieved after 4.5 hours reaction
time with 3.4 sodium hydroxide/hydroxyl value molar ratios at 80 °C reaction temperature.
4. The degradation kinetic parameters show that the activation energy of bio-epoxy was a
dynamic value, indicating a multistage degradation mechanism or a variety of components.
5. FTIR spectra show that dehydration and crosslinking reactions occurred at low
temperatures while more Claisen chain rearrangement and chain-scission reactions occurred
at high temperatures.

158
6. Py-GC/MS results exhibit that the major skeletal structures were methyl abieta-8,11,13-
trien-18-oate, diethyl phthalate, 2,2'-isopropylidenebis(3,5-dimethylbenzofuran), and
epimanool.
7.NCFs catalyzed the reaction between commercial bisphenol F resins and the aromatic
amine curing agent.
8. The curing behaviours of NCFs catalyzed epoxy resins can be better fitted with S-B model
than Kamal model.
9. After incorporating NCFs, the tensile strength and modulus of the blending system
(10%E-epoxy/90%P-epoxy) increased 88 % and 298 %, respectively.
10. The maximum thermal degradation peak of the composites (NCFs/P-epoxy or NCFs/P-
epoxy/E-epoxy) was detected 24 °C higher than both neat epoxy resins.
8.2 Scientific Contributions and Engineering Prospects
1. Our research sheds new light on the reaction mechanism between bark extractives and ECH
and is the first study to develop a bio-epoxy resin directly from bark extractives. The novel
extractive-based epoxy resin can replace up to 50% conventional epoxy resins and the
blending system displays competitive mechanical and thermal properties compared to
commercial epoxy resins. Different to other bio-based epoxy resins, extractive-based epoxy
resin does not require complex and toxic extraction processing. Furthermore, this resin is a
nonfood-based biomaterial which is less likely to impact on consumer price in developing
countries compared to oil- or sugar-based biomaterials. Thus, our study provides a highly
potential renewable raw material to produce epoxy resins.
2. This thesis identifies the influential factors of E-epoxy preparation that reveals insight into
the glycidylation reaction between ECH and renewable biomass. Our research is one of the
first studies investigating both categorical and numerical reaction parameters on yield,
reactivity and molecular structures of bio-epoxy resins. Our research shows that hydroxyl
group amounts can significantly affect the yield of products; solvents greatly control the
reactivity and functionality of extractive-based epoxy resin; catalysts dominate the
possibility of side reactions. For the numerical parameters, temperatures are more influential
on yield and reactivity compared to time and catalyst amount.

159
3. Our work establishes a new and fundamental thermal degradation mechanism of bio-epoxy
resins, which may lead to a promising thermal enhancement. Additionally, the thermal
approach applied in this study can avoid a time-consuming separation process and obtain
informative results. As mono-epoxidized resin acid and mono-epoxidized fatty acid were
detected in this research, it also clearly explained why the thermal performance of
extractive-based epoxy resins was slightly lower than commercial products.
4. This study develops a unique composite (E-epoxy/P-epoxy/NCFs) of high mechanical
strength, superior thermal stability, and long-term sustainability. This composite is an
innovative development, which well balances the strength and toughness, and to the best of
our knowledge, no research has ever combined bio-epoxy resin and NCFs together with a
tensile strength above 100 MPa. Compared to data in research literature, the mechanical
performance of our composite is above the average line, and close to the prediction values
using the rule of mixture, indicating a satisfactory interface between fibres and the matrix.
The toughness is significantly improved by adding extractive-based epoxy resin and the
tensile strength and modulus was enhanced by adding nanocellulose fibres. In addition,
incorporating nanocellulose can postpone the maximum degradation rate. Lastly, no
chemical surface pretreatment is required on nanocellulose, which adheres to the principle
of green chemistry.
8.3 Future Work
Future work in the research area of bio-based epoxy resins should focus on further improving
performance of the extractive-based epoxy resin to facilitate their future applications and
commercialization. Key areas proposed for future works are outlined as follows:
1. It would be worthwhile to conduct a life cycle assessment (LCA) on bio-based epoxy
resins as it can offer a cradle-to-cradle examination on energy consumption, carbon dioxide
emission and environmental impacts. Based on the results from LCA, the sustainability and
toxicity of our bio-based epoxy resins can be studied and further improved.
2. It will be of beneficial to improve the extent of conversion of E-epoxy production. The
first method is to change the synthesis route from ECH method to a double bond oxidation.
In ECH method, some hydroxyl groups cannot be fully converted into epoxy groups. To
address this issue, we can apply 3-bromoprop-1-ene to covert hydroxyl groups into double
structure and then reacts to hydrogen peroxide to obtain epoxy groups. This method not only

160
increase the yield, but also offer some insight into the components which cannot be
transformed through ECH method. The second method is to choose a strong and non-
nucleophilic base as a ring-closing catalyst. In this thesis, we used NaOH to finish the ring-
closing reaction, but NaOH only reacts with the compounds with pKa value smaller than
15.8 and also partially hydrolyzed the final product. Thus, we can use N,N-
diisopropylethylamine (DIEA) instead of NaOH. DIEA can react with any compound with
pKa value lower than 35 and also decrease the side reactions.
3. Crosslinking density is an essential factor for the mechanical performance of
thermosetting polymers. It would be of great interest to investigate the crosslinking density
by swelling test, DMA measurements and NMR. The crosslinking density of bio-epoxy
resins through various curing schedule should be compared. The unlinked fraction or
oligomers can be detected by a solvent extraction process. We recommend to conduct a 40
hour extraction under reflux with dichloromethane/ tetrahydrofuran in soxhlet extractor.
These extracted compounds can offer some insight into the mono-functionalized compound
and possible side reactions, which also help to explain the inferior thermal property of
extractive-based epoxy resin. In addition, ESR technology should be applied on the
detection of free radicals. Identifying the free radical types and generating temperature can
definitely offer shed a light on thermal oxidation degradation.
4. It would be of great importance to develop a fully bio-based epoxy/fiber
nanocomposite, which combines bio-phenol, bio-epichlorhydrin, bio-curing agent and bio-
nanofibres. In our study, we successfully developed a bio-phenol but we did not combine
our bio-epoxy with bio-epichlorohydrin, which is available from Dow chemical Company
and Solvay Company. In addition, there are several bio-curing agents developed from
natural resources, such as malapimaric anhydride, which already shows great potential to
replace conventional anhydride type curing agent. Less attention has been focused on the
fully bio-based composites due to their often low strength, but our study have shown its
thermal and mechanical strength can be improved. The most important thing is that a fully
bio-based composite can significantly reduce the dependency of petroleum resource and
carbon print.
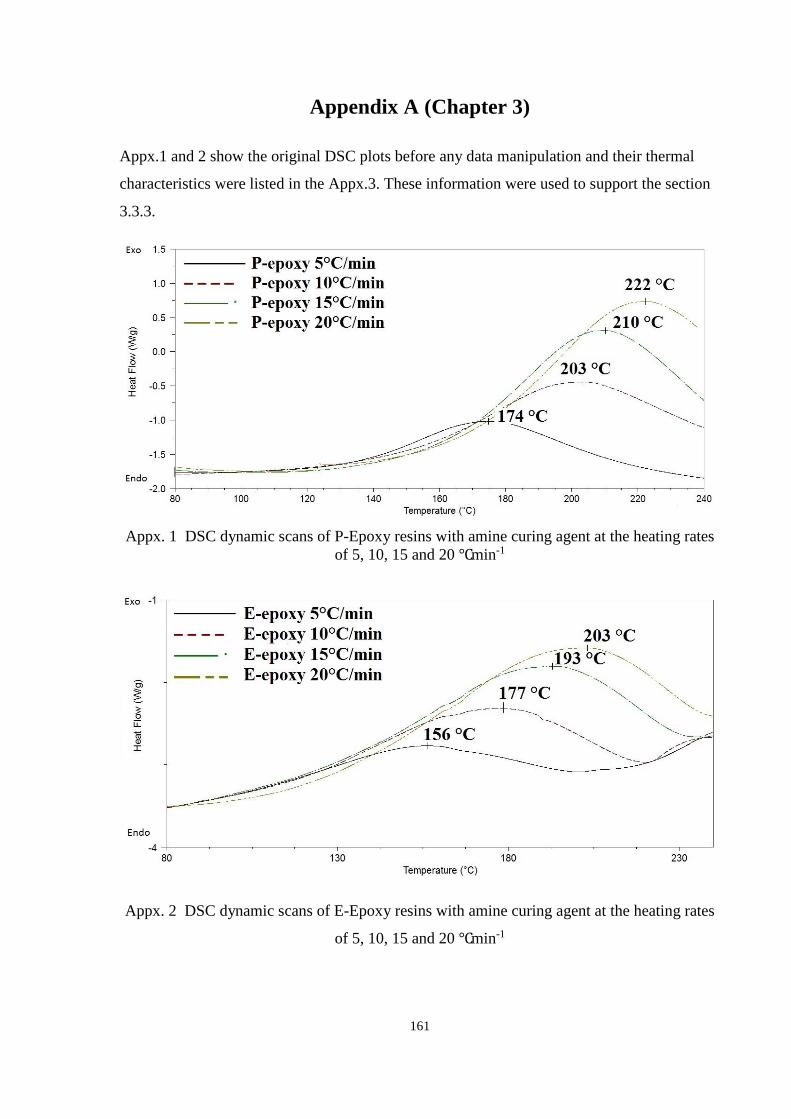
161
Appendix A (Chapter 3)
Appx.1 and 2 show the original DSC plots before any data manipulation and their thermal
characteristics were listed in the Appx.3. These information were used to support the section
3.3.3.
Appx. 1 DSC dynamic scans of P-Epoxy resins with amine curing agent at the heating rates
of 5, 10, 15 and 20 ℃min-1
Appx. 2 DSC dynamic scans of E-Epoxy resins with amine curing agent at the heating rates
of 5, 10, 15 and 20 ℃min-1

162
Appx.3 Thermal characteristics of samples from the dynamic DSC analysis
Epoxy
resins
Heating rate
(℃/min)
Onset
temperature (℃)
Peak temperature
(℃)
Kissinger
Activation
energy (kJ/mol)
P-Epoxy 5 130.7 174.9 52.0 kJ/mol
10 141.5 195.2
15 157.2 210.2
20 164.0 215.9
E-Epoxy 5 104.3 156.2 42.3 kJ/mol
10 116.3 177.1
15 129.8 192.9
20 133.2 203.0
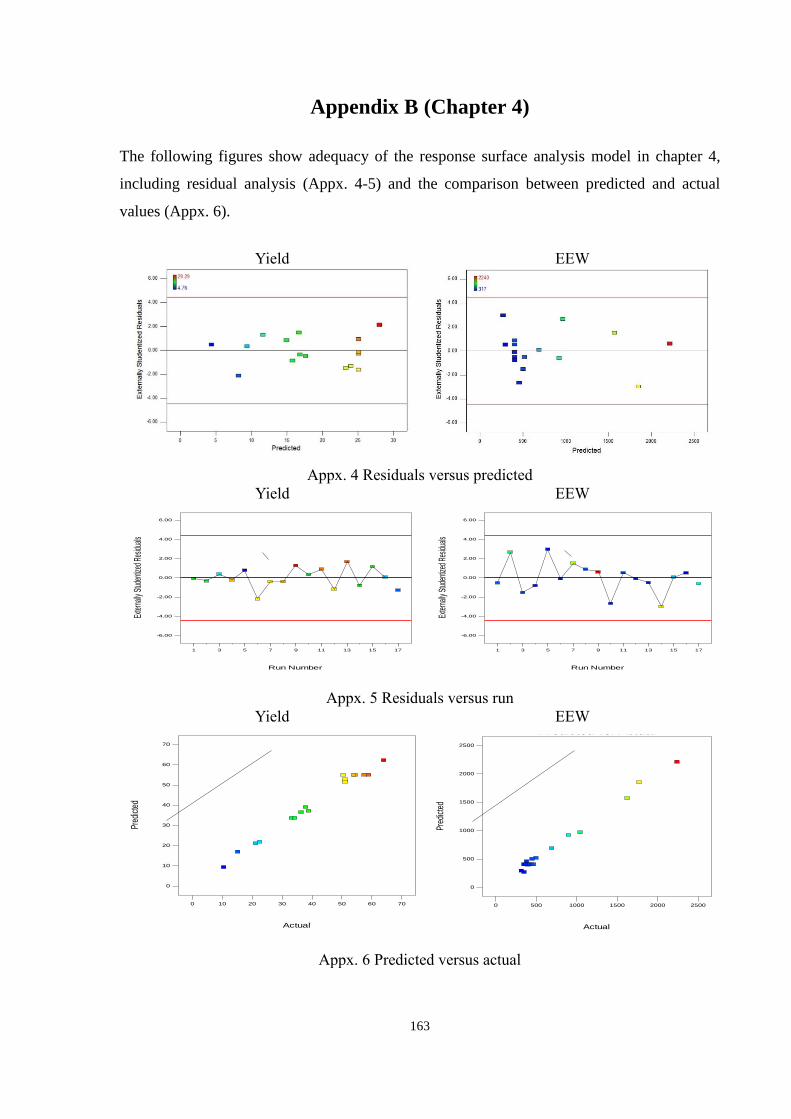
163
Appendix B (Chapter 4)
The following figures show adequacy of the response surface analysis model in chapter 4,
including residual analysis (Appx. 4-5) and the comparison between predicted and actual
values (Appx. 6).
Yield EEW
Appx. 4 Residuals versus predicted
Yield
EEW
Appx. 5 Residuals versus run
Yield
EEW
Appx. 6 Predicted versus actual
Design-Expert?Softwareyield
Color points by value ofyield:
64
10.5
Run Number
Exter
nally
Stud
entiz
ed R
esidu
als
Residuals vs. Run
-6.00
-4.00
-2.00
0.00
2.00
4.00
6.00
1 3 5 7 9 11 13 15 17
Design-Expert?SoftwareEEW
Color points by value ofEEW:
2240
317
Run Number
Exte
rnall
y Stu
dent
ized
Resid
uals
Residuals vs. Run
-6.00
-4.00
-2.00
0.00
2.00
4.00
6.00
1 3 5 7 9 11 13 15 17
Design-Expert?Softwareyield
Color points by value ofyield:
64
10.5
Actual
Pred
icte
d
Predicted vs. Actual
0
10
20
30
40
50
60
70
0 10 20 30 40 50 60 70
Design-Expert?SoftwareEEW
Color points by value ofEEW:
2240
317
Actual
Pred
icte
d
Predicted vs. Actual
0
500
1000
1500
2000
2500
0 500 1000 1500 2000 2500

164
(a) BiF-Aliph
BiF-Aliph-DMF
(c)BiF-Aliph-DMF-NCFs
Ap
pen
dix
C (C
ha
pter 6
)
(d) BiF-Arom
(e) BiF-Arom-DMF
(f) BiF-Arom-DMF-NCFs
Appx. 7 Curve of reaction rate versus conversion rate with Kamal model and S-B model predictions (cont’)

165
(g) WD-Aliph
(h) WD-Aliph-Water
(i) WD-Aliph-Water-NCFs
(j) WD-Arom
(j) WD-Arom-Water
(k) WD-Arom-Water-NCFs
Appx. 7 Curve of reaction rate versus conversion rate with Kamal model and S-B model predictions