development and characterization of extruded product of
TRANSCRIPT

African Journal of Food Science Vol. 4(11), pp. 703 - 717, November 2010 Available online http://www.academicjournals.org/ajfs ISSN 1996-0794 ©2010 Academic Journals Full Length Research Paper
Development and characterization of extruded product of carrot pomace, rice flour and pulse powder
Navneet Kumar*, B. C. Sarkar and H. K. Sharma
Department of Food Engineering and Technology, Sant Longowal Institute of Engineering and Technology, Longowal,
Sangrur-148106, Punjab, India.
Accepted 07 May, 2010
Rice flour was added in different proportions (10 - 30%) to dehydrated carrot pomace and pulse powder (CPPP) mixture having equal ratio. The formulation was extruded at different moisture content (17 - 21%), screw speed (270 - 310 rpm) and die temperature (110 - 130°C). The lateral expansion, bulk density, water absorption index, water solubility index, hardness and sensory characteristics were measured as responses. Significant regression models were established with the coefficient of determination, R2 greater than 0.72. The results indicated that CPPP proportion and moisture content significantly influenced (P < 0.10) lateral expansion; temperature for water absorption index; screw speed and temperature for hardness and screw speed for sensory score. The compromised optimum condition obtained by numerical integration for development of extrudates were: CPPP mixture of 16.5% in rice flour, moisture content 19.23%, screw speed 310 rpm and die temperature 110°C. Sensory evaluation revealed that carrot pomace could be incorporated into ready-to-eat expanded products upto the level of 8.25%. Key words: Twin screw extrusion, carrot pomace, response surface methodology, rice flour, pulse powder.
INTRODUCTION Fruit and vegetable wastes are inexpensive, available in large quantities, characterized by a high dietary fibre content resulting with high water binding capacity and relatively low enzyme digestible organic matter (Serena and Knudsen, 2007). A number of researchers have used fruits and vegetable by-products such as apple, pear, orange, peach, blackcurrant, cherry, artichoke, asparagus, onion, carrot pomace (Grigelmo-Miguel and Martin-Belloso, 1999; Ng et al., 1999; Nawirska and Kwasnievska, 2005) as sources of dietary fibre supplements in refined food. Cereal grains are generally used as major raw material for development of extruded snack foods due to their good expansion characteristics because of high starch content. The broken rice is a byproduct of modern rice milling process. The rice portion can have varying percentages (5 - 7%) of broken kernels which contain nutritive value similar to whole rice and are *Corresponding author. E-mail: [email protected]. Tel: +91 94110 28800.
available readily at relatively lower cost. Rice contains approximately 7.3% protein, 2.2% fat, 64.3% available carbohydrate, 0.8% fiber and 1.4% ash content (Zhoul et al., 2002). Rice flour has become an attractive ingredient in the extrusion industry due to its bland taste, attractive white color, hypoallergenicity and ease of digestion (Kadan et al., 2003). Cereal grains tend to be low in protein to have a poor biological value due to their limited essential amino acid content and are usually fortified with lysine or pulse protein to produce nutritious snack foods. Among food legumes, pigeon pea is a valuable source of protein, minerals and vitamins and occupies a very important place in human nutrition in many developing countries (Singh, 1988). The method of dehulling of legumes significantly affects the formation of broken and powdered particles and in the case of pigeon pea it varies between 9 - 24.6% for broken and 5.5 – 6.1% for powder (Singh et al., 1992). Pulse powder is a by-product of milling process which has a high protein content (22%) similar to dhal and easily available at relatively lower cost as compared to whole pigeon pea dhal.
The carrot (Daucus carota) is a root vegetable, usually

704 Afr. J. Food Sci. orange, purple, red, white or yellow in color, with a crisp texture when fresh. The total production of carrot and turnips was estimated as 27.386 million tones in the world during year 2008 (FAO, 2008). It is a rich source of �-carotene and contains other vitamins, like thiamine, riboflavin, vitamin B-complex and minerals (Walde et al., 1992). Fruit and vegetable juices have become important in recent years due to overall increase in natural juice consumption as an alternative to the traditional caffeine containing beverages such as coffee, tea, or carbonated soft drinks (Kaur et al., 2009). Carrot pomace is a by-product obtained during carrot juice processing. The juice yield in carrots is only 60 - 70%, and even up to 80% of carotene may be lost with left over carrot pomace (Bohm et al., 1999). It also has good residual amount of all the vitamins, minerals and dietary fibre. So far the left over pomace, received after juice extraction of carrots, does not find proper utilization. Moreover, vegetable pomace has become a source of environmental problem. The pomace is quite perishable as it contains about 88 ± 2% of moisture. However, dried carrot pomace has � carotene and ascorbic acid in the range of 9.87 to 11.57 mg and 13.53 to 22.95 mg per 100 g, respectively (Upadhyay et al., 2008). A promising way is to store the carrot pomace in dried form and utilize in the development of bakery products specifically extrudates, which are now a days becoming more popular than other bakery products in ready to eat food category.
The incorporation of cauliflower trimmings into ready-to-eat expanded products up to 10% level was suggested by Stojceska et al. (2008). Altan et al. (2008) processed the blends of barley flour and tomato pomace; barley flour and grape pomace and corn flour and tomato pomace in a co-rotating twin-screw extruder. Limited information is available on extrusion processing of carrot by-products. The objective of this study was to incorporate carrot by-products as a source of dietary fibre into ready-to-eat snacks. Upadhyay (2008) reported the use of carrot pomace, gram flour and rice flour based formulation for extrusion studies. However, the range of process variable was too wide. Reference researches indicate that no published work research on the incorporation of rice flour with CPPP is available. MATERIAL AND METHODS Experimental design Response surface methodology (RSM) was adopted in the design of experimental combinations (Altan et al., 2008; Yagci and Gogus, 2008; Ding et al., 2005; Montgomery, 2001). The main advantage of RSM is the reduced number of experimental runs needed to provide sufficient information for statistically acceptable results. A four-variable (five levels of each variable) central composite rotatable experimental design was employed (Montgomery, 2001; Yagci and Gogus, 2008). The parameters and their levels were chosen based on the literature available on rice based extrudates (Yagci and Gogus, 2008; Ibanoglu et al., 2006; Ding et al., 2005; Upadhyay, 2008). The ingredients used for the carrot based
ready-to-eat snack preparation were: Rice flour; pulse powder (pigeon pea), carrot pomace and salt. The independent variables included the proportion of CPPP in rice flour (10 – 30%), moisture content (17 – 21%), screw speed (270 – 310 rpm) and die temperature (110 - 130°C). Response variables were expansion index, bulk density, water absorption and solubility index, hardness and sensory characteristics. The five levels of the process variables were coded as -2, -1, 0, +1, +2 (Montgomery, 2001) and design in coded (x) form and at the actual levels A, B, C, and D are given in Table 1. Dry carrot pomace powder preparation Commercial variety (Pusa Kesar) was procured from local market, Longowal, District. Sangrur, India. These were washed in running tap water two times to remove extraneous material. Trashes were removed with a plane stainless steel knife and trimming was also done. A juice mixer grinder cum food processor (Make: Supremo DLX, Maharaja appliance limited, New Delhi, India) was used to extract carrot juice (Goyal, 2004). The pomace was collected for further studies.
A hot air oven (Make: Osaw Industrial Products Pvt. Ltd., Haryana, India) was used for drying carrot pomace, which could regulate drying air temperature upto 250°C with ± 2°C accuracy. The dryer consisted of a preheating and heating chamber with thermostat based control unit, an electrical fan, and measurement sensors. The samples were spread over the trays and the temperature of the dryer was set at 60°C. The drying procedure continued till the moisture content of the sample was reduced to about 5 ± 1% (wet basis). The grinding was performed using the same food processor (Make: Supremo DLX, Maharaja appliance limited, New Delhi, India) with grinder attachment. The material was ground to pass through the sieve of 2 mm size. The pomace was stored in sealed polythene bag for further use. Sample preparation Ingredient formulations for extrusion products are given in Table 1. The carrot pomace powder and pulse powder were mixed in equal proportion in a food processor with mixer attachment. The moisture content of the formulation was estimated by hot air oven method (Ranganna, 1995). Rice flour was replaced with CPPP mixture at levels of 10, 15, 20, 25 and 30%. The moisture was adjusted by sprinkling distilled water in dry ingredients. All the ingredients were weighed and then mixed in the Supremo DLX food processor for 10 min based on preliminary study. The mixture was then passed through a 2 mm sieve to reduce the number of lumps formed due to addition of moisture. After mixing, samples were stored in polyethylene bags at room temperature for 24 h (Stojceska et al., 2008). The moisture content of all the samples were again determined by hot air oven method (Ranganna, 1995) prior to extrusion experiments. Extrudates preparation Extrusion of samples was performed using a co-rotating twin-screw extruder (Basic Technology Pvt. Ltd., Kolkata, India). The length-to-diameter (L/D) ratio of the extruder was 8:1. The main drive of extruder was provided with a 7.5 HP motor (400 V, 3 ph, 50 cycles). The output shaft of worm reduction gear was provided with a torque limiter coupling. The barrel of the extruder received the feed from a co-rotating variable speed feeder. The barrel was provided with two electric band heaters and two water cooling jackets. A temperature sensor was fitted on the front die plate, which was connected to temperature control unit placed on the control panel. The die was required to be fixed on the face of barrel by a screw nut tightened

Kumar et al. 705
Table 1. The central composite rotatable experimental design (in coded and uncoded levels of four variables and five levels) employed for development of carrot pomace based extrudates and the responses of developed extrudates.
������������� � � �� � ����������� � � �� �
� � �� ��� ��
�� �� ��������
��
� � �� �� ��� � ������������
� � �� �� �������� ��
�� �� �� �� ���! �����
" �� �
�# � �� �� ������
�� $ ������ ��% &�
�' (� � ��
) ����' (' ��
) � ������
*� � �� � ��� � % �� (+, -�
�� ���� . �� � ���� �� ���� . �� � ���� �� ���� . �� � ���� �� ���� . �� � ���� /0� /1� /2� /3� /4� /5�
�� ��� ������ ��� ��� ��� ���� ��� ���� ��� ���� ��� ���� ���� ���
�� �� ������ ��� ��� ��� ���� ��� ���� ������ ���� ���� ��� ����� ��
� ��� ������ �� ��� ��� ���� ��� ���� ������ ���� ���� ��� ����� ���
�� �� ������ �� ��� ��� ���� ��� ���� ����� ���� ��� ��� ���� ���
�� ��� ������ ��� ��� �� ��� ��� ���� ������ ���� ��� ���� ���� ����
� �� ������ ��� ��� �� ��� ��� ���� ��� ���� ���� ���� �� � ���
�� ��� ������ �� ��� �� ��� ��� ���� �� �� ���� ���� � �� ���� ���
�� �� ������ �� ��� �� ��� ��� ���� ����� ���� ���� ���� ����� � ��
�� ��� ������ ��� ��� ��� ���� �� ��� ���� ���� � �� ��� � �� � ��
��� �� ������ ��� ��� ��� ���� �� ��� ���� ���� ���� ��� ���� ��
��� ��� ������ �� ��� ��� ���� �� ��� ���� ���� ���� ��� ���� ��
��� �� ������ �� ��� ��� ���� �� ��� ����� ���� ���� � ����� ���
�� ��� ������ ��� ��� �� ��� �� ��� �� �� ���� ���� ��� �� � ���
��� �� ������ ��� ��� �� ��� �� ��� ����� ���� ���� ��� ��� ����
��� ��� ������ �� ��� �� ��� �� ��� ������ ���� ���� ��� ����� ����
� � �� ������ �� ��� �� ��� �� ��� ������ ���� ��� ��� ��� ����
��� ��� ������ �� ��� �� ���� �� ���� ������ ���� ���� ��� ��� ���
��� �� ����� �� ��� �� ���� �� ���� ������ ���� ��� ���� ���� ���
��� �� ������ ��� ��� �� ���� �� ���� � ��� ��� ���� ���� ��� ����
��� �� ������ �� ��� �� ���� �� ���� ����� ���� �� �� ����� ��
��� �� ������ �� ��� ��� ���� �� ���� ������ ���� �� ���� �� � ���
��� �� ������ �� ��� �� ��� �� ���� ������ ���� ���� ���� ����� � �
�� �� ������ �� ��� �� ���� ��� ���� ����� ���� � �� �� ����� ���
��� �� ������ �� ��� �� ���� �� ��� ������ ���� ���� ��� ����� ���
��� �� ������ �� ��� �� ���� �� ���� �� ��� ���� ��� ���� ����� ���
� � �� ������ �� ��� �� ���� �� ���� ����� ���� ��� ���� ���� � �
��� �� ������ �� ��� �� ���� �� ���� ������ ���� ���� ��� ����� ���
��� �� ������ �� ��� �� ���� �� ���� ������ ���� ��� ���� ����� ��
��� �� ������ �� ��� �� ���� �� ���� ������ ���� � � ��� � �� ���
�� �� ������ �� ��� �� ���� �� ���� ������ ���� ��� ���� � � � � �
�� �� ������ �� ��� �� ���� �� ���� ������ ���� ��� ���� ����� ���
by a special wrench provided. The twin screw extruder was kept on for 30 min to stabilize the set temperatures and samples were then poured in to feed hopper and the feed rate was adjusted to 4 kg/h for easy and non-choking operation. The die diameter was selected at 4 mm as recommended by the manufacturer for such product and recommended by Stojceska et al. (2008). The product was collected at the die end and kept at 60 ± 0.5°C in an incubator (Orbital Incubator, Macro Scientific Works, New Delhi) for 12 h duration to remove extra moisture from the product. The samples were packed in polythene bags for further analysis. Evaluation for lateral expansion of extrudates The ratio of diameter of extrudates and the diameter of die was used to express the expansion of extrudates (Fan, 1996; Ibanoglu et al., 2006). Six lengths of extrudates (approximately 120 mm)
were selected at random during collection of each of the extruded samples. The diameter of the extrudates was then measured at 10 different positions along the length of each of the six samples, using a vernier caliper. Lateral expansion (LE, %) was then calculated using the mean of the measured diameters:
100)(
Xholeofdiameter
holeofdiameterproductofdiameterLE
−=
(1)
Evaluation for bulk density of extrudates Bulk density (BD, g/cm3) was calculated using following expression (Stojceska et al., 2008)

706 Afr. J. Food Sci.
42 Ldm
BDπ
= (2)
Where m is mass, g of a length L, cm of extrudates with diameter d, cm. Evaluation for water absorption index (WAI) and water solubility index (WSI) of extrudates WAI and WSI were determined according to the method developed for cereals (Anderson et al., 1969; Yagci and Gogus, 2008; Stojceska et al., 2008). The ground extrudates were suspended in water at room temperature for 30 min, gently stirred during this period, and then centrifuged at 3000 g for 15 min. The supernatants were decanted into an evaporating dish of known weight. The WAI was the weight of gel obtained after removal of the supernatant per unit weight of original dry solids. The WSI was the weight of dry solids in the supernatant expressed as a percentage of the original weight of sample.
)/(extrudateofweightDry
gelbygainWeightggWAI =
(3)
100sup
(%) XextrudateofweightDry
ernatentinsoliddryofWeightWSI =
(4)
Evaluation for hardness of extrudates Mechanical properties of the extrudates were determined by crushing method using a TA–XT2 texture analyzer (Stable Micro Systems Ltd., Godalming, UK) equipped with a 500 kg load cell. An extrudate about 40 mm long, was compressed with a probe SMS – P/75 – 75 mm diameter at a crosshead speed 5 mm/s to 3 mm of 90% of diameter of the extrudate. The compression generated a curve with the force over distance. The highest first peak value was recorded as this value indicated the first rupture of snack at one point and this value of force was taken as a measurement for hardness (Stojceska et al., 2008). Evaluation for sensory characteristics of extrudates Sensory analysis was conducted for all the samples. Twelve panelists were asked to assess the expanded snacks and mark on a Hedonic Rating Test (1 – Dislike extremely, 5 – Neither like nor dislike and 9 – Like extremely) in accordance with their opinion for taste, texture, color and overall acceptability. Statistical analysis of responses The responses (lateral expansion, bulk density, water absorption index, water solubility index, hardness and sensory evaluation of the extrudates) for different experimental conditions were related to coded variables (xi, I = 1, 2, 3 and 4) by a second degree polynomial (Equation 5) as given below: y = b0 + b1x1+ b2x2+ b3x3+ b4x4 + b12x1x2 + b13 x1x3 + b14 x1x4 + b23
x2x3 + b24 x2x4 + b34x3x4 + b11 x12 + b22 x2
2 + b33 x32 + b44 x4
2 + � (5) Where, x1, x2, x3 and x4 are the coded values of rice flour and CPPP mixture ratio, moisture content (%), screw speed (rpm) and temperature (°C), respectively. The coefficients of the polynomial
were represented by b0 (constant); b1,b2,b3,b4 (linear effects); b12,b13,b14,b23,b24,b34 (interaction effects); b11,b22,b33,b44 (quadratic effects); and � (random errors). Data were modeled by multiple regression analysis and statistical significance of the terms was examined by analysis of variance for each response. The statistical analysis of the data of three dimensional plotting was performed using Design Expert Software (Statease 6.0). The adequacy of the regression model was checked by R2, Adjusted R2, Adequate Precision and Ficher’s F-test (Montgomery, 2001). The regression coefficients were then used to make statistical calculation to generate three dimensional plots for the regression model. RESULTS AND DISCUSSION Variation of responses (lateral expansion, bulk density, water absorption index, water solubility index, hardness and sensory evaluation) of extrudates with independent variables (rice and CCCP proportion, moisture content, screw speed and temperature) are shown in Table 1. A complete second order model (Equation 5) was tested for its adequacy to decide the variation of responses with independent variables. To aid visualization of variation in responses with respect to processing variables, series of three dimensional response surfaces (Figures 1 to 6) were drawn using design expert software (Statease 6.0). Lateral expansion Lateral expansion of extrudates ranged from 86.25 to 145.1% with an average value of 110.76%. The maximum expansion at coded point (0, 0, 0, 2) was about 1.7 times more than the minimum expansion at the coded point of 0, -2, 0, 0 (Table 1). The coefficients of the model and other statistics are given in Table 2a. The Model F-value of 3.52 implies that model is significant (P < 0.05). R2 and Adjusted R2 values of the model are 0.7666 and 0.5487, respectively. The Adequate Precision value of 9.053 indicates that the model can be used to navigate the design space as it is greater than 4.0 (Montgomery, 2001). Considering these criteria, following response model was selected for representing the variation of lateral expansion for further analysis. Lateral expansion = 106.67 – 3.54x1 – 3.47x2 + 2.01x3 + 1.21x4 + 1.52x1
2 – 4.21x22 + 0.064x3
2 + 8.01 x42 +
1.46x1x2 + 1.67 x1x3 –1.72 x1x4 + 2.81x2x3 – 3.91x2x4 – 4.01x3x4 (6) Following observations can be made from Equation 6. The coefficients of x1 (CPPP) and x2 (moisture content) are negative, but those of x3 (speed) and x4 (temperature) are positive. Therefore, increase in CPPP proportion and moisture content may reduce the lateral expansion, whereas increase in screw speed and temperature may increase the expansion of the product. Since coefficient of x2
2 is negative, a maximum expansion will occur in the range of moisture content selected for the study, whereas the coefficient of x4
2 is positive, a minimum expansion will be in the range of screw speed considered in the study.

Kumar et al. 707
Table 2a. Regression coefficients of second order polynomial and their significance for lateral expansion, bulk density and water absorption index.
" �� ��# � �� �� ������ �� $ ����� ��% ��' (� � �� ) ����' (' ��� (+� -� �� �66�� ����� �
�� �66-�� � �� *� �� �� �66-�� � �� *� �� �� �66-�� � �� *� ��
�� ��� ������ �� ������ ���������������� � � ����� ������ ������� � � ���� �����
�� ��� ������ ��� ������ ������������� � � ���� ����� �������� � � ����� �����
� �� ����� � � ���� ����� �������������� � � ���� ������ ������ � � ���� �����
�� ��� ����� � � ��� ����� ����� ��������� � � ���� ������ ������� ���� ������
�� ���� ����� � � ���� ����� ��������������� � � ���� ��� �� ��� ���� ����� �����
� ���� �������� �� � ���� � �������������� � ��� ������ �� ��� � � ���� � ����
�� ��� �� �� � � ��������� ������ ����� ���������� � � � �� ������ ������� ���� ������
�� ���� ������� ����� ����� ���������� ����� ������� ����� � � ���� �����
�� ����� �� �� � � ���� ����� �������������� � � ����� ������ ������� ����� ������
��� ���� � ��� � � ���� ������ �� ����������� � � ���� ������ ����� � � ���� � ���
��� ����� ������ � � ���� �� � � � ����������� � � ���� ������ ����� � �� �����
��� ���� ����� � � ��� ���� �������������� � � ����� ������ ������� ���� �����
�� ����� ������ � � ���� ��� �� ��� � ���������� � � ��������� ������ � ���������� � � ��������� ���� �
��� ���� ������� ��� ������ � ���������� � � ���� ������ ��������� ����� ������
��� ��� �� � � � �� �� � � ������ � �
� � � � �� � �� � ���� ������ � � �� �� � � �� ��� � �
��� � � � � � � �� �� � ! "� "# � � ���� � � ������ � � ������ � �
��� $ � ! % �# &�&"�� ��� � � ���� � � ��� � �
��� ' �( � )� � � ��� � � ��� � � ��� � �
Significant at 10% (*), 5% (**), 1% (***), ns – not significant.
Analysis of variance of Equation 6 (Table 2A) show that F-values for liner terms of CPPP proportion and moisture content were 3.64 and 3.50 and p values 0.0758 and 0.0812 (P < 0.1), showing that the x1 and x2 are significant terms. F-values for square terms of moisture content (x2
2) and temperature (x42) were 5.86 and 21.27
and p value 0.0286 and 0.0003, showing that both terms are significant at 5 and 1%, respectively.
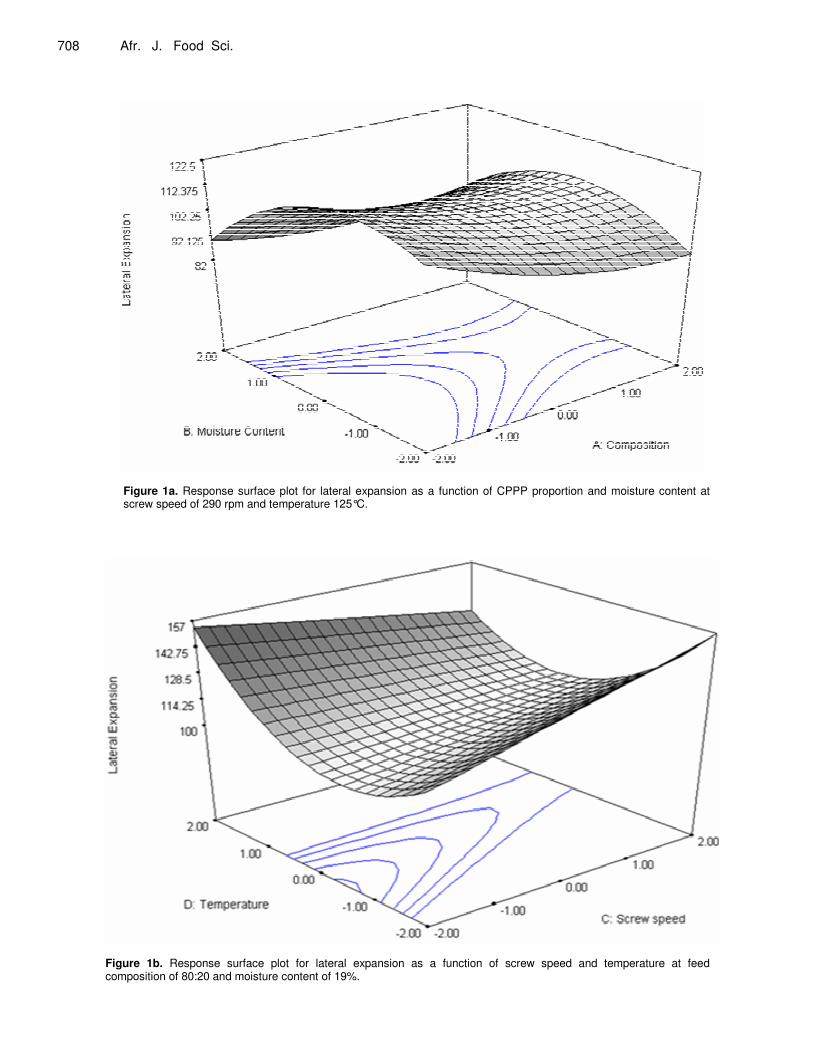
It may be seen from Figure 1a that the increase in rice proportion in feed composition resulted in increase in expansion of extrudate. Altan et al. (2008) and Upadhyay (2009) also observed similar behavior with increase in starch. There was slight expansion with the increase in moisture content, which may be due to gelatinization of starch, whereas further decrease in expansion with increase in moisture content may be attributed to the reduction of elasticity of dough through plasticization of melt as observed by Ding et al. (2005, 2006). It may be observed from Figure 1b that the expansion increased with the increase in screw speed, which may be due to high mechanical shear resulting in higher expansion. Similar results have been reported by Ding et al. (2006). The lateral expansion rapidly increased with the increase in the die temperature which may be due to higher degree of superheating of water in the extruder encountering the bubble formation (Ding et al., 2006). Bulk density The maximum bulk density (0.13 g/cc) of extrudates at
coded point (0, -2, 0, 0) was about 3.3 times more than the minimum bulk density (0.04 g/cc) at coded point (0, 0, 0, 2) and the average value of bulk density was 0.08 g/cc (Table 1). The coefficients of the model and other statis-tics are given in Table 2A. The Model F-value of 6.80 indicates that the model is significant (P < 0.05). R2
(0.8638) and Adjusted R2 (0.7367) values are near. The Adequate Precision (14.018) indicates that model can be used for prediction purposes. Considering these criteria, following response model was selected for representing the variation of lateral expansion for further analysis. Bulk density = + 0.092 – 0.0001828x1 + 0.001897x2 – 0.002151x3 – 0.002876x4 – 0.002871x1
2 + 0.006858x22
– 0.002146x32 – 0.012x4
2 + 0.0004384x1x2– 0.003674x1x3+ 0.002625x1x4 + 0.0005110x2x3 – 0.0001606x2x4 + 0.001669x3x4 (7) It is evident from Equation 7 that coefficients of x1, x3 and x4 are negative, but that of x2 is positive. Therefore, increase in CCCP proportion, screw speed and temperature may reduce the bulk density, whereas increase in moisture content may increase the bulk density of the product. Since coefficient of x2
2 is positive, a minimum bulk density will occur in the range of moisture content selected for the study, whereas coefficient of x4
2 is negative, a maximum bulk density will be in the range of temperature considered in the study. The coefficients of x2, x3, x4, x2
2 and x42 are having
opposite sign to the lateral expansion terms, as expected.
708 Afr. J. Food Sci.
Figure 1a. Response surface plot for lateral expansion as a function of CPPP proportion and moisture content at screw speed of 290 rpm and temperature 125°C.
Figure 1b. Response surface plot for lateral expansion as a function of screw speed and temperature at feed composition of 80:20 and moisture content of 19%.
The opposite behavior of bulk density and lateral expansion with the change in process variables have been reported by Ding et al., (2006).
It was observed from Table 2a and Equation 7 that F values for x1, x2, x3 and x4 are less than 2.58 and p values greater than 0.1288, indicating no direct significance on bulk density. F-values for square terms of moisture content (x2
2) and temperature (x42) were 16.80 and 55.55
and p values 0.0009 and less than 0.0001, respectively (P < 0.05), indicating that both terms are significant.
It was perceived from Figure 2A that bulk density initially increased with CPPP proportion, which may be because of more water binding property of non starch polysaccharides than protein and starch (Yagci and Gogus, 2008; Pansawatet al., 2008). However, it decreased with the CPPP proportion, which may be attributed to lighter mass of the fiberous pomace in comparison to other constituents. The bulk density initially decreased with moisture content, which may be due to proper gelatinization and higher expansion, whereas further increase in bulk density may be because of reduction in elasticity of dough and lower expansion as reported by Ding et al. (2005, 2006).
The contour plot in Figure 2b demonstrate the initial increase in bulk density with the increase in temperature, which may be due to the presence of carrot pomace in the feed formulations, whereas further decrease in bulk density with the increase in temperature may be attributed to higher expansion (Ding et al., 2006). The responses for bulk density are in line with the results for lateral expansion. Water absorption index The water absorption index of extrudates varied in the range of 0.93 to 5.62 g/g with an average value of 3.43 g/g. The maximum water absorption index at coded point (-1, -1, -1, 1) was about 6 times more than the minimum water expansion index at the coded point of 1, 1, -1, -1 (Table 1). The coefficients of the model and other statistics are given in Table 2a. The Model F-value of 7.83 signifies that the model is significant (P < 0.05). R2 (0.8797) and Adjusted R2 (0.7674) are in reasonable agreement. The Adequate Precision value of 10.294 implies that the model can be used for prediction purposes. Considering these criteria, following response model was selected for representing the variation of lateral expansion for further analysis. Water absorption index = + 3.99 – 0.18x1 – 0.025x2 – 0.23x3 +0.45x4 – 0.66x1
2 + 0.060x22 – 0.31x3
2 + 0.19x42 +
0.87x1x2 + 0.17x1x3+ 0.43x1x4 + 0.84x2x3 – 0.009630x2x4 - 0.71x3x4 (8) It can be seen from Equation 8 that the coefficients of x1, x2 and x3 are negative, but that of x4 is positive; therefore
Kumar et al. 709 increase in CPPP proportion, moisture content and screw speed may reduce the water absorption index, whereas increase in temperature may increase the water absorption index of the product. Since coefficients of x1
2 and x3
2 are negative, a maximum value of water absorption index will occur in the range of CPPP proportion and screw speed.
Analysis of variance of Equation 8 (Table 2a) show that F values for liner term of temperature was 8.92 and p value 0.0092 (P < 0.05), showing that the temperature (x4) is the significant term. F values for square terms of CPPP proportion (x1
2) and screw speed (x32) were 22.20
and 4.95 and p value were 0.0003 and 0.0418 (P < 0.05), indicating that both terms are significant. F values for interaction terms of x1x2, x1x4 and x2x3 were 22.87, 5.60 and 21.31 and p values 0.0002, 0.0318 and 0.0003 respectively (P < 0.05) showing that all three interactions are significant.
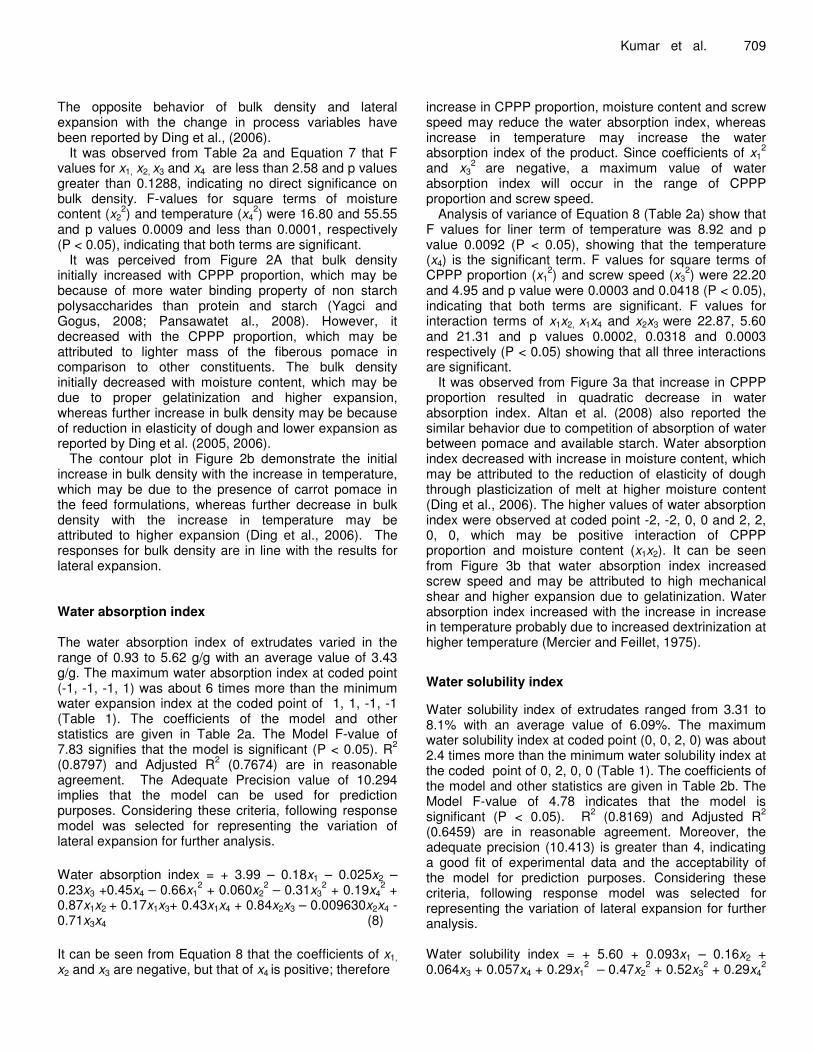
It was observed from Figure 3a that increase in CPPP proportion resulted in quadratic decrease in water absorption index. Altan et al. (2008) also reported the similar behavior due to competition of absorption of water between pomace and available starch. Water absorption index decreased with increase in moisture content, which may be attributed to the reduction of elasticity of dough through plasticization of melt at higher moisture content (Ding et al., 2006). The higher values of water absorption index were observed at coded point -2, -2, 0, 0 and 2, 2, 0, 0, which may be positive interaction of CPPP proportion and moisture content (x1x2). It can be seen from Figure 3b that water absorption index increased screw speed and may be attributed to high mechanical shear and higher expansion due to gelatinization. Water absorption index increased with the increase in increase in temperature probably due to increased dextrinization at higher temperature (Mercier and Feillet, 1975). Water solubility index Water solubility index of extrudates ranged from 3.31 to 8.1% with an average value of 6.09%. The maximum water solubility index at coded point (0, 0, 2, 0) was about 2.4 times more than the minimum water solubility index at the coded point of 0, 2, 0, 0 (Table 1). The coefficients of the model and other statistics are given in Table 2b. The Model F-value of 4.78 indicates that the model is significant (P < 0.05). R2 (0.8169) and Adjusted R2 (0.6459) are in reasonable agreement. Moreover, the adequate precision (10.413) is greater than 4, indicating a good fit of experimental data and the acceptability of the model for prediction purposes. Considering these criteria, following response model was selected for representing the variation of lateral expansion for further analysis. Water solubility index = + 5.60 + 0.093x1 – 0.16x2 + 0.064x3 + 0.057x4 + 0.29x1
2 – 0.47x22 + 0.52x3
2 + 0.29x42

710 Afr. J. Food Sci.
Figure 2a. Response surface plot for bulk density as a function of CPPP proportion and moisture content at screw speed of 290 rpm and temperature 125°C.
Figure 2b. Response surface plot for bulk density as a function of screw speed and temperature at feed composition of 80:20 and moisture content of 19%.

Kumar et al. 711
Figure 3a. Response surface plot for water absorption index as a function of CPPP proportion and moisture content at screw speed of 290 rpm and temperature 125°C.
Figure 3b. Response surface plot for water absorption index as a function of screw speed and temperature at feed composition of 80:20 and moisture content of 19%.

712 Afr. J. Food Sci.
Table 2b. Regression coefficients of second order polynomial and their significance for water solubility index, hardness and sensory evaluation.
) � ������ 7 ���� � ��+�� � ��� � % �� 8 � �� �� ��� � �� (+� -� �� �66�� ����� �
�� �66-�� � �� *� �� �� �66-�� � �� *� �� �� �66-�� � �� *� ��
�� ��� ����� � � ���� ������ � ��� � � ��� ������ ������ � � ���� � � �
�� ��� ���� �� � � � � ���� � ������� � � ���� ���� � ����� � � ���� �� ��
� �� �� ��� � � ���� � � � ��������� ���� ������ ������� �� � ���� �
�� ��� ������ � � ���� � ���� ������� ���� ������ ������ � � ���� ��� �
�� ���� ������ ��� ������ ��� ��� � � ���� ������ ������ � �� ����
� ���� ��������� ���� ������ ������� � � ���� ������ ������ � � ����� �� ���
�� ��� ������� ����� ������ ������ ��� ����� ����� � � ������
�� ���� ������ ��� ������ ����� � � ��* ���� ������ ������������ � � ���* ���� �����
�� ����� �������� � � ����� �� � ����� � � ���� ���� � �������� ���� ��� �
��� ���� ����� � � ���� �� ��� ��� ��� � � ���� ������ �������� ���� �����
��� ����� ������� � � ���� ������ ������� � � ���� ������ ����� ���� �� �
��� ���� �������� ���� ������ ������ ���� ������ �������� � � ���� �����
�� ����� �������� � � ����� ������ ����� � � ����� ������ ����� � � � �� ������
��� ���� ������ � � ���� ������ ����� � � ��� ��� � ������ � � ���� �����
��� ��� ��� �� � � �� ��� � � ������ � �
� � � � �� � �� � ���� � ���� � � ������ � � �� �� � �
���� � � � � � �� �+ � ! "� "# � �
����� � � ����� � � ����� � �
��� $ � ! % �# &�' "�� ���� � � ��� � � �� � � �
��� ' �( � )� � � ���� � � ��� � � ���� � �
Significant at 10% (*), 5% (**), 1% (***), ns – not significant. – 0.025x1x2 + 0.11x1x3 – 0.10x1x4 – 0.40x2x3 – 0.018x2x4 + 0.058x3x4 (9) It was observed from Equation 9 that the coefficient of x2 is negative, but that of x1, x3 and x4 are positive. Therefore, increase in moisture content may reduce the water solubility index, whereas increase in CPPP propor-tion, screw speed and temperature may increase the water solubility index of the product. The coefficient of x3
2
is the highest followed by the x12 and x4
2 in the positive direction, a minimum water solubility index will be in the range of CPPP proportion, screw speed and temperature, whereas coefficient of x2
2 is negative, a maximum water
solubility index will lie in the range of moisture content considered in the study.
Analysis of variance of Equation 9 (Table 2b) show that F values for x1, x2, x3 and x4 were within 1.63 and p value more than 0.2206 (P < 0.05), indicating no direct significance on water solubility index. The F values of parameters x1
2, x2
2, x3
2 and x4
2 were above 6.54 and p
values less than 0.0218 (P < 0.05), showing the significant quadratic contribution.
It is evident from Figure 4a that water solubility index increased quadratically with the increase in CPPP pro-portion, which may be due to increase in fibrous pomace content in the feed formulation. The water solubility index increased initially with the increase in moisture content,
which may be due to proper gelatinization and lateral expansion of the starch, whereas further decrease with the increase in moisture content may be attributed to reduction in lateral expansion due to plasticization of melt as observed by Ding et al. (2005). There was a slight decrease with the increase in screw speed (Figure 4b), which may be because of high mechanical shear exerted on extrudates, whereas further decrease in water soluble index with the increase in screw speed may be the result of higher expansion of the product. Water solubility index decreased initially and increased further with increase in temperature, which may be attributed to the similar variation of lateral expansion of the extrudates with increase in temperature. The results obtained for water solubility index are in line with the results obtained for lateral expansion. Hardness The maximum hardness (23.16N) at coded point (0, 0, -2, 0) was about 4.5 times more than the minimum hardness (5.19N) at coded point (-1, 1, -1, 1) and the average value of hardness was 12.85 N (Table 1). The coefficients of the models and other statistics are given in Table 2b. The Model F-value of 3.54 implies the model as significant (P < 0.05). R2 and Adjusted R2 values of the model are 0.7678 and 0.5511, respectively. The
Kumar et al. 713
Figure 4a. Response surface plot for water solubility index as a function of CPPP proportion and moisture content at screw speed of 290 rpm and temperature 125°C.
Figure 4b. Response surface plot for water solubility index as a function of screw speed and temperature at feed composition of 80:20 and moisture content of 19%.

714 Afr. J. Food Sci.
Figure 5a. Response surface plot for hardness as a function of CPPP proportion and moisture content at screw speed of 290 rpm and temperature 125°C.
adequate precision value of 7.580 indicates that the model can be used to navigate the design space. Considering these criteria, following response model was selected for representing the variation of lateral expansion for further analysis. Hardness = + 13.05 + 0.69x1 – 0.80 x2 – 2.28 x3 – 1.73 x4 – 0.64x1
2 – 0.85 x22 +1.28x3
2 + 0.034x42 + 1.01x1x2 –
0.62x1x3 – 0.40x1x4 + 2.23x2x3 +0.21x2 +1.00x3x4 (10) Following observations can be made from Equation 10. The coefficient of x1 is positive, but those of x2, x3 and x4
are negative. Therefore, increase in CPPP proportion may increase the hardness whereas, increase in moisture content, screw speed and temperature may reduce the hardness of the product. Since coefficient of x3
2 is positive, minimum hardness will be in the range of screw speed considered in the study.
It was observed from Table 2b and Equation 10 that F values for screw speed (x3) and temperature (x4) were 14.31 and 8.18 and p values 0.0018 and 0.0119 (P < 0.05), respectively, indicating that the x3 and x4 are the significant terms. F and p values for square term of screw
speed x32 were 5.13 and 0.0338 (P < 0.05), showing that
the square term for screw speed is significant. F and p value for interaction term of x2x3 were 9.10 and 0.0087 (P < 0.05), signifying that interaction term is also significant.
It is evident from Figure 5a that the hardness decreased with the increase in moisture, which may be due to reduced expansion with the increase in moisture content. However, no significant change was observed with the change in CPPP proportion in the feed formula-tion. It may be observed from Figure 5b that hardness decreased with the increase in screw speed. Similar decrease in hardness with increased screw speed due to lower melt density was observed by Ding et al. (2006). The decrease in hardness with increase in temperature may be due to higher expansion at elevated temperatures. Similar findings have been reported by Altan et al. (2008).
Sensory characteristics Overall score of sensory characteristics ranged from 5.64 to 7.31 with an average value of 6.45. The maximum

Kumar et al. 715
Figure 5b. Response surface plot for hardness as a function of screw speed and temperature at feed composition of 80:20 and moisture content of 19%.
score at coded point (-1, 1, 1, -1) was about 1.3 times more than the minimum score at the coded point of -1, -1, -1, 1 (Table 1). The coefficients of the model and other statistics are given in Table 2b. The Model F-value of 2.81 indicates that the model is significant (P < 0.05). R2
(0.7242) and Adjusted R2 (0.4668) values and Adequate Precision (14.018) indicates that the model can be used for prediction purposes. Considering these criteria, following response model was selected for representing the variation of lateral expansion for further analysis. Overall acceptability = + 6.23 – 0.033x1 + 0.043x2 + 0.25x3 + 0.057x4 + 0.15x1
2 + 0.020x22 + 0.11x3
2 + 0.003773x4
2 – 0.18x1x2 – 0.18x1x3 + 0.17x1x4 – 0.077x2x3 + 0.11x2x4 + 0.077x3x4 (11) It was observed from Equation 11 that coefficient of x1 is negative, but that of x2, x3 and x4 are positive. Therefore, increase in CPPP proportion may reduce the sensory score, whereas increase in moisture content, temperature and screw speed may increase the sensory score of the product. The coefficients of square terms x1
2 and x3
2 are positive, a minimum expansion will lie in the range of CPPP proportion and screw speed considered in the study.
Analysis of variance of Equation 11 (Table 2b) show that F and p values for screw speed were 13.06 and 0.0026 respectively (P < 0.05), indicating that screw speed is significant for the overall acceptability of the product. The F values of parameters x1
2 and x3
2 were
5.64, 3.16 and p values are 0.0313, 0.0957, respectively (P < 0.05), indicating that the square terms for CPPP proportion and screw speed are significant. The F values of x1x2 and x1x3 were 4.7 and 4.89 and p values are 0.0466 and 0.0430, respectively (P < 0.05), showing that the interactions are significant.
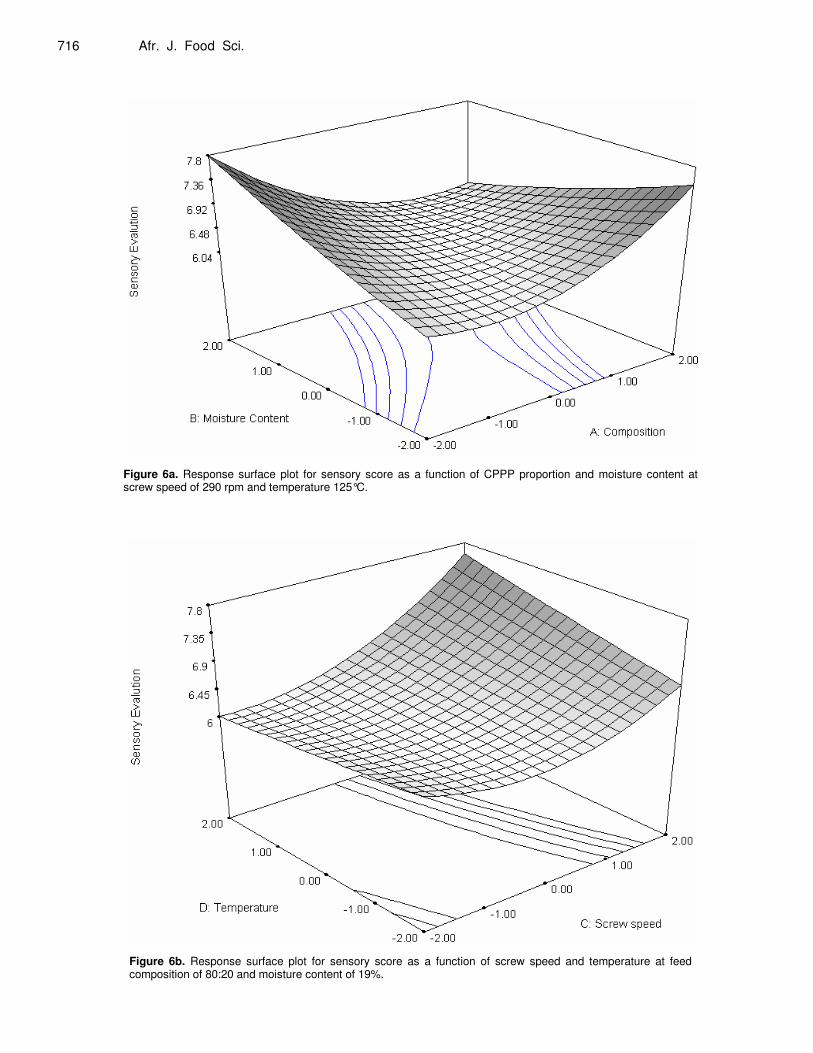
The maximum acceptability was observed either at the minimum level of CPPP proportion and maximum moisture content or vice versa (Figure 6a). The acceptability was increased with pomace concentration quadratically. Pomace concentration is also affected the interaction term with moisture content negatively, thus, minimum acceptability was observed at the maximum and minimum values of CPPP proportion and moisture content simultaneously. It was also perceived from Figure 6a that acceptability increased linearly at lower CPPP proportion and decreased linearly at higher CPPP proportion with the increase in moisture content. It may be observed from Figure 6b that acceptability increased quadratically with the increase in screw speed, whereas slight liner increase in acceptability was also observed due to temperature.
Compromised optimum condition The compromised optimum condition for the development of ready-to-eat extrudates was then determined using design expert software (Statease, DE 6). The final product would be considered optimum, if the sensory
716 Afr. J. Food Sci.
Figure 6a. Response surface plot for sensory score as a function of CPPP proportion and moisture content at screw speed of 290 rpm and temperature 125°C.
Figure 6b. Response surface plot for sensory score as a function of screw speed and temperature at feed composition of 80:20 and moisture content of 19%.

score, lateral expansion, water absorption index are as high as possible, whereas bulk density should be as low as possible. Therefore, compromised optimum condition criteria applied for numerical technique optimization were as follows: (1) maximum sensory score for product acceptability; (2) maximum lateral expansion for proper fluffyness; (3) maximum water absorption index for good digestibility and (4) minimum bulk density. The compro-mised optimum condition obtained for the development of extrudates were: Rice to formulation (pomace and pulse) ratio 83.5:16.5, moisture content 19.23%, screw speed 310 rpm and temperature 110°C with lateral expansion 156.95%, bulk density 0.0366 g/cc, water absorption index 5.62 g/g, water solubility index 7.87%, hardness 13.62 N and sensory score 7.3 at maximum desirability of 0.997. Conclusion It was observed that the minimum score for sensory was 5, which shows that all the extrudates were acceptable. The product was optimized at the pomace content of 16.5%. The optimum conditions obtained by numerical optimization for development of extrudates were found as CPPP(carrot pomace and pulse powder),16.5%, moisture content, 19.23%, screw speed, 310 rpm and die tempera-ture, 110°C. Sensory evaluation results indicated that carrot pomace could be incorporated into ready-to-eat expanded products upto the level of 8.25% and therefore could be considered a source of dietary fibre and vitamins in ready to eat snacks. REFERENCES Altan A, McCarthy KL, Maskan M (2008). Evaluation of snack food from
barley-tomato blends by extrusion processing. J. Food Eng., 84: 231-242.
Altan A, McCarthy KL, Maskan M (2008). Twin-screw extrusion of barley-grape pomace plends: Extrudate characteristics and determination of optimum processing conditions. J. Food Eng., 89: 24-12.
Anderson RA, Conway HF, Griffin EL (1969). Gelatinization of corn grits by roll and extrusion cooking. Cereal Sci. Today, 14: 4-12.
Bohm V, Otto K, Weissleder F (1999). Yield of juice and carotenoids of the carrot juice production, In: Symposium Jena-Thuringen, Germany, pp. 115-119.
Ding QB, Ainsworth P, Tucker G, Marson H (2005). The effect of extrusion conditions on the physicochemical properties and sensory characteristics of rice based expanded snacks, J. Food Eng., 66: 283-289.
Ding QB, Ainsworth P, Plunkett A, Tucker G, Marson H (2006). The effect of extrusion conditions on the functional and physical properties of wheat based expanded snacks, J. Food Eng., 73: 142-148.
Fan JM (1996). The effect of sugars on the extrusion of maize grits: I. The role of the glass transition in determining product density and shape. Int. J. Food Sci. Technol., 31: 55-65.
Kumar et al. 717 FAO (2008). Statistics, Food and Agriculture Organisation, Rome,
http://faostat.fao.org/site/339/default.aspx Grigelmo-Miguel N, Martín-Belloso O (1999). Comparison of dietary
fibre from by-products of processing fruits and greens and from cereals. LWT – Food Sci. Technol., pp. 503-508.
Ibanoglu S, Ainsworth P, Ozer EA, Plunkett A (2006). Physical and sensory evaluation of a nutritionally balanced gluten-free extruded snack, J. Food Eng., 75: 469-472.
Kadan RS, Bryant RJ, Pepperman, AB (2003). Functional properties of extruded rice flours. J. Food Sci., 68: 1669-1672.
Kaur S, Sarkar BC, Sharma HK, Singh C (2009). Response surface optimization of conditions for the clarification of guava fruit juice using commercial enzyme, J. Food Pro. Eng., 10.1111/j.1745-4530.2009.00414.
Larrea MC (2005). Effect of some operational extrusion parameters on the constituents of orange pulp. Food Chem., 89: 301-308.
Mercier C, Fillet P (1975). Modification of carbohydrate component of extrusion cooking of cereal product. Cereal Chemistry 52: 283-297.
Montgomery DC (2001). Design and Analysis of Experiments, New York Wiley pp. 416-419.
Nawirska A, Kwasniewska M (2005). Dietary fibre fractions from fruit and vegetable processing waste, Food Chem., 91(2): 221-225.
Ng A, Lecain S, Parker ML, Smith AC, Waldron KW (1999). Modification of cell wall polymers of onion waste. III. Effect of extrusion-cooking on cell wall material of outer fleshy tissue. Carbohydrate Polymers, 39: 341-349.
Pansawat N, Jangchud K, Jangchud A, Wuttijumnong P, Saalia FK, Eitenmiller RR, Phillips RD (2008). Effect of extrusion conditions on secondary extrusion variables and physical properties of fish, rice-based snacks, LWT– Food Sci. Technol., 41: 632-641.
Ranganna S (1995). Handbook of analysis and quality control for fruits and vegetable products, Tata Mc Graw Hill Publishing Company Limited, New Delhi.
Serena A, Kundsen B (2007). Chemical and physicochemical characterisation of co-products from vegetable food and agro industries. Anim. Feed Sci. Technol., 139: 109-124.
Singh U (1988). Antinutritional factors of chickpea and pigeonpea and their removal by processing. Plant Food Human Nutr., 38: 251-261.
Singh U, Santosa BAS, Rao PV (1992). Effect of dehulling methods and physical characteristics of grains on dhal yield of pigeon pea (Cajanus cajan) genotypes. J. Food Sci. Technol., 29: 350-353.
Stojceska V, Ainsworth P, Plunkett A, Ibanoglu E, Ibanoglu S (2008). Cauliflower by-products as a new source of dietary fibre, antioxidants and proteins in cereal based ready-to-eat expanded snacks. J. Food Eng., 87: 554-563.
Upadhyay A, Sharma HK, Sarkar BC (2008). Characterization of dehydration kinetics of carrot pomace, The CIGR E J. Vol X (In press).
Upadhyay A (2008). Ph. D. thesis on ‘Optimization of carrot pomace powder incorporation on extruded product quality by response surface methodology’, Mahatma Gandhi Chitrakoot Gramoday Vishwavidyalys, Satna, Madhya Pradesh, India.
Walde SG, Math RG, Chakkarvarthi A, Rao DG (1992). Preservation of carrots by dehydration techniques-A Review. Indian Food Packer, 46: 37-42.
Yagci S, Gogus F (2008). Response surface methodology for evaluation of physical and functional properties of extruded snack. foods developed from food-by-products, J. Food Eng., 86: 122-132.
Zhoul Z, Robards K, Helliwell S, Blanchard C (2002). Composition and functional properties of rice. Int. J. Food Sci. Technol., 37: 849-868.