development and deployment of a standardized savings and economic valuation system for tracking...
TRANSCRIPT
Development and Deployment of A Development and Deployment of A Standardized Savings and Economic Standardized Savings and Economic
Valuation SystemValuation Systemfor Tracking Conservation Resource for Tracking Conservation Resource
Acquisitions in the PNWAcquisitions in the PNW
Presented February 16, 2008Presented February 16, 2008Encore? Energy Efficiency Program PerformanceEncore? Energy Efficiency Program Performance
Tom EckmanTom EckmanNorthwest Power and Conservation CouncilNorthwest Power and Conservation Council
OR . . .OR . . .
Why We Think We Know Why We Think We Know
What We Think We DidWhat We Think We Did
slide 2
In This PresentationIn This Presentation
Historical Look at the Pacific Northwest Historical Look at the Pacific Northwest (PNW) Conservation Resource (PNW) Conservation Resource Acquisition Program SavingsAcquisition Program Savings
How the Pacific Northwest Is Attempting How the Pacific Northwest Is Attempting to “Standardize Savings Estimation and to “Standardize Savings Estimation and Economic Valuation” ProcessesEconomic Valuation” Processes
Some Some RandomRandom Thoughts on Why Thoughts on Why Power Planners May View EM&V Power Planners May View EM&V Differently Than RegulatorsDifferently Than Regulators

slide 3
PNW Regional Savings Now Total PNW Regional Savings Now Total Nearly 3300 aMWNearly 3300 aMW
0
500
1,000
1,500
2,000
2,500
3,000
3,500
1978 1982 1986 1990 1994 1998 2002 2006
Ave
rage
Meg
awat
ts
Federal Standards
State Codes
Alliance Programs
BPA and Utility Programs

slide 4
So What’s 3300 aMW?So What’s 3300 aMW?
It’s enough electricity to serve the It’s enough electricity to serve the entireentire state of Idahostate of Idaho and and all of Western all of Western MontanaMontana
It saved the region’s consumers nearly It saved the region’s consumers nearly than than $1.3 billion$1.3 billion in 2005 in 2005
It lowered 2005 PNW carbon emissions It lowered 2005 PNW carbon emissions by an estimated by an estimated 13.5 million13.5 million tons. tons.

slide 5
Since 1980 Energy Efficiency Resources Since 1980 Energy Efficiency Resources
Met Half of PNW Load GrowthMet Half of PNW Load Growth
0%
25%
50%
75%
100%
125%
1980 1985 1990 1995 2000 2005
Cum
ula
tive S
har
e o
f G
row
th

slide 6
Utility Acquired Energy Efficiency Has Been AUtility Acquired Energy Efficiency Has Been A
BARGAIN!BARGAIN!
$0
$10
$20
$30
$40
$50
$60
$70
$80
$90
$100
May
-96
Nov-9
6
May
-97
Nov-9
7
May
-98
Nov-9
8
May
-99
Nov-9
9
May
-00
Nov-0
0
May
-01
Nov-0
1
May
-02
Nov-0
2
May
-03
Nov-0
3
May
-04
Nov-0
4
May
-05
Nov-0
5
May
-06
Whole
sale
Ele
ctri
city
Pri
ce (
2000$/M
WH
)
Levelized Cost of Utility Efficiency AcquisitionsWholesale Market Price

slide 7
Did Meters in the PNW Really Turn Did Meters in the PNW Really Turn Slower?Slower?
14,000
16,000
18,000
20,000
22,000
24,000
1980 1985 1990 1995 2000
Ave
rage M
egaw
att
s
Medium High ForecastMedium Low ForecastMedium High Minus "Booked" ConservationActual

slide 8
Why We’ve Tracked SavingsWhy We’ve Tracked Savings
The Northwest Power and Conservation Act The Northwest Power and Conservation Act established in federal law that cost-effective established in federal law that cost-effective conservationconservation (i.e., the more efficient generation, (i.e., the more efficient generation, transmission or use of electricity) transmission or use of electricity) was to be treated was to be treated as a resourceas a resource equivalent the generation. equivalent the generation.
Since its first Plan in 1983, the Council has set Since its first Plan in 1983, the Council has set “regional conservation “regional conservation savings targetssavings targets” based on its ” based on its integrated resource planning process.integrated resource planning process.
So we track “savings,” not just “expenditures”So we track “savings,” not just “expenditures”

slide 9
How We’re Trying to Standardize Savings EstimationHow We’re Trying to Standardize Savings Estimation(But We’re Not California)(But We’re Not California)
Established An Ongoing Centralized Established An Ongoing Centralized Process for Technical ReviewProcess for Technical Review– Carried out by Carried out by Regional Technical Forum (RTF)Regional Technical Forum (RTF)– RTF composed of utility and non-utility RTF composed of utility and non-utility
engineering and economic experts, staffed by engineering and economic experts, staffed by CouncilCouncil
– Funded by BPA, utilities and system benefits Funded by BPA, utilities and system benefits administratorsadministrators
Public processPublic process RTF builds on historical program RTF builds on historical program
experience and ongoing evaluations of experience and ongoing evaluations of regional acquisition programsregional acquisition programs

slide 10
RTF’s Major FunctionsRTF’s Major Functions Establish a Standardized Regional Cost-Establish a Standardized Regional Cost-
Effectiveness MethodologyEffectiveness Methodology
– Public domain software for evaluating conservation cost-effectivenessPublic domain software for evaluating conservation cost-effectiveness
Recommend Measurement and Verification Recommend Measurement and Verification ProtocolsProtocols– Adding: NAPEE Adding: NAPEE Model Energy Efficiency Program Impact Evaluation Model Energy Efficiency Program Impact Evaluation
Guide, already use IPMVP, FEMP, etc.Guide, already use IPMVP, FEMP, etc.
Develop and Maintain Internet-based System for Develop and Maintain Internet-based System for Tracking and ReportingTracking and Reporting regional conservation savings and regional conservation savings and expendituresexpenditures– Deemed savings (with minimum technical specifications & Q/C criteria)Deemed savings (with minimum technical specifications & Q/C criteria)– EM&V protocolsEM&V protocols– Default inputs for cost-effectiveness evaluations (e.g., forecast of future Default inputs for cost-effectiveness evaluations (e.g., forecast of future
energy prices, cost of deferrable distribution and transmission, value non-energy prices, cost of deferrable distribution and transmission, value non-energy benefits such as water savings, etc.)energy benefits such as water savings, etc.)
– Forecast CO2 content/kWh saved (based on load shape of savings)Forecast CO2 content/kWh saved (based on load shape of savings)
slide 11
RTF’s Major FunctionsRTF’s Major Functions
Process for updating deemed Process for updating deemed savingssavings as technology and standard as technology and standard practices change.practices change.
Appeals processAppeals process through which utilities or through which utilities or other parties can demonstrate that different other parties can demonstrate that different savings and value estimates should apply.savings and value estimates should apply.
Collaborative Development of EM&V Collaborative Development of EM&V designsdesigns for conservation programs for conservation programs operated across multiple utility service areasoperated across multiple utility service areas

slide 12
The RTF The RTF cannot and cannot and
does not does not require use of require use of
its deemed its deemed savings values savings values
nor does it nor does it mandate or mandate or
oversee EM&V!oversee EM&V!
However - The RTF Doesn’t Count However - The RTF Doesn’t Count VotesVotes

slide 13
What Power Planners Don’t What Power Planners Don’t Worry AboutWorry About
AttributionAttribution Net-to-Gross Net-to-Gross
AdjustmentsAdjustments
–Free-RidershipFree-Ridership
–Non-Participant Non-Participant Spill OverSpill Over
slide 14
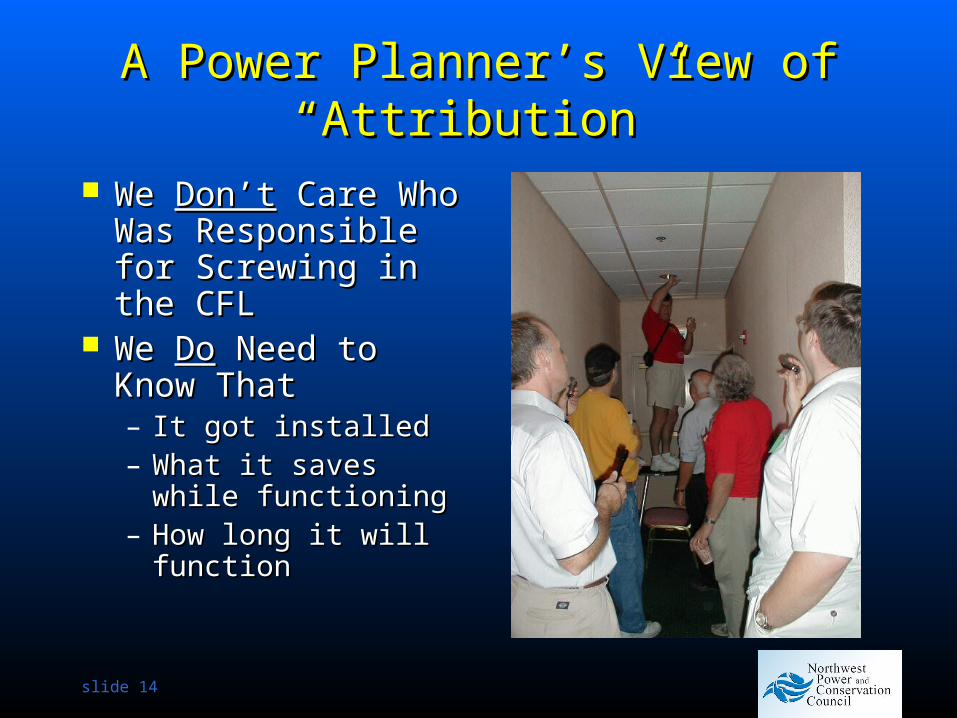
A Power Planner’s View of A Power Planner’s View of “Attribution”“Attribution”
We We Don’tDon’t Care Who Care Who Was Responsible for Was Responsible for Screwing in the CFLScrewing in the CFL
We We DoDo Need to Need to Know ThatKnow That– It got installedIt got installed– What it saves while What it saves while
functioningfunctioning– How long it will How long it will
functionfunction

A Power Planner’s View of the Derivation of “Net-to-Gross” Ratios

slide 16
Some Thoughts on Some Thoughts on Net-to-Gross Net-to-Gross Adjustment for RegulatorsAdjustment for Regulators
Reductions in CO2 Reductions in CO2 emissions from the emissions from the actions “free-riders” actions “free-riders” counts toward climate counts toward climate mitigation just as much mitigation just as much as the actions of as the actions of “participants”“participants”
Utilities might just be Utilities might just be interested in this when interested in this when CO2 emissions are CO2 emissions are “monetized”“monetized”

slide 17
Some Thoughts on Some Thoughts on Net-to-Gross Net-to-Gross Adjustment for RegulatorsAdjustment for Regulators
When program or When program or portfolio “cost-portfolio “cost-effectiveness” is effectiveness” is determined using a determined using a total societal cost total societal cost (TSC) or total (TSC) or total resource cost (TRC) resource cost (TRC) test savings from test savings from “free-riders” should “free-riders” should be countedbe counted

A Concluding Thought onA Concluding Thought on Net-to-Gross Net-to-Gross AdjustmentsAdjustments
From a Climate Change, Power Planning and TRC From a Climate Change, Power Planning and TRC Perspective There Is No Such Thing as a “Free-Rider”Perspective There Is No Such Thing as a “Free-Rider”