development and evaluation of a prototype barricade lighting system€¦ · ·...
TRANSCRIPT

118
International Journal for Traffic and Transport Engineering, 2012, 2(2): 118 – 132
DEVELOPMENT AND EVALUATION OF A PROTOTYPE BARRICADE LIGHTING SYSTEM
John Donovan Bullough1, Jeremy David Snyder2, Nicholas Paul Skinner3, Mark Stanley Rea4
1, 2, 3, 4 Lighting Research Center, Rensselaer Polytechnic Institute, 21 Union Street, Troy, NY 12180 USA
Received 12 December 2011; accepted 8 May 2012
Abstract: Presently in work zones, standard barricade warning lights are used to provide channelizing and warning functions. These yellow flashing lights are presently used for different work zone activities. Concepts for a non-standard barricade lighting system were developed and evaluated: flashing red lights when traffic is stopped or very slow within a work zone, flashing green lights when a work zone is inactive and traffic should proceed normally, expanding yellow lights when drivers should slow down and exercise enhanced caution, and sweeping yellow lights when lane closures require drivers to move to the right or left. Prototype units were designed and fabricated. A survey of driver understanding of these functions indicated that drivers would probably understand all of the functions but that the flashing red and green functions could result in conflicts with other roadway traffic control devices. A field evaluation of the expanding and sweeping functions in mock-up work zones demonstrated that driver comprehension of the lights could be translated to a driving situation. Drivers changed lanes sooner (providing a 40% longer lane change margin) in response to the sweeping function than to conventional flashing barricade lights, and subjective ratings about the intended meaning of the tested functions were also positive.
Keywords: barricade lights, work zone lighting, driving speed, human factors.
1 Corresponding author: [email protected]
1. Introduction
In 2010, there were 576 deaths at roadway construction and maintenance zones in the United States (National Work Zone Safety Information Clearinghouse, 2010). Work zone deaths represent 2% of all roadway deaths. Between 2003 and 2010, an average of 120 workers per year were killed at road construction sites. These statistics show that it is important to address the safety of drivers and workers at highway work zones. Multiple studies have shown that work zones are more dangerous on a per-mile basis than
the same stretch of highway when there is no construction activity (Hall and Lorenz, 1989; Ha and Nemeth, 1995; Khattak et al., 2002). Qi et al., (2005) conducted a study of work zone crashes in New York State. Overall, these studies found that:
• The presence of construction activity on a roadway increases the likelihood of all crashes by 7% to 119%.
• Rear-end collisions occur more frequently than other types of crashes.
UDC: 625.746.5
119
• Work zone crashes are more likely in areas with higher population density, and along roads with higher annual average daily traffic.
Three common causes of crashes at work zones are “following too close,” “misjudging stopping distance” (Chambless, 2002) and “driver not being in control” (Pegula, 2004). In addition to increasing the likelihood of crashes, work zones can also increase traffic congestion and air pollution. Kusalasai and Yai (2006) estimated that in 2001, work zones caused 350 million hours of travel delays resulting in 570 million gallons of excess fuel consumption. One possible way to reduce crashes and congestion in work zones would be to improve information about traffic conditions within the work zone that could facilitate travel and minimize crashes. For example, ahead of a lane closure, it might be beneficial to indicate which lane they should enter in order to maintain traffic flow. To convey this information, it might be more effective to use intuitive visual indicators (e.g. arrows, graphics) than written messages. This is because intuitive indicators might be understood more readily and more quickly than a textual message. In addition, graphical indicators do not depend upon any specific language use. The present paper describes a study of a simple, proposed barricade lighting system (BLS) using graphical indicators.
2. Background
The effectiveness of flashing lights of various characteristics has been studied in a number of contexts including maintenance vehicle signal lights (Gibbons et al., 2008), automotive signal lights (Bullough et al., 2001a, 2001b, 2002, 2007), aviation lighting (Rea et al., 2009; Bullough, 2011), and warning lights for illuminated displays (Department of
Defense, 1999). For example, in the U.S., Bergum and Bergum (1981) demonstrated that drivers’ comprehension of the meanings of red and green lights was generally very high, with 100% recognizing red as being associated with the concept “stop” and more than 99% recognizing green as indicating “go”. The Department of Defense (1999), in its human factors design standard, requires red to denote “emergency conditions which require operator action to be taken without delay, or to avert impending personnel injury, equipment damage, or both”. Green is required to indicate “that it is all right to proceed”.
A number of studies have been conducted to address the effectiveness of different flash rates for visibility (Bartley, 1951; Brown, 1965; Connors, 1975). Despite a variety of experimental methods used, the results of these studies are consistent with the notion that at nighttime background light levels, there is optimum sensitivity to flash frequencies between 1 and 5 Hz (Rea et al., 2009). At higher levels up to daytime conditions (~5000 cd/m²), the peak temporal sensitivity increases to around 10-15 Hz (De Lange, 1958). It is recommended, however, that flashing light frequencies be kept below 3 Hz to avoid seizures among individuals with photosensitive epilepsy (Harding and Jeavons, 1994) since the peak range of frequencies for inducing seizures in these individuals is from 5 to 30 Hz.
Howard and Finch (1960) determined that a temporally-modulated square wave flashing pattern was more conspicuous than a triangular waveform pattern (i.e., ramping up and then down) for flash durations less than 50 ms. Bullough et al., (2001a) and Bullough (2005) made similar findings, showing that shorter light source rise times led to shorter response times to the signal light onset, in the
Bullough J. D. et al. Development and Evaluation of a Prototype Barricade Lighting System
120
International Journal for Traffic and Transport Engineering, 2012, 2(2): 118 – 132
context of traffic signals and automotive stop lamps. Bullough et al., (2001a, 2002) also showed that “sweeping” a light-emitting diode (LED) or neon light source with a short onset time could result in shorter response times than to an incandescent source that simply turned on at full output. In a study of rear lighting for snowplow trucks, Bullough et al., (2001b) found that closure detection times to a truck equipped with flashing lights were longer than to a truck equipped with steady-burning lights, suggesting that maintaining some steady-burning luminous component has benefits for identifying the relative speed and distance of a signal light.
In a study of rear lighting on highway maintenance vehicles, an array of lights starting with small sizes in the center of the array with increasing sizes toward the periphery of the array was tested (Stout et al., 1993). The intended visual effect was to convey a sense that a driver was approaching the light faster than the actual approach speed. This array was found in field tests to result in sooner, smoother decelerations by drivers approaching the truck, in comparison with conventional flashing lights usually used on these vehicles.
Regarding the use of spatial information to convey direction or the need for changing lanes or taking detours in a roadway situation, See and Schrock (2007) evaluated drivers’
comprehension of traffic control devices such as arrow or chevron panels in situations where a lane closure would be needed. Single and multiple arrows, and single and multiple chevrons were all easily understood by drivers to indicate that they should prepare to change lanes. The direction of lane closure was also readily understood. These data suggest that using directional spatial information can provide drivers with meaningful cues in work zone applications.
3. System Description
Presently in work zones, standard yellow flashing barricade warning lights meeting specifications published by the Institute of Transportation Engineers (ITE, 2001) are used to provide channelization and warning functions. Flash rates are around 1 Hz and the effective intensity is required to be 35 cd. Barricade warning lights are typically circular with a diameter of at least 18 cm.
Four new barricade light configurations were evaluated as part of the proposed barricade lighting system (BLS). Table 1 describes these functional configurations, including situations where they might be used and the anticipated (or desired) driver response behavior. For each of these configurations, the baseline condition was assumed to be a conventional flashing yellow barricade warning light.
Table 1Summary of Potential BLS Functions
Signal function Situation where used Desired driver responseFlashing green light Unoccupied work zone Proceed normally
Flashing red light Stopped or very slow traffic ahead Stop immediately"Sweeping" yellow light (left
to right or right to left) Lane closure Change lanes as soon as possible
"Expanding" yellow light (center to periphery) Occupied/active work zone Slow down
121
All signal colors (red, green and yellow) met present specifications for chromaticity published by the Institute of Transportation Engineers (ITE, 2005) for traffic control signals, and had an effective intensity of 35 cd. The use of green and red colors were included based on the literature suggesting that these colors are well understood by drivers as indicating “go” and “stop” maneuvers (Bergum and Bergum, 1981; Department of Defense, 1999). The sweeping light configuration was included based on the findings that drivers appeared to be able to interpret directional information clearly (See and Schrock, 2007). The expanding light configuration was included based on evidence that drivers might slow down sooner in response to the visual looming effect this light would produce (Stout et al., 1993). An additional possible benefit of the sweeping and expanding configurations is that when set to continually cycle through the sweeping or expanding pattern of light, there would always be some portion of the light “on”, providing a steady-burning component that could help drivers judge the relative distance and position of a work zone equipped with such light configurations (Bullough et al., 2001b).
Red and green BLS functions were developed by using LED spotlight/floodlight luminaires (PAR64 type). These units contain red and green LEDs that can be modulated individually by color. Flashing was achieved by using a timing relay circuit that could flash them at approximately 1 Hz. Because the LEDs were highly directional, the luminaires were fitted with a diffusing material to decrease on-axis output to an effective intensity of 35 cd and to increase the viewing angle.
The sweeping and expanding BLS functions were created through custom-built arrays of yellow LEDs on 18-cm diameter circular
circuit boards. Each board was populated with 125 (for the sweeping BLS) or 126 (for the expanding BLS) LEDs. The LEDs in each of the arrays were divided into six segments so that for the sweeping BLS, each of the segments could be illuminated in turn from left to right or from right to left to create an animated sequence of the signal light face sweeping in either direction. For the expanding BLS, the central ring of LEDs was illuminated first, followed by each subsequent concentric ring to provide an animated appearance that the signal was expanding in size. The speed of the animation was set to provide all six components of the cycle each second.
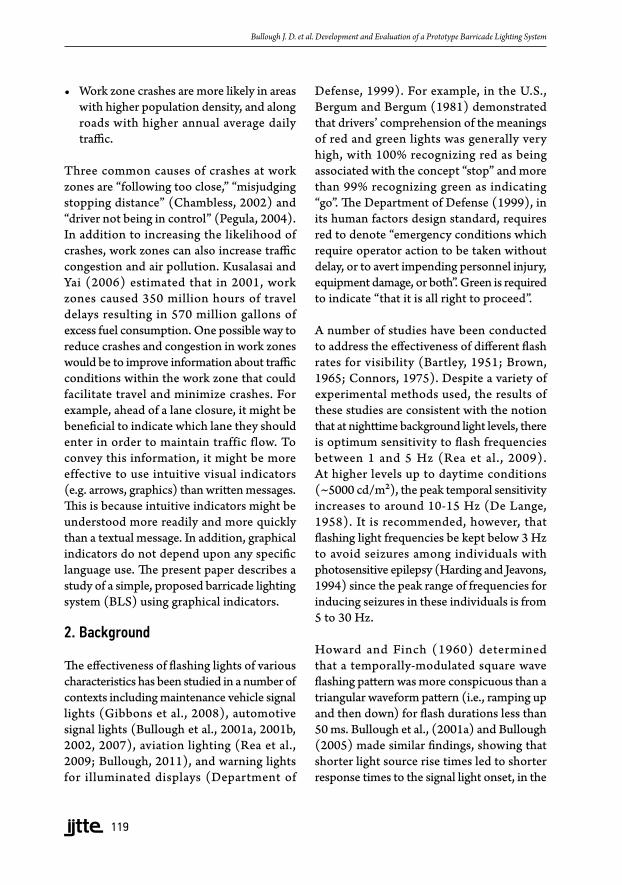
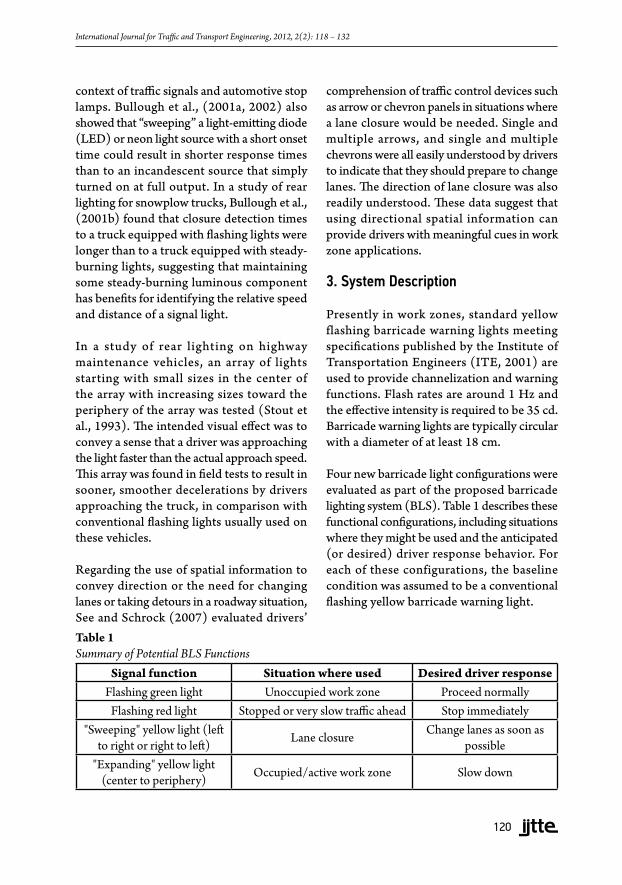
Fig. 1 shows an expanding BLS unit. When operating, the centermost ring of LEDs (1 in the right panel of Fig. 1) was illuminated first, then ring 2, ring 3 and so on while all previous rings remained illuminated. After the outermost ring was illuminated, all six rings were de-energized and the sequence restarted. Fig. 2 shows a sweeping BLS unit. When indicating that traffic should shift lanes to the right, the leftmost group of LEDs (in area 1 in the right panel of Fig. 2) was illuminated first, then area 2, area 3, and so on while all previous areas remained illuminated. After area 6 was illuminated, all six areas were de-energized and the sequence restarted. To indicate that traffic should shift lanes to the left, the opposite sequence was used. Four yellow BLS prototype units of each type (sweeping or expanding) and four units that contained red and green flashing LEDs were constructed. The sweeping and expanding units could also operate in simple flashing mode at 1 Hz (as a conventional flashing barricade warning light would). Further, the sweeping BLS units could be set to sweep either from left to right or from right to left.
Bullough J. D. et al. Development and Evaluation of a Prototype Barricade Lighting System
122
International Journal for Traffic and Transport Engineering, 2012, 2(2): 118 – 132
4. Survey of System Comprehension
Before the field study, in order to assess how drivers might interpret the BLS configurations and to assess potential concerns about the use of each BLS function, a survey questionnaire was developed and distributed to individuals who were knowledgeable about work zone safety. The survey used animated video clips of the BLS functions described in Table 1. Participants in the survey were subscribers to the National Work Zone Safety Information Clearinghouse email discussion list. The survey was developed and conducted online. Participants were asked to view each of the
video clips and to answer a single question for each: What action should a driver take if this light is seen while driving along a highway work zone? Following each question, the following seven possible responses were listed: Slow down, Stop, Proceed, Increase speed, Turn/bear left, Turn/bear right, and Other.
The order of responses was randomized for each respondent and for each question. Participants could only select a single response. If the selection “Other” was made, participants were requested to enter their response in a text box. There were a total of five questions, corresponding to the four
Fig. 1. Photograph (Left) and Drawing (Right) of the Expanding BLS Unit
Fig. 2.Photograph (Left) and Drawing (Right) of the Sweeping BLS Unit

123
BLS functions and to a conventional flashing yellow barricade light. A total of 86 people participated in the survey. This sample size is similar to that used in surveys of graphical message-size symbols (Wang and Clark, 2010) and of sign features on driver comprehension (Ng and Wang, 2008).
4.1. Flashing Yellow
Approximately 67% of the participants selected “Slow Down”, and 8% selected “Proceed”. Just over 24% selected “Other”, the majority of these responses indicated that the driver should use “caution”.
4.2. Flashing Red
A majority of participants, about 62%, selected “Stop” as the response to the flashing red light, with 9% selecting “Slow Down”. “Other” was selected by 29%. Of these responses, there was substantial variation in the reported meaning. Some suggested that a driver should stop and then proceed, some indicated that they simply were not certain what the light was supposed to convey. A number of respondents pointed out that a flashing red light is not a currently-allowed use in a work zone.
4.3. Flashing Green
Most participants, about 71% indicated that the flashing green light meant “Proceed”. A smaller proportion, about 7%, selected “Speed Up” as the intended response, and 1% selected “Slow Down”. About 20% selected “Other” as a choice; of these, most of the responses either were of confusion on the participants’ part regarding the intended meaning, or pointed out that a flashing green should not be used in a work zone.
4.4. Sweeping Yellow
For the sweeping yellow light, 59% correctly indicated that the light meant “Turn/Bear Left”. (No respondents selected “Turn/Bear Right”.) About 20% indicated that it meant drivers should “Slow Down”, and 2% that drivers should “Proceed”. “Other” was selected by 20% of the respondents. Most of these “Other” responses suggested that the light meant to use caution. A few of these responses also stated that the sweeping light would probably look different from a conventional flashing light.
4.5. Expanding Yellow
About 52% of the respondents selected “Slow Down” in response to the expanding yellow light. The “Proceed” option was selected by 9%, while “Increase Speed” and “Stop” were selected by 4% and 1% of the respondents, respectively. Of the 35% of respondents who selected “Other”, most of the responses indicated that a driver should use caution. Two respondents suggested that the expanding animation of the signal would be difficult to see.
4.6. Summary
For each question in the survey, a single answer (different for each BLS function) received a majority of responses. There were a number of concerns about the flashing red and flashing green BLS functions, based on the “Other” responses, however. The use of these colors in active or inactive work zones was strongly discouraged by a number of survey respondents. There was some expressed anxiety about the use of flashing green lights. Although more than two-thirds of the survey respondents indicated that this signal meant
Bullough J. D. et al. Development and Evaluation of a Prototype Barricade Lighting System

124
International Journal for Traffic and Transport Engineering, 2012, 2(2): 118 – 132
“Proceed”, was concern that it could result in confusion by a number of drivers who might not have a clear understanding of what a flashing green signal means. This is consistent with recent research (Factor et al., 2010) that suggested there is significant variability in drivers’ interpretation of a flashing green signal.
In addition, feedback from engineers in the New York State Department of Transportation (NYSDOT) also indicated that there would be a great deal of apprehension about using flashing lights with red or green color in work zones. Primarily this is because of conflicts with the U.S. Manual on Uniform Traffic Control Devices (2009) and concerns about driver comprehension of these signals in a work zone context. In comparison, the same engineers felt that the sweeping and expanding yellow BLS signals had substantial merit and would be less prone to a driver misinterpretation that would lead to an inappropriate driving maneuver in a work zone. For these reasons, the field investigations of the BLS functions focused on the sweeping and expanding yellow lights, in comparison to a conventional flashing yellow warning light.
5. Field Demonstration
In order to assess how drivers would respond to the sweeping and expanding BLS functions, relative to their responses to a conventional yellow flashing barricade warning light, and to demonstrate their performance in a mock-up work zone setting, they were employed in a field study along a controlled test-road location. It was expected that drivers would slow down more in response to the expanding BLS light than to the flashing yellow light, and that they would change lanes (if needed) sooner in response to the sweeping BLS light and find this light clearer in meaning than the flashing yellow light.
5.1. Test Location
The test location used for the field studies was Temple Lane, in the Town of East Greenbush, NY, USA. This is a dead-end road with a business and a single residence at one end of the road, and it largely flat with several straight sections separated by large-radius curves. In cooperation with the Town Supervisor and the Chief of Police, the road was closed to traffic using traffic cones, and the work zone locations were set up on two of the straight sections.
5.2. Setup and Procedure
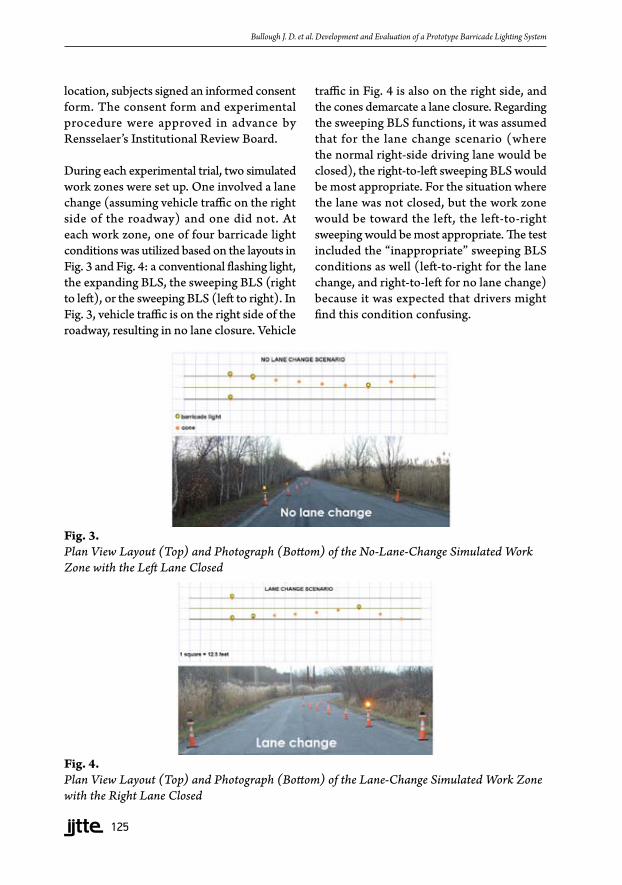
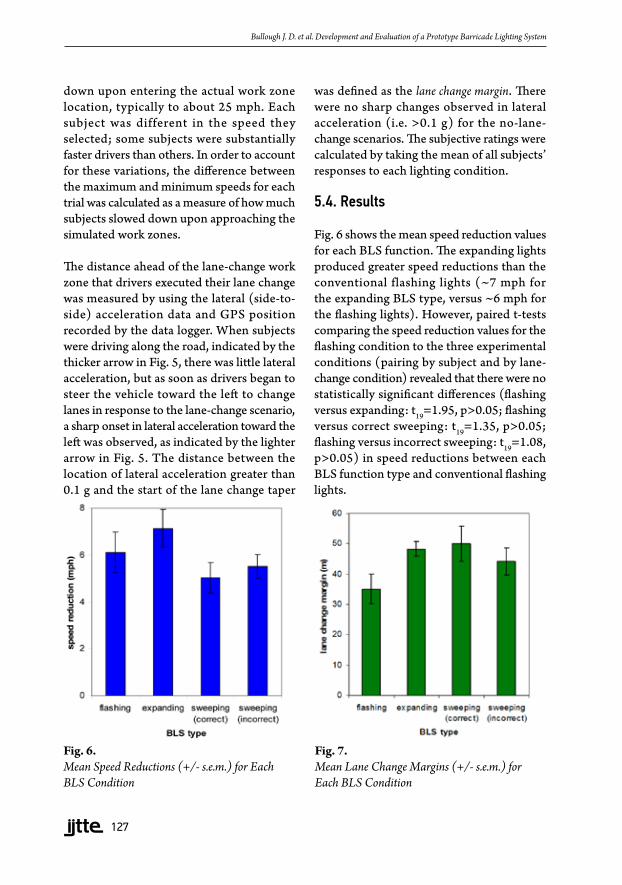
As described above, four sweeping and four expanding BLS prototypes were constructed. These were mounted to traffic cones. Engineering personnel from NYSDOT assisted in the design of simple mock-up work zone locations along the test road. Layouts for work zones requiring a lane change and with no lane changes were developed. The local NYSDOT residency (Rensselaer County, Region 1) provided traffic cones that were used to demarcate the simulated work zones. The layouts are shown in Fig. 3 and Fig. 4, which also show the appearance of each type of simulated work zone from a driver’s perspective.
The experiment occurred during two nighttime sessions, starting after the end of civil twilight, during November 2010. A total of ten experimental subjects (five female, age 23 to 62 years, mean age 49 years, standard deviation 16 years) participated in two groups of five. Similar sample sizes had been demonstrated to provide sufficient statistical power in previous studies of driving performance and visual perception (Akashi et al., 2007; Bullough and Skinner, 2009). Both nighttime sessions occurred during clear weather. Upon arrival at the field study
125
location, subjects signed an informed consent form. The consent form and experimental procedure were approved in advance by Rensselaer’s Institutional Review Board.
During each experimental trial, two simulated work zones were set up. One involved a lane change (assuming vehicle traffic on the right side of the roadway) and one did not. At each work zone, one of four barricade light conditions was utilized based on the layouts in Fig. 3 and Fig. 4: a conventional flashing light, the expanding BLS, the sweeping BLS (right to left), or the sweeping BLS (left to right). In Fig. 3, vehicle traffic is on the right side of the roadway, resulting in no lane closure. Vehicle
traffic in Fig. 4 is also on the right side, and the cones demarcate a lane closure. Regarding the sweeping BLS functions, it was assumed that for the lane change scenario (where the normal right-side driving lane would be closed), the right-to-left sweeping BLS would be most appropriate. For the situation where the lane was not closed, but the work zone would be toward the left, the left-to-right sweeping would be most appropriate. The test included the “inappropriate” sweeping BLS conditions as well (left-to-right for the lane change, and right-to-left for no lane change) because it was expected that drivers might find this condition confusing.
Bullough J. D. et al. Development and Evaluation of a Prototype Barricade Lighting System
Fig. 3. Plan View Layout (Top) and Photograph (Bottom) of the No-Lane-Change Simulated Work Zone with the Left Lane Closed
Fig. 4. Plan View Layout (Top) and Photograph (Bottom) of the Lane-Change Simulated Work Zone with the Right Lane Closed

126
International Journal for Traffic and Transport Engineering, 2012, 2(2): 118 – 132
Each of the work zone situations (lane change or no lane change) were employed with all four of the lighting conditions listed above. The order of conditions that were experienced by the study participants between the two sessions was randomized and counterbalanced so that no condition was more likely to appear near the beginning of a session than any other. With a total of eight conditions, and two work zone locations per trial, each subject completed four experimental trials. After they had driven through both simulated work zones in a single trial, they were instructed to turn the vehicle and return to a rendezvous location where other subjects were waiting to compete their trials.
All subjects were legally licensed drivers and drove the same vehicle (a 1999 Ford Contour with automatic transmission) for all trials. This vehicle was equipped with a global positioning satellite (GPS) antenna and a data logger connected to the vehicle’s on-board computer so that it could measure vehicle speed, distance, location, and acceleration at a frequency of 100 Hz and store the resulting data onto a flash memory card for subsequent analysis. Each trial was conducted in the same way. From the rendezvous location where each trial started, the first work zone setting was not visible until subjects drove around a slight curve. Similarly, the second work zone setting was not visible until subjects had completed driving through the first work zone setting and navigated another slight curve. Subjects were instructed to drive along the road at a comfortable speed and to make any appropriate maneuvers needed to navigate through any work zone situations they might encounter. An experimenter rode with all subjects during all experimental trials, and after each simulated work zone had been driven through, asked each subject to rate how clear the meaning of the work zone signal
lights was (not how clearly seen the lights were), using a scale of 1 to 4 (1: very unclear, 2: somewhat unclear, 3: somewhat clear, 4: very clear).
Between trials, experimenters rearranged traffic cones and lights at each work zone location. Each experimental session took approximately 90 minutes, to complete all twenty trials (five subjects and four trials per subject) for each session.
5.3. Outcome Measures
Three dependent measures were utilized: the reduction in speed when approaching the work zone location, the distance ahead of the work zone that the driver changed lanes (only for the lane change scenarios), and the subjective rating of the clearness of the signal light meaning. Through the data logger software, it was possible to identify the driving speeds throughout each experimental session. Observations of the speed data for each subject revealed similar driving speed patterns for each trial. Along the straight portion of road leading up to the work zone location, drivers accelerated to some maximum speed, typically around 30 mph, and then slowed
Fig. 5. Determination of Lane Change Margin
127
Bullough J. D. et al. Development and Evaluation of a Prototype Barricade Lighting System
down upon entering the actual work zone location, typically to about 25 mph. Each subject was different in the speed they selected; some subjects were substantially faster drivers than others. In order to account for these variations, the difference between the maximum and minimum speeds for each trial was calculated as a measure of how much subjects slowed down upon approaching the simulated work zones.
The distance ahead of the lane-change work zone that drivers executed their lane change was measured by using the lateral (side-to-side) acceleration data and GPS position recorded by the data logger. When subjects were driving along the road, indicated by the thicker arrow in Fig. 5, there was little lateral acceleration, but as soon as drivers began to steer the vehicle toward the left to change lanes in response to the lane-change scenario, a sharp onset in lateral acceleration toward the left was observed, as indicated by the lighter arrow in Fig. 5. The distance between the location of lateral acceleration greater than 0.1 g and the start of the lane change taper
was defined as the lane change margin. There were no sharp changes observed in lateral acceleration (i.e. >0.1 g) for the no-lane-change scenarios. The subjective ratings were calculated by taking the mean of all subjects’ responses to each lighting condition.
5.4. Results
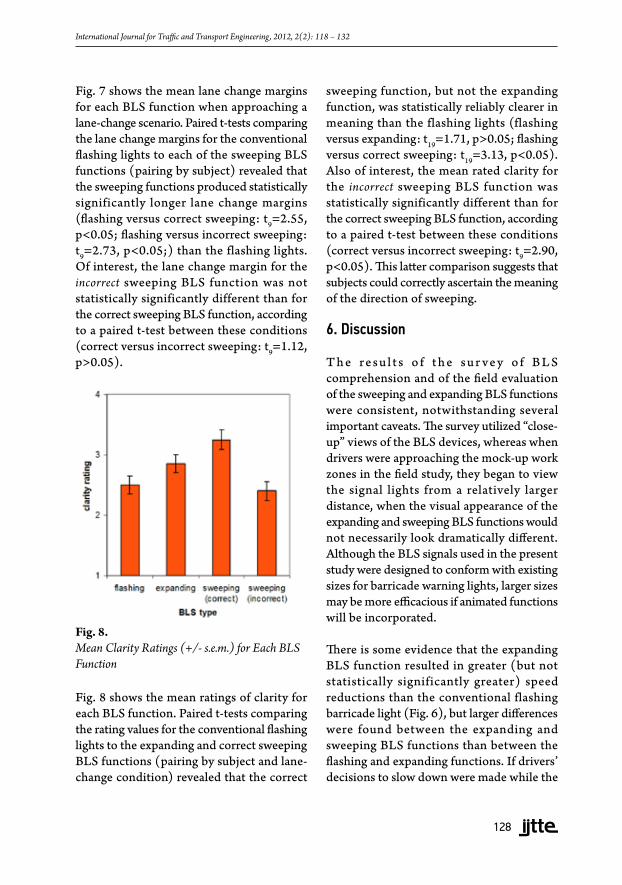
Fig. 6 shows the mean speed reduction values for each BLS function. The expanding lights produced greater speed reductions than the conventional flashing lights (~7 mph for the expanding BLS type, versus ~6 mph for the flashing lights). However, paired t-tests comparing the speed reduction values for the flashing condition to the three experimental conditions (pairing by subject and by lane-change condition) revealed that there were no statistically significant differences (flashing versus expanding: t19=1.95, p>0.05; flashing versus correct sweeping: t19=1.35, p>0.05; flashing versus incorrect sweeping: t19=1.08, p>0.05) in speed reductions between each BLS function type and conventional flashing lights.
Fig. 6. Mean Speed Reductions (+/- s.e.m.) for Each BLS Condition
Fig. 7. Mean Lane Change Margins (+/- s.e.m.) for Each BLS Condition
128
International Journal for Traffic and Transport Engineering, 2012, 2(2): 118 – 132
Fig. 7 shows the mean lane change margins for each BLS function when approaching a lane-change scenario. Paired t-tests comparing the lane change margins for the conventional flashing lights to each of the sweeping BLS functions (pairing by subject) revealed that the sweeping functions produced statistically significantly longer lane change margins (flashing versus correct sweeping: t9=2.55, p<0.05; flashing versus incorrect sweeping: t9=2.73, p<0.05;) than the flashing lights. Of interest, the lane change margin for the incorrect sweeping BLS function was not statistically significantly different than for the correct sweeping BLS function, according to a paired t-test between these conditions (correct versus incorrect sweeping: t9=1.12, p>0.05).
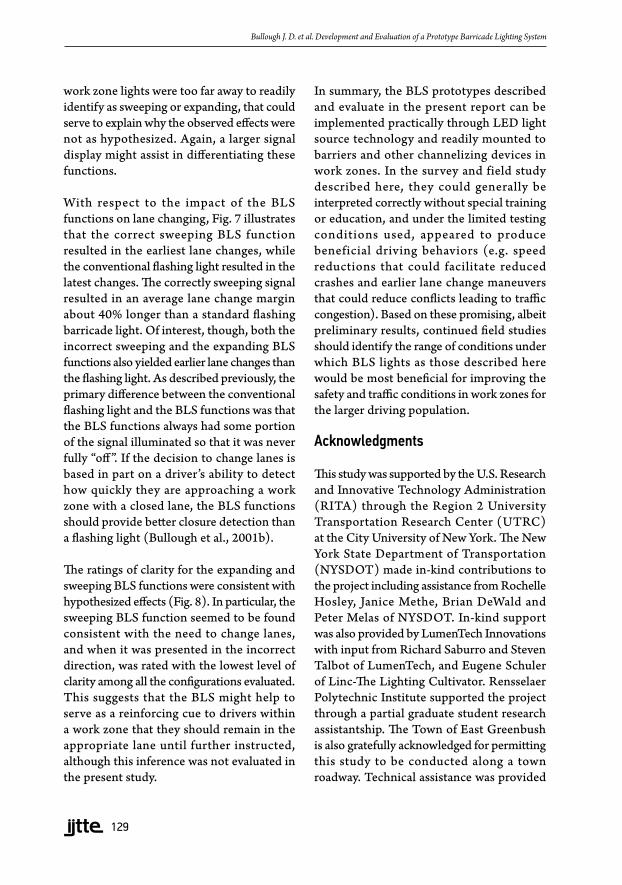
Fig. 8 shows the mean ratings of clarity for each BLS function. Paired t-tests comparing the rating values for the conventional flashing lights to the expanding and correct sweeping BLS functions (pairing by subject and lane-change condition) revealed that the correct
sweeping function, but not the expanding function, was statistically reliably clearer in meaning than the flashing lights (flashing versus expanding: t19=1.71, p>0.05; flashing versus correct sweeping: t19=3.13, p<0.05). Also of interest, the mean rated clarity for the incorrect sweeping BLS function was statistically significantly different than for the correct sweeping BLS function, according to a paired t-test between these conditions (correct versus incorrect sweeping: t9=2.90, p<0.05). This latter comparison suggests that subjects could correctly ascertain the meaning of the direction of sweeping.
6. Discussion
T h e re s u l t s o f t h e s u r ve y o f B L S comprehension and of the field evaluation of the sweeping and expanding BLS functions were consistent, notwithstanding several important caveats. The survey utilized “close-up” views of the BLS devices, whereas when drivers were approaching the mock-up work zones in the field study, they began to view the signal lights from a relatively larger distance, when the visual appearance of the expanding and sweeping BLS functions would not necessarily look dramatically different. Although the BLS signals used in the present study were designed to conform with existing sizes for barricade warning lights, larger sizes may be more efficacious if animated functions will be incorporated.
There is some evidence that the expanding BLS function resulted in greater (but not statistically significantly greater) speed reductions than the conventional flashing barricade light (Fig. 6), but larger differences were found between the expanding and sweeping BLS functions than between the flashing and expanding functions. If drivers’ decisions to slow down were made while the
Fig. 8. Mean Clarity Ratings (+/- s.e.m.) for Each BLS Function
129
Bullough J. D. et al. Development and Evaluation of a Prototype Barricade Lighting System
work zone lights were too far away to readily identify as sweeping or expanding, that could serve to explain why the observed effects were not as hypothesized. Again, a larger signal display might assist in differentiating these functions.
With respect to the impact of the BLS functions on lane changing, Fig. 7 illustrates that the correct sweeping BLS function resulted in the earliest lane changes, while the conventional flashing light resulted in the latest changes. The correctly sweeping signal resulted in an average lane change margin about 40% longer than a standard flashing barricade light. Of interest, though, both the incorrect sweeping and the expanding BLS functions also yielded earlier lane changes than the flashing light. As described previously, the primary difference between the conventional flashing light and the BLS functions was that the BLS functions always had some portion of the signal illuminated so that it was never fully “off”. If the decision to change lanes is based in part on a driver’s ability to detect how quickly they are approaching a work zone with a closed lane, the BLS functions should provide better closure detection than a flashing light (Bullough et al., 2001b).
The ratings of clarity for the expanding and sweeping BLS functions were consistent with hypothesized effects (Fig. 8). In particular, the sweeping BLS function seemed to be found consistent with the need to change lanes, and when it was presented in the incorrect direction, was rated with the lowest level of clarity among all the configurations evaluated. This suggests that the BLS might help to serve as a reinforcing cue to drivers within a work zone that they should remain in the appropriate lane until further instructed, although this inference was not evaluated in the present study.
In summary, the BLS prototypes described and evaluate in the present report can be implemented practically through LED light source technology and readily mounted to barriers and other channelizing devices in work zones. In the survey and field study described here, they could generally be interpreted correctly without special training or education, and under the limited testing conditions used, appeared to produce beneficial driving behaviors (e.g. speed reductions that could facilitate reduced crashes and earlier lane change maneuvers that could reduce conflicts leading to traffic congestion). Based on these promising, albeit preliminary results, continued field studies should identify the range of conditions under which BLS lights as those described here would be most beneficial for improving the safety and traffic conditions in work zones for the larger driving population.
Acknowledgments
This study was supported by the U.S. Research and Innovative Technology Administration (RITA) through the Region 2 University Transportation Research Center (UTRC) at the City University of New York. The New York State Department of Transportation (NYSDOT) made in-kind contributions to the project including assistance from Rochelle Hosley, Janice Methe, Brian DeWald and Peter Melas of NYSDOT. In-kind support was also provided by LumenTech Innovations with input from Richard Saburro and Steven Talbot of LumenTech, and Eugene Schuler of Linc-The Lighting Cultivator. Rensselaer Polytechnic Institute supported the project through a partial graduate student research assistantship. The Town of East Greenbush is also gratefully acknowledged for permitting this study to be conducted along a town roadway. Technical assistance was provided
130
International Journal for Traffic and Transport Engineering, 2012, 2(2): 118 – 132
by Terence Klein and Anna Lok from the Lighting Research Center. Richard Pysar designed and programmed the sweeping and expanding BLS prototype units.
References
Akashi, Y.; Rea, M.S.; Bullough, J.D. 2007. Driver decision making in response to peripheral moving targets under mesopic light levels. Lighting Research and Technology 39 (1): 53-67.
Bartley, S.H. 1951. Intermittent photic stimulation at marginal intensity levels. Journal of Psychology 32 (2): 217-223.
Bergum, B.O.; Bergum, J.E. 1981. Population stereotypes: An attempt to measure and define. In Proceedings of the Human Factors Society 25th Annual Meeting, Santa Monica: 662-665.
Brown, J.L. 1965. Flicker and intermittent stimulation. In Vision and Visual Perception. Wiley, USA.
Bullough, J.D. 2005. Onset times and the detection of colored signal lights. Transportation Research Record 1918/2005: 123-127.
Bullough, J.D. 2011. Aviation signal lighting: Impacts of lighting characteristics on visibility. Advances in Applied Science Research 2(1): 16-27.
Bullough, J.D.; Skinner, N.P. 2009. Predicting stopping distances under different types of headlamp illumination. In Proceedings of the 8th International Symposium on Automotive Lighting, 733-740.
Bullough, J.D.; Derlofske, J.V.; Yan, H. 2001a. Evaluation of automotive stop lamps using incandescent and sweeping neon and LED sources. In Lighting Technology Developments for Automobiles. Society of Automotive Engineers, USA.
Bullough, J.D.; Rea, M.S.; Pysar, R.M.; Nakhla, H.K.; Amsler, D.E. 2001b. Rear lighting configurations for winter maintenance vehicles. In Proceedings of the Illuminating Engineering Society of North America Annual Conference, 87-94.
Bullough, J.D.; Yan, H.; Derlofske, J.V. 2002. Effects of sweeping, color and luminance distribution on response to automotive stop lamps. In Advanced Lighting Technology for Vehicles. Society of Automotive Engineers, USA, 179-183.
Bullough, J.D.; Derlofske, J.V.; Kleinkes, M. 2007. Rear signal lighting: From research to standards, now and in the future. In Automotive Lighting Technology and Human Factors in Driver Vision and Lighting. Society of Automotive Engineers, USA, 157-166.
Chambless, J. 2002. Multistate work zone crash characteristics. ITE Journal 5: 46-50.
Connors, M.M. 1975. Conspicuity of Target Lights: The Influence of Flash Rate and Brightness. National Aeronautics and Space Administration, USA, 17 p.
De Lange, H. 1958. Research into the dynamic nature of the human fovea-cortex systems with intermittent and modulated light: II. Phase shift in brightness and delay in color perception. Journal of the Optical Society of America 48 (11): 784-789.
Department of Defense. 1999. Design Criteria Standard: Human Engineering. Department of Defense, USA, 210 p.
Factor, R.; Prashker, J.N.; Mahalel, D. 2010. The flashing green light paradox. In Proceedings of the Transportation Research Board 89th Annual Meeting.
Gibbons, R.B.; Lee, S.E.; Williams, B.; Miller, C.C. 2008. Selection and Application of Warning Lights on Roadway Operations Equipment. Transportation Research Board, USA.
Ha, T.J.; Nemeth, Z.A. 1995. Detailed study of accident experience in construction and maintenance zones. Transportation Research Record (1509): 38-45.
Hall, J.W.; Lorenz, V.M. 1989. Characteristics of construction-zone accidents. Transportation Research Record (1230): 20-27.
Harding, G.F.A.; Jeavons, P.M. 1994. Photosensitive Epilepsy. MacKeith Press, UK, 192 p.

131
Bullough J. D. et al. Development and Evaluation of a Prototype Barricade Lighting System
Howard, J.; Finch, D.M. 1960. Visual characteristics of flashing roadway hazard warning devices. In Proceedings of the 39th Annual Meeting of the Highway Research Board.
Institute of Transportation Engineers. 2001. Purchase Specification for Flashing and Steady Burn Warning Lights. Institute of Transportation Engineers, USA.
Institute of Transportation Engineers. 2005. Vehicle Traffic Control Signal Heads: Light Emitting Diode Circular Signal Supplement. Institute of Transportation Engineers, USA.
Khattak, A.J.; Khattak, A.J.; Council F.M. 2002. Effects of work zone presence on injury and non-injury crashes. Accident Analysis and Prevention 34 (1): 19-29.
Kusalasai, S.; T. Yai. 2006. Review of work zone impact mitigation techniques: Achieving the objective of reducing vehicle emission. In Symposium on Infrastructure Development and the Environment, Quezon City, Philippines.
Manual on Uniform Traffic Control Devices. 2009. Manual on Uniform Traffic Control Devices 2009 Edition. Federal Highway Administration, USA.
National Work Zone Safety Information Clearinghouse. 2010. Fatalities in Motor Vehicle Traffic Crashes by State and Construction/Maintenance Zone 2010. National Work Zone Safety Information Clearinghouse, USA.
Ng, A.W.Y; Wang, H.S. 2008. The effects of driver factors and sign features on the comprehensibility of traffic signs. Journal of Safety Research 39 (3): 321-328.
Pegula, S. 2004. Fatal occupational injuries at road construction sites. Monthly Labor Review 12: 43-47.
Qi, Y.; Srinivason, H.T.; Baker, R.F. 2005. Frequency of Work Zone Accidents on Construction Projects. New York State Department of Transportation, USA.
Rea, M.S.; Yuan, Z.; Bierman, A. 2009. The unified system of photometry applied to remote airfield lighting. Lighting Research and Technology 41(1): 51-70.
See, C.F.; Schrock, S.D. 2007. Focus group participants’ understanding of advance warning arrow displays used in short-term and moving work zones. In Proceedings of the 2007 Mid-Continent Transportation Research Symposium, Ames, IA: Iowa State University.
Stout, D.; Graham, J.; Fish, J.; Hanscom, F. 1993. Maintenance Work Zone Safety Devices Development and Evaluation. Washington, DC: Transportation Research Board, USA.
Wang, J.-H.; Clark, A. 2010. Employing Graphic-Aided DMS to Assist Elder Drivers’ Message Comprehension. Fall River, MA: New England Transportation Consortium.
132
International Journal for Traffic and Transport Engineering, 2012, 2(2): 118 – 132
RAZVOJ I PROCENA PROTOTIPNOG SISTEMA SVETLOSNIH OZNAKA NA OGRADAMA John Donovan Bullough, Jeremy David Snyder, Nicholas Paul Skinner, Mark Stanley Rea
Sažetak: Trenutno se na ogradama u zonama radova koriste standardna svetla upozorenja koja imaju funkcije usmeravanja i upozoravanja. Ova trepćuća žuta svetla u zonama radova danas se koriste u različite svrhe. Razvijeni su i procenjeni koncepti nestandardnih sistema svetlosne signalizacije na ogradama: trepćuća crvena svetla kada je u zoni radova saobraćaj zaustavljen ili veoma spor, trepćuća zelena svetla kada zona radova nije aktivna i kada se saobraćaj odvija normalno, žuta svetla koja se šire kada vozači treba da uspore i pojačaju pažnju, i putujuće žuto svetlo kada zatvaranje trake zahteva da se vozači pomere udesno ili ulevo. Projektovane su i proizvedene prototipne jedinice. Anketa među vozačima o razumevanju ovih funkcija prikazana u radu pokazala je da bi ih vozači verovatno sve razumeli, ali da trepćuće crvene i zelene funkcije mogu da izazovu konflikt u odnosu na druge uređaje za upravljanje saobraćajem na putu. Terenska procena o funkcijama svetala koja se šire ili putuju u zonama radova na maketi pokazala je da se način na koji vozači razumeju svetlosne signale može preneti i na stvarnu situaciju u vožnji. Reagujući na putujuću funkciju svetla vozači su se ranije prestrojavali (pri čemu je prostor za prestrojavanje u drugu traku bio za 40% duži) u odnosu na konvencionalno trepćuće svetlo na ogradama, dok su subjektivne procene o nameravanom značenju testiranih funkcija takođe bile pozitivne.
Ključne reči: svetla na ogradama, osvetljavanje zone radova, brzina vožnje, ljudski faktor.