development and evaluation of urine based rapid molecular ... · out of the department of...
TRANSCRIPT
Out of the
Department of Infectious Disease and Tropical Medicine
Medical Centre of the University of Munich (LMU),
Development and Evaluation of Urine based Rapid Molecular
Diagnostic Test for Pulmonary Tuberculosis with Potential for Point of
Care: Cape Town Cohort
Doctoral Thesis
for the awarding of a Doctor of Philosophy (Ph.D.)
at the Medical Faculty of
Ludwig-Maximilians-Universität, Munich
Submitted by
Krutarth Patel,
born in
Surat, India.
Submitted on
28. April 2017
2
Supervisors LMU: Title, first name, last name
Habilitated Supervisor Prof. Dr. Michael Hoelscher
Direct Supervisor Dr. rer. nat. Christof Geldmacher, PD
SupervisorExternal:
Local Supervisor Dr. Ines Labugger
Reviewing Experts:
1st Reviewer Prof. Dr. Michael Hoelscher
2nd Reviewer Dr. rer. nat. Christof Geldmacher, PD
Dean: Prof. Dr. med. dent. Reinhard Hickel
Date of Oral Defense: 23. November 2017
3
ABSTRACT
Background: Current sputum-based diagnostic tests for tuberculosis (TB) do not serve
all target populations, making optimal diagnosis difficult. TB diagnosis among scarce
sputum patients is challenging for timely diagnosis and treatment initiation. Thus, an
alternative non-sputum-based diagnostic test is urgently needed. Mycobacterium tuber-
culosis (MTB)-specific transrenal (Tr) DNA from urine is a potential target for molecular
testing to close this gap in TB diagnosis. The objective of this cross-sectional study was
to evaluate the accuracy of a novel, molecular test using a portable fully-automatic
analyser with the potential for usage in limited resource settings at the point of care.
Materials/Methods: Spot urine, blood and sputum samples from 428 adults with sus-
pected pulmonary TB (164 HIV positive, 263 HIV-negative) were collected at three clini-
cal sites in Cape Town, South Africa. Tr-DNA was isolated from 4 ml of EDTA urine us-
ing an in-house method optimised for DNA fragments larger than 38 bp. A rapid double-
stranded primer-based real-time PCR method targeting an MTB-specific direct repeat
region was applied for Tr-DNA identification. The eluate was tested in triplicate using an
automated molecular analyser with assay process controls included in each test run.
The Tr-DNA-based test had a short time to result of 45 minutes including DNA isolation.
Results: Liquid cultures were performed on 412 of the 428 TB suspects. Of these,
175/412 (42.5%) were microbiologically positive. Using liquid culture as gold standard,
the Tr-DNA test showed sensitivity of 42.86% (95% CI: 35.42 – 50.54) and specificity of
86.61% (95% CI: 83.86 – 92.36). The Tr-DNA test had positive predictive value of 73.53%
and negative predictive value of 67.74%. Among HIV-infected TB patients, the sensitivi-
ty and specificity were 45.24% and 89.04%, respectively. Combination of smear micros-
copy and Tr-DNA increased the sensitivity to 83.82% (smear microscopy alone was
75.14%); the specificity remained unchanged (96.61%).
Conclusions: This multi-centre proof of concept study indicates that Tr-DNA has a high
specificity and modest sensitivity. Furthermore, future study should be performed on
larger cohort not restricted to pulmonary TB using fresh urine samples with patient fol-
low up. Although unsuitable for implementation as a stand-alone test, it may have the
potential, in combination with smear microscopy, to aid TB diagnosis in HIV-endemic
regions where sputum scarce and extra-pulmonary TB are common.
Keywords: Pulmonary tuberculosis, urine, transrenal DNA, diagnosis, PCR, HIV
4
Table of Contents
ABSTRACT ..................................................................................................................... 3
List of Figures .................................................................................................................. 8
List of Tables ................................................................................................................. 11
1. Introduction ............................................................................................................. 16
1.1 Tuberculosis ..................................................................................................... 16
1.2 Epidemiology of tuberculosis ............................................................................ 16
1.3 Tuberculosis vaccine ........................................................................................ 18
1.4 Tuberculosis disease diagnosis ........................................................................ 18
1.5 Biomarker for tuberculosis diagnosis ................................................................ 20
1.6 Problem statement ........................................................................................... 20
1.7 Rationale, goals, and objectives ....................................................................... 21
1.7.1 Rationale .................................................................................................. 21
1.7.2 Goals ........................................................................................................ 22
1.7.3 Objective .................................................................................................. 22
2 Materials ................................................................................................................. 23
2.1 Instruments, commercial kits, reagents and consumables ............................... 23
2.2 DNA fragments ................................................................................................. 25
2.3 Urine samples from healthy control cohort ....................................................... 26
3 Methods .................................................................................................................. 27
3.1 Study design ..................................................................................................... 27
3.1.1 Study cohort ............................................................................................. 27
3.1.1.1 Inclusion/exclusion criteria ..................................................................................... 27
3.1.2 Study period and sites .............................................................................. 28
3.1.3 Ethical approval ........................................................................................ 28
3.1.4 Sample collection, storage and processing .............................................. 28
3.2 Sputum microbiology ........................................................................................ 29
5
3.3 HIV screening and CD4 cell count .................................................................... 30
3.4 Dipstick test for urine characterisation .............................................................. 31
3.5 DNA concentration measurement using the PicoGreen method ...................... 31
3.6 Polymerase chain reaction using the standard PCR cycler approach .............. 31
3.7 PCR analysis of synthetic DNA fragments ....................................................... 33
3.8 Gel electrophoresis........................................................................................... 33
3.9 QIAamp circulating nucleic acid method ........................................................... 33
3.10 In-house Tr-DNA isolation method ................................................................ 35
3.10.1 Binding and elution principle of the in-house method ............................... 37
3.10.2 In-house Tr-DNA isolation method optimisation ....................................... 39
3.10.2.1 Optimisation of urine and reagent volume ........................................................... 39
3.10.2.2 Isolation method ability to recover DNA from spiked urine ............................... 40
3.10.2.3 Influence of inhibitors and urine samples on PCR efficiency ............................ 40
3.10.2.4 Influence of eluate volume on PCR efficiency ..................................................... 41
3.10.2.5 Influence of eluate dilution on PCR efficiency ..................................................... 41
3.10.3 Tr-DNA isolation using an optimised in-house developed method ........... 42
3.11 Novel and rapid polymerase chain reaction using an automated analyser ... 43
3.11.1 Array layout for the Alere q cartridge ........................................................ 45
3.11.2 PCR primer design for the DR target region ............................................. 46
3.11.3 PCR reaction mix for detection of MTB-specific Tr-DNA using DR target 47
3.12 Quantification of Tr-DNA using IS6110 and DR target amplification ............. 48
3.13 Controls and precautions to prevent contamination ...................................... 49
3.14 Statistical analysis ......................................................................................... 50
4 Results .................................................................................................................... 51
4.1 Optimisation of the in-house developed Tr-DNA isolation method ....................... 51
4.1.1 Result of synthetic DNA fragment and H37Rv analyses ........................... 51
4.1.2 Optimisation of urine and reagent volumes .............................................. 53
4.1.3 DNA content measurement for urine samples .......................................... 54
6
4.1.4 DNA recovery from spiked urine samples ................................................ 55
4.1.5 Purity of PCR products ............................................................................. 56
4.1.6 Evaluation of PCR efficiency .................................................................... 57
4.1.7 Influence of urine sample on PCR efficiency ............................................ 58
4.1.8 Effect of eluate volume on PCR efficiency ................................................ 59
4.1.9 Effect of eluate dilution on PCR efficiency ................................................ 60
4.1.10 Performance comparison of two Tr-DNA isolation method using clinical
samples 61
4.2 Study cohort demographic characteristics ........................................................ 62
4.3 Laboratory testing for TB diagnosis .................................................................. 65
4.4 Characterisation of urine sample ...................................................................... 66
4.5 Implementation and optimisation of PCR method using Alere q ....................... 68
4.6 Detection of Internal Process Control ............................................................... 71
4.7 Calibration curve for target amplification using IS6110 and DR ....................... 71
4.8 DNA isolation and quantification from clinical samples ..................................... 72
4.9 Performance comparison of IS6110 and DR target using clinical samples ...... 73
4.10 Evaluation of cross-contamination ................................................................ 75
4.11 Evaluation of Alere q analyser performance .................................................. 76
4.12 Risk factors for Tr-DNA positive test results in clinical samples .................... 77
4.13 Sensitivity and specificity of Tr-DNA assay using DR target ......................... 78
5 Discussion ............................................................................................................... 85
6 Conclusion .............................................................................................................. 87
7 References .............................................................................................................. 89
8 Annex ...................................................................................................................... 95
Appendix-1 Case Reporting Form .............................................................................. 95
Appendix-2 Sequence information for the IS6110 target region present in the H37Rv
Genome for possible primer binding and detection .................................................. 103
List of Publication(s) ................................................................................................. 104
7
Statement on Pre-release and Contribution ............................................................. 105
Acknowledgments .................................................................................................... 106
Affidavit .................................................................................................................... 107
8
List of Figures
Figure 1.1: Global trends of TB incidence, prevalence, and mortality between 1990 and
2014 .............................................................................................................................. 17
Figure 1.2: Estimated TB incidence rates in 2014 ......................................................... 17
Figure 3.1: Overview of patient study enrolment and sample collection (blood, urine, and
sputum).......................................................................................................................... 28
Figure 3.2: Schematic of diagnostic algorithm used for microbiology testing using
sputum ........................................................................................................................... 30
Figure 3.3: Material required to perform nucleic acid isolation using the Qiagen method
...................................................................................................................................... 34
Figure 3.4: Overview of nucleic acid isolation protocol using the Qiagen method
(QIAamp) ....................................................................................................................... 35
Figure 3.5: Materials required to perform manual nucleic acid isolation using the in-
house method ................................................................................................................ 36
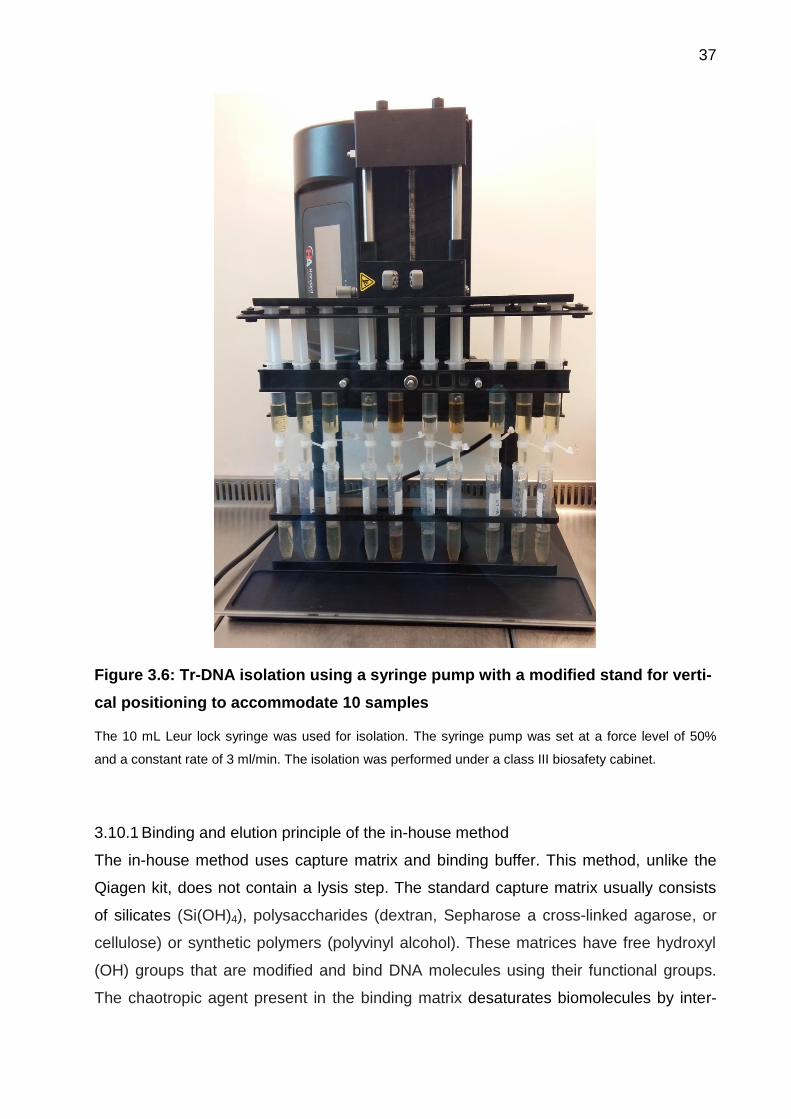
Figure 3.6: Tr-DNA isolation using a syringe pump with a modified stand for vertical
positioning to accommodate 10 samples ....................................................................... 37
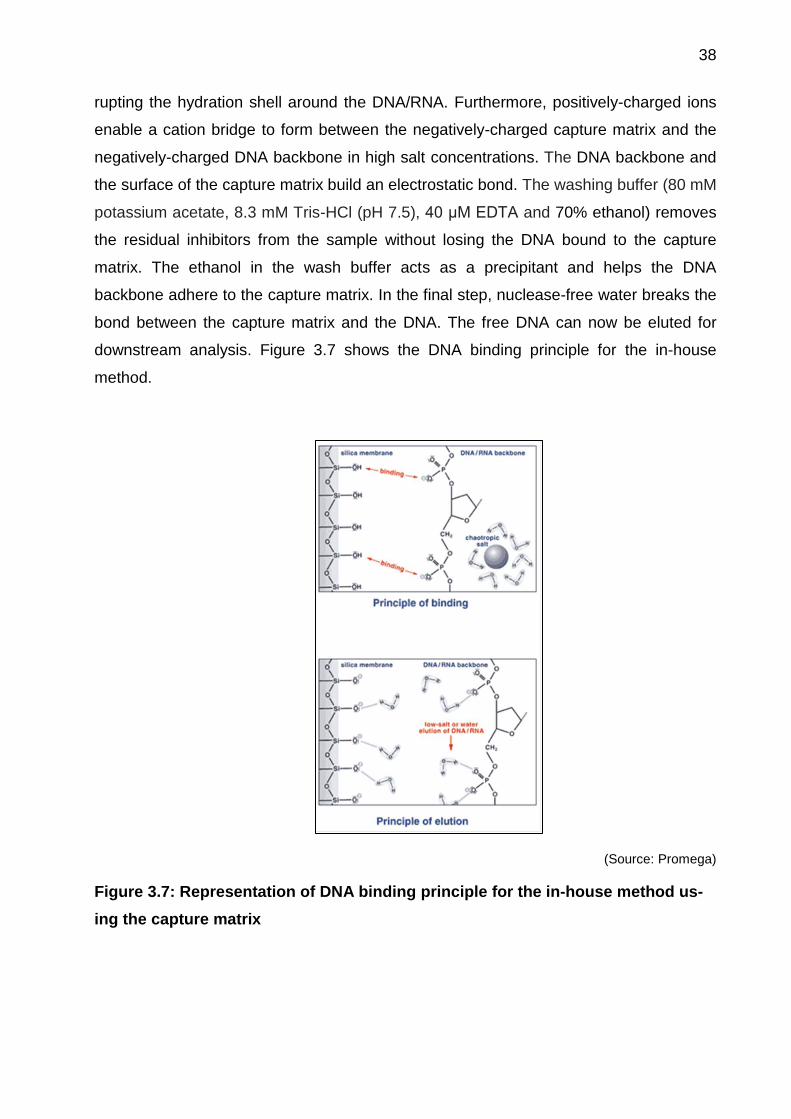
Figure 3.7: Representation of DNA binding principle for the in-house method using the
capture matrix ................................................................................................................ 38
Figure 3.8: Overview of Tr-DNA isolation protocol for the in-house method .................. 42
Figure 3.9: Automated molecular analyser the “Alere q” and a single-use assay
cartridge......................................................................................................................... 43
Figure 3.10: Schematic diagram of the double-stranded primer-based PCR principle .. 44
Figure 3.11: Array layout for a single-use Alere q cartridge microarray chip ................. 45
Figure 3.12: Process controls implemented in the Tr-DNA assay ................................. 46
Figure 3.13: Direct repeat (DR) region located in the Mycobacterium tuberculosis
genome. This DR region is 4392 bp in length. ............................................................... 47
Figure 4.1: PCR amplification shown for the 38-bp DNA fragment for serial dilutions
from 10 to 107 ................................................................................................................ 52
9
Figure 4.2: Calibration curves for various lengths of DNA fragments and H37Rv gDNA
using serial dilution up to 7 log copies ........................................................................... 53
Figure 4.3: Optimisation of urine and reagent volume for the in-house developed
method .......................................................................................................................... 54
Figure 4.4: Percentage of recovery from spiked urine samples for the in-house and
Qiagen methods for DNA fragments and H37Rv gDNA, measured in triplicate ............ 56
Figure 4.5: Gel electrophoresis bands for the 38-bp, 150-bp, and 200-bp DNA
fragments. Size ladders are included in the first and last positions ............................... 57
Figure 4.6: Influence of inhibitors on delta cycle threshold (Ct) value for the in-house
and Qiagen methods, measured with DNA fragments and H37Rv gDNA ..................... 58
Figure 4.7: Effect of different urine samples on PCR efficiency, shown as delta cycle
threshold value for the Qiagen and in-house methods .................................................. 59
Figure 4.8: Effect of different eluate volumes on PCR efficiency, isolated using the in-
house method, shown for three different urine samples ................................................ 60
Figure 4.9: Effect of different eluate dilution series on PCR efficiency, isolated using the
in-house method and measured for five different urine samples ................................... 61
Figure 4.10: Performance comparison between the Qiagen and optimised in-house
isolation methods using clinical samples ....................................................................... 62
Figure 4.11: Flow diagram showing TB diagnosis using sputum-based tests, liquid MGIT
culture, Xpert MTB/RIF molecular test, and smear microscopy ..................................... 66
Figure 4.12: Urine sample characterization through visual control and Combur testing.
...................................................................................................................................... 67
Figure 4.13: Double-stranded primer-based PCR optimisation overview using Alere q.
Six different variations were tested for various PCR settings. ....................................... 70
Figure 4.14: Melt curve analysis for the internal process control and MTB-specific target
(IS6110), ........................................................................................................................ 71
Figure 4.15: Performance characteristics of capture and amplification efficiency for the
MTB-specific targets IS6110 and DR. ........................................................................... 72
Figure 4.16: DNA content (ng/ml) measured using the PicoGreen method, divided into
sex and TB status for the 50 negative and 50 positive liquid culture urine samples. ..... 73
10
Figure 4.17: Receiver operating characteristic (ROC) curve comparison for the MTB-
specific targets IS6110 (black line) and direct repeat (DR) region (red line). ................. 74
Figure 4.18: Evaluation of reagent purity for cross contamination using gel
electrophoresis. ............................................................................................................. 75
Figure 4.19: Levey-Jennings chart showing the daily performance of the Alere q
analysers, measured using 100 H37Rv gDNA. ............................................................. 76
Figure 4.20: Flow diagram showing TB diagnosis made using a urine-based rapid Tr-
DNA test carried out on an Alere q analyser.................................................................. 79
Figure 4.21: Receiver operating characteristic (ROC) curve for Tr-DNA compared to
smear microscopy (black line), Xpert MTB/RIF (red line) and liquid MGIT culture (green
line). ............................................................................................................................... 82
Figure 4.22: Venn diagram showing the number of positive samples diagnosed by
sputum smear microscopy (n = 138), Xpert MTB/RIF (n = 195), liquid MGIT culture (n =
175) and Tr-DNA test (n = 102) ..................................................................................... 83
11
List of Tables
Table 2.1: List of instruments used for the Tr-DNA isolation method optimisation and
evaluation of novel Tr-DNA assay. ................................................................................ 23
Table 2.2: List of commercial kits used for the Tr-DNA isolation method optimisation and
evaluation of novel Tr-DNA assay. ................................................................................ 24
Table 2.3: List of reagents and consumables used for the Tr-DNA isolation method
optimisation and evaluation of novel Tr-DNA assay. ..................................................... 24
Table 3.1: Reaction mix required for PCR targeting the IS6110 region of MTB ............ 32
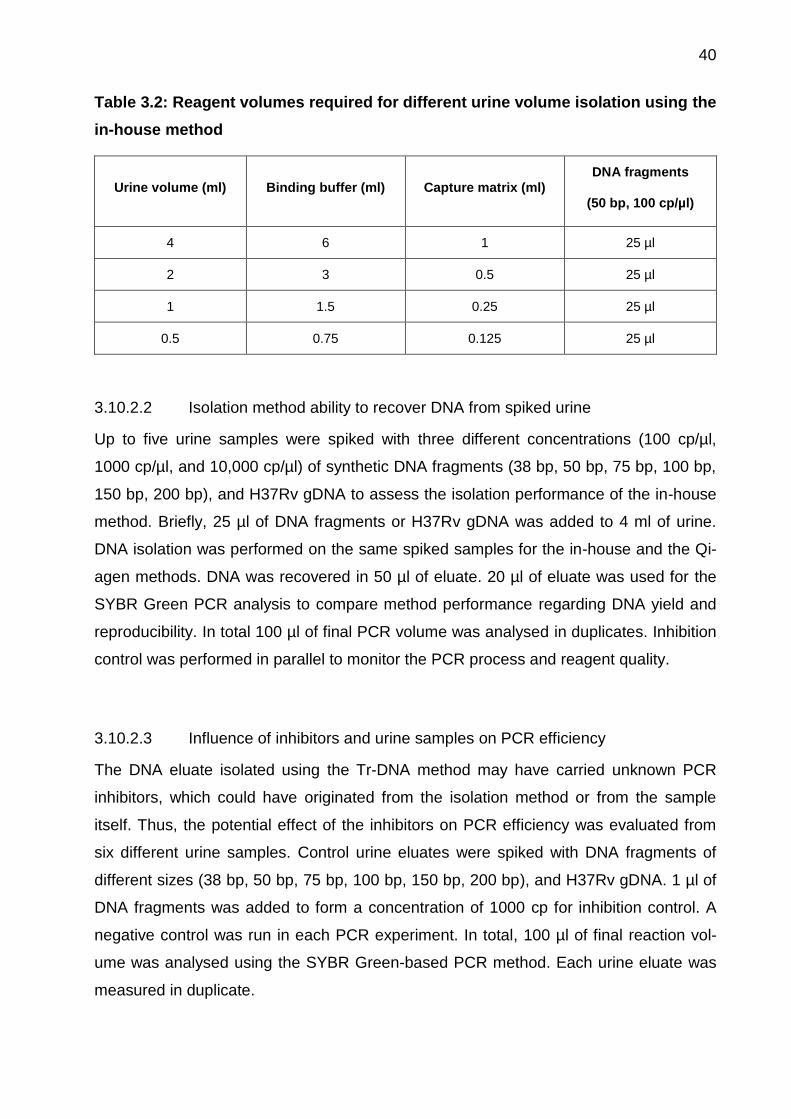
Table 3.2: Reagent volumes required for different urine volume isolation using the in-
house method ................................................................................................................ 40
Table 3.3: Pipetting scheme for different eluate volumes .............................................. 41
Table 3.4: Reaction mix required for PCR targeting the DR region ............................... 47
Table 4.1: Cycle threshold and percentage of PCR efficiency for DNA fragments and
H37Rv gDNA ................................................................................................................. 51
Table 4.2: Overview of mean DNA concentration (ng/ml) for the in-house and Qiagen
methods, measured using the PicoGreen approach. ..................................................... 55
Table 4.3: Study participant characteristics (demographic and clinical) at enrolment at
three clinical sites in Cape Town, South Africa .............................................................. 63
Table 4.4: An overview of double-stranded primer-based PCR optimisation using the
automated molecular analyser Alere q. ......................................................................... 68
Table 4.5: Primer: Quencher (P: Q) ratio optimisation for double-stranded primer-based
PCR using H37Rv gDNA in Alere q ............................................................................... 70
Table 4.6: An overview of the experiments performed for reagent purity and cross
contamination for IS6110 and DR region targets ........................................................... 76
Table 4.7: Univariate and multivariate logistic regression analysis showing the
association between patient characteristics (demographic and clinical) and risk of a
positive Tr-DNA test ...................................................................................................... 77
12
Table 4.8: An overview of the sensitivity, specificity, PLR, NLR, disease prevalence,
PPV and NPV for the Tr-DNA assay, calculated for sex, HIV status, CD4 count, and all
three clinical sites. ......................................................................................................... 80
Table 4.9: Xpert MTB/RIF test performed for discordant urine samples that were Tr-
DNA positive but sputum liquid culture and Xpert MTB/RIF negative. ........................... 83
13
List of Abbreviations
AIDS Acquired immune deficiency Syndrome
BCG Bacille Calmette-Guerin
BHQ Black Hole Quencher
BMGF Bill and Melinda Gates foundation
BMI Body mass index
bp Base pairs
BSC Biosafety cabinet
CI Confidence interval
CMA Competitive reporter monitored amplification
CRF Case reporting form
Ct Cycle threshold
dATP Deoxyadenosine triphosphate
dCTP Deoxycytidine triphosphate
dGTP Deoxyguanosine triphosphate
DNA Deoxyribonucleic acid
dNTP Deoxynucleotide triphosphate
DSP Double-stranded primer
DST Drug susceptibility testing
dTTP Deoxythymidine triphosphate
EDTA Ethylenediaminetetraacetic acid
FIND Foundation for innovative new diagnositcs
gDNA Genomic DNA (H37Rv)
HIV Human immunodeficiency virus
IGRA Interferon gamma release assay
IPC Internal process control
14
IS Insertion sequence
KCL Potassium chloride
LAM Lipoarabinomannan
LJ Löwenstein-Jensen medium
MgCl2 Magnesium chloride
MGIT Mycobacterium grown indicator tube
ml Millilitre
mM Millimolar
MTB Mycobacterium tuberculosis
N/A Not applicable
NALC N-acetyl-L-cysteine
NB Nota bene
NaOH Sodium hydroxide
NAAT Nucleic acid amplification test
NHLS National Health Laboratory Services
NLR Negative likelihood ratio
NPV Negative predictive value
PBS Phosphate buffer saline
PCR Polymerase chain reaction
pH Potential of hydrogen
PLR Positive likelihood ratio
POC Point of care
PPV Positive predictive value
PTB Pulmonary tuberculosis
RFU Relative fluorescence unit
ROC Receiver operating characteristic
15
RNA Ribonucleic acid
RR Risk ratio
RT Real time
SD Standard deviation
TAT Turnaround time
TB Tuberculosis
Tm Melting temperature
Tr Transrenal
TST Tuberculin skin test
WHO World Health Organization
16
1. Introduction
1.1 Tuberculosis
Tuberculosis (TB) is not a new disease; archaeological evidence shows that TB has
existed for more than 9000 years [1]. Robert Koch discovered the causative pathogen
for TB, Mycobacterium tuberculosis (MTB), in 1882 [2, 3]. MTB is a Gram-positive and
highly aerobic bacterium [4]. Furthermore, MTB is such a well-adapted infectious agent
that exposure to only a few bacilli are sufficient to cause infection [5]. TB is transmitted
by droplets produced during coughing and sneezing. This airborne disease primarily
infects the lungs, and other organs can also later be affected. Furthermore, risk factors
such as human immunodeficiency virus (HIV) infection, malnutrition, diabetes mellitus,
alcoholism and malignancy are associated with TB disease development after primary
infection [6, 7]. In addition, HIV infection also supports the spread of MTB bacilli to other
body parts [8, 9].
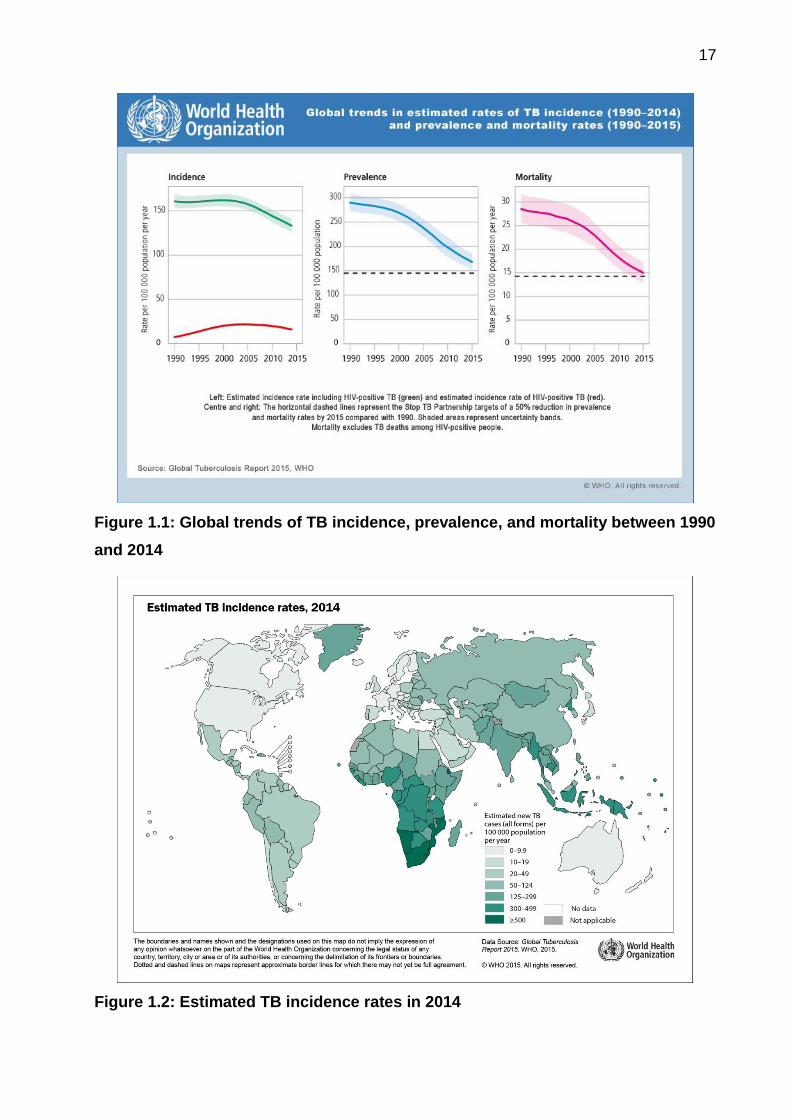
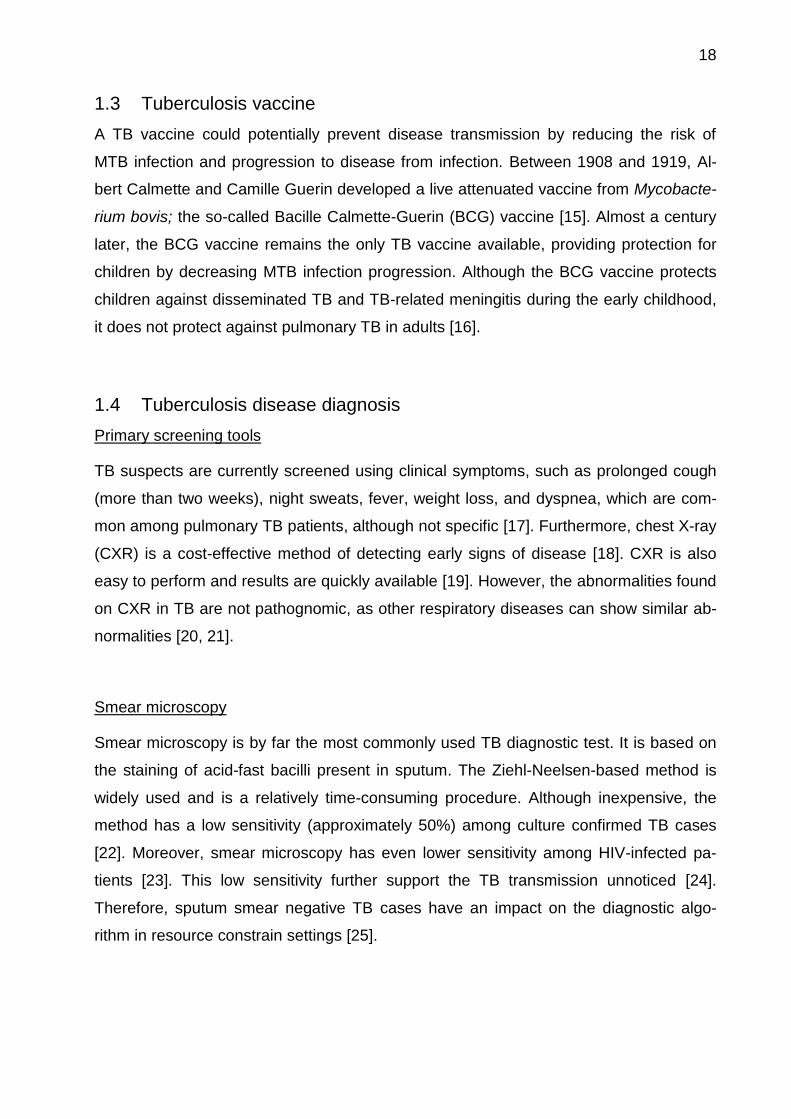
1.2 Epidemiology of tuberculosis
TB may have killed more people than any other infectious disease. Between 1990 and
2014, mortality due to TB had declined by 47% [10]. However, TB received widespread
media attention in 2015 when it killed more people than HIV and became the leading
infectious cause of death [11]. An estimated 10.4 million new TB cases were reported in
2015, and an estimated 1.4 million people died from TB-related illness in that year (1
million HIV-negative and 0.4 million HIV-positive individuals) [12]. At the geographic
level, the prevalence of TB is high in regions with limited access to resources, such as
sub-Saharan Africa and Asia [13]. Among other high burden countries, South Africa has
the highest TB incidence rate, of 834 per 100,000 people [12]. Furthermore, HIV infec-
tion reduces the CD4 T cell count and promotes the growth of MTB [14]. Figure 1.1
shows the global trends in TB incidence (1990-2014), prevalence, and mortality rates
(1990-2015). Figure 1.2 shows the estimate of 2014 TB incidence rates/100,000 people.
17
Figure 1.1: Global trends of TB incidence, prevalence, and mortality between 1990
and 2014
Figure 1.2: Estimated TB incidence rates in 2014
18
1.3 Tuberculosis vaccine
A TB vaccine could potentially prevent disease transmission by reducing the risk of
MTB infection and progression to disease from infection. Between 1908 and 1919, Al-
bert Calmette and Camille Guerin developed a live attenuated vaccine from Mycobacte-
rium bovis; the so-called Bacille Calmette-Guerin (BCG) vaccine [15]. Almost a century
later, the BCG vaccine remains the only TB vaccine available, providing protection for
children by decreasing MTB infection progression. Although the BCG vaccine protects
children against disseminated TB and TB-related meningitis during the early childhood,
it does not protect against pulmonary TB in adults [16].
1.4 Tuberculosis disease diagnosis
Primary screening tools
TB suspects are currently screened using clinical symptoms, such as prolonged cough
(more than two weeks), night sweats, fever, weight loss, and dyspnea, which are com-
mon among pulmonary TB patients, although not specific [17]. Furthermore, chest X-ray
(CXR) is a cost-effective method of detecting early signs of disease [18]. CXR is also
easy to perform and results are quickly available [19]. However, the abnormalities found
on CXR in TB are not pathognomic, as other respiratory diseases can show similar ab-
normalities [20, 21].
Smear microscopy
Smear microscopy is by far the most commonly used TB diagnostic test. It is based on
the staining of acid-fast bacilli present in sputum. The Ziehl-Neelsen-based method is
widely used and is a relatively time-consuming procedure. Although inexpensive, the
method has a low sensitivity (approximately 50%) among culture confirmed TB cases
[22]. Moreover, smear microscopy has even lower sensitivity among HIV-infected pa-
tients [23]. This low sensitivity further support the TB transmission unnoticed [24].
Therefore, sputum smear negative TB cases have an impact on the diagnostic algo-
rithm in resource constrain settings [25].
19
Sputum culture
To date, sputum culture remians the gold standard for TB diagnosis [26]. However, im-
plementation of culture diagnostics in limited resource settings remains challenging [27].
MTB present in sputum is cultivated on Löwenstein-Jensen (LJ)/Middlebrook medium or
in liquid mycobacterium growth indicator tubes (MGIT) at 37°C for several weeks. MTB
grows slowly, requiring up to eight weeks for a solid culture and up to six weeks for a
liquid culture to make a conclusive diagnosis [28]. Furthermore, culture contamination is
relatively common despite appropriate lab quality management in place [29].
Nucleic acid amplification tests (NAAT)
Development of rapid molecular tests using sputum has been a breakthrough in TB di-
agnosis [30]. NAAT-based tests such as Xper® MTB/RIF (Cepheid Inc., USA) have
achieved a sensitivity of 90.4% (95% CI: 89.2 – 91.4) and specificity of 98.4% (95% CI:
98.0 – 98.7) and can be implemented in resource scarce settings or at the point of care
(POC) [31-33]. The availability of NAAT-based analysers has made it possible to diag-
nose TB using various sample types, such as biopsies, urine, pus and cerebral spinal
fluid [34].
Immune response-based diagnostic tests
The tuberculin skin test (TST) is the oldest and most commonly used immune diagnos-
tic test [35]. Nevertheless, among high-prevalence countries, TST results can be false
positive due to sensitization with MTB [36]. Interferon-gamma release assays (IGRA)
such as T-SPOT.TB (Oxford Immunotec, UK), and QuantiFERON®-TB Gold in-tube test
(Quest Diagnostics, USA) are novel immune-based assays. IGRAs are blood-based
tests and mainly used for diagnosis of latent TB infection but can also be used to detect
active disease [37]. However, among high TB-prevalent low and middle-income
countries, IGRA use has not been shown to be advantagous over the TST [38].
Additionally, TB diagnosis made using IGRA do not show any benefit among HIV-
infected patients [39], or among children [40]. Therefore, routine use of IGRA remians
limited [37].
20
Antigen-based rapid test
The low cost, urine-based, lateral flow diagnostic test detects the presence of lipoarabi-
nomannan (LAM) in urine [41]. Although it can be performed at POC in resource-
constrained settings [42], A meta-analysis of the TB-LAM test showed a sensitivity of 13
– 93% and specificity of 87 – 99% [43]. This wide range of assay performance is mainly
due to the factors such as CD4 cell count and level of immunosuppression [44]. Test
performance is limited to HIV-positive patients with a CD4 count below 100 cells/mm3
[45]. In other words, TB screening is possible among advanced immunosuppressed HIV
patients using this rapid test [46]. The world health organization (WHO) recommends
the TB-LAM lateral flow test (Alere, USA) for TB diagnosis and screening among people
living with HIV [47, 48].
1.5 Biomarker for tuberculosis diagnosis
Efforts to develop a novel TB diagnostic test have accelerated in recent years, due to
involvement from the WHO and non-governmental organisations such as the
Foundation for Innovative New Diagnostics (FIND) and the Bill and Melinda Gates
Foundation (BMGF). Blood and urine-based biomarkers are the outcomes of recent ad-
vances in research, and have shown potential for TB diagnosis [49, 50]. However, low
concentrations of target biomarkers may require larger sample volumes, which is only
possible when using urine. Moreover, biomarkers present in blood may also be present
in urine when they can pass the kidney barrier, e.g., cell-free nucleic acid and transrenal
DNA (Tr-DNA) [51, 52]. Cell-free nucleic acids present in blood and other bodily fluids
have shown potential for use in the diagnosis of infectious diseases and cancers [53,
54]. In addition, a urine-based POC test could be used in combination with smear mi-
croscopy or with liquid culture for pulmonary and extra-pulmonary TB suspects [50, 55].
1.6 Problem statement
Smear microscopy and liquid culture remain the tests of choice in high-prevalence set-
tings [56]. Due to the nature of TB infection, children and HIV-positive patients are often
unable to produce sufficient sputum on demand and may require sputum induction to
provide enough volume for testing [57, 58]. Due to this limitation and the lack of a single
21
test for diagnosis, we currently rely on second and even third diagnostic tests to identify
all cases of TB [59]. Delay in TB diagnosis and treatment in turn hampers disease con-
trol and increases the public health burden [60, 61]. Therefore, a rapid and easy to per-
form POC test is needed to cover all TB suspects in HIV and TB-endemic areas such as
South Africa [12]. A urine-based diagnostic test could complete the current diagnostic
algorithm and cover all groups of patients regardless of their co-infection and age.
Urine-based molecular TB diagnostic assays have achieved varying sensitivities and
specificities for both pulmonary and extrapulmonary TB among HIV-positive and nega-
tive cohorts. Meta-analyses of Tr-DNA based tests have shown a sensitivity of 55% and
specificity of 94% [62].This rather lower assay performance might be due to the use of
non-standardised Tr-DNA isolation method and MTB target that is amplified in the PCR
method for TB diagnosis. A Tr-DNA-based diagnostic test is a combination of two steps:
1) Isolation of Tr-DNA from urine, and 2) amplification of the target-specific DNA. Many
critical factors are involved that play a role in the development of a robust and reproduc-
ible test, such as reagent quality, isolation method, cost, and the availability of a PCR
machine for DNA analysis. The Tr-DNA isolation step is essential for targeting and de-
tecting the MTB-specific DNA fragments. There are currently a select few nucleic acid
isolation kits available for various bodily fluids that require the use of different reagents
and additional instruments [63]. Therefore, a Tr-DNA method primarily developed and
optimised for urine could help to isolate target DNA fragments smaller than 200 base
pairs (bp) in size [64, 65].
Moreover, the availability of molecular tests remains limited to resource-rich settings
due to the requirements for infrastructure and a skilled lab technician to perform the
tests. Implementation of a novel molecular assay for diagnosis in limited resource set-
tings could improve disease control [66].
1.7 Rationale, goals, and objectives
1.7.1 Rationale
Recent advances in diagnostic test development and their availability in limited resource
settings have aided in the control of TB disease [35, 67]. A test using a sample type
other than sputum could further improve diagnostic ability and control TB in highly en-
demic countries. The ability to collect a larger urine volume, in comparison to other bodi-
22
ly fluids, is advantageous. The urine sample collection procedure is non-invasive, and
sample collection is also possible from sputum-scarce HIV-infected individuals and chil-
dren.
Advancement in the fields of medical device technology and molecular biology have
made it possible to bring lab-based molecular diagnostic tests to the POC [68]. Fur-
thermore, molecular tests provide more conclusive results in comparison to immune-
based assays, allowing clinical decisions to be made based on test results [69]. In addi-
tion, urine-based molecular assays targeting the MTB-specific DNA fragments can be
useful for TB diagnosis and therapy monitoring [70]. The availability of a TB molecular
test at smear microscopy centres or HIV clinics could further improve TB control [71].
1.7.2 Goals
To make available a urine-based rapid molecular test for the diagnosis of pulmonary
and extra-pulmonary TB with potential for implementation at POC settings in areas of
high TB prevalence.
1.7.3 Objective
Main objective
The main objective of this study is to evaluate a urine-based rapid molecular diagnostic
test for pulmonary TB using an automated molecular analyser in a patient cohort from
Cape Town, using a cross-sectional study design
Secondary objectives
i) Optimisation and standardisation of an in-house developed Tr-DNA isolation
method.
ii) Validation of a rapid molecular assay based on POC Alere q by comparing
this with standard lab-based PCR methods.
iii) Definition of the target population where sputum-based diagnostic tools fail,
and determining whether the Tr-DNA based assay brings an advantage.
iv) Comparison of the assay performance among HIV-positive and negative TB
suspects.
v) Determine the effects of urine characteristics on assay performance.
The materials and methods used in this study will be described in chapters 2 and 3, re-
spectively. The results obtained will be presented in chapter 4.
23
2 Materials
2.1 Instruments, commercial kits, reagents and consumables
During the study different sets of instruments, commercial kits, reagents and consuma-
bles were used. Detailed information about particular material is mentioned in appropri-
ate tables below.
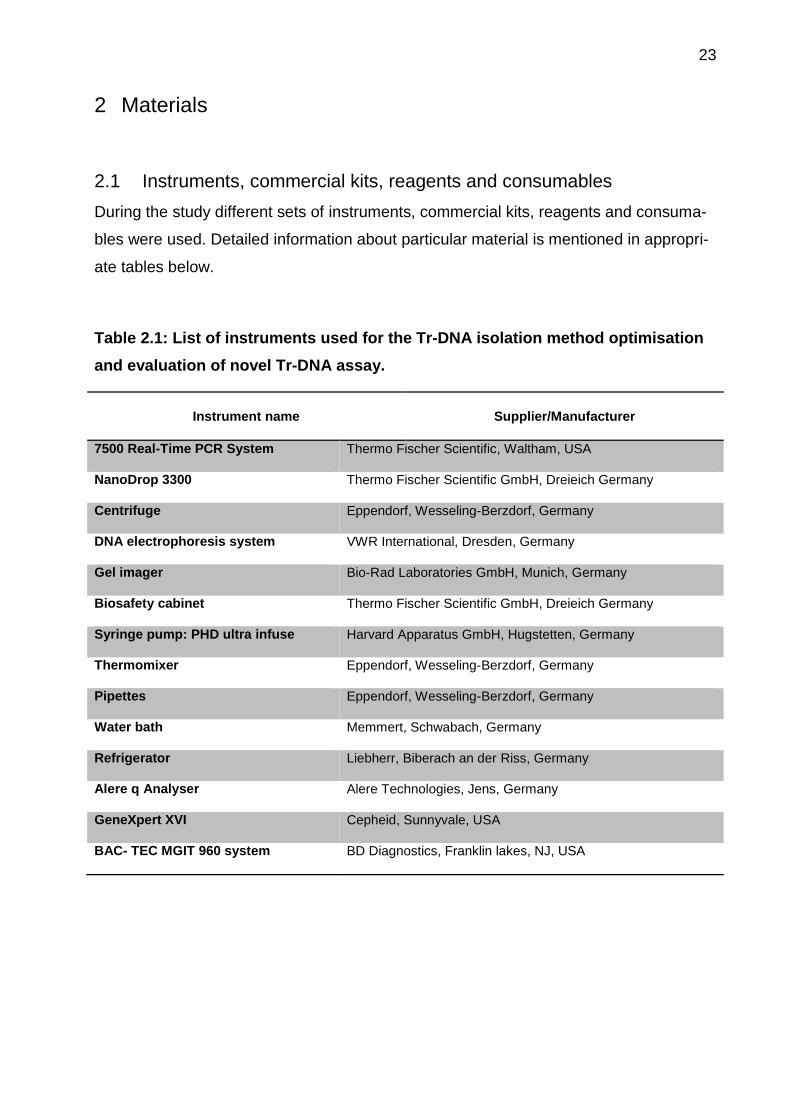
Table 2.1: List of instruments used for the Tr-DNA isolation method optimisation
and evaluation of novel Tr-DNA assay.
Instrument name Supplier/Manufacturer
7500 Real-Time PCR System Thermo Fischer Scientific, Waltham, USA
NanoDrop 3300 Thermo Fischer Scientific GmbH, Dreieich Germany
Centrifuge Eppendorf, Wesseling-Berzdorf, Germany
DNA electrophoresis system VWR International, Dresden, Germany
Gel imager Bio-Rad Laboratories GmbH, Munich, Germany
Biosafety cabinet Thermo Fischer Scientific GmbH, Dreieich Germany
Syringe pump: PHD ultra infuse Harvard Apparatus GmbH, Hugstetten, Germany
Thermomixer Eppendorf, Wesseling-Berzdorf, Germany
Pipettes Eppendorf, Wesseling-Berzdorf, Germany
Water bath Memmert, Schwabach, Germany
Refrigerator Liebherr, Biberach an der Riss, Germany
Alere q Analyser Alere Technologies, Jens, Germany
GeneXpert XVI Cepheid, Sunnyvale, USA
BAC- TEC MGIT 960 system BD Diagnostics, Franklin lakes, NJ, USA
24
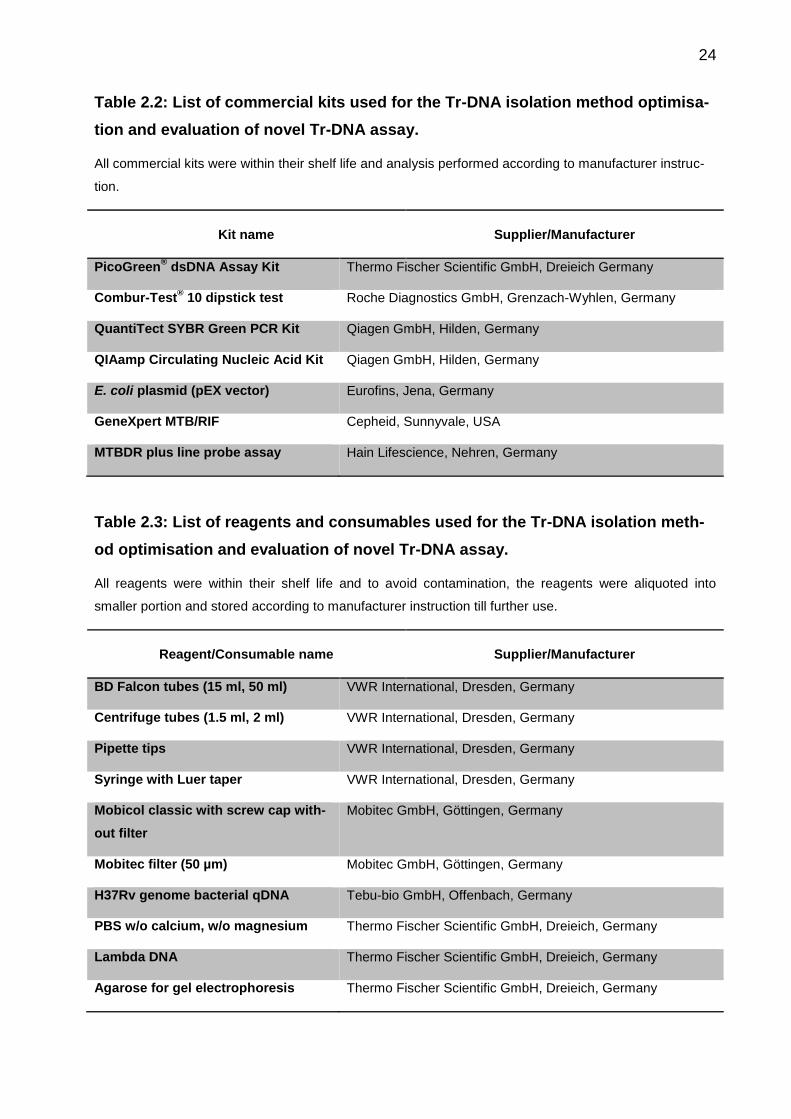
Table 2.2: List of commercial kits used for the Tr-DNA isolation method optimisa-
tion and evaluation of novel Tr-DNA assay.
All commercial kits were within their shelf life and analysis performed according to manufacturer instruc-
tion.
Kit name Supplier/Manufacturer
PicoGreen® dsDNA Assay Kit Thermo Fischer Scientific GmbH, Dreieich Germany
Combur-Test® 10 dipstick test Roche Diagnostics GmbH, Grenzach-Wyhlen, Germany
QuantiTect SYBR Green PCR Kit Qiagen GmbH, Hilden, Germany
QIAamp Circulating Nucleic Acid Kit Qiagen GmbH, Hilden, Germany
E. coli plasmid (pEX vector) Eurofins, Jena, Germany
GeneXpert MTB/RIF Cepheid, Sunnyvale, USA
MTBDR plus line probe assay Hain Lifescience, Nehren, Germany
Table 2.3: List of reagents and consumables used for the Tr-DNA isolation meth-
od optimisation and evaluation of novel Tr-DNA assay.
All reagents were within their shelf life and to avoid contamination, the reagents were aliquoted into
smaller portion and stored according to manufacturer instruction till further use.
Reagent/Consumable name Supplier/Manufacturer
BD Falcon tubes (15 ml, 50 ml) VWR International, Dresden, Germany
Centrifuge tubes (1.5 ml, 2 ml) VWR International, Dresden, Germany
Pipette tips VWR International, Dresden, Germany
Syringe with Luer taper VWR International, Dresden, Germany
Mobicol classic with screw cap with-
out filter
Mobitec GmbH, Göttingen, Germany
Mobitec filter (50 µm) Mobitec GmbH, Göttingen, Germany
H37Rv genome bacterial qDNA Tebu-bio GmbH, Offenbach, Germany
PBS w/o calcium, w/o magnesium Thermo Fischer Scientific GmbH, Dreieich, Germany
Lambda DNA Thermo Fischer Scientific GmbH, Dreieich, Germany
Agarose for gel electrophoresis Thermo Fischer Scientific GmbH, Dreieich, Germany
25
Reagent/Consumable name Supplier/Manufacturer
96-well plates Thermo Fischer Scientific GmbH, Dreieich, Germany
Primers, DNA fragments Eurogentec GmbH, Cologne, Germany
Sarstedt Monovette (10 ml) Sarstedt, Nümbrecht, Germany
Isopropanol Carl Roth GmbH, Karlsruhe, Germany
Nuclease-free water (molecular
grade)
Carl Roth GmbH, Karlsruhe, Germany
Binding buffer Alere Technologies, Jena, Germany
Capture matrix Alere Technologies, Jena, Germany
Washing buffer Alere Technologies, Jena, Germany
DNA-Exitus VWR Darmstadt, Germany
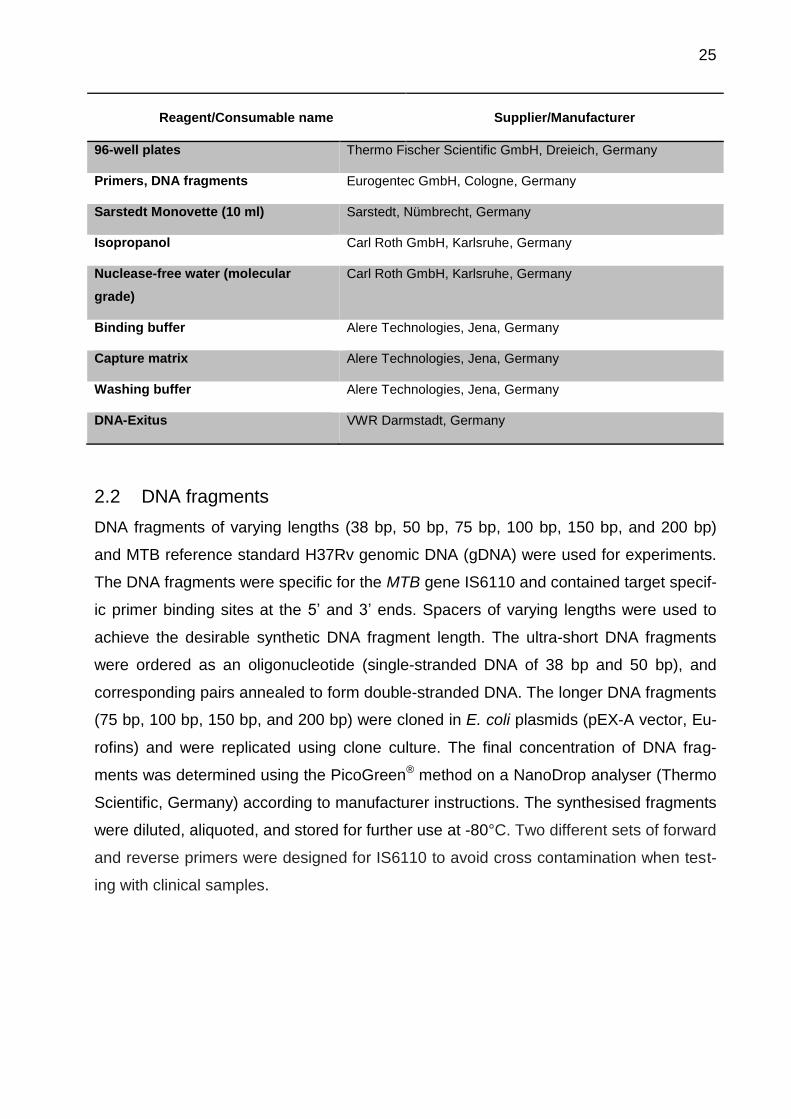
2.2 DNA fragments
DNA fragments of varying lengths (38 bp, 50 bp, 75 bp, 100 bp, 150 bp, and 200 bp)
and MTB reference standard H37Rv genomic DNA (gDNA) were used for experiments.
The DNA fragments were specific for the MTB gene IS6110 and contained target specif-
ic primer binding sites at the 5’ and 3’ ends. Spacers of varying lengths were used to
achieve the desirable synthetic DNA fragment length. The ultra-short DNA fragments
were ordered as an oligonucleotide (single-stranded DNA of 38 bp and 50 bp), and
corresponding pairs annealed to form double-stranded DNA. The longer DNA fragments
(75 bp, 100 bp, 150 bp, and 200 bp) were cloned in E. coli plasmids (pEX-A vector, Eu-
rofins) and were replicated using clone culture. The final concentration of DNA frag-
ments was determined using the PicoGreen® method on a NanoDrop analyser (Thermo
Scientific, Germany) according to manufacturer instructions. The synthesised fragments
were diluted, aliquoted, and stored for further use at -80°C. Two different sets of forward
and reverse primers were designed for IS6110 to avoid cross contamination when test-
ing with clinical samples.
26
2.3 Urine samples from healthy control cohort
Five voluntary co-workers (healthy) at Alere Technologies GmbH, Jena, Germany, pro-
vided up to 1000 ml of control urine. The urine samples were aliquoted into 50 mL fal-
con tubes and stored between -70°C and -80°C for further use. No data regarding the
donors were collected. The in-house Tr-DNA isolation method was developed and opti-
mised using this control urine.
27
3 Methods
3.1 Study design
3.1.1 Study cohort
Patients with suspected pulmonary tuberculosis (PTB) were consecutively recruited
from July – November 2013 at three different clinical sites (Gugulethu, Langa, and Van-
guard) in Cape Town, South Africa. Demographic and clinical characteristics were
recorded for each participant using the case reporting form (CRF). Body weight and
height was also recorded for body mass index (BMI) calculation. For the detailed CRF,
please refer to Appendix 1.
3.1.1.1 Inclusion/exclusion criteria
The inclusion criteria for the study were as follows.
Adult pulmonary TB suspects (≥ 18 years of age);
Presence of clinical symptoms:
o for HIV-negative participants: cough for more than two weeks, night
sweats, weight loss, malaise (general feeling of being unwell), fever ≥ two
weeks, temperature ≥ 38°C, chest pain, or haemoptysis (coughing up of
blood);
o for HIV-positive participants: at least one of the abovementioned
symptoms;
Providing a signed informed consent form;
Participants did not plan to leave the municipal area during the following two
months;
Willingness to undergo HIV testing; and
Able to provide at least two sputum samples (volume ≥ 1.5 ml per sample) and
60 ml of spot urine.
The exclusion criteria for the study are outlined below.
Pregnancy;
TB therapy more than one week in duration; and
Presence of non-TB mycobacterial infection.
28
3.1.2 Study period and sites
For the evaluation of the novel molecular assay, a cross-sectional study was designed.
Urine samples were processed for Tr-DNA isolation in May – August 2015 at the Re-
search Centre Borstel, Germany, and Alere Technologies, Jena, Germany. All PCR ex-
periments were performed during October 2015 – November 2016 at Alere Technolo-
gies, Jena, Germany.
3.1.3 Ethical approval
Ethical approval was received from the Health Sciences Faculty Research Ethics Com-
mittee at University of Cape Town and approved under number IRB# IRB00001938.
Participants were insured through Federal Wide Assurance # FWA00001637. Written
informed consent was collected from each participant.
3.1.4 Sample collection, storage and processing
The participants provided two spot sputum samples (volume ≥ 1.5 ml per sample) in
sterile container during their initial clinic visit, with a one-hour interval between samples.
When possible, a third sputum sample was also collected for the biobank and stored at -
80°C. Eight ml EDTA blood was also collected. 50 ml spot urine was collected in a ster-
ile container holding 25 mM EDTA to prevent DNA degradation, and the sample was
finally stored at -80°C. Urine samples were shipped on dry ice to the Research Centre
Borstel, Germany, for further processing. Before use, the frozen samples were brought
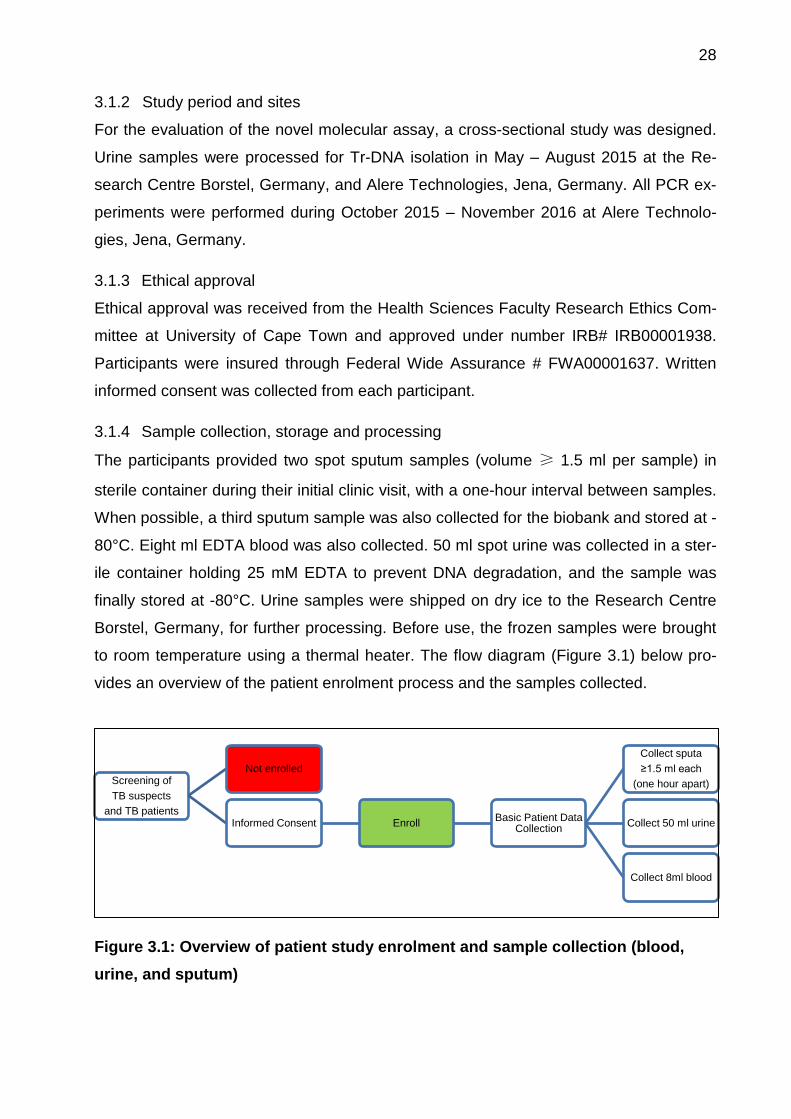
to room temperature using a thermal heater. The flow diagram (Figure 3.1) below pro-
vides an overview of the patient enrolment process and the samples collected.
Figure 3.1: Overview of patient study enrolment and sample collection (blood,
urine, and sputum)
Screening of
TB suspects
and TB patients
Not enrolled
Informed Consent Enroll Basic Patient Data
Collection
Collect sputa
≥1.5 ml each
(one hour apart)
Collect 50 ml urine
Collect 8ml blood
29
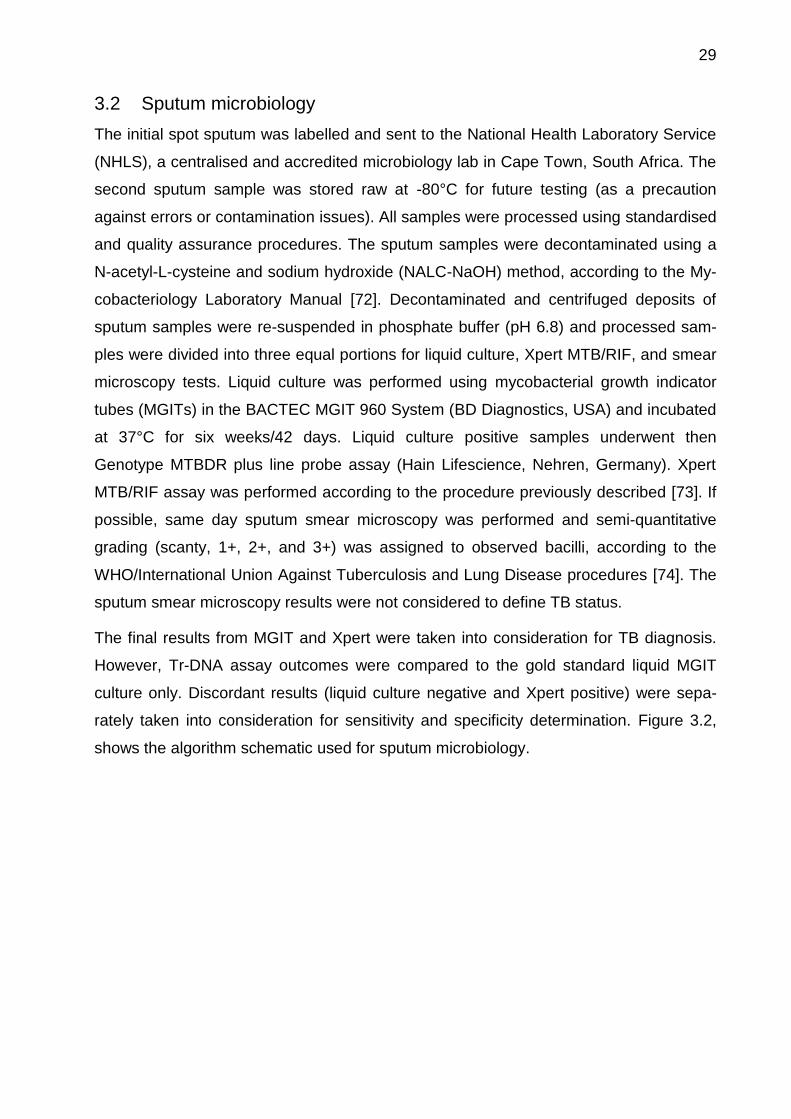
3.2 Sputum microbiology
The initial spot sputum was labelled and sent to the National Health Laboratory Service
(NHLS), a centralised and accredited microbiology lab in Cape Town, South Africa. The
second sputum sample was stored raw at -80°C for future testing (as a precaution
against errors or contamination issues). All samples were processed using standardised
and quality assurance procedures. The sputum samples were decontaminated using a
N-acetyl-L-cysteine and sodium hydroxide (NALC-NaOH) method, according to the My-
cobacteriology Laboratory Manual [72]. Decontaminated and centrifuged deposits of
sputum samples were re-suspended in phosphate buffer (pH 6.8) and processed sam-
ples were divided into three equal portions for liquid culture, Xpert MTB/RIF, and smear
microscopy tests. Liquid culture was performed using mycobacterial growth indicator
tubes (MGITs) in the BACTEC MGIT 960 System (BD Diagnostics, USA) and incubated
at 37°C for six weeks/42 days. Liquid culture positive samples underwent then
Genotype MTBDR plus line probe assay (Hain Lifescience, Nehren, Germany). Xpert
MTB/RIF assay was performed according to the procedure previously described [73]. If
possible, same day sputum smear microscopy was performed and semi-quantitative
grading (scanty, 1+, 2+, and 3+) was assigned to observed bacilli, according to the
WHO/International Union Against Tuberculosis and Lung Disease procedures [74]. The
sputum smear microscopy results were not considered to define TB status.
The final results from MGIT and Xpert were taken into consideration for TB diagnosis.
However, Tr-DNA assay outcomes were compared to the gold standard liquid MGIT
culture only. Discordant results (liquid culture negative and Xpert positive) were sepa-
rately taken into consideration for sensitivity and specificity determination. Figure 3.2,
shows the algorithm schematic used for sputum microbiology.
30
Figure 3.2: Schematic of diagnostic algorithm used for microbiology testing using
sputum
Liquid culture and Xpert MTB/RIF were performed on the day of sputum collection, and if possible smear
microscopy was also performed on the same day. However, smear microscopy results were not consid-
ered for TB diagnosis.
3.3 HIV screening and CD4 cell count
Participants without known HIV status were tested using serological test at local clinics
after appropriate counselling. The ABON HIV1/2/O Tri-Line Human Immunodeficiency
Virus Rapid Test (ABON Biopharm (Hangzhou) Co. Ltd, China) and First Response HIV
1-2.O Rapid Whole Blood Test (Premier Medical Corporation Ltd, Nani Daman, India)
were used to determine HIV status. The CD4 cell count (measured during the last six
months) was obtained from the clinical records for HIV-positive patients.
Collect Sputa
( ≥1.5 ml)
Sputum 1
NALC-NaOH decontamination
MGIT
Geno type MTBDR plus
Xpert MTB/RIF
RIF Sen RIF Res
Smear Microscopy
Sputum 2
Store raw at
-80°C
Sputum 3
Biobank store at
-80°C
31
3.4 Dipstick test for urine characterisation
Frozen urine samples were thawed using a thermal heater and homogenised by invert-
ing the tube several times. All urine samples underwent visual examination for colour
and clarity. Furthermore, each urine specimen was characterised using the Combur-
Test® 10 dipstick test (Roche Diagnostics GmbH, Grenzach-Wyhlen, Germany). This
test is a lateral flow test and determines parameters such as density (specific gravity),
pH, leukocyte presence, nitrite, protein, glucose, ketone, urobilinogen, bilirubin, and
erythrocyte presence in semi-quantitative or qualitative manners. The tests were con-
secutively performed in a biosafety cabinet to avoid cross contamination and for safety
reasons.
3.5 DNA concentration measurement using the PicoGreen method
Total DNA content was measured for the urine eluate using the PicoGreen® ds DNA
Assay Kit (Thermo Scientific, USA) on the NanoDrop 3300 analyser (Thermo Scientific,
USA) according to the manufacturer’s instructions for DNA quantification. The DNA
eluate was diluted 1:5 using the supplied buffer. The DNA concentration value (ng/ml)
was calculated using a standard curve generated with lambda DNA (supplied by the
manufacturer in the following concentrations: 5 ng/ml, 10 ng/ml, 25 ng/ml, 100 ng/ml,
500 ng/ml, and 1000 ng/ml). For the setup of the standard curve, all DNA concentra-
tions were measured in five replicates. Each DNA eluate measured in three replicates
together with a negative control (molecular grade water). DNA concentration of the elu-
ate was calculated using the standard curve.
3.6 Polymerase chain reaction using the standard PCR cycler approach
The classical three step RT-PCR method using SYBR® Green reagents on the 7500
real-time (RT) PCR analyser (Thermo Fischer Scientific, USA) was performed for Tr-
DNA analysis. Table 3.1, below, shows the pipetting scheme used for the PCR master
mix. The PCR steps consisted of an initial denaturation phase for 15 min at 95 °C
followed by cyclic denaturation for 15 sec at 95 °C, annealing for 30 sec at 62 °C and
elongation for 30 sec at 72 °C. The forward primer (5’-GACGCGATCGAGCAAGCC-3’)
and reverse primer (5’-TCTTGTTGGCGGGTCCAG-3’) were designed for the highly
conservative MTB-specific insertion sequence (IS) 6110, and were the same length (18
32
nucleotides) [65]. The Ct-value for the PCR reactions were calculated using the
baseline of cycle 3-15 and a threshold of 50,000 relative fluorescence units (RFU).
Table 3.1: Reaction mix required for PCR targeting the IS6110 region of MTB
Reagent
Volume in µl
(eluate: 20 µl)
Volume in µl
(eluate: 40 µl)
Volume in µl
(eluate: 10 µl)
Nuclease-free water 24.0 4.0 34.0
SYBR Green master mix 50.0 50.0 50.0
Forward primer (0.3 µM) 3.0 3.0 3.0
Reverse primer (0.3 µM) 3.0 3.0 3.0
DNA fragments/ H37rv/nuclease-free water 20.0 40.0 10.0
Final volume 100.0 100.0 100.0
To calculate PCR efficiency, the Ct-values were plotted against the log concentration of
the amplified copies. PCR efficiency (E) was calculated according the following formula:
E = 10(−1 b⁄ ) − 1
where “b” represent slope obtained from standard curve by plotting the log of the start-
ing quantity of DNA fragments or genomic DNA (gDNA) against the cycle threshold (ct)
value obtained during amplification [75]. All qPCR experiments were evaluated using
the Applied Biosystems 7500 software version 2.0.6.
The delta Ct-value is a good indicator of the efficiency of the nucleic acid isolation
method. The delta Ct-value is the Ct difference between the values measured for inhibi-
tion control and the urine eluate. The larger delta Ct-values indicates a higher level of
PCR inhibition, and the lower values indicate higher PCR efficiency. Delta Ct values
were calculated for all DNA fragments for both methods using following formula [76]:
∆ 𝑐𝑡 = 𝑐𝑡 (𝑇𝑆) − 𝑐𝑡 (𝑅𝑆)
Where: TS = Test sequence, RS = Reference sequence (e.g., positive control or inhibi-
tion control)
33
3.7 PCR analysis of synthetic DNA fragments
The functionality of MTB-specific IS6110 synthesised DNA fragments (38 bp, 50 bp, 75
bp, 150 bp, and 200 bp) was confirmed by target-specific PCR using the SYBR Green
method on an RT-PCR AB cycler. For quality and stability, the DNA fragments were
analysed in a logarithmic concentration series (10 cp, 102 cp, 103 cp, 104 cp, 105 cp, 106
cp, and 107 cp) by dilution into nuclease-free water, and then measured in triplicates.
Genomic DNA from the MTB reference strain H37Rv was run as the PCR positive
control; a negative control was also run in all PCR experiments.
3.8 Gel electrophoresis
Gel electrophoresis is a classic tool used to confirm the specificity of generated PCR
products by measuring their particular lengths. The PCR products were loaded into a
2.5% w/v agarose gel prepared according to the manufacturer’s instructions (Thermo
Fisher Scientific, USA). 1.5 µl of 50 bp ladder was added to 5 µl bromophenol blue and
run as a base pairs marker in the gel. Furthermore, 25 µl of PCR product was mixed
with 5 µl of bromophenol blue, and 15 µl of sample was applied into the gel for PCR
product analysis. Electrophoresis was run at 130 volts for 45 minutes using the DNA
electrophoresis system (VWR International, Germany); the gel was then analysed using
a gel imager (Bio-Rad, Germany).
3.9 QIAamp circulating nucleic acid method
The QIAamp circulating nucleic acid kit was used as a reference method to compare
and optimise the in-house Tr-DNA isolation method. This commercially available kit can
isolate circulating cell-free nucleic acids from various bodily fluids, including blood,
plasma, serum, and urine. The isolation method is comprised of four steps: lysis, bind-
ing, washing, and elution. The kit provides selective binding to a silica-based membrane;
nucleic acids specifically bind to the QIAamp mini column, while impurities such as PCR
inhibitors, divalent cations and proteins can be completely removed in three washing
steps. The pure nucleic acids are the eluted using an elution buffer. The purified
concentrated circulating DNA and RNA can be used for downstream RT-PCR analysis.
A sample volume of up to 5 ml can be isolated using the Qiagen method, with a flexible
elution volume between 20 and 150 µl.
34
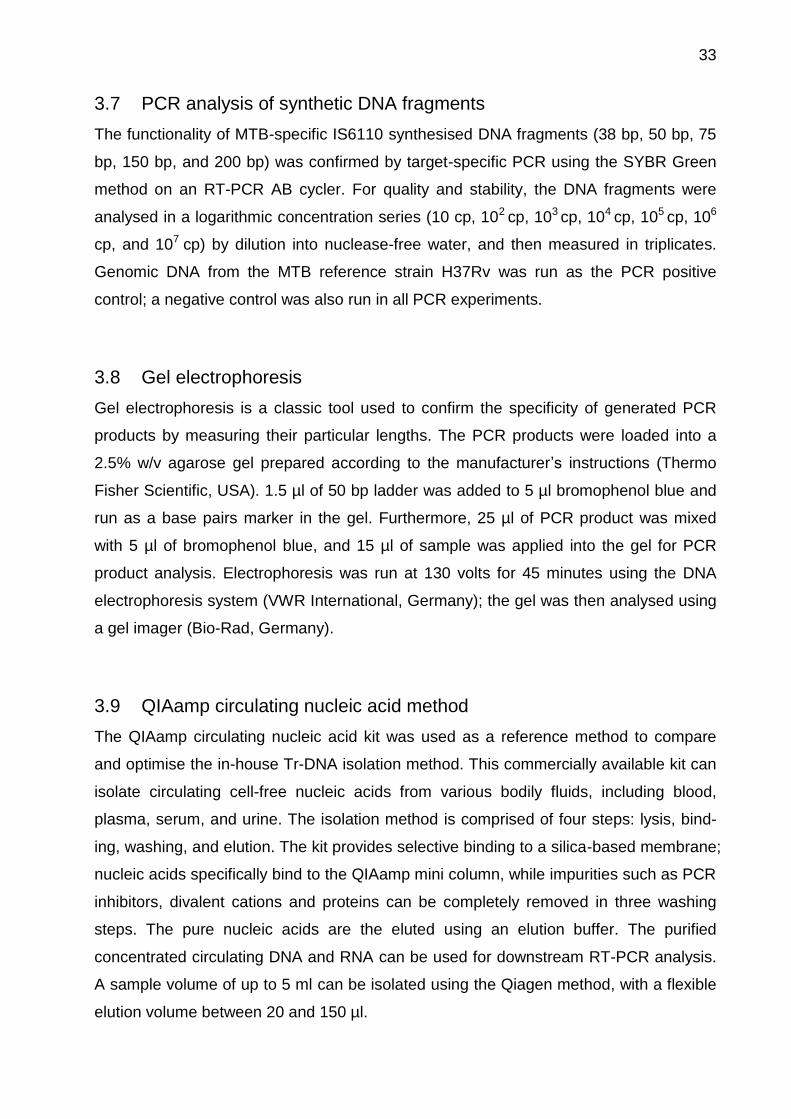
Figure 3.3, below, shows the material required for circulating nucleic acid isolation using
the Qiagen method. In order to set up the filtration unit, the Leur taper syringe (B) with
screw cap must be attached to the mobicol column. The QIAamp mini column can now
be inserted into the mobicol column (A). The syringe plunger is then removed and the
binding suspension is transferred in the syringe. The plunger is inserted into the syringe
and the suspension is filtered by applying pressure to the plunger. The waste can be
collected in 15 ml falcon tubes.
Figure 3.3: Material required to perform nucleic acid isolation using the Qiagen
method
Mobicol system (A), 10 ml syringe with Luer taper (B), micro centrifuge tube (C), and QIAamp mini col-
umn (D)
A
B
C
D
35
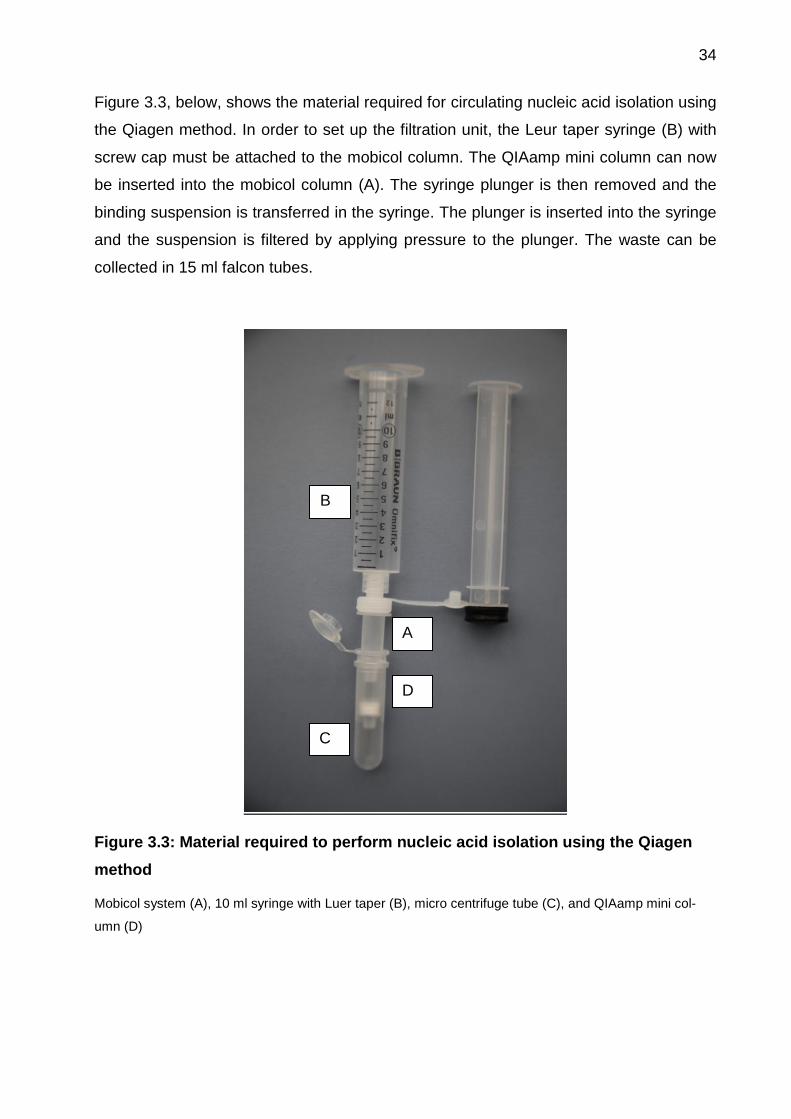
The standard QIAamp protocol was modified for use with 4.0 ml urine, as shown in the
flow diagram, below (Figure 3.4).
Figure 3.4: Overview of nucleic acid isolation protocol using the Qiagen method
(QIAamp)
3.10 In-house Tr-DNA isolation method
In-house developed Tr-DNA isolation method was developed and optimised to enrich
ultrashort DNA fragments (≥ 38 bp) from large urine volumes (up to 4 ml) including
human and pathogen-specific DNA. To amplify pathogen-specific DNA fragments from
the isolated total DNA, the development of a target specific PCR method was essential.
The in-house Tr-DNA isolation method was designed and developed to enable i) en-
richment of ultrashort DNA fragments from large urine volumes, and ii) simplification of
DNA isolation and amplification/detection for implementation in limited-resource settings.
The detailed steps required for the manual isolation, including the materials and solu-
tions used, are shown in Figure 3.5.
Lysis Step
•4 mL Urine
•add 4 mL Lysis buffer ACL
•add 1 mL ATL buffer
•add 500 µl Proteinse K solution, mix, vortex and incubate for 30 min at 60°C
Binding Step
•add 9 mL of Binding buffer ACB, vortex
•incubate for 10 min at -25°C
•QIAamp mini spin filtration
Washing Step
•add 600 µl of washing buffer ACW1, centrifuge for 1 min at 8000 rpm
•add 750 µl of washing buffer ACW2, centrifuge for1 min at 8000 rpm
•add 750 µl of Ethanol, centrigufe for 1 min at 8000 rpm and 3 min at 13200 rpm
•dry at 55°C for 20 min
Elution Step
•add 50 µl Elution buffer AVE
•incubate for 3 min at room temperature, centrifuge for 3 min at 13200 rpm
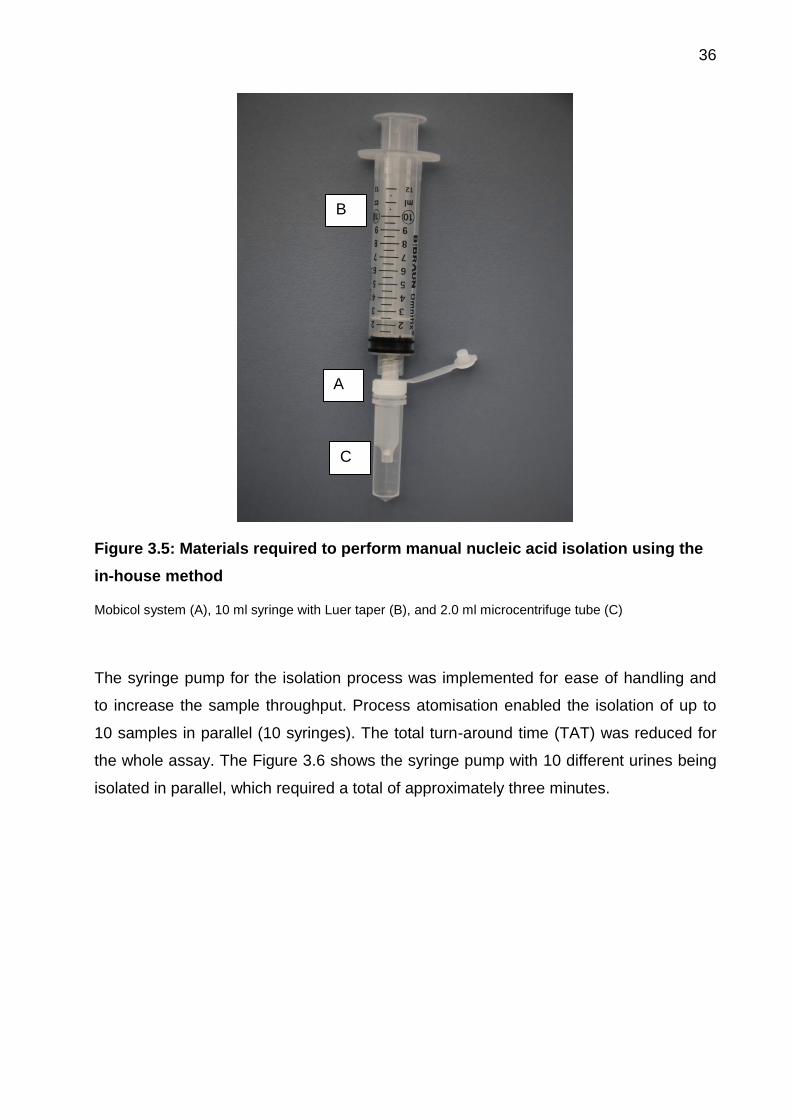
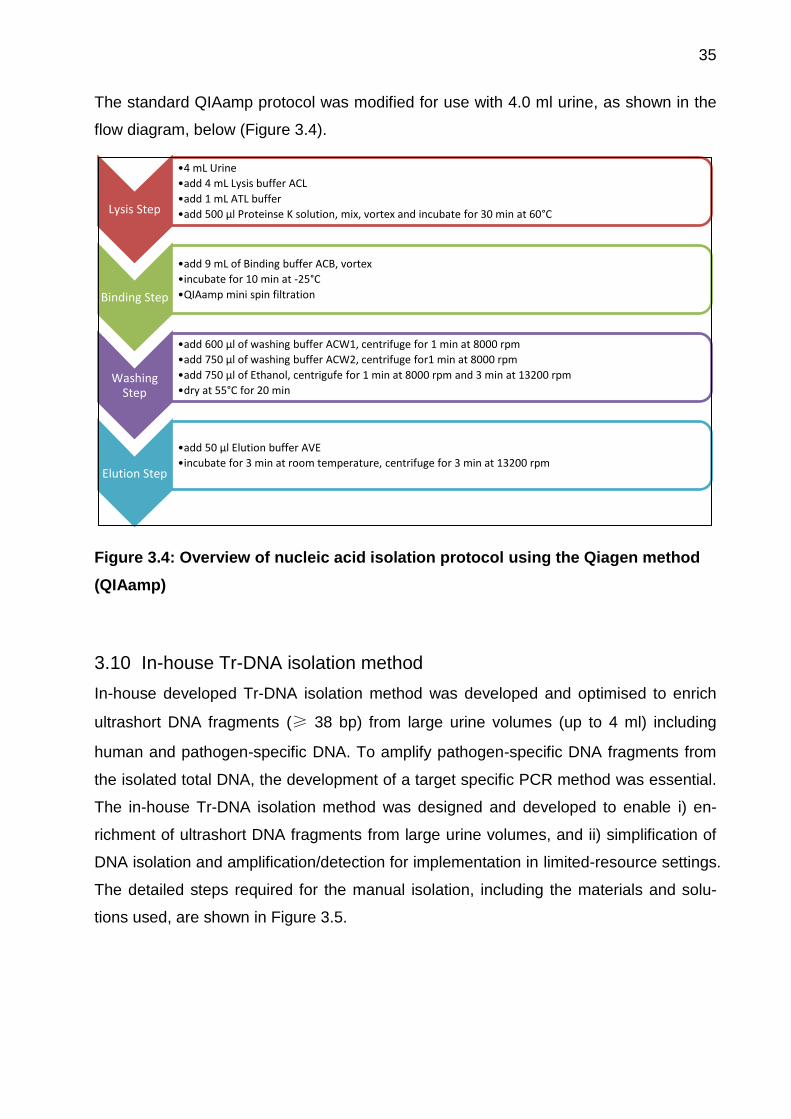
36
Figure 3.5: Materials required to perform manual nucleic acid isolation using the
in-house method
Mobicol system (A), 10 ml syringe with Luer taper (B), and 2.0 ml microcentrifuge tube (C)
The syringe pump for the isolation process was implemented for ease of handling and
to increase the sample throughput. Process atomisation enabled the isolation of up to
10 samples in parallel (10 syringes). The total turn-around time (TAT) was reduced for
the whole assay. The Figure 3.6 shows the syringe pump with 10 different urines being
isolated in parallel, which required a total of approximately three minutes.
A
B
C
37
Figure 3.6: Tr-DNA isolation using a syringe pump with a modified stand for verti-
cal positioning to accommodate 10 samples
The 10 mL Leur lock syringe was used for isolation. The syringe pump was set at a force level of 50%
and a constant rate of 3 ml/min. The isolation was performed under a class III biosafety cabinet.
3.10.1 Binding and elution principle of the in-house method
The in-house method uses capture matrix and binding buffer. This method, unlike the
Qiagen kit, does not contain a lysis step. The standard capture matrix usually consists
of silicates (Si(OH)4), polysaccharides (dextran, Sepharose a cross-linked agarose, or
cellulose) or synthetic polymers (polyvinyl alcohol). These matrices have free hydroxyl
(OH) groups that are modified and bind DNA molecules using their functional groups.
The chaotropic agent present in the binding matrix desaturates biomolecules by inter-
38
rupting the hydration shell around the DNA/RNA. Furthermore, positively-charged ions
enable a cation bridge to form between the negatively-charged capture matrix and the
negatively-charged DNA backbone in high salt concentrations. The DNA backbone and
the surface of the capture matrix build an electrostatic bond. The washing buffer (80 mM
potassium acetate, 8.3 mM Tris-HCl (pH 7.5), 40 μM EDTA and 70% ethanol) removes
the residual inhibitors from the sample without losing the DNA bound to the capture
matrix. The ethanol in the wash buffer acts as a precipitant and helps the DNA
backbone adhere to the capture matrix. In the final step, nuclease-free water breaks the
bond between the capture matrix and the DNA. The free DNA can now be eluted for
downstream analysis. Figure 3.7 shows the DNA binding principle for the in-house
method.
(Source: Promega)
Figure 3.7: Representation of DNA binding principle for the in-house method us-
ing the capture matrix
39
3.10.2 In-house Tr-DNA isolation method optimisation
The Tr-DNA isolation method, capable of capturing shorter DNA fragments (> 75 bp)
was optimised for ultrashort fragments (≥ 38 bp) using the previously described meth-
od [70]. The in-house developed Tr-DNA isolation method was compared with the
commercially available QIAamp Circulating Nucleic Acid Kit. The performance charac-
teristics of both approaches (Qiagen and in-house) were analysed using different sets of
experiments to optimise Tr-DNA isolation.
Inhibition of the PCR reaction is the main concern for molecular assays, and removing
inhibitors in pre-PCR steps is needed to keep PCR performance high. DNA capture effi-
ciency and the effect of total DNA content on PCR performance were taken into consid-
eration for in-house method optimisation. The entire optimisation effort was divided into
three major groups: i) reagent optimisation, ii) process optimisation, and iii) elution opti-
misation. The optimised method should increase PCR efficiency, stablise the isolation
process, and reduced the degree of PCR inhibition.
3.10.2.1 Optimisation of urine and reagent volume
The urine and reagent volume required for Tr-DNA isolation were then optimised for the
in-house method. Urine volumes of 4.0, 2.0, 1.0, and 0.5 ml were used for optimisation.
The assay reagents for the in-house developed method were also reduced according to
the urine volume used. 25 µl of (100 cp/µl) 50 bp DNA fragment was spiked into each
volume using two different urine samples. Each urine sample was isolated in duplicates,
and each eluate was further measured in duplicates using the SYBR Green-based PCR
method. From 50 µl of eluate, 10 µl of eluate was added to 90 µl of master mix solution
for the PCR process. For the positive control, 10 µl of (100 cp/µl) 50 bp DNA fragments
was spiked into nuclease free water. Table 3.2 summarises the reagent volumes re-
quired for different urine volume.
40
Table 3.2: Reagent volumes required for different urine volume isolation using the
in-house method
Urine volume (ml) Binding buffer (ml) Capture matrix (ml) DNA fragments
(50 bp, 100 cp/µl)
4 6 1 25 µl
2 3 0.5 25 µl
1 1.5 0.25 25 µl
0.5 0.75 0.125 25 µl
3.10.2.2 Isolation method ability to recover DNA from spiked urine
Up to five urine samples were spiked with three different concentrations (100 cp/µl,
1000 cp/µl, and 10,000 cp/µl) of synthetic DNA fragments (38 bp, 50 bp, 75 bp, 100 bp,
150 bp, 200 bp), and H37Rv gDNA to assess the isolation performance of the in-house
method. Briefly, 25 µl of DNA fragments or H37Rv gDNA was added to 4 ml of urine.
DNA isolation was performed on the same spiked samples for the in-house and the Qi-
agen methods. DNA was recovered in 50 µl of eluate. 20 µl of eluate was used for the
SYBR Green PCR analysis to compare method performance regarding DNA yield and
reproducibility. In total 100 µl of final PCR volume was analysed in duplicates. Inhibition
control was performed in parallel to monitor the PCR process and reagent quality.
3.10.2.3 Influence of inhibitors and urine samples on PCR efficiency
The DNA eluate isolated using the Tr-DNA method may have carried unknown PCR
inhibitors, which could have originated from the isolation method or from the sample
itself. Thus, the potential effect of the inhibitors on PCR efficiency was evaluated from
six different urine samples. Control urine eluates were spiked with DNA fragments of
different sizes (38 bp, 50 bp, 75 bp, 100 bp, 150 bp, 200 bp), and H37Rv gDNA. 1 µl of
DNA fragments was added to form a concentration of 1000 cp for inhibition control. A
negative control was run in each PCR experiment. In total, 100 µl of final reaction vol-
ume was analysed using the SYBR Green-based PCR method. Each urine eluate was
measured in duplicate.
41
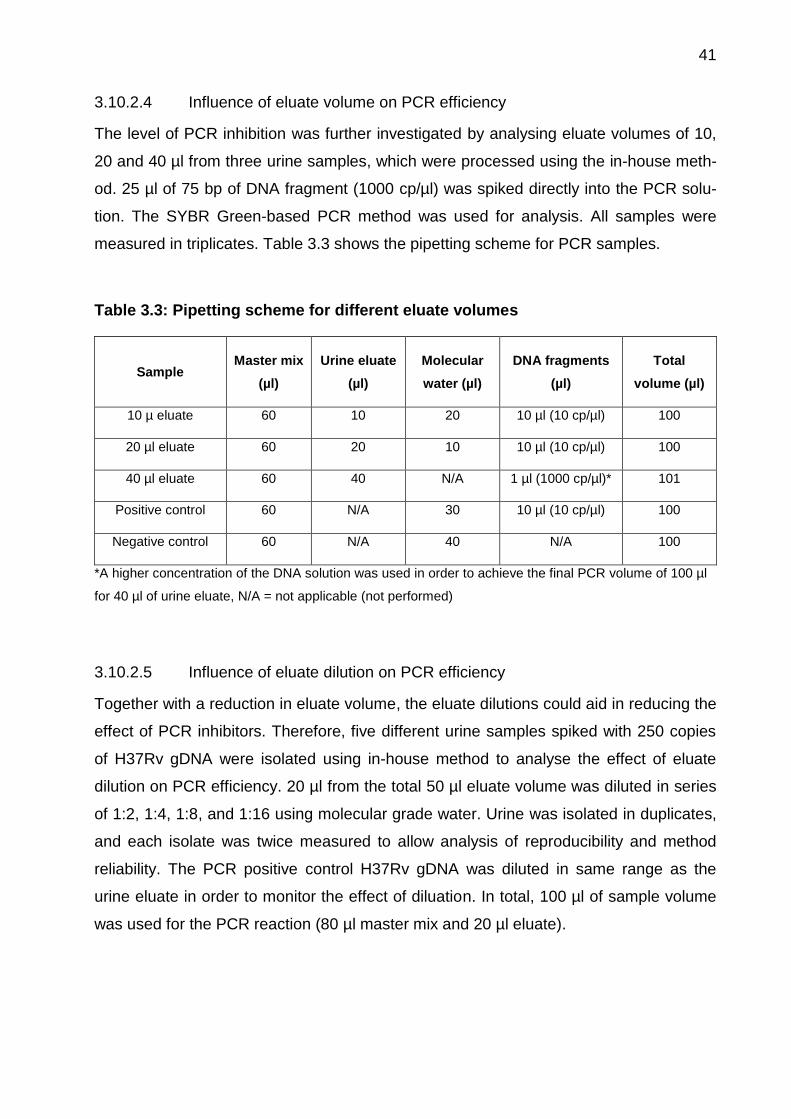
3.10.2.4 Influence of eluate volume on PCR efficiency
The level of PCR inhibition was further investigated by analysing eluate volumes of 10,
20 and 40 µl from three urine samples, which were processed using the in-house meth-
od. 25 µl of 75 bp of DNA fragment (1000 cp/µl) was spiked directly into the PCR solu-
tion. The SYBR Green-based PCR method was used for analysis. All samples were
measured in triplicates. Table 3.3 shows the pipetting scheme for PCR samples.
Table 3.3: Pipetting scheme for different eluate volumes
Sample Master mix
(µl)
Urine eluate
(µl)
Molecular
water (µl)
DNA fragments
(µl)
Total
volume (µl)
10 µ eluate 60 10 20 10 µl (10 cp/µl) 100
20 µl eluate 60 20 10 10 µl (10 cp/µl) 100
40 µl eluate 60 40 N/A 1 µl (1000 cp/µl)* 101
Positive control 60 N/A 30 10 µl (10 cp/µl) 100
Negative control 60 N/A 40 N/A 100
*A higher concentration of the DNA solution was used in order to achieve the final PCR volume of 100 µl
for 40 µl of urine eluate, N/A = not applicable (not performed)
3.10.2.5 Influence of eluate dilution on PCR efficiency
Together with a reduction in eluate volume, the eluate dilutions could aid in reducing the
effect of PCR inhibitors. Therefore, five different urine samples spiked with 250 copies
of H37Rv gDNA were isolated using in-house method to analyse the effect of eluate
dilution on PCR efficiency. 20 µl from the total 50 µl eluate volume was diluted in series
of 1:2, 1:4, 1:8, and 1:16 using molecular grade water. Urine was isolated in duplicates,
and each isolate was twice measured to allow analysis of reproducibility and method
reliability. The PCR positive control H37Rv gDNA was diluted in same range as the
urine eluate in order to monitor the effect of diluation. In total, 100 µl of sample volume
was used for the PCR reaction (80 µl master mix and 20 µl eluate).
42
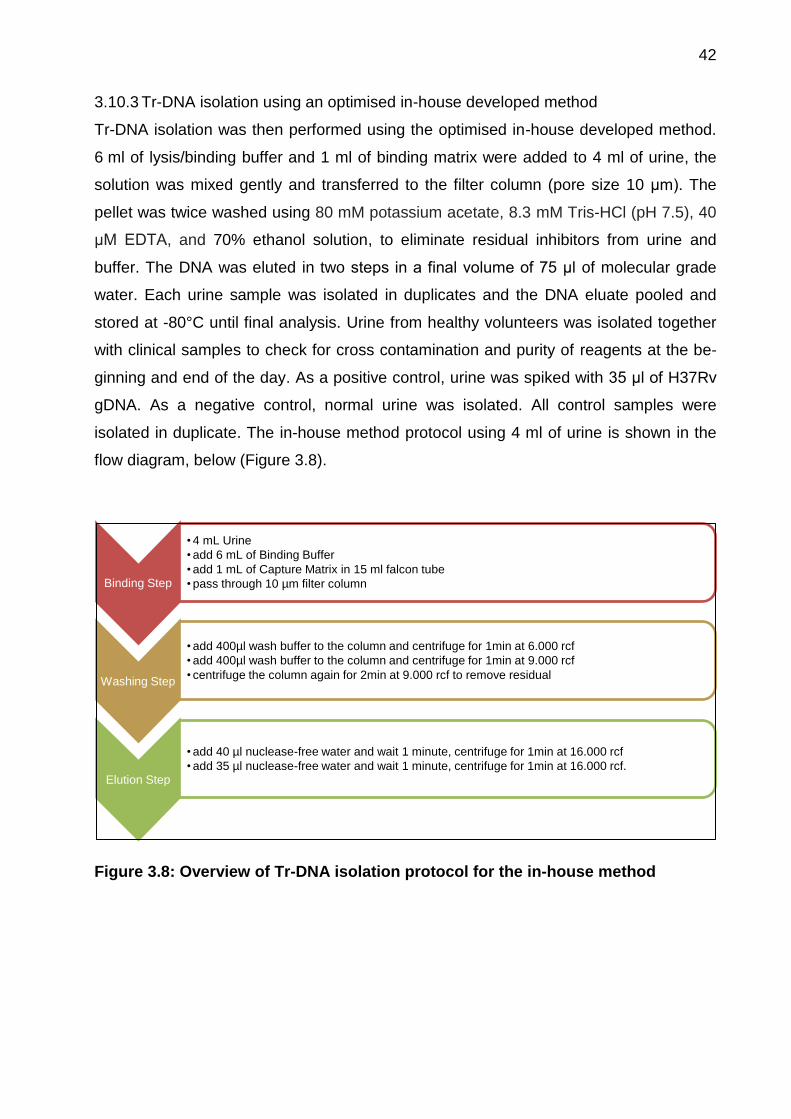
3.10.3 Tr-DNA isolation using an optimised in-house developed method
Tr-DNA isolation was then performed using the optimised in-house developed method.
6 ml of lysis/binding buffer and 1 ml of binding matrix were added to 4 ml of urine, the
solution was mixed gently and transferred to the filter column (pore size 10 μm). The
pellet was twice washed using 80 mM potassium acetate, 8.3 mM Tris-HCl (pH 7.5), 40
μM EDTA, and 70% ethanol solution, to eliminate residual inhibitors from urine and
buffer. The DNA was eluted in two steps in a final volume of 75 μl of molecular grade
water. Each urine sample was isolated in duplicates and the DNA eluate pooled and
stored at -80°C until final analysis. Urine from healthy volunteers was isolated together
with clinical samples to check for cross contamination and purity of reagents at the be-
ginning and end of the day. As a positive control, urine was spiked with 35 μl of H37Rv
gDNA. As a negative control, normal urine was isolated. All control samples were
isolated in duplicate. The in-house method protocol using 4 ml of urine is shown in the
flow diagram, below (Figure 3.8).
Figure 3.8: Overview of Tr-DNA isolation protocol for the in-house method
Binding Step
• 4 mL Urine
• add 6 mL of Binding Buffer
• add 1 mL of Capture Matrix in 15 ml falcon tube
• pass through 10 µm filter column
Washing Step
• add 400µl wash buffer to the column and centrifuge for 1min at 6.000 rcf
• add 400µl wash buffer to the column and centrifuge for 1min at 9.000 rcf
• centrifuge the column again for 2min at 9.000 rcf to remove residual
Elution Step
• add 40 µl nuclease-free water and wait 1 minute, centrifuge for 1min at 16.000 rcf
• add 35 µl nuclease-free water and wait 1 minute, centrifuge for 1min at 16.000 rcf.
43
3.11 Novel and rapid polymerase chain reaction using an automated ana-
lyser
The double-stranded primer-based PCR method works well as a lab-based real-time
PCR cycler. To bring the lab-based molecular test to resource-limited settings, we need
to implement the assay using the portable and automated POC-capable Alere q analys-
er. Different assay-related aspects were optimised, e.g., primer: quencher ratio, number
of PCR cycles, PCR steps, annealing and elongation temperatures, and duration of
each phase. The novel assay using the Alere q must be validated by comparison to the
existing SYBR Green-based PCR protocol mentioned earlier [70].
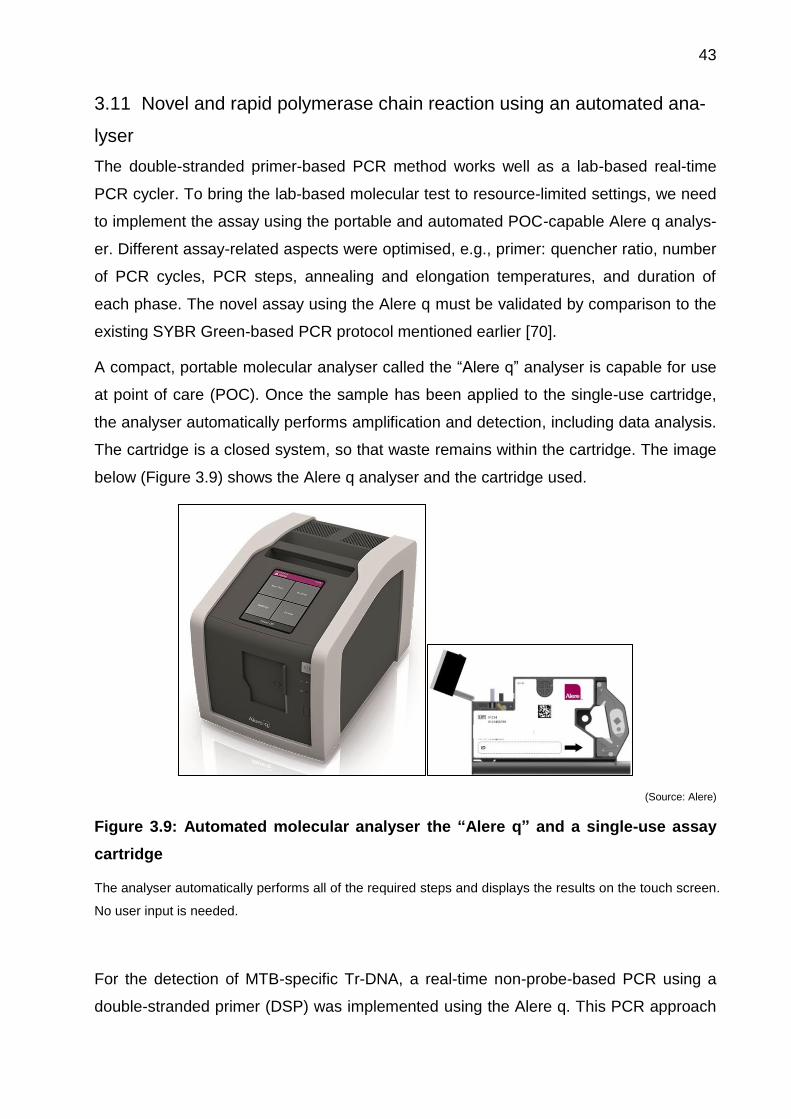
A compact, portable molecular analyser called the “Alere q” analyser is capable for use
at point of care (POC). Once the sample has been applied to the single-use cartridge,
the analyser automatically performs amplification and detection, including data analysis.
The cartridge is a closed system, so that waste remains within the cartridge. The image
below (Figure 3.9) shows the Alere q analyser and the cartridge used.
(Source: Alere)
Figure 3.9: Automated molecular analyser the “Alere q” and a single-use assay
cartridge
The analyser automatically performs all of the required steps and displays the results on the touch screen.
No user input is needed.
For the detection of MTB-specific Tr-DNA, a real-time non-probe-based PCR using a
double-stranded primer (DSP) was implemented using the Alere q. This PCR approach
44
was initially developed for detection of HIV [77]. In the DSP-based PCR, a fluorescent
dye is attached to the 5’ end of a forward primer, and a reverse complementary oligonu-
cleotide is labelled with a Black Hole Quencher dye (BHQ) at the 3’ end. The forward
primer binds in solution to its matched reverse oligonucleotide. The quencher prevents
the initial fluorescence. However, during amplification in the presence of the target, the
bond between the double-stranded primer and the quencher breaks and the fluores-
cently-labelled primer attaches to the target template [77]. This binding then shows an
increase in fluorescence signal.
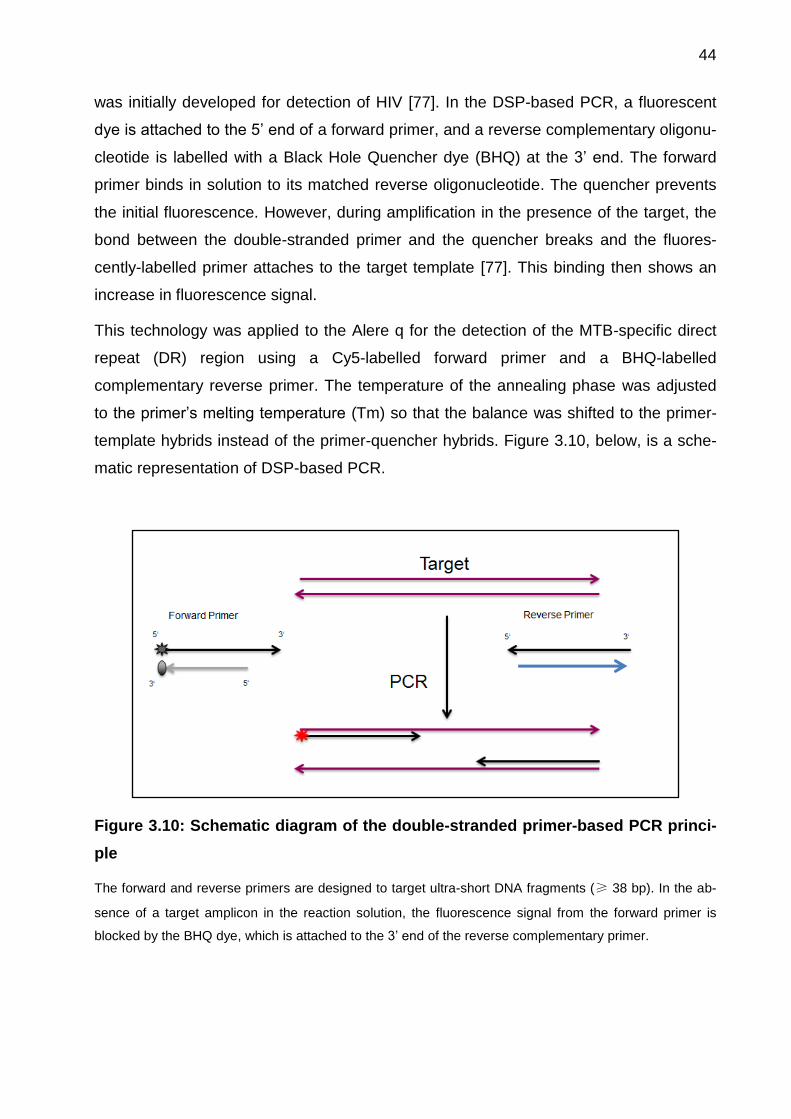
This technology was applied to the Alere q for the detection of the MTB-specific direct
repeat (DR) region using a Cy5-labelled forward primer and a BHQ-labelled
complementary reverse primer. The temperature of the annealing phase was adjusted
to the primer’s melting temperature (Tm) so that the balance was shifted to the primer-
template hybrids instead of the primer-quencher hybrids. Figure 3.10, below, is a sche-
matic representation of DSP-based PCR.
Figure 3.10: Schematic diagram of the double-stranded primer-based PCR princi-
ple
The forward and reverse primers are designed to target ultra-short DNA fragments (≥ 38 bp). In the ab-
sence of a target amplicon in the reaction solution, the fluorescence signal from the forward primer is
blocked by the BHQ dye, which is attached to the 3’ end of the reverse complementary primer.
45
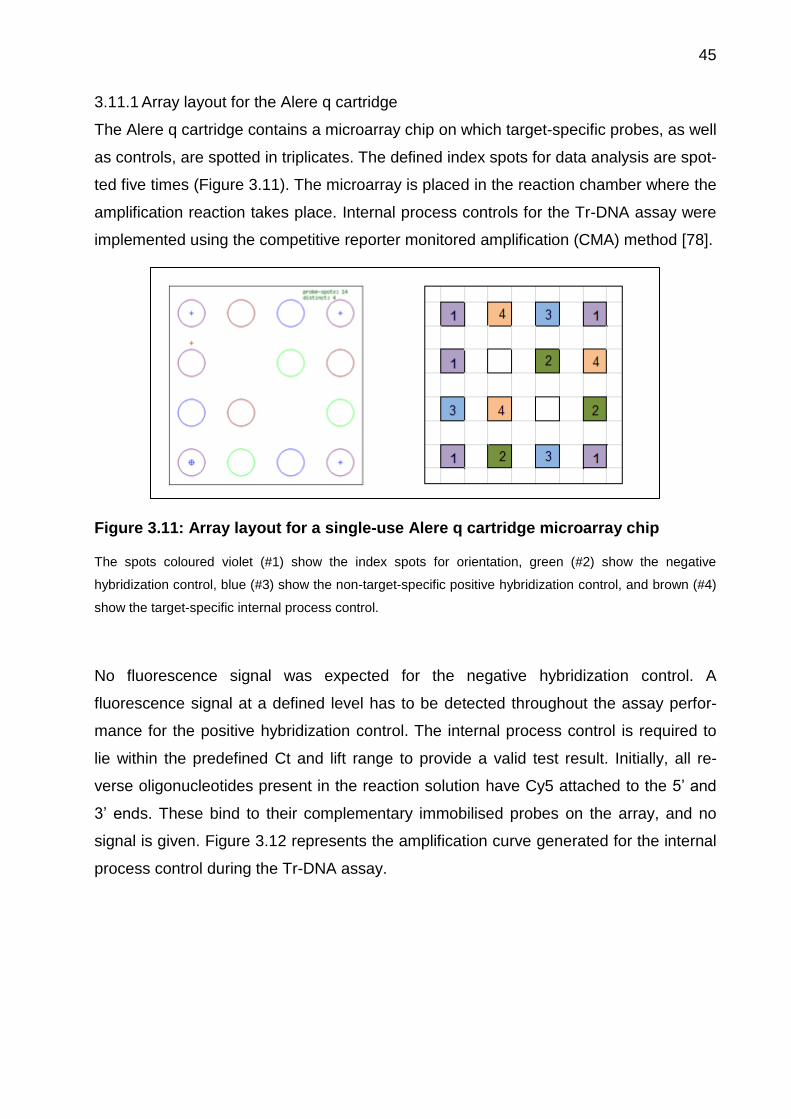
3.11.1 Array layout for the Alere q cartridge
The Alere q cartridge contains a microarray chip on which target-specific probes, as well
as controls, are spotted in triplicates. The defined index spots for data analysis are spot-
ted five times (Figure 3.11). The microarray is placed in the reaction chamber where the
amplification reaction takes place. Internal process controls for the Tr-DNA assay were
implemented using the competitive reporter monitored amplification (CMA) method [78].
Figure 3.11: Array layout for a single-use Alere q cartridge microarray chip
The spots coloured violet (#1) show the index spots for orientation, green (#2) show the negative
hybridization control, blue (#3) show the non-target-specific positive hybridization control, and brown (#4)
show the target-specific internal process control.
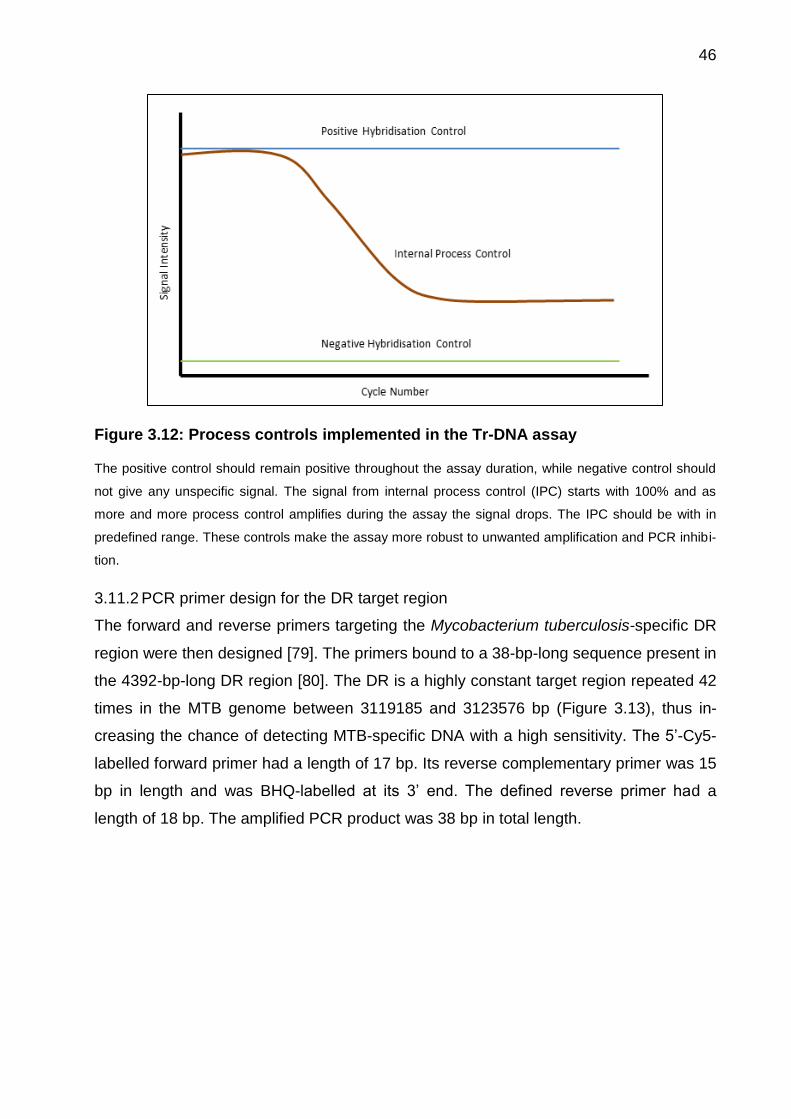
No fluorescence signal was expected for the negative hybridization control. A
fluorescence signal at a defined level has to be detected throughout the assay perfor-
mance for the positive hybridization control. The internal process control is required to
lie within the predefined Ct and lift range to provide a valid test result. Initially, all re-
verse oligonucleotides present in the reaction solution have Cy5 attached to the 5’ and
3’ ends. These bind to their complementary immobilised probes on the array, and no
signal is given. Figure 3.12 represents the amplification curve generated for the internal
process control during the Tr-DNA assay.
46
Figure 3.12: Process controls implemented in the Tr-DNA assay
The positive control should remain positive throughout the assay duration, while negative control should
not give any unspecific signal. The signal from internal process control (IPC) starts with 100% and as
more and more process control amplifies during the assay the signal drops. The IPC should be with in
predefined range. These controls make the assay more robust to unwanted amplification and PCR inhibi-
tion.
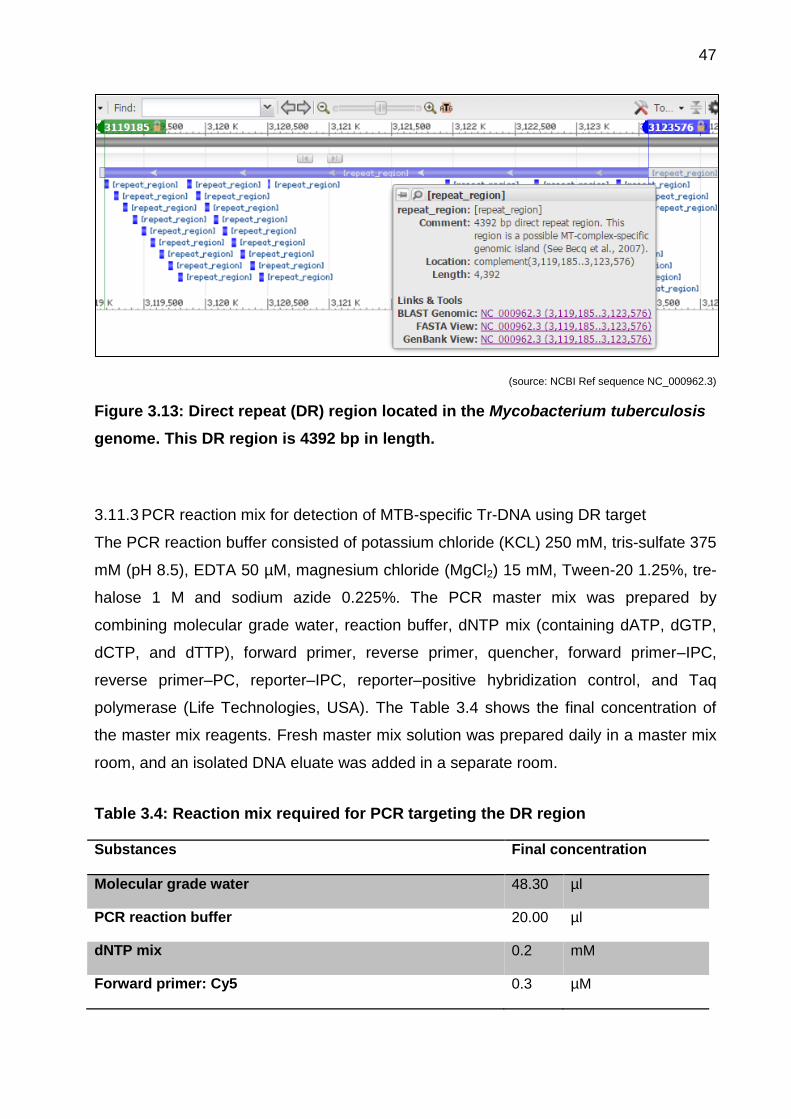
3.11.2 PCR primer design for the DR target region
The forward and reverse primers targeting the Mycobacterium tuberculosis-specific DR
region were then designed [79]. The primers bound to a 38-bp-long sequence present in
the 4392-bp-long DR region [80]. The DR is a highly constant target region repeated 42
times in the MTB genome between 3119185 and 3123576 bp (Figure 3.13), thus in-
creasing the chance of detecting MTB-specific DNA with a high sensitivity. The 5’-Cy5-
labelled forward primer had a length of 17 bp. Its reverse complementary primer was 15
bp in length and was BHQ-labelled at its 3’ end. The defined reverse primer had a
length of 18 bp. The amplified PCR product was 38 bp in total length.
47
(source: NCBI Ref sequence NC_000962.3)
Figure 3.13: Direct repeat (DR) region located in the Mycobacterium tuberculosis
genome. This DR region is 4392 bp in length.
3.11.3 PCR reaction mix for detection of MTB-specific Tr-DNA using DR target
The PCR reaction buffer consisted of potassium chloride (KCL) 250 mM, tris-sulfate 375
mM (pH 8.5), EDTA 50 µM, magnesium chloride (MgCl2) 15 mM, Tween-20 1.25%, tre-
halose 1 M and sodium azide 0.225%. The PCR master mix was prepared by
combining molecular grade water, reaction buffer, dNTP mix (containing dATP, dGTP,
dCTP, and dTTP), forward primer, reverse primer, quencher, forward primer–IPC,
reverse primer–PC, reporter–IPC, reporter–positive hybridization control, and Taq
polymerase (Life Technologies, USA). The Table 3.4 shows the final concentration of
the master mix reagents. Fresh master mix solution was prepared daily in a master mix
room, and an isolated DNA eluate was added in a separate room.
Table 3.4: Reaction mix required for PCR targeting the DR region
Substances Final concentration
Molecular grade water 48.30 µl
PCR reaction buffer 20.00 µl
dNTP mix 0.2 mM
Forward primer: Cy5 0.3 µM
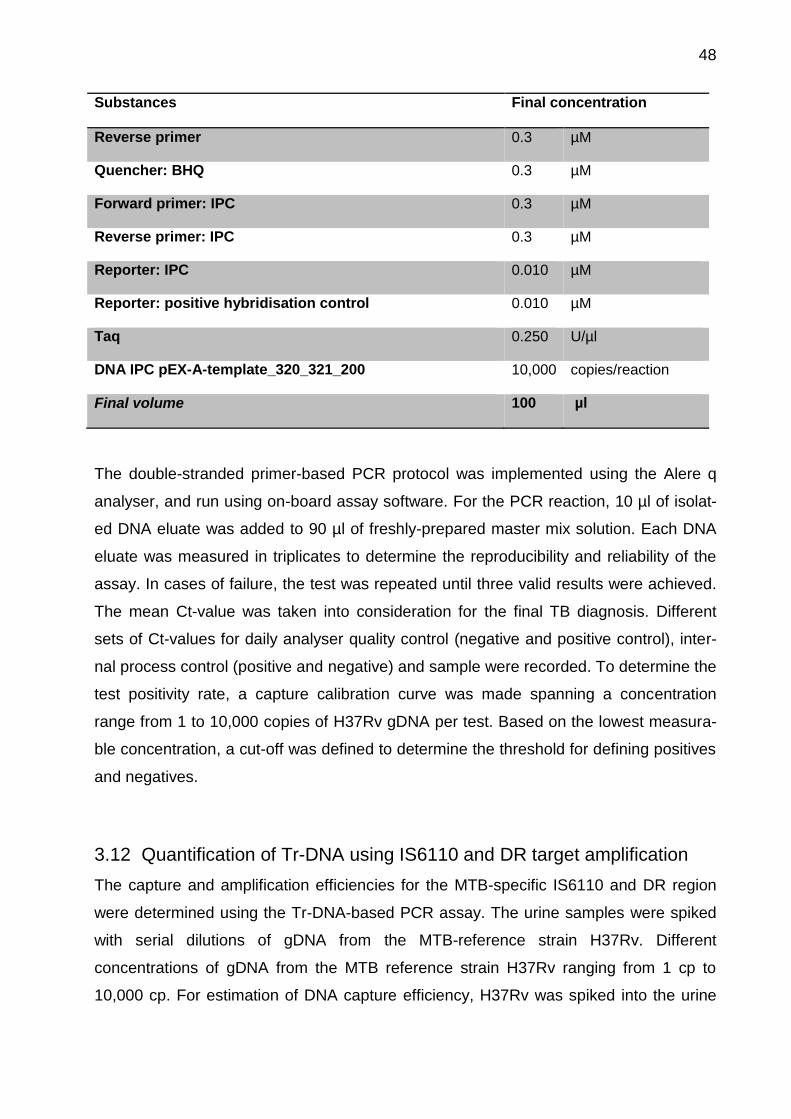
48
Substances Final concentration
Reverse primer 0.3 µM
Quencher: BHQ 0.3 µM
Forward primer: IPC 0.3 µM
Reverse primer: IPC 0.3 µM
Reporter: IPC 0.010 µM
Reporter: positive hybridisation control 0.010 µM
Taq 0.250 U/µl
DNA IPC pEX-A-template_320_321_200 10,000 copies/reaction
Final volume 100 µl
The double-stranded primer-based PCR protocol was implemented using the Alere q
analyser, and run using on-board assay software. For the PCR reaction, 10 µl of isolat-
ed DNA eluate was added to 90 µl of freshly-prepared master mix solution. Each DNA
eluate was measured in triplicates to determine the reproducibility and reliability of the
assay. In cases of failure, the test was repeated until three valid results were achieved.
The mean Ct-value was taken into consideration for the final TB diagnosis. Different
sets of Ct-values for daily analyser quality control (negative and positive control), inter-
nal process control (positive and negative) and sample were recorded. To determine the
test positivity rate, a capture calibration curve was made spanning a concentration
range from 1 to 10,000 copies of H37Rv gDNA per test. Based on the lowest measura-
ble concentration, a cut-off was defined to determine the threshold for defining positives
and negatives.
3.12 Quantification of Tr-DNA using IS6110 and DR target amplification
The capture and amplification efficiencies for the MTB-specific IS6110 and DR region
were determined using the Tr-DNA-based PCR assay. The urine samples were spiked
with serial dilutions of gDNA from the MTB-reference strain H37Rv. Different
concentrations of gDNA from the MTB reference strain H37Rv ranging from 1 cp to
10,000 cp. For estimation of DNA capture efficiency, H37Rv was spiked into the urine
49
and isolated using the in-house method. Furthermore, for estimation of PCR amplifica-
tion efficiency the H37Rv gDNA was directly spiked in to the master mix solution. The
calibration curves for IS6110 were generated on the AB cycler and for the DR region on
the Alere q analyser. The calibration curves for the DR region were generated using the
22-min two-step PCR protocol. All experiments were run in triplicates and the mean Ct-
values were plotted vs. the concentration of log H37Rv gDNA.
3.13 Controls and precautions to prevent contamination
Contamination of the reagents and lab facility can negatively impact assay quality. Thus,
in addition to negative isolation controls, PCR reagents including the target-specific pri-
mers must be contamination free. Therefore, differing sets of isolation (extraction), ana-
lyser and internal process controls were implemented in the Tr-DNA assay. The internal
process controls included an artificial sequence cloned into the plasmid pEX-A vector
(Eurofins Scientific, Germany). These checks aided in observing the reagent quality
(cross contamination and stability), the performance of the isolation method and Alere q
analyser. For DNA isolation, a negative control (normal urine) and positive control
(normal urine spiked with H37Rv genome) were isolated in duplicates during the first
and last round of isolation. All Alere q analysers were tested running a negative control
(molecular grade water) and a positive control (H37Rv genome) in the cartridge daily to
monitor analyser performance. The Alere q analysers were inspected for any perfor-
mance deviation and were sent immediately to technical service if this was detected.
Furthermore, to avoid cross contamination through reagents, all good laboratory prac-
tices were taken into consideration, i.e., separating master mix and template handling
area. All biosafety cabinets (BSC) were run with the appropriate air circulation and disin-
fected using DNA-Exitus (VWR Darmstadt, Germany) before and after pipetting. Cali-
brated pipettes and single-use dual filter pipette tips (PCR clean/sterile) were used. All
stock solutions were aliquoted into smaller volumes and stored at the appropriate tem-
perature.
50
3.14 Statistical analysis
A database was created using Microsoft Excel 2010 (Microsoft Inc. Redmond, USA).
Data quality control was performed on a regular basis, including the raw data collected
from participants’ case reporting forms (CRFs). Results from urine dipstick testing and
PCR data were stored in a separate Excel sheet. Bar charts were created using Excel.
The study cohort was characterised with descriptive statistics for various demographic
data and clinical symptoms. Different sets of statistical tests (chi-square, Kruskal-Wallis
one-way analysis of variance, and logistic regression) were performed using Sigma Plot,
version 11 (Systat Software GmbH, Erkrath, Germany). The sensitivity (true posi-
tive/total positive), specificity (true negative/total negative), negative predictive value
(true negative/{true negative + false negative}), positive predictive value (true posi-
tive/{true positive+ false positive}), negative likelihood ratio ({100 – sensitivi-
ty}/specificity), and positive likelihood ratio (sensitivity/{100 – specificity}) were
calculated the for Tr-DNA assay, using the liquid culture as the reference method [81].
The two groups were compared using a Man-Whitney Rank sum test or t-test (two-sided)
at an alpha of 0.05, and 95% CIs were calculated using the exact Clopper-Pearson, log
method and standard logit model. The Z tests for proportions were performed for sex,
HIV status and TB history. Receiver operating characteristic (ROC) curves were
generated to show sensitivity and specificity against different diagnostic tests (sputum
smear microscopy, Xpert MTB/RIF and liquid culture) [82]. ROC curves were also gen-
erated to compare assay performance for IS6110 and DR targets. The Fisher exact Chi-
square test was performed to check the statistical difference between male and female
regarding HIV prevalence. The multivariate and univariate analyses for potential
confounding variables and odds ratios (ORs) was calculated by logistic regression. A
Venn four-set diagram using ellipses was generated, showing the relationships between
the different diagnostic tests.
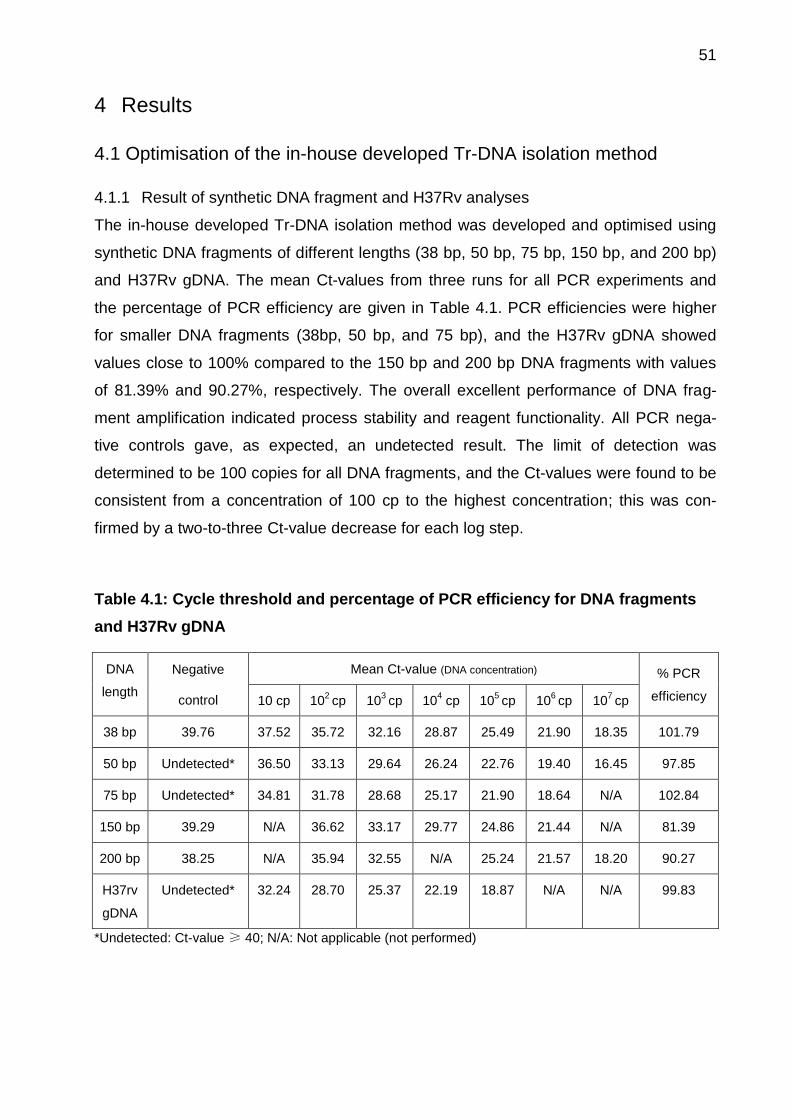
51
4 Results
4.1 Optimisation of the in-house developed Tr-DNA isolation method
4.1.1 Result of synthetic DNA fragment and H37Rv analyses
The in-house developed Tr-DNA isolation method was developed and optimised using
synthetic DNA fragments of different lengths (38 bp, 50 bp, 75 bp, 150 bp, and 200 bp)
and H37Rv gDNA. The mean Ct-values from three runs for all PCR experiments and
the percentage of PCR efficiency are given in Table 4.1. PCR efficiencies were higher
for smaller DNA fragments (38bp, 50 bp, and 75 bp), and the H37Rv gDNA showed
values close to 100% compared to the 150 bp and 200 bp DNA fragments with values
of 81.39% and 90.27%, respectively. The overall excellent performance of DNA frag-
ment amplification indicated process stability and reagent functionality. All PCR nega-
tive controls gave, as expected, an undetected result. The limit of detection was
determined to be 100 copies for all DNA fragments, and the Ct-values were found to be
consistent from a concentration of 100 cp to the highest concentration; this was con-
firmed by a two-to-three Ct-value decrease for each log step.
Table 4.1: Cycle threshold and percentage of PCR efficiency for DNA fragments
and H37Rv gDNA
DNA
length
Negative
control
Mean Ct-value (DNA concentration) % PCR
efficiency 10 cp 102 cp 10
3 cp 10
4 cp 10
5 cp 10
6 cp 10
7 cp
38 bp 39.76 37.52 35.72 32.16 28.87 25.49 21.90 18.35 101.79
50 bp Undetected* 36.50 33.13 29.64 26.24 22.76 19.40 16.45 97.85
75 bp Undetected* 34.81 31.78 28.68 25.17 21.90 18.64 N/A 102.84
150 bp 39.29 N/A 36.62 33.17 29.77 24.86 21.44 N/A 81.39
200 bp 38.25 N/A 35.94 32.55 N/A 25.24 21.57 18.20 90.27
H37rv
gDNA
Undetected* 32.24 28.70 25.37 22.19 18.87 N/A N/A 99.83
*Undetected: Ct-value ≥ 40; N/A: Not applicable (not performed)
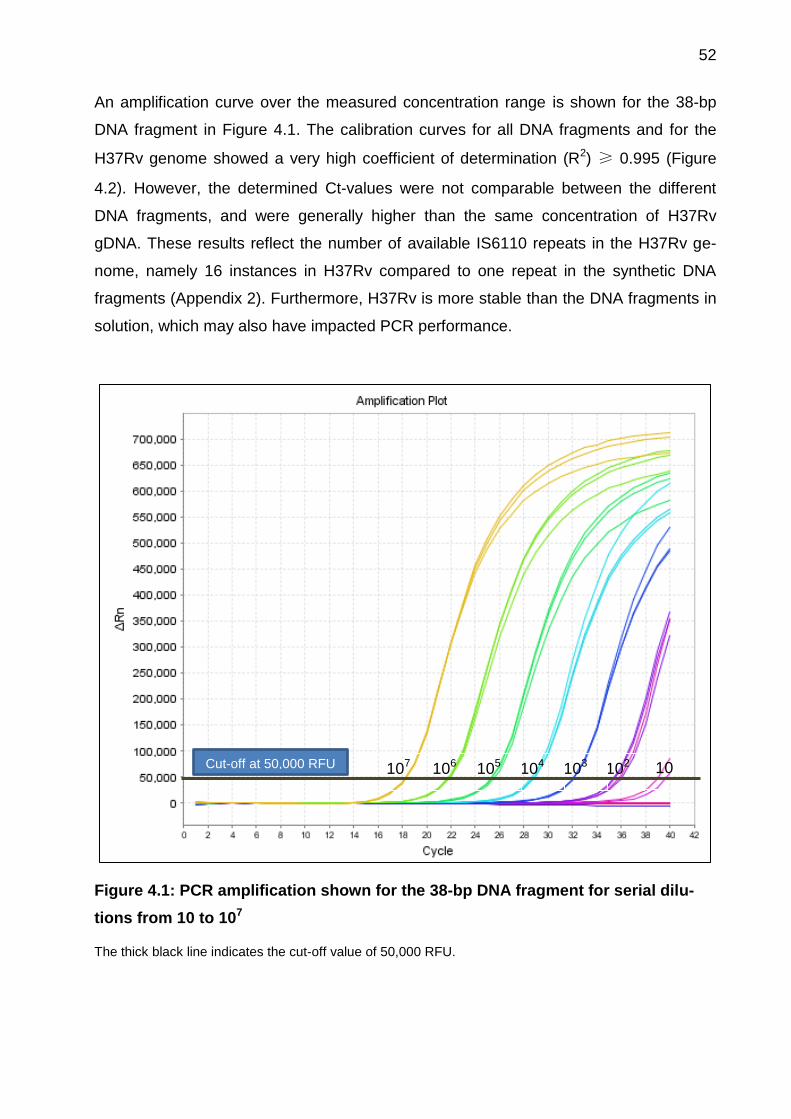
52
An amplification curve over the measured concentration range is shown for the 38-bp
DNA fragment in Figure 4.1. The calibration curves for all DNA fragments and for the
H37Rv genome showed a very high coefficient of determination (R2) ≥ 0.995 (Figure
4.2). However, the determined Ct-values were not comparable between the different
DNA fragments, and were generally higher than the same concentration of H37Rv
gDNA. These results reflect the number of available IS6110 repeats in the H37Rv ge-
nome, namely 16 instances in H37Rv compared to one repeat in the synthetic DNA
fragments (Appendix 2). Furthermore, H37Rv is more stable than the DNA fragments in
solution, which may also have impacted PCR performance.
Figure 4.1: PCR amplification shown for the 38-bp DNA fragment for serial dilu-
tions from 10 to 107
The thick black line indicates the cut-off value of 50,000 RFU.
102 103 104 105 106 107 10 Cut-off at 50,000 RFU
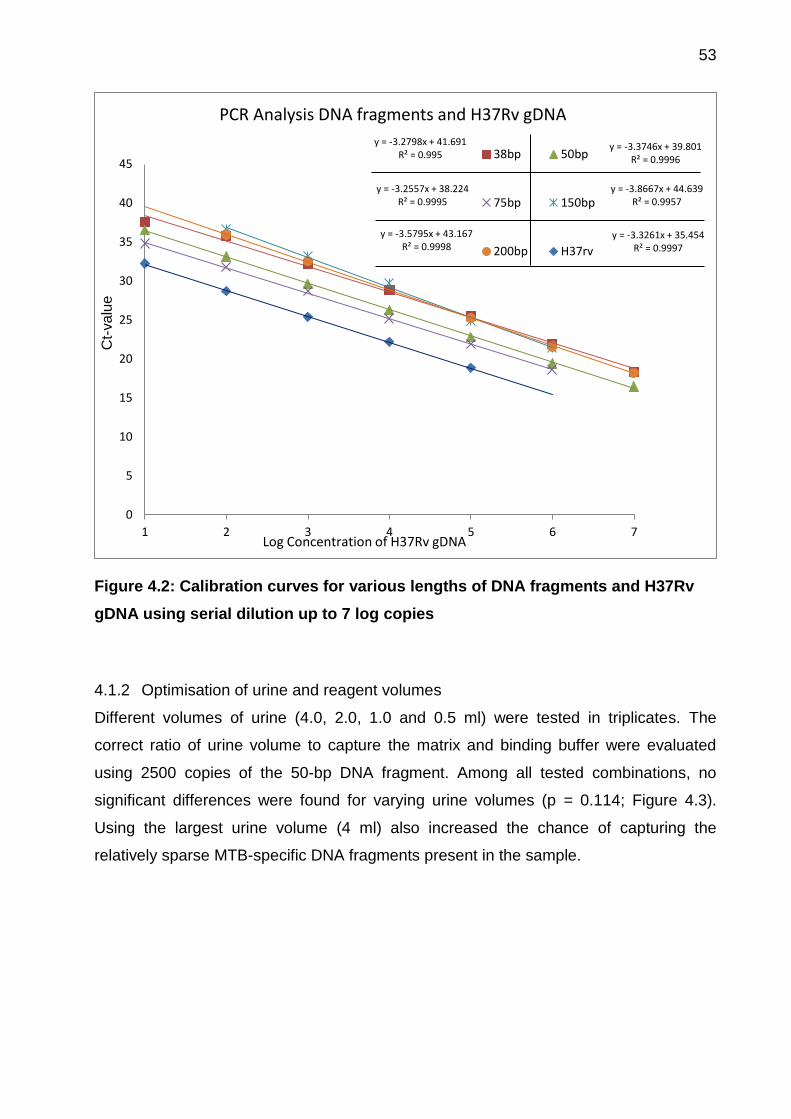
53
Figure 4.2: Calibration curves for various lengths of DNA fragments and H37Rv
gDNA using serial dilution up to 7 log copies
4.1.2 Optimisation of urine and reagent volumes
Different volumes of urine (4.0, 2.0, 1.0 and 0.5 ml) were tested in triplicates. The
correct ratio of urine volume to capture the matrix and binding buffer were evaluated
using 2500 copies of the 50-bp DNA fragment. Among all tested combinations, no
significant differences were found for varying urine volumes (p = 0.114; Figure 4.3).
Using the largest urine volume (4 ml) also increased the chance of capturing the
relatively sparse MTB-specific DNA fragments present in the sample.
y = -3.2798x + 41.691 R² = 0.995
y = -3.3746x + 39.801 R² = 0.9996
y = -3.2557x + 38.224 R² = 0.9995
y = -3.8667x + 44.639 R² = 0.9957
y = -3.5795x + 43.167 R² = 0.9998
y = -3.3261x + 35.454 R² = 0.9997
0
5
10
15
20
25
30
35
40
45
1 2 3 4 5 6 7
PCR Analysis DNA fragments and H37Rv gDNA
38bp 50bp
75bp 150bp
200bp H37rv
Ct-
va
lue
Log Concentration of H37Rv gDNA
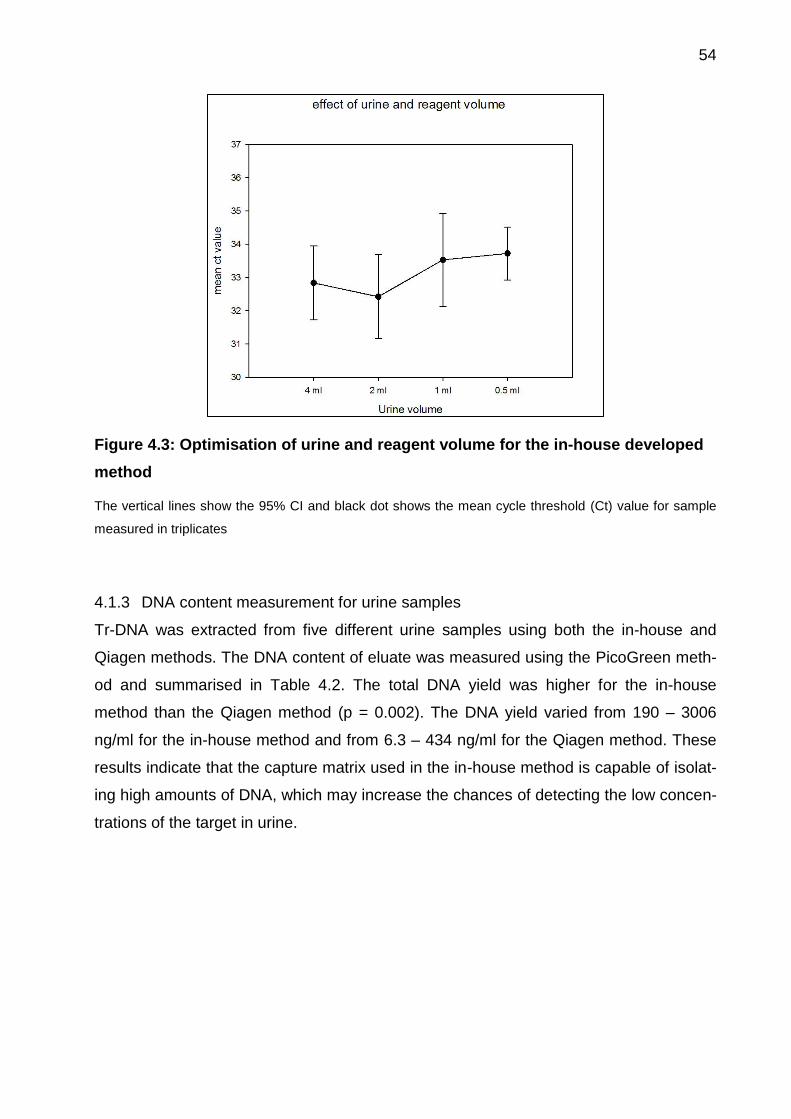
54
Figure 4.3: Optimisation of urine and reagent volume for the in-house developed
method
The vertical lines show the 95% CI and black dot shows the mean cycle threshold (Ct) value for sample
measured in triplicates
4.1.3 DNA content measurement for urine samples
Tr-DNA was extracted from five different urine samples using both the in-house and
Qiagen methods. The DNA content of eluate was measured using the PicoGreen meth-
od and summarised in Table 4.2. The total DNA yield was higher for the in-house
method than the Qiagen method (p = 0.002). The DNA yield varied from 190 – 3006
ng/ml for the in-house method and from 6.3 – 434 ng/ml for the Qiagen method. These
results indicate that the capture matrix used in the in-house method is capable of isolat-
ing high amounts of DNA, which may increase the chances of detecting the low concen-
trations of the target in urine.
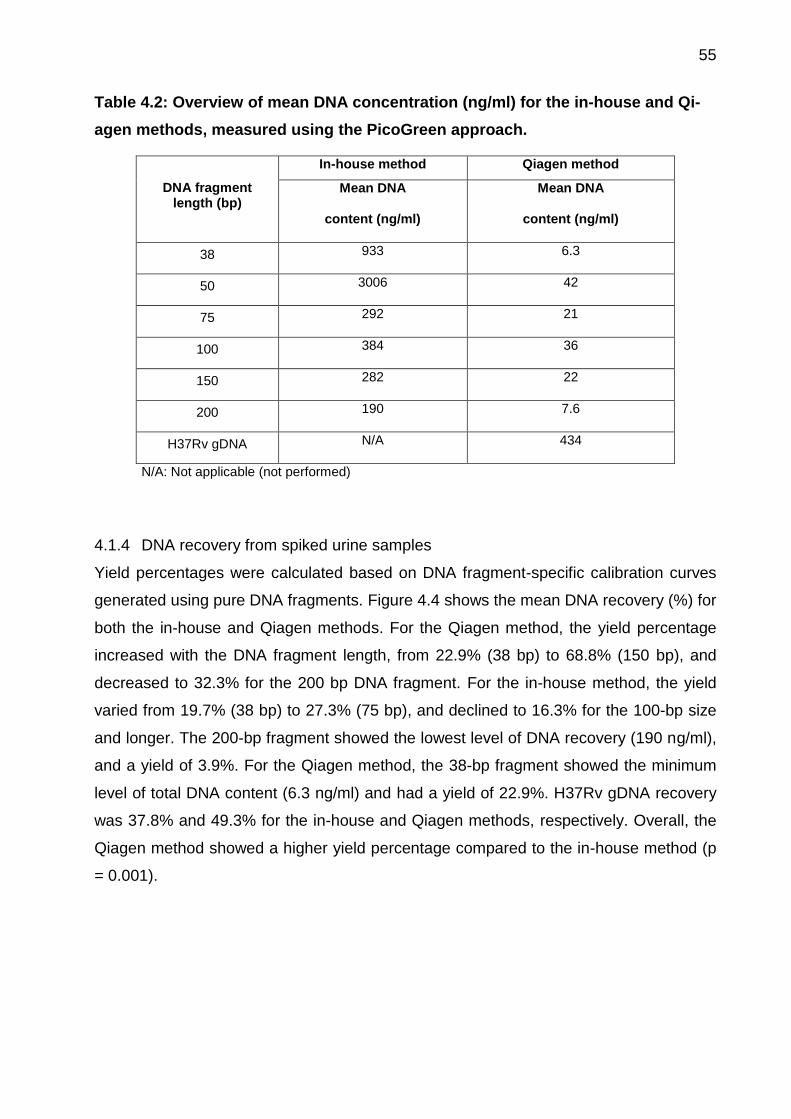
55
Table 4.2: Overview of mean DNA concentration (ng/ml) for the in-house and Qi-
agen methods, measured using the PicoGreen approach.
DNA fragment length (bp)
In-house method Qiagen method
Mean DNA
content (ng/ml)
Mean DNA
content (ng/ml)
38 933 6.3
50 3006 42
75 292 21
100 384 36
150 282 22
200 190 7.6
H37Rv gDNA N/A 434
N/A: Not applicable (not performed)
4.1.4 DNA recovery from spiked urine samples
Yield percentages were calculated based on DNA fragment-specific calibration curves
generated using pure DNA fragments. Figure 4.4 shows the mean DNA recovery (%) for
both the in-house and Qiagen methods. For the Qiagen method, the yield percentage
increased with the DNA fragment length, from 22.9% (38 bp) to 68.8% (150 bp), and
decreased to 32.3% for the 200 bp DNA fragment. For the in-house method, the yield
varied from 19.7% (38 bp) to 27.3% (75 bp), and declined to 16.3% for the 100-bp size
and longer. The 200-bp fragment showed the lowest level of DNA recovery (190 ng/ml),
and a yield of 3.9%. For the Qiagen method, the 38-bp fragment showed the minimum
level of total DNA content (6.3 ng/ml) and had a yield of 22.9%. H37Rv gDNA recovery
was 37.8% and 49.3% for the in-house and Qiagen methods, respectively. Overall, the
Qiagen method showed a higher yield percentage compared to the in-house method (p
= 0.001).
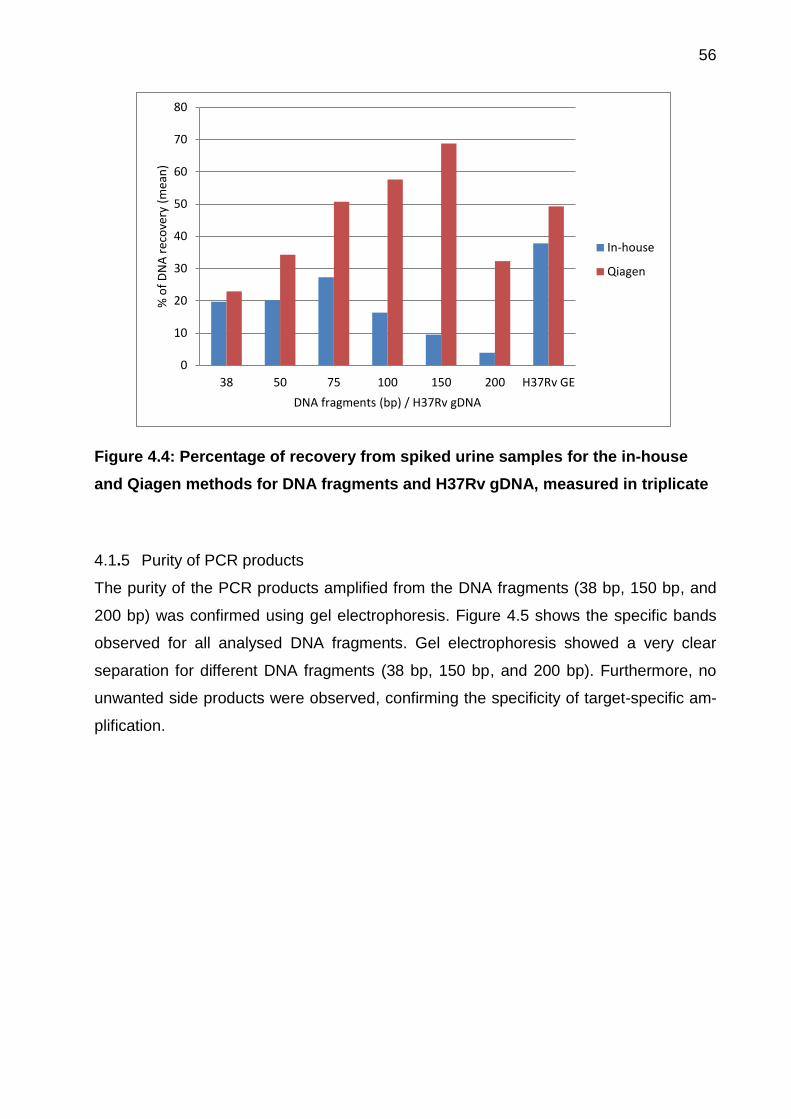
56
Figure 4.4: Percentage of recovery from spiked urine samples for the in-house
and Qiagen methods for DNA fragments and H37Rv gDNA, measured in triplicate
4.1.5 Purity of PCR products
The purity of the PCR products amplified from the DNA fragments (38 bp, 150 bp, and
200 bp) was confirmed using gel electrophoresis. Figure 4.5 shows the specific bands
observed for all analysed DNA fragments. Gel electrophoresis showed a very clear
separation for different DNA fragments (38 bp, 150 bp, and 200 bp). Furthermore, no
unwanted side products were observed, confirming the specificity of target-specific am-
plification.
0
10
20
30
40
50
60
70
80
38 50 75 100 150 200 H37Rv GE
% o
f D
NA
rec
ove
ry (
mea
n)
DNA fragments (bp) / H37Rv gDNA
In-house
Qiagen
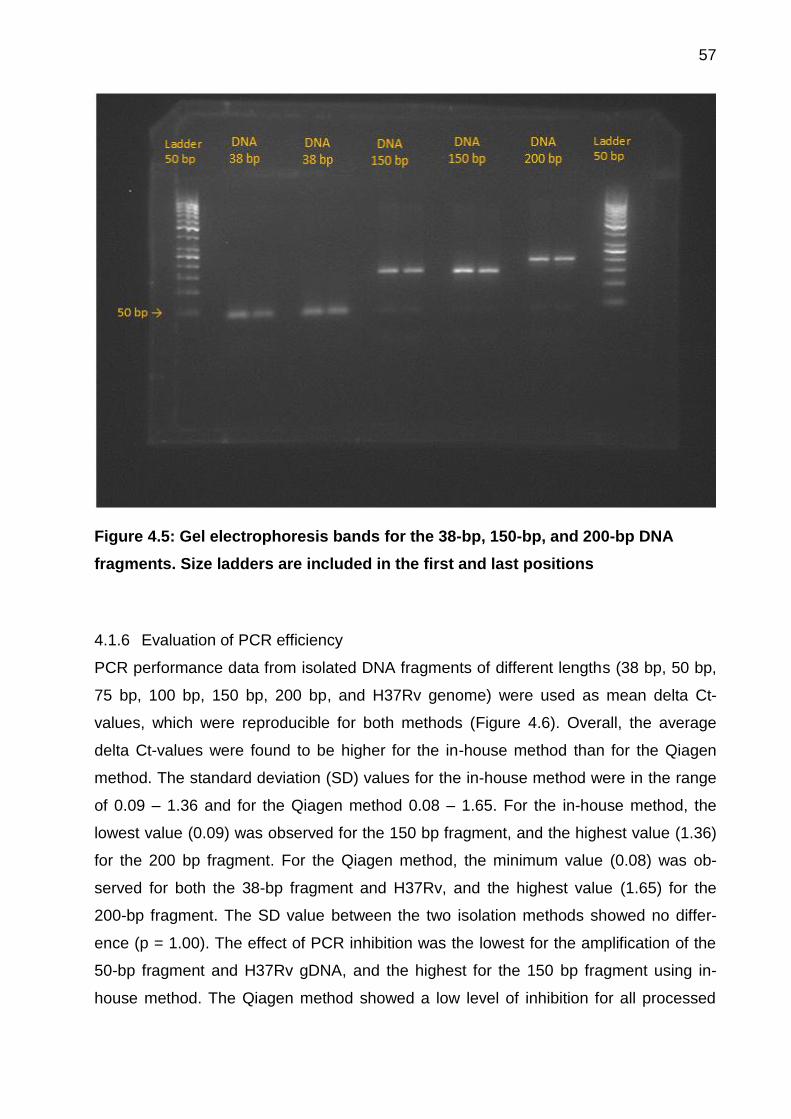
57
Figure 4.5: Gel electrophoresis bands for the 38-bp, 150-bp, and 200-bp DNA
fragments. Size ladders are included in the first and last positions
4.1.6 Evaluation of PCR efficiency
PCR performance data from isolated DNA fragments of different lengths (38 bp, 50 bp,
75 bp, 100 bp, 150 bp, 200 bp, and H37Rv genome) were used as mean delta Ct-
values, which were reproducible for both methods (Figure 4.6). Overall, the average
delta Ct-values were found to be higher for the in-house method than for the Qiagen
method. The standard deviation (SD) values for the in-house method were in the range
of 0.09 – 1.36 and for the Qiagen method 0.08 – 1.65. For the in-house method, the
lowest value (0.09) was observed for the 150 bp fragment, and the highest value (1.36)
for the 200 bp fragment. For the Qiagen method, the minimum value (0.08) was ob-
served for both the 38-bp fragment and H37Rv, and the highest value (1.65) for the
200-bp fragment. The SD value between the two isolation methods showed no differ-
ence (p = 1.00). The effect of PCR inhibition was the lowest for the amplification of the
50-bp fragment and H37Rv gDNA, and the highest for the 150 bp fragment using in-
house method. The Qiagen method showed a low level of inhibition for all processed
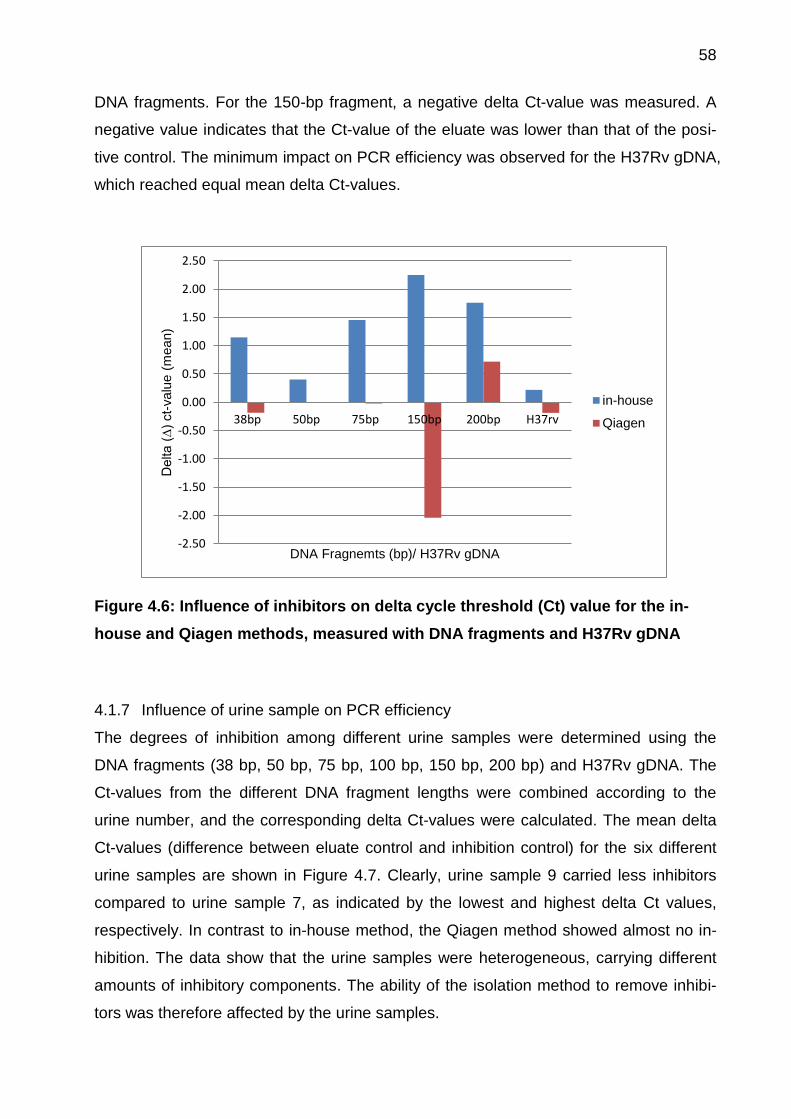
58
DNA fragments. For the 150-bp fragment, a negative delta Ct-value was measured. A
negative value indicates that the Ct-value of the eluate was lower than that of the posi-
tive control. The minimum impact on PCR efficiency was observed for the H37Rv gDNA,
which reached equal mean delta Ct-values.
Figure 4.6: Influence of inhibitors on delta cycle threshold (Ct) value for the in-
house and Qiagen methods, measured with DNA fragments and H37Rv gDNA
4.1.7 Influence of urine sample on PCR efficiency
The degrees of inhibition among different urine samples were determined using the
DNA fragments (38 bp, 50 bp, 75 bp, 100 bp, 150 bp, 200 bp) and H37Rv gDNA. The
Ct-values from the different DNA fragment lengths were combined according to the
urine number, and the corresponding delta Ct-values were calculated. The mean delta
Ct-values (difference between eluate control and inhibition control) for the six different
urine samples are shown in Figure 4.7. Clearly, urine sample 9 carried less inhibitors
compared to urine sample 7, as indicated by the lowest and highest delta Ct values,
respectively. In contrast to in-house method, the Qiagen method showed almost no in-
hibition. The data show that the urine samples were heterogeneous, carrying different
amounts of inhibitory components. The ability of the isolation method to remove inhibi-
tors was therefore affected by the urine samples.
-2.50
-2.00
-1.50
-1.00
-0.50
0.00
0.50
1.00
1.50
2.00
2.50
38bp 50bp 75bp 150bp 200bp H37rv
Delta (
∆)
ct-
valu
e (
mean)
DNA Fragnemts (bp)/ H37Rv gDNA
in-house
Qiagen
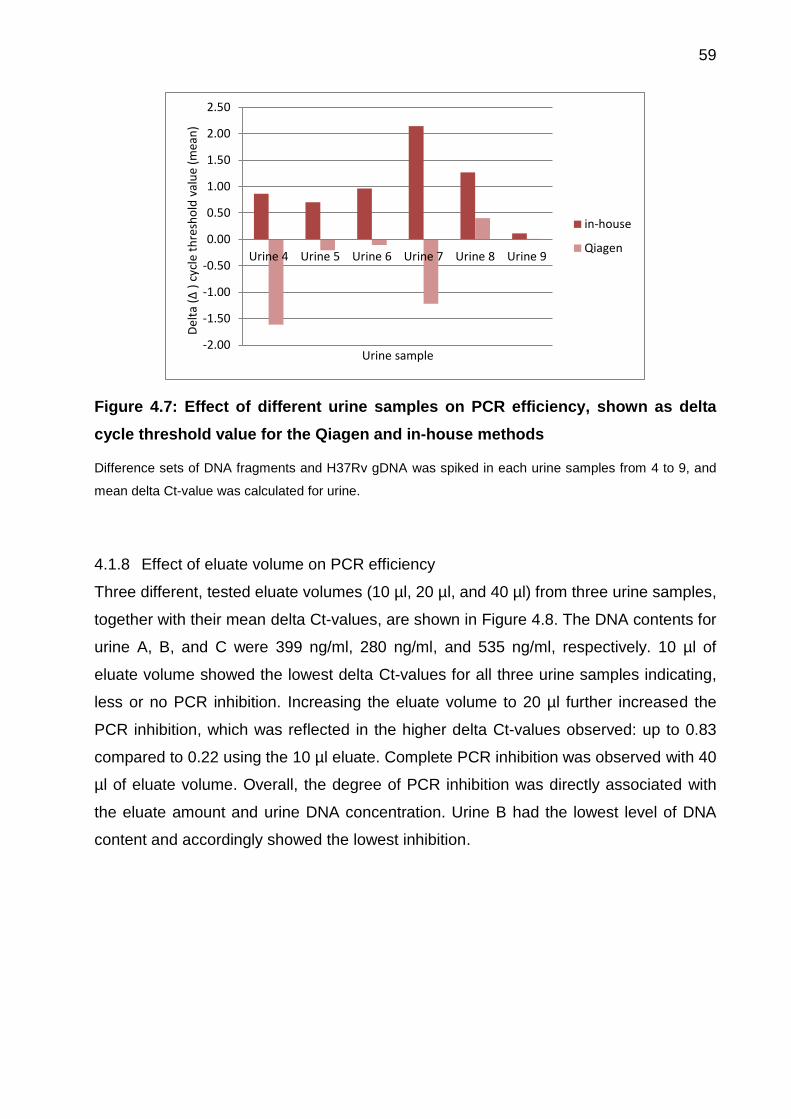
59
Figure 4.7: Effect of different urine samples on PCR efficiency, shown as delta
cycle threshold value for the Qiagen and in-house methods
Difference sets of DNA fragments and H37Rv gDNA was spiked in each urine samples from 4 to 9, and
mean delta Ct-value was calculated for urine.
4.1.8 Effect of eluate volume on PCR efficiency
Three different, tested eluate volumes (10 µl, 20 µl, and 40 µl) from three urine samples,
together with their mean delta Ct-values, are shown in Figure 4.8. The DNA contents for
urine A, B, and C were 399 ng/ml, 280 ng/ml, and 535 ng/ml, respectively. 10 µl of
eluate volume showed the lowest delta Ct-values for all three urine samples indicating,
less or no PCR inhibition. Increasing the eluate volume to 20 µl further increased the
PCR inhibition, which was reflected in the higher delta Ct-values observed: up to 0.83
compared to 0.22 using the 10 µl eluate. Complete PCR inhibition was observed with 40
µl of eluate volume. Overall, the degree of PCR inhibition was directly associated with
the eluate amount and urine DNA concentration. Urine B had the lowest level of DNA
content and accordingly showed the lowest inhibition.
-2.00
-1.50
-1.00
-0.50
0.00
0.50
1.00
1.50
2.00
2.50
Urine 4 Urine 5 Urine 6 Urine 7 Urine 8 Urine 9
Del
ta (
∆ )
cyc
le t
hre
sho
ld v
alu
e (m
ean
)
Urine sample
in-house
Qiagen
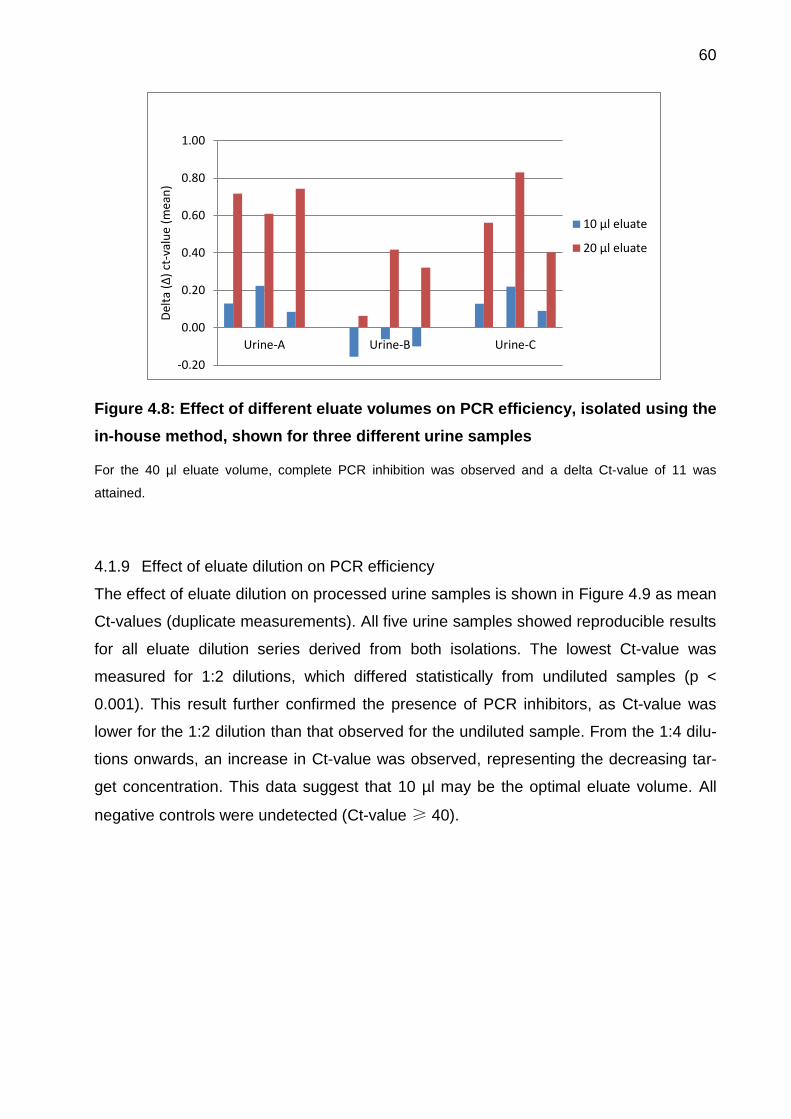
60
Figure 4.8: Effect of different eluate volumes on PCR efficiency, isolated using the
in-house method, shown for three different urine samples
For the 40 µl eluate volume, complete PCR inhibition was observed and a delta Ct-value of 11 was
attained.
4.1.9 Effect of eluate dilution on PCR efficiency
The effect of eluate dilution on processed urine samples is shown in Figure 4.9 as mean
Ct-values (duplicate measurements). All five urine samples showed reproducible results
for all eluate dilution series derived from both isolations. The lowest Ct-value was
measured for 1:2 dilutions, which differed statistically from undiluted samples (p <
0.001). This result further confirmed the presence of PCR inhibitors, as Ct-value was
lower for the 1:2 dilution than that observed for the undiluted sample. From the 1:4 dilu-
tions onwards, an increase in Ct-value was observed, representing the decreasing tar-
get concentration. This data suggest that 10 µl may be the optimal eluate volume. All
negative controls were undetected (Ct-value ≥ 40).
-0.20
0.00
0.20
0.40
0.60
0.80
1.00
Urine-A Urine-B Urine-C
Del
ta (
∆)
ct-v
alu
e (m
ean
)
10 µl eluate
20 µl eluate
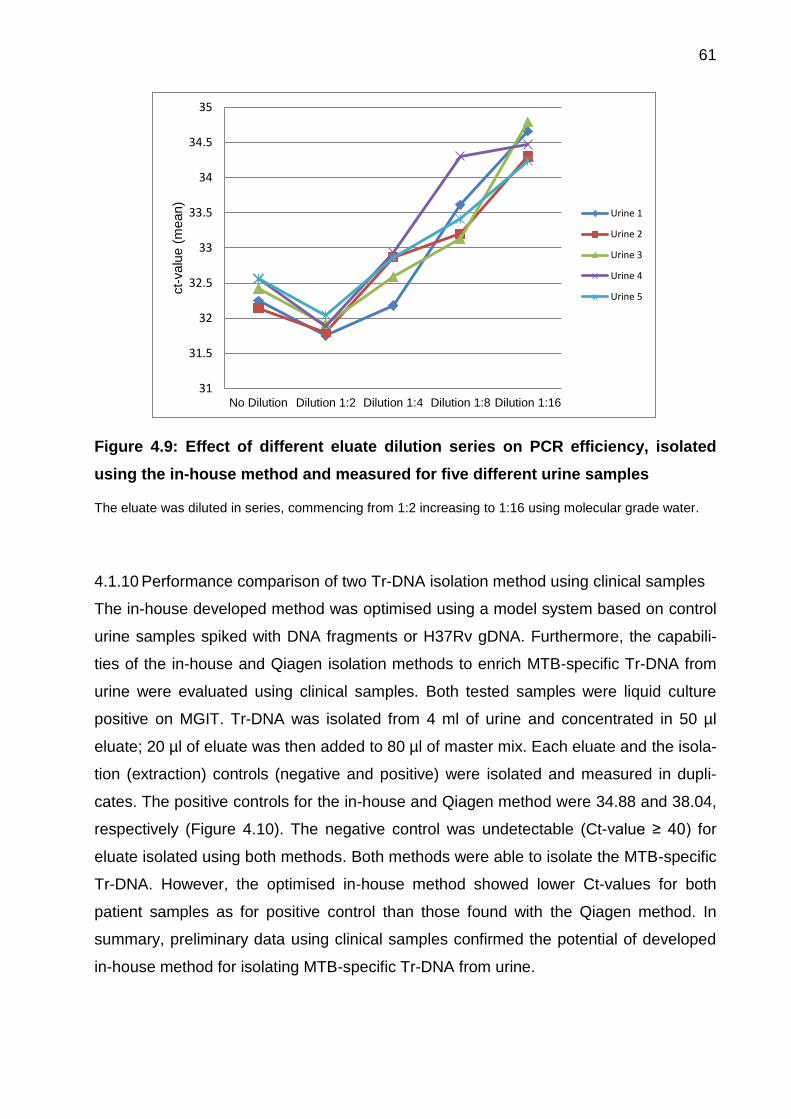
61
Figure 4.9: Effect of different eluate dilution series on PCR efficiency, isolated
using the in-house method and measured for five different urine samples
The eluate was diluted in series, commencing from 1:2 increasing to 1:16 using molecular grade water.
4.1.10 Performance comparison of two Tr-DNA isolation method using clinical samples
The in-house developed method was optimised using a model system based on control
urine samples spiked with DNA fragments or H37Rv gDNA. Furthermore, the capabili-
ties of the in-house and Qiagen isolation methods to enrich MTB-specific Tr-DNA from
urine were evaluated using clinical samples. Both tested samples were liquid culture
positive on MGIT. Tr-DNA was isolated from 4 ml of urine and concentrated in 50 µl
eluate; 20 µl of eluate was then added to 80 µl of master mix. Each eluate and the isola-
tion (extraction) controls (negative and positive) were isolated and measured in dupli-
cates. The positive controls for the in-house and Qiagen method were 34.88 and 38.04,
respectively (Figure 4.10). The negative control was undetectable (Ct-value ≥ 40) for
eluate isolated using both methods. Both methods were able to isolate the MTB-specific
Tr-DNA. However, the optimised in-house method showed lower Ct-values for both
patient samples as for positive control than those found with the Qiagen method. In
summary, preliminary data using clinical samples confirmed the potential of developed
in-house method for isolating MTB-specific Tr-DNA from urine.
31
31.5
32
32.5
33
33.5
34
34.5
35
No Dilution Dilution 1:2 Dilution 1:4 Dilution 1:8 Dilution 1:16
ct-
valu
e (
mean)
Urine 1
Urine 2
Urine 3
Urine 4
Urine 5
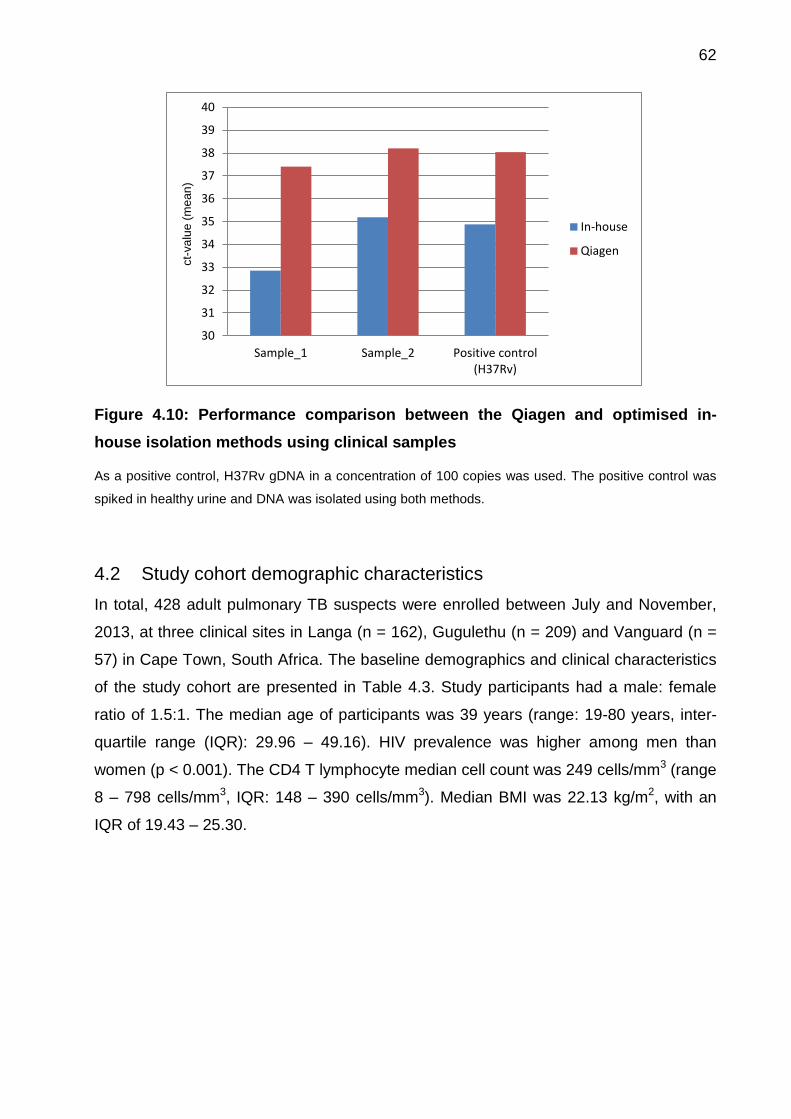
62
Figure 4.10: Performance comparison between the Qiagen and optimised in-
house isolation methods using clinical samples
As a positive control, H37Rv gDNA in a concentration of 100 copies was used. The positive control was
spiked in healthy urine and DNA was isolated using both methods.
4.2 Study cohort demographic characteristics
In total, 428 adult pulmonary TB suspects were enrolled between July and November,
2013, at three clinical sites in Langa (n = 162), Gugulethu (n = 209) and Vanguard (n =
57) in Cape Town, South Africa. The baseline demographics and clinical characteristics
of the study cohort are presented in Table 4.3. Study participants had a male: female
ratio of 1.5:1. The median age of participants was 39 years (range: 19-80 years, inter-
quartile range (IQR): 29.96 – 49.16). HIV prevalence was higher among men than
women (p < 0.001). The CD4 T lymphocyte median cell count was 249 cells/mm3 (range
8 – 798 cells/mm3, IQR: 148 – 390 cells/mm3). Median BMI was 22.13 kg/m2, with an
IQR of 19.43 – 25.30.
30
31
32
33
34
35
36
37
38
39
40
Sample_1 Sample_2 Positive control(H37Rv)
ct-
va
lue
(m
ea
n)
In-house
Qiagen
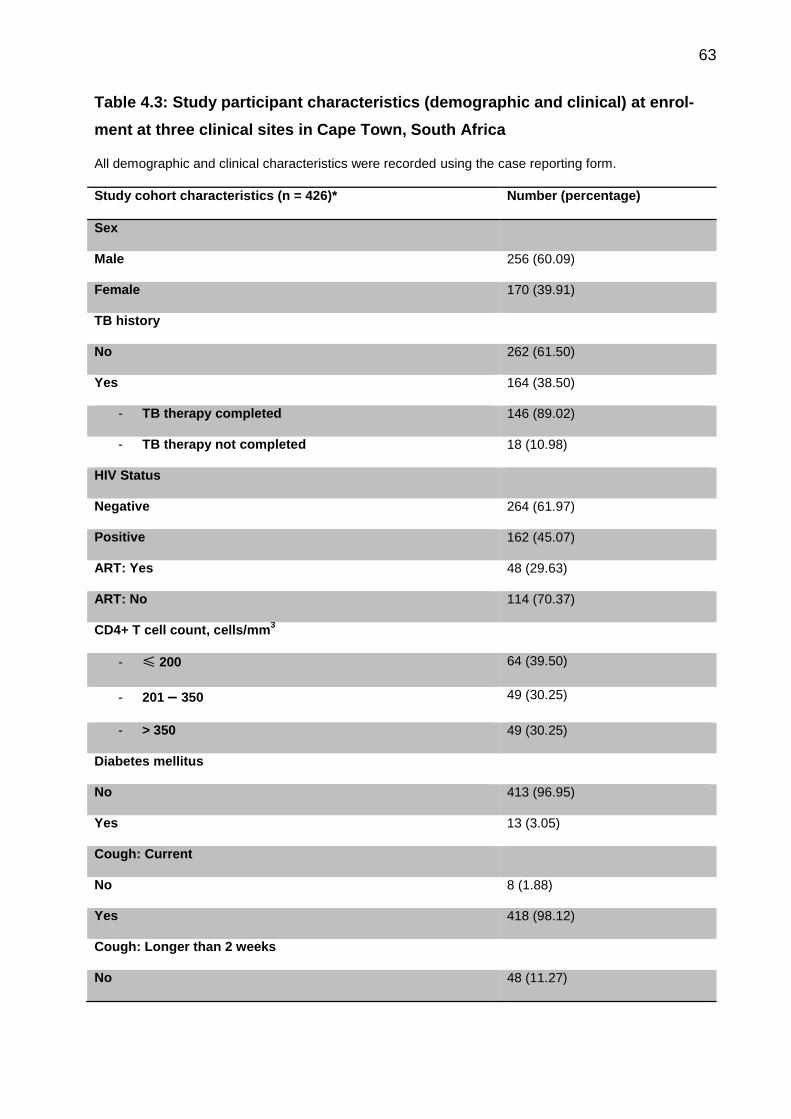
63
Table 4.3: Study participant characteristics (demographic and clinical) at enrol-
ment at three clinical sites in Cape Town, South Africa
All demographic and clinical characteristics were recorded using the case reporting form.
Study cohort characteristics (n = 426)* Number (percentage)
Sex
Male 256 (60.09)
Female 170 (39.91)
TB history
No 262 (61.50)
Yes 164 (38.50)
- TB therapy completed 146 (89.02)
- TB therapy not completed 18 (10.98)
HIV Status
Negative 264 (61.97)
Positive 162 (45.07)
ART: Yes 48 (29.63)
ART: No 114 (70.37)
CD4+ T cell count, cells/mm3
- ≤ 200 64 (39.50)
- 201 – 350 49 (30.25)
- > 350 49 (30.25)
Diabetes mellitus
No 413 (96.95)
Yes 13 (3.05)
Cough: Current
No 8 (1.88)
Yes 418 (98.12)
Cough: Longer than 2 weeks
No 48 (11.27)
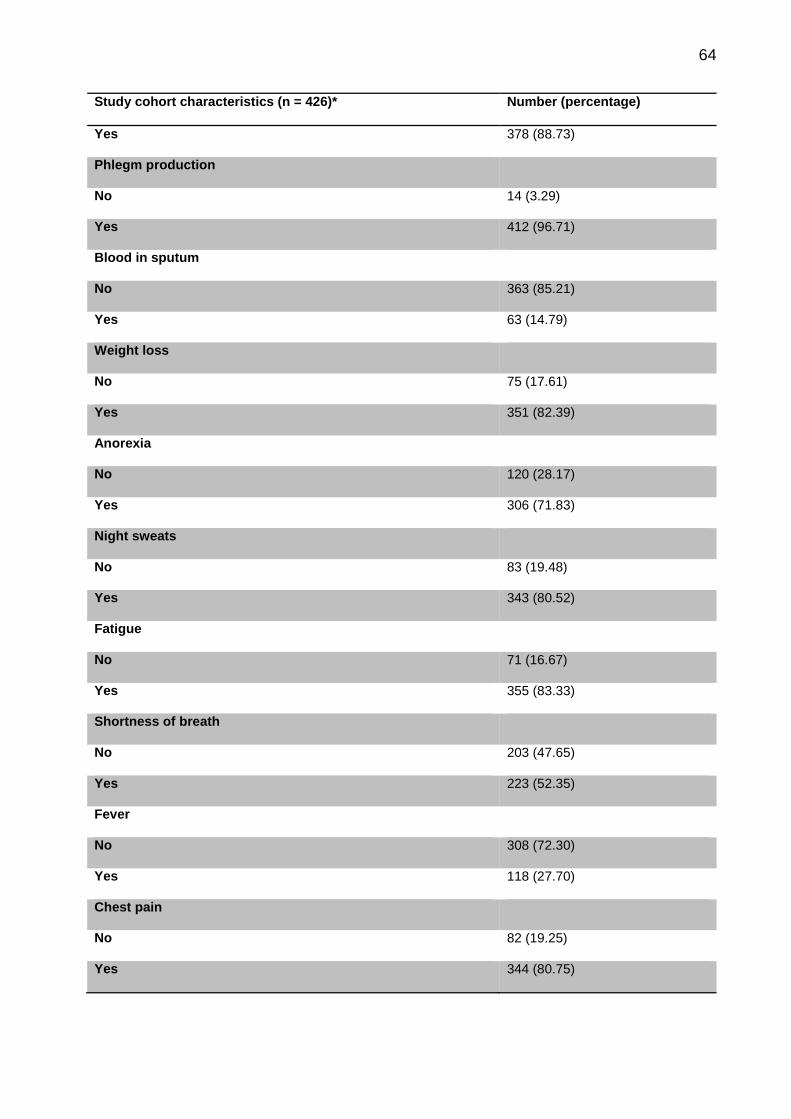
64
Study cohort characteristics (n = 426)* Number (percentage)
Yes 378 (88.73)
Phlegm production
No 14 (3.29)
Yes 412 (96.71)
Blood in sputum
No 363 (85.21)
Yes 63 (14.79)
Weight loss
No 75 (17.61)
Yes 351 (82.39)
Anorexia
No 120 (28.17)
Yes 306 (71.83)
Night sweats
No 83 (19.48)
Yes 343 (80.52)
Fatigue
No 71 (16.67)
Yes 355 (83.33)
Shortness of breath
No 203 (47.65)
Yes 223 (52.35)
Fever
No 308 (72.30)
Yes 118 (27.70)
Chest pain
No 82 (19.25)
Yes 344 (80.75)
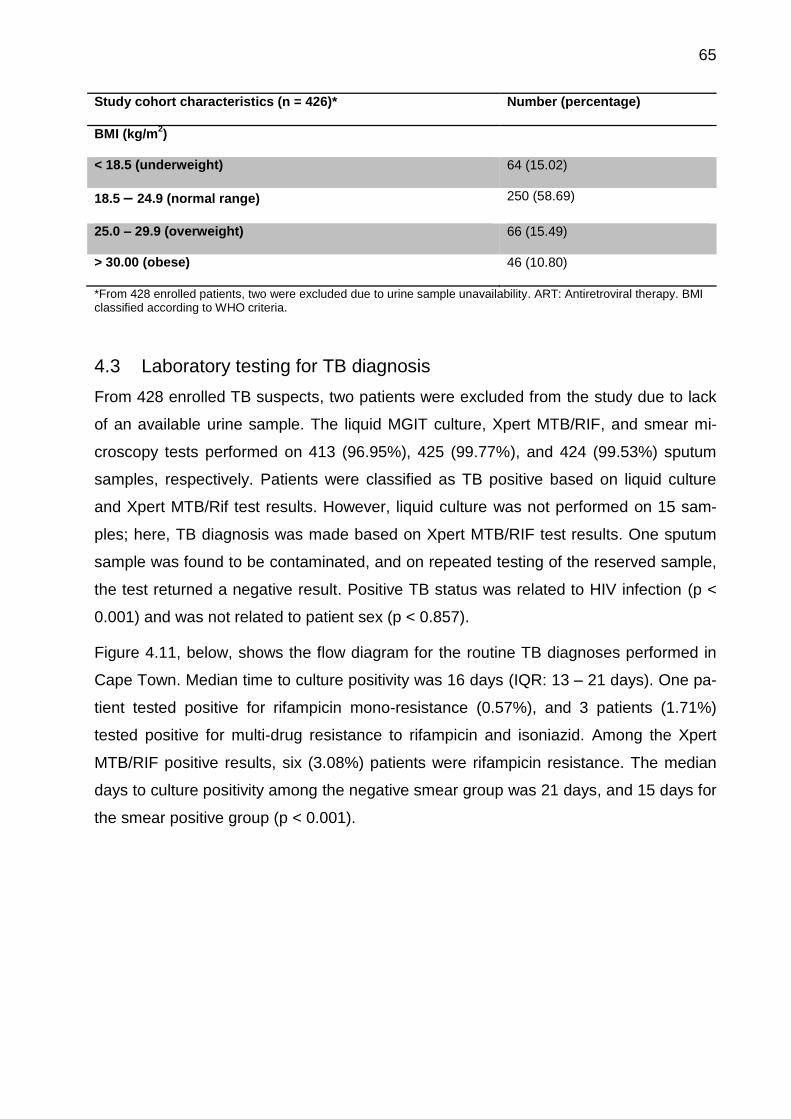
65
Study cohort characteristics (n = 426)* Number (percentage)
BMI (kg/m2)
< 18.5 (underweight) 64 (15.02)
18.5 – 24.9 (normal range) 250 (58.69)
25.0 – 29.9 (overweight) 66 (15.49)
> 30.00 (obese) 46 (10.80)
*From 428 enrolled patients, two were excluded due to urine sample unavailability. ART: Antiretroviral therapy. BMI classified according to WHO criteria.
4.3 Laboratory testing for TB diagnosis
From 428 enrolled TB suspects, two patients were excluded from the study due to lack
of an available urine sample. The liquid MGIT culture, Xpert MTB/RIF, and smear mi-
croscopy tests performed on 413 (96.95%), 425 (99.77%), and 424 (99.53%) sputum
samples, respectively. Patients were classified as TB positive based on liquid culture
and Xpert MTB/Rif test results. However, liquid culture was not performed on 15 sam-
ples; here, TB diagnosis was made based on Xpert MTB/RIF test results. One sputum
sample was found to be contaminated, and on repeated testing of the reserved sample,
the test returned a negative result. Positive TB status was related to HIV infection (p <
0.001) and was not related to patient sex (p < 0.857).
Figure 4.11, below, shows the flow diagram for the routine TB diagnoses performed in
Cape Town. Median time to culture positivity was 16 days (IQR: 13 – 21 days). One pa-
tient tested positive for rifampicin mono-resistance (0.57%), and 3 patients (1.71%)
tested positive for multi-drug resistance to rifampicin and isoniazid. Among the Xpert
MTB/RIF positive results, six (3.08%) patients were rifampicin resistance. The median
days to culture positivity among the negative smear group was 21 days, and 15 days for
the smear positive group (p < 0.001).
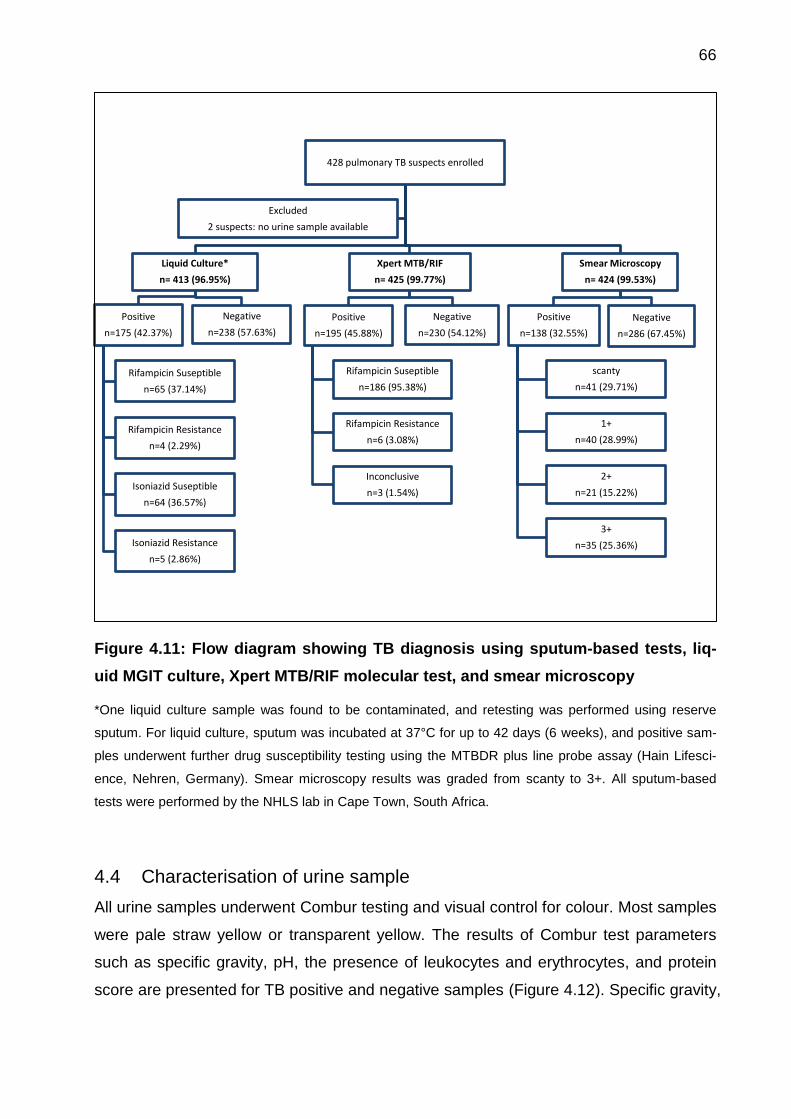
66
Figure 4.11: Flow diagram showing TB diagnosis using sputum-based tests, liq-
uid MGIT culture, Xpert MTB/RIF molecular test, and smear microscopy
*One liquid culture sample was found to be contaminated, and retesting was performed using reserve
sputum. For liquid culture, sputum was incubated at 37°C for up to 42 days (6 weeks), and positive sam-
ples underwent further drug susceptibility testing using the MTBDR plus line probe assay (Hain Lifesci-
ence, Nehren, Germany). Smear microscopy results was graded from scanty to 3+. All sputum-based
tests were performed by the NHLS lab in Cape Town, South Africa.
4.4 Characterisation of urine sample
All urine samples underwent Combur testing and visual control for colour. Most samples
were pale straw yellow or transparent yellow. The results of Combur test parameters
such as specific gravity, pH, the presence of leukocytes and erythrocytes, and protein
score are presented for TB positive and negative samples (Figure 4.12). Specific gravity,
428 pulmonary TB suspects enrolled
Liquid Culture*
n= 413 (96.95%)
Positive
n=175 (42.37%)
Rifampicin Suseptible
n=65 (37.14%)
Rifampicin Resistance
n=4 (2.29%)
Isoniazid Suseptible
n=64 (36.57%)
Isoniazid Resistance
n=5 (2.86%)
Negative
n=238 (57.63%)
Xpert MTB/RIF
n= 425 (99.77%)
Positive
n=195 (45.88%)
Rifampicin Suseptible
n=186 (95.38%)
Rifampicin Resistance
n=6 (3.08%)
Inconclusive
n=3 (1.54%)
Negative
n=230 (54.12%)
Smear Microscopy
n= 424 (99.53%)
Positive
n=138 (32.55%)
scanty
n=41 (29.71%)
1+
n=40 (28.99%)
2+
n=21 (15.22%)
3+
n=35 (25.36%)
Negative
n=286 (67.45%)
Excluded
2 suspects: no urine sample available
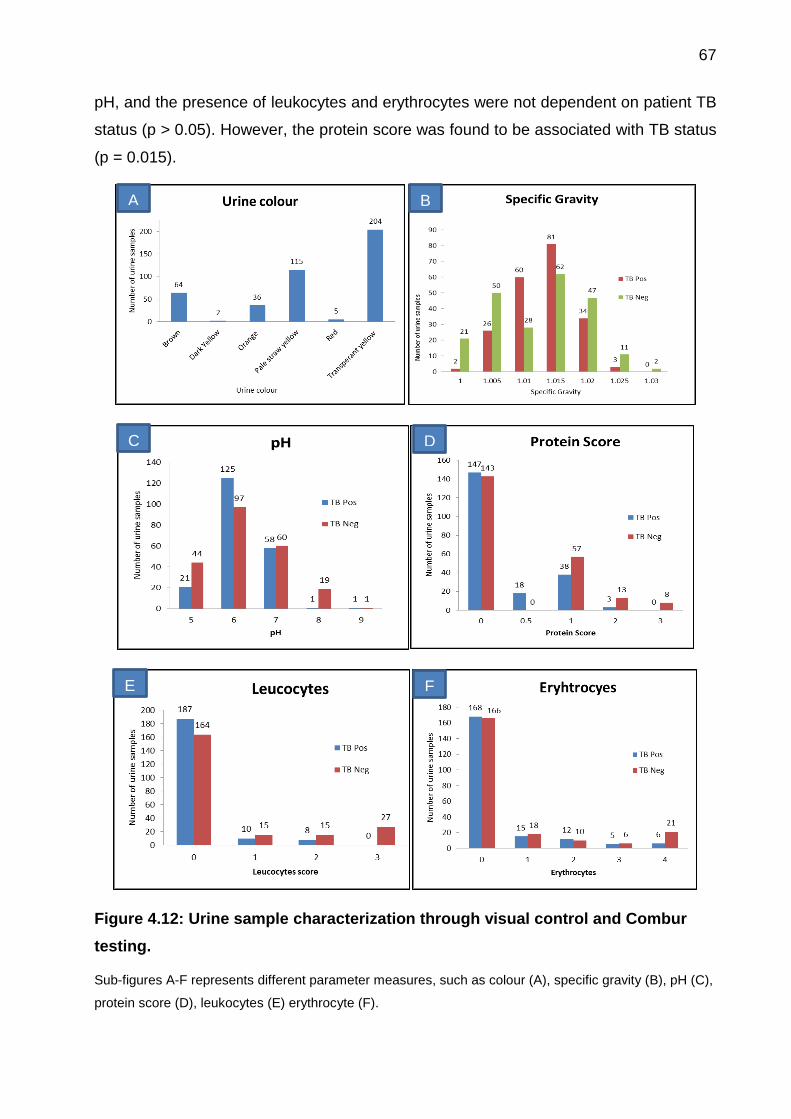
67
pH, and the presence of leukocytes and erythrocytes were not dependent on patient TB
status (p > 0.05). However, the protein score was found to be associated with TB status
(p = 0.015).
Figure 4.12: Urine sample characterization through visual control and Combur
testing.
Sub-figures A-F represents different parameter measures, such as colour (A), specific gravity (B), pH (C),
protein score (D), leukocytes (E) erythrocyte (F).
B
1115 6 1116 20200
0
N
EE
A
1115 6 1116 20200
0
N
EE
C
1115 6 1116 20200
0
N
EE
D
1115 6 1116 20200
0
N
EE
E
1115 6 1116 20200
0
N
EE
F
1115 6 1116 20200
0
N
EE
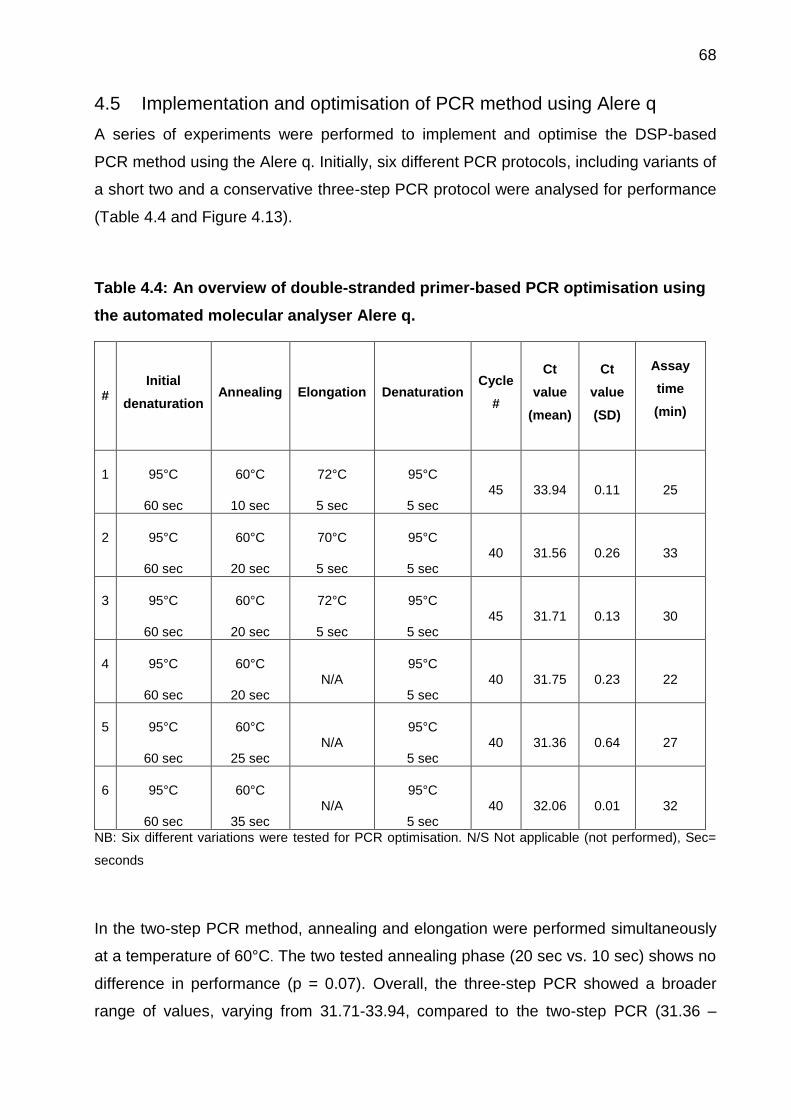
68
4.5 Implementation and optimisation of PCR method using Alere q
A series of experiments were performed to implement and optimise the DSP-based
PCR method using the Alere q. Initially, six different PCR protocols, including variants of
a short two and a conservative three-step PCR protocol were analysed for performance
(Table 4.4 and Figure 4.13).
Table 4.4: An overview of double-stranded primer-based PCR optimisation using
the automated molecular analyser Alere q.
# Initial
denaturation Annealing Elongation Denaturation
Cycle
#
Ct
value
(mean)
Ct
value
(SD)
Assay
time
(min)
1 95°C
60 sec
60°C
10 sec
72°C
5 sec
95°C
5 sec
45 33.94 0.11 25
2 95°C
60 sec
60°C
20 sec
70°C
5 sec
95°C
5 sec
40 31.56 0.26 33
3 95°C
60 sec
60°C
20 sec
72°C
5 sec
95°C
5 sec
45 31.71 0.13 30
4 95°C
60 sec
60°C
20 sec
N/A
95°C
5 sec
40 31.75 0.23 22
5 95°C
60 sec
60°C
25 sec
N/A
95°C
5 sec
40 31.36 0.64 27
6 95°C
60 sec
60°C
35 sec
N/A
95°C
5 sec
40 32.06 0.01 32
NB: Six different variations were tested for PCR optimisation. N/S Not applicable (not performed), Sec=
seconds
In the two-step PCR method, annealing and elongation were performed simultaneously
at a temperature of 60°C. The two tested annealing phase (20 sec vs. 10 sec) shows no
difference in performance (p = 0.07). Overall, the three-step PCR showed a broader
range of values, varying from 31.71-33.94, compared to the two-step PCR (31.36 –
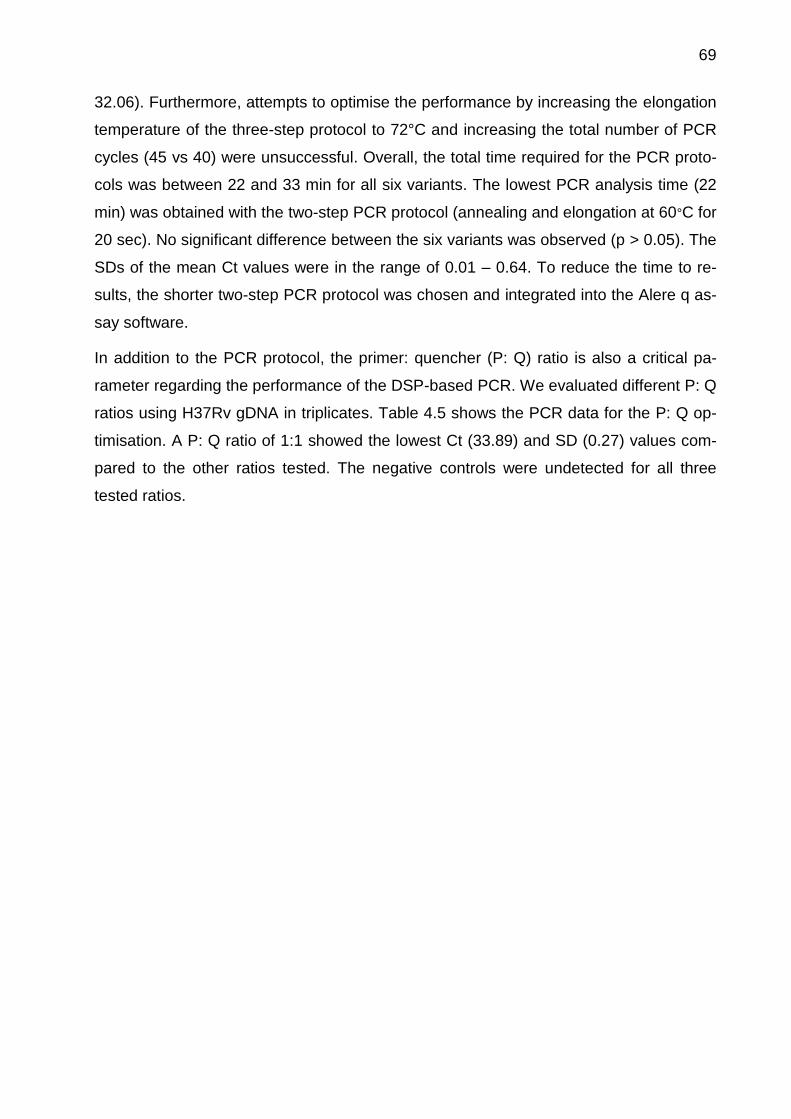
69
32.06). Furthermore, attempts to optimise the performance by increasing the elongation
temperature of the three-step protocol to 72°C and increasing the total number of PCR
cycles (45 vs 40) were unsuccessful. Overall, the total time required for the PCR proto-
cols was between 22 and 33 min for all six variants. The lowest PCR analysis time (22
min) was obtained with the two-step PCR protocol (annealing and elongation at 60°C for
20 sec). No significant difference between the six variants was observed (p > 0.05). The
SDs of the mean Ct values were in the range of 0.01 – 0.64. To reduce the time to re-
sults, the shorter two-step PCR protocol was chosen and integrated into the Alere q as-
say software.
In addition to the PCR protocol, the primer: quencher (P: Q) ratio is also a critical pa-
rameter regarding the performance of the DSP-based PCR. We evaluated different P: Q
ratios using H37Rv gDNA in triplicates. Table 4.5 shows the PCR data for the P: Q op-
timisation. A P: Q ratio of 1:1 showed the lowest Ct (33.89) and SD (0.27) values com-
pared to the other ratios tested. The negative controls were undetected for all three
tested ratios.
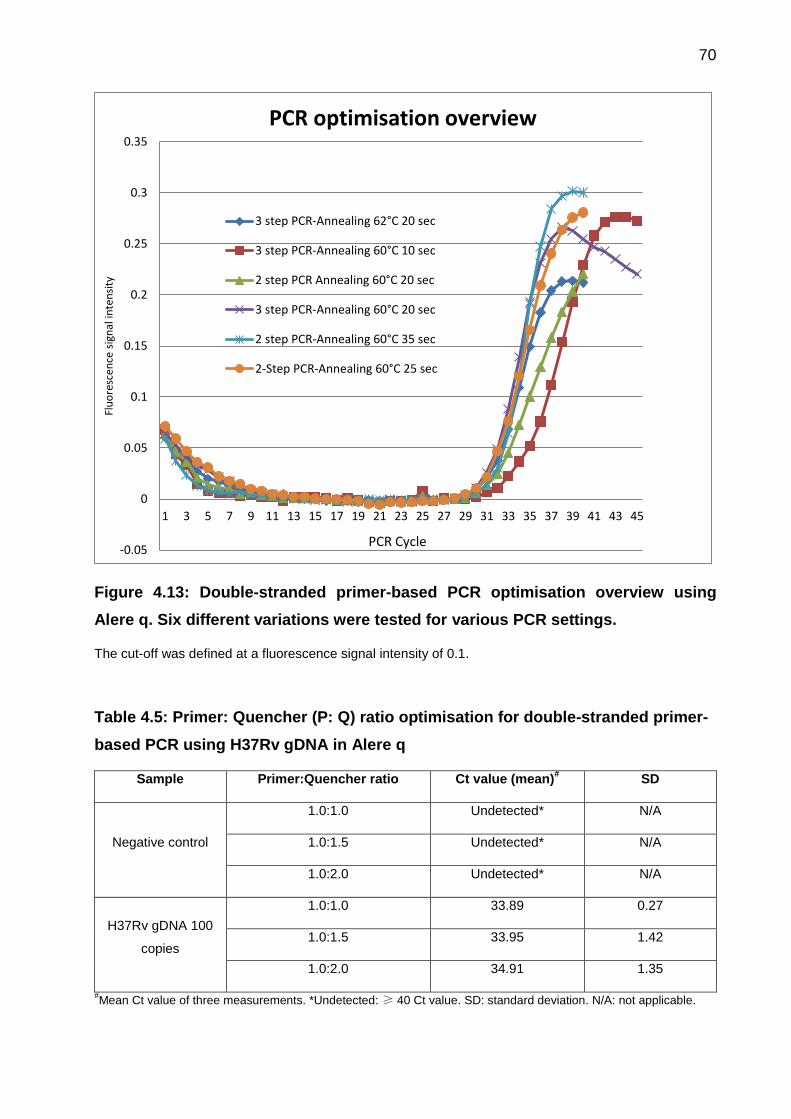
70
Figure 4.13: Double-stranded primer-based PCR optimisation overview using
Alere q. Six different variations were tested for various PCR settings.
The cut-off was defined at a fluorescence signal intensity of 0.1.
Table 4.5: Primer: Quencher (P: Q) ratio optimisation for double-stranded primer-
based PCR using H37Rv gDNA in Alere q
Sample Primer:Quencher ratio Ct value (mean)# SD
Negative control
1.0:1.0 Undetected* N/A
1.0:1.5 Undetected* N/A
1.0:2.0 Undetected* N/A
H37Rv gDNA 100
copies
1.0:1.0 33.89 0.27
1.0:1.5 33.95 1.42
1.0:2.0 34.91 1.35
#Mean Ct value of three measurements. *Undetected: ≥ 40 Ct value. SD: standard deviation. N/A: not applicable.
-0.05
0
0.05
0.1
0.15
0.2
0.25
0.3
0.35
1 3 5 7 9 11 13 15 17 19 21 23 25 27 29 31 33 35 37 39 41 43 45
Flu
ore
scen
ce s
ign
al in
ten
sity
PCR optimisation overview
3 step PCR-Annealing 62°C 20 sec
3 step PCR-Annealing 60°C 10 sec
2 step PCR Annealing 60°C 20 sec
3 step PCR-Annealing 60°C 20 sec
2 step PCR-Annealing 60°C 35 sec
2-Step PCR-Annealing 60°C 25 sec
PCR Cycle
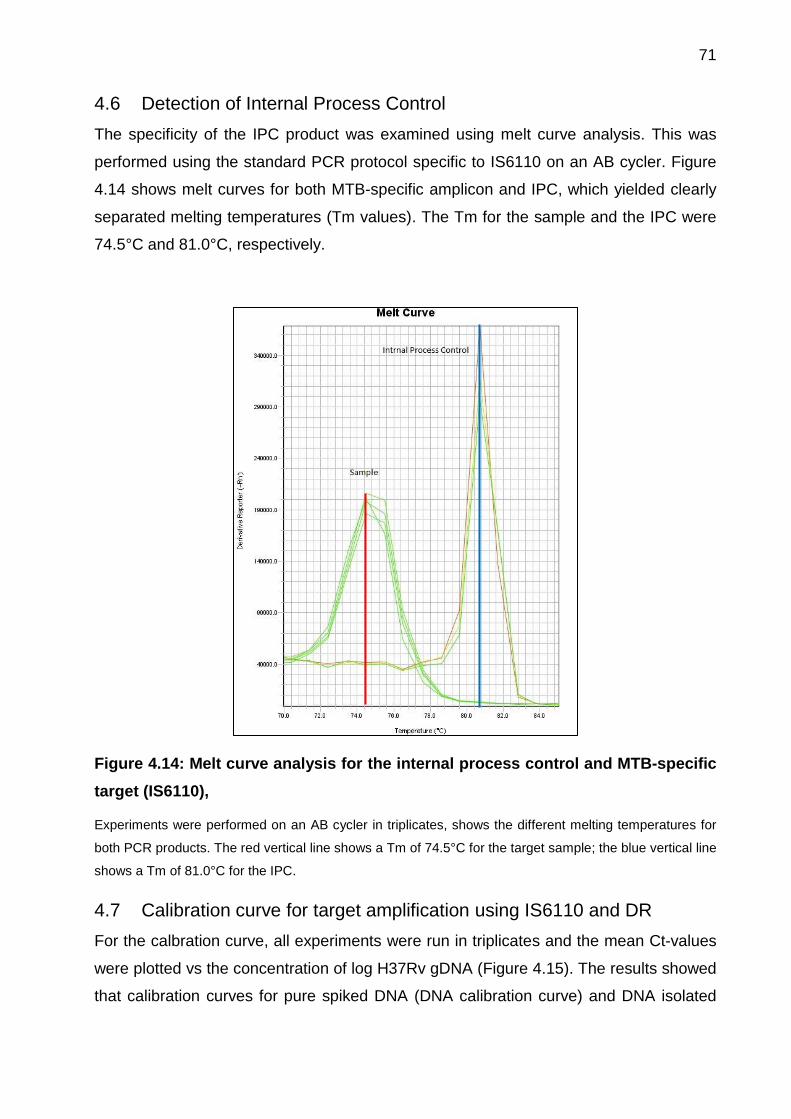
71
4.6 Detection of Internal Process Control
The specificity of the IPC product was examined using melt curve analysis. This was
performed using the standard PCR protocol specific to IS6110 on an AB cycler. Figure
4.14 shows melt curves for both MTB-specific amplicon and IPC, which yielded clearly
separated melting temperatures (Tm values). The Tm for the sample and the IPC were
74.5°C and 81.0°C, respectively.
Figure 4.14: Melt curve analysis for the internal process control and MTB-specific
target (IS6110),
Experiments were performed on an AB cycler in triplicates, shows the different melting temperatures for
both PCR products. The red vertical line shows a Tm of 74.5°C for the target sample; the blue vertical line
shows a Tm of 81.0°C for the IPC.
4.7 Calibration curve for target amplification using IS6110 and DR
For the calbration curve, all experiments were run in triplicates and the mean Ct-values
were plotted vs the concentration of log H37Rv gDNA (Figure 4.15). The results showed
that calibration curves for pure spiked DNA (DNA calibration curve) and DNA isolated
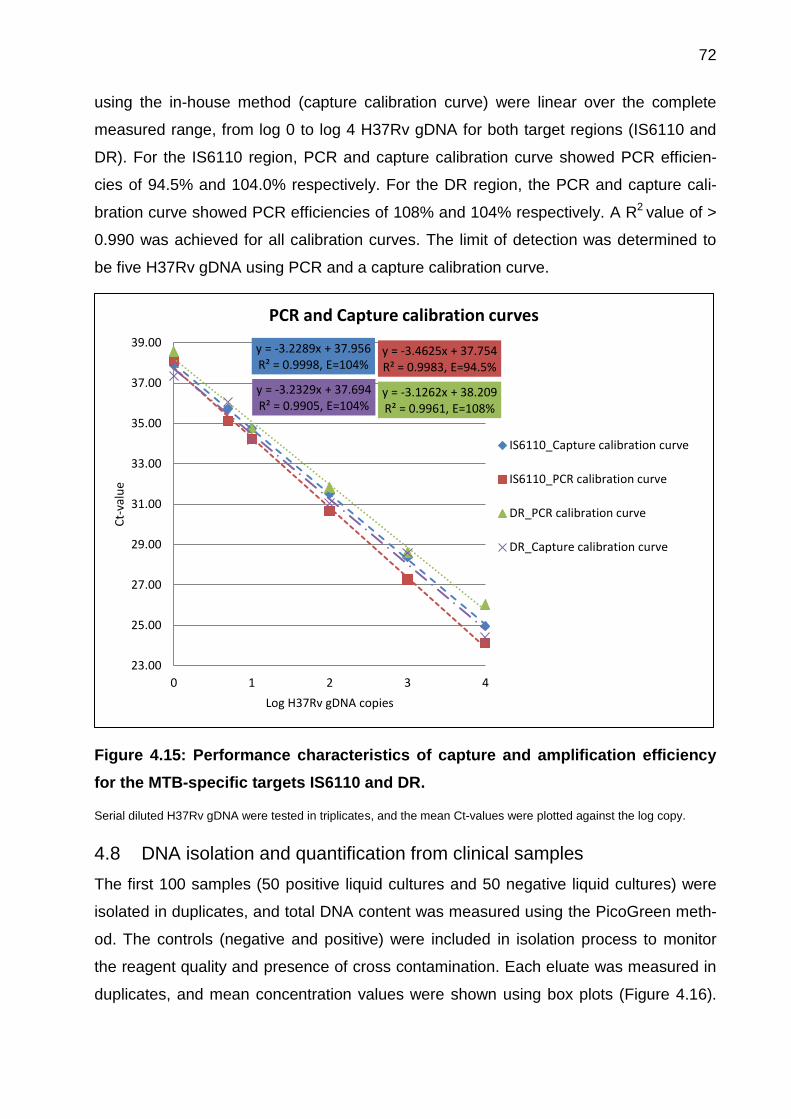
72
using the in-house method (capture calibration curve) were linear over the complete
measured range, from log 0 to log 4 H37Rv gDNA for both target regions (IS6110 and
DR). For the IS6110 region, PCR and capture calibration curve showed PCR efficien-
cies of 94.5% and 104.0% respectively. For the DR region, the PCR and capture cali-
bration curve showed PCR efficiencies of 108% and 104% respectively. A R2 value of >
0.990 was achieved for all calibration curves. The limit of detection was determined to
be five H37Rv gDNA using PCR and a capture calibration curve.
Figure 4.15: Performance characteristics of capture and amplification efficiency
for the MTB-specific targets IS6110 and DR.
Serial diluted H37Rv gDNA were tested in triplicates, and the mean Ct-values were plotted against the log copy.
4.8 DNA isolation and quantification from clinical samples
The first 100 samples (50 positive liquid cultures and 50 negative liquid cultures) were
isolated in duplicates, and total DNA content was measured using the PicoGreen meth-
od. The controls (negative and positive) were included in isolation process to monitor
the reagent quality and presence of cross contamination. Each eluate was measured in
duplicates, and mean concentration values were shown using box plots (Figure 4.16).
y = -3.2289x + 37.956 R² = 0.9998, E=104%
y = -3.4625x + 37.754 R² = 0.9983, E=94.5%
y = -3.1262x + 38.209 R² = 0.9961, E=108%
y = -3.2329x + 37.694 R² = 0.9905, E=104%
23.00
25.00
27.00
29.00
31.00
33.00
35.00
37.00
39.00
0 1 2 3 4
Ct-
valu
e
Log H37Rv gDNA copies
PCR and Capture calibration curves
IS6110_Capture calibration curve
IS6110_PCR calibration curve
DR_PCR calibration curve
DR_Capture calibration curve
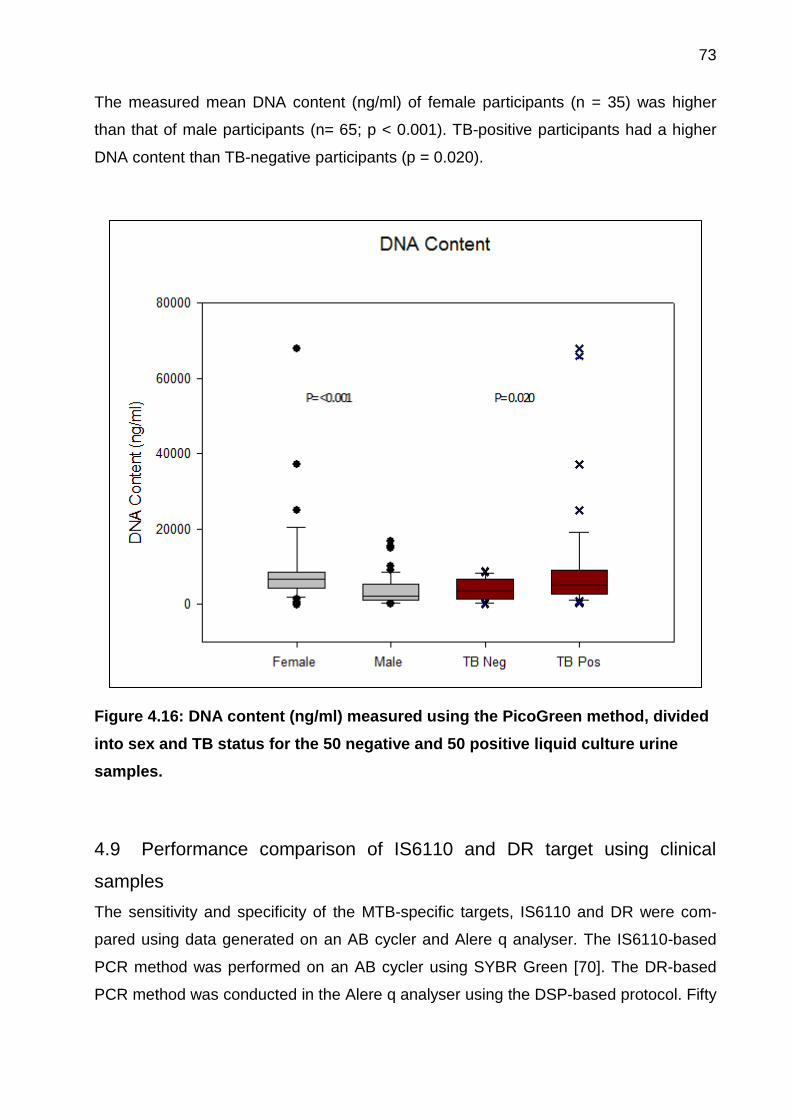
73
The measured mean DNA content (ng/ml) of female participants (n = 35) was higher
than that of male participants (n= 65; p < 0.001). TB-positive participants had a higher
DNA content than TB-negative participants (p = 0.020).
Figure 4.16: DNA content (ng/ml) measured using the PicoGreen method, divided
into sex and TB status for the 50 negative and 50 positive liquid culture urine
samples.
4.9 Performance comparison of IS6110 and DR target using clinical
samples
The sensitivity and specificity of the MTB-specific targets, IS6110 and DR were com-
pared using data generated on an AB cycler and Alere q analyser. The IS6110-based
PCR method was performed on an AB cycler using SYBR Green [70]. The DR-based
PCR method was conducted in the Alere q analyser using the DSP-based protocol. Fifty
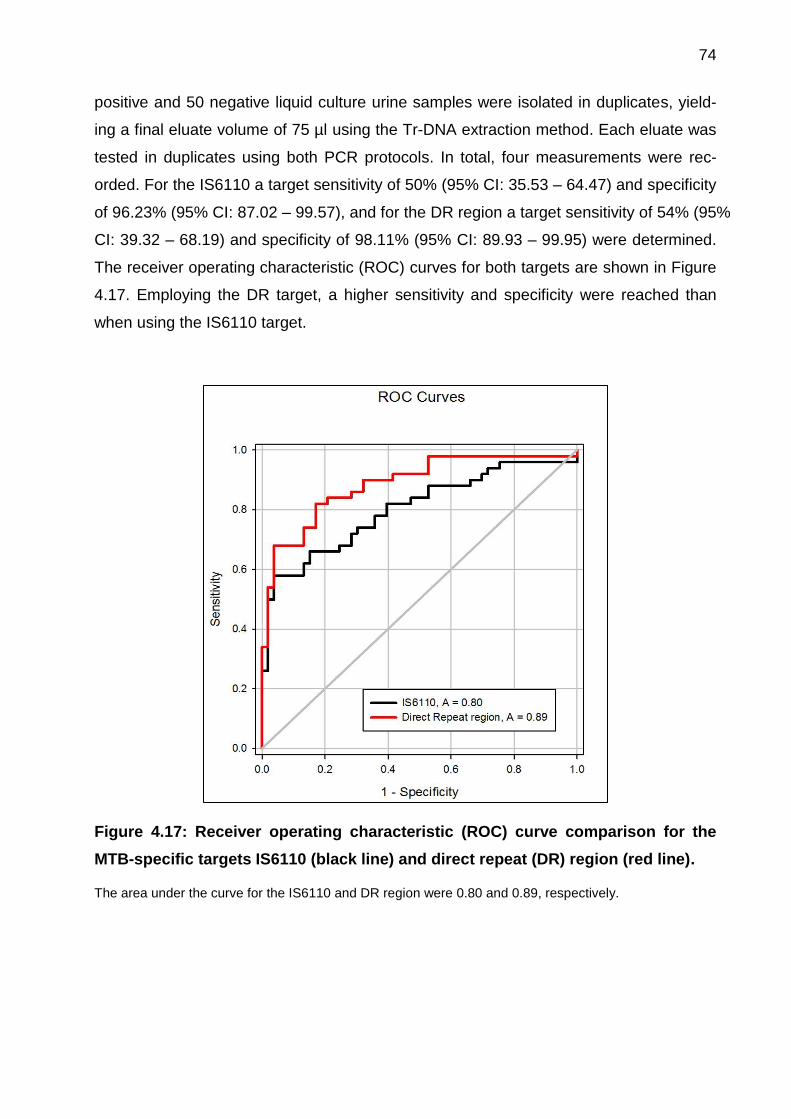
74
positive and 50 negative liquid culture urine samples were isolated in duplicates, yield-
ing a final eluate volume of 75 µl using the Tr-DNA extraction method. Each eluate was
tested in duplicates using both PCR protocols. In total, four measurements were rec-
orded. For the IS6110 a target sensitivity of 50% (95% CI: 35.53 – 64.47) and specificity
of 96.23% (95% CI: 87.02 – 99.57), and for the DR region a target sensitivity of 54% (95%
CI: 39.32 – 68.19) and specificity of 98.11% (95% CI: 89.93 – 99.95) were determined.
The receiver operating characteristic (ROC) curves for both targets are shown in Figure
4.17. Employing the DR target, a higher sensitivity and specificity were reached than
when using the IS6110 target.
Figure 4.17: Receiver operating characteristic (ROC) curve comparison for the
MTB-specific targets IS6110 (black line) and direct repeat (DR) region (red line).
The area under the curve for the IS6110 and DR region were 0.80 and 0.89, respectively.

75
4.10 Evaluation of cross-contamination
Reagent purity was confirmed by gel electrophoresis for the IS6110 and DR regions. In
total, 10 different reagent combinations were tested for contamination and specificity
(Figure 4.18). No unspecific side product bands were detected on the gel.
Figure 4.18: Evaluation of reagent purity for cross contamination using gel elec-
trophoresis.
Furthermore, contamination control was performed, namely a 1.5-ml tube containing
PBS buffer, was left open to monitor for lab contamination. Normal control urine (con-
taining no spiked DNA fragments) was used as a negative control, and spiked urine
containing 3500 H37Rv gDNA was designated the positive control. Table 4.6 shows the
mean Ct-values obtained for the experiments performed. Contamination control was
found to be negative in all experiments.
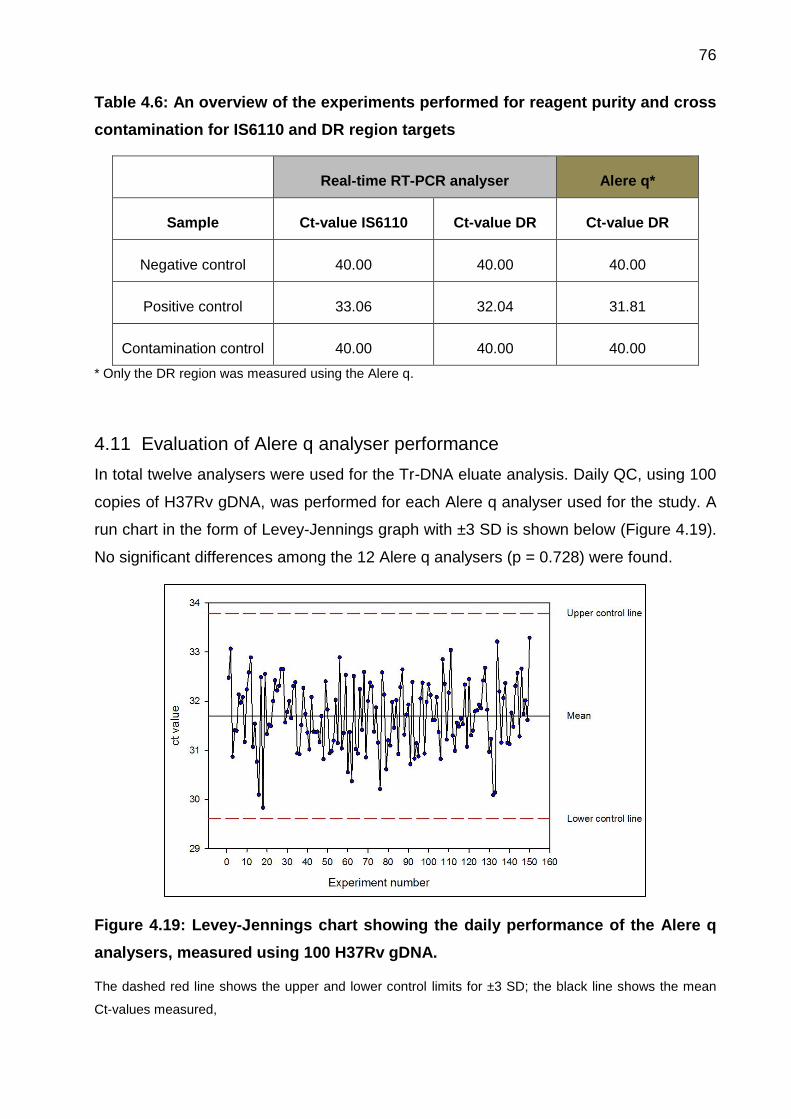
76
Table 4.6: An overview of the experiments performed for reagent purity and cross
contamination for IS6110 and DR region targets
Real-time RT-PCR analyser Alere q*
Sample Ct-value IS6110 Ct-value DR Ct-value DR
Negative control 40.00 40.00 40.00
Positive control 33.06 32.04 31.81
Contamination control 40.00 40.00 40.00
* Only the DR region was measured using the Alere q.
4.11 Evaluation of Alere q analyser performance
In total twelve analysers were used for the Tr-DNA eluate analysis. Daily QC, using 100
copies of H37Rv gDNA, was performed for each Alere q analyser used for the study. A
run chart in the form of Levey-Jennings graph with ±3 SD is shown below (Figure 4.19).
No significant differences among the 12 Alere q analysers (p = 0.728) were found.
Figure 4.19: Levey-Jennings chart showing the daily performance of the Alere q
analysers, measured using 100 H37Rv gDNA.
The dashed red line shows the upper and lower control limits for ±3 SD; the black line shows the mean
Ct-values measured,
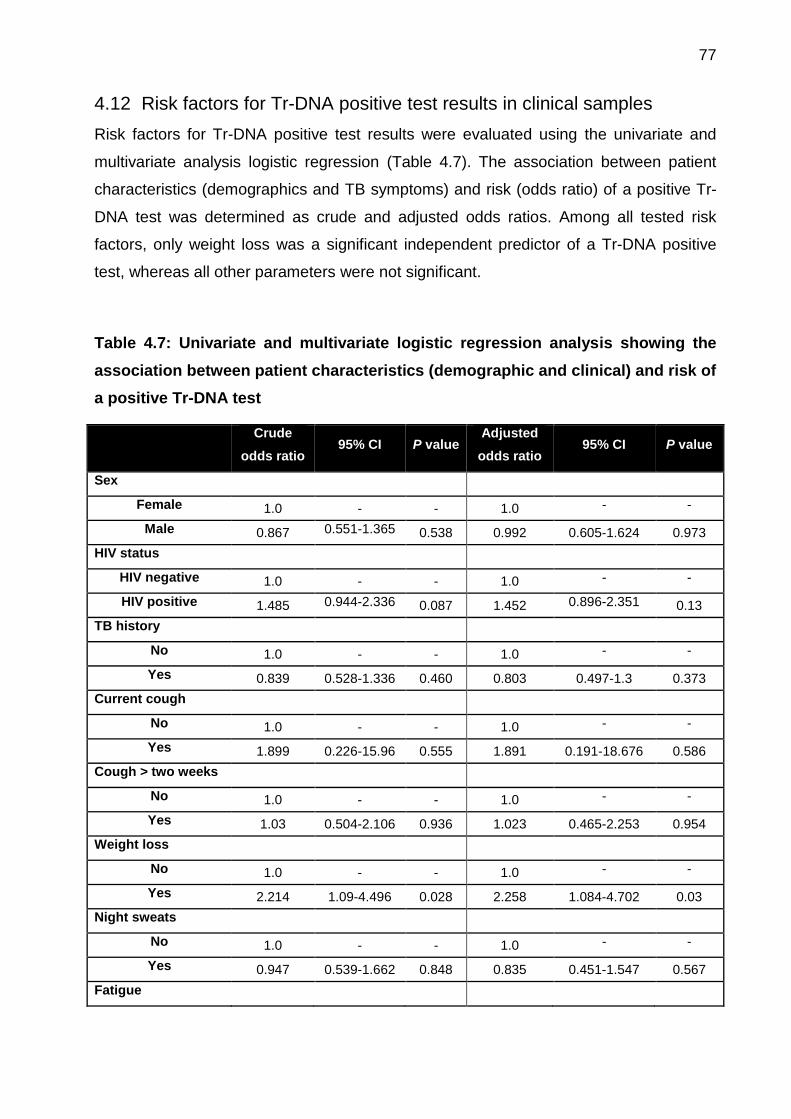
77
4.12 Risk factors for Tr-DNA positive test results in clinical samples
Risk factors for Tr-DNA positive test results were evaluated using the univariate and
multivariate analysis logistic regression (Table 4.7). The association between patient
characteristics (demographics and TB symptoms) and risk (odds ratio) of a positive Tr-
DNA test was determined as crude and adjusted odds ratios. Among all tested risk
factors, only weight loss was a significant independent predictor of a Tr-DNA positive
test, whereas all other parameters were not significant.
Table 4.7: Univariate and multivariate logistic regression analysis showing the
association between patient characteristics (demographic and clinical) and risk of
a positive Tr-DNA test
Crude
odds ratio 95% CI P value
Adjusted
odds ratio 95% CI P value
Sex
Female 1.0 - - 1.0 - -
Male 0.867 0.551-1.365 0.538 0.992 0.605-1.624 0.973
HIV status
HIV negative 1.0 - - 1.0 - -
HIV positive 1.485 0.944-2.336 0.087 1.452 0.896-2.351 0.13
TB history
No 1.0 - - 1.0 - -
Yes 0.839 0.528-1.336 0.460 0.803 0.497-1.3 0.373
Current cough
No 1.0 - - 1.0 - -
Yes 1.899 0.226-15.96 0.555 1.891 0.191-18.676 0.586
Cough > two weeks
No 1.0 - - 1.0 - -
Yes 1.03 0.504-2.106 0.936 1.023 0.465-2.253 0.954
Weight loss
No 1.0 - - 1.0 - -
Yes 2.214 1.09-4.496 0.028 2.258 1.084-4.702 0.03
Night sweats
No 1.0 - - 1.0 - -
Yes 0.947 0.539-1.662 0.848 0.835 0.451-1.547 0.567
Fatigue
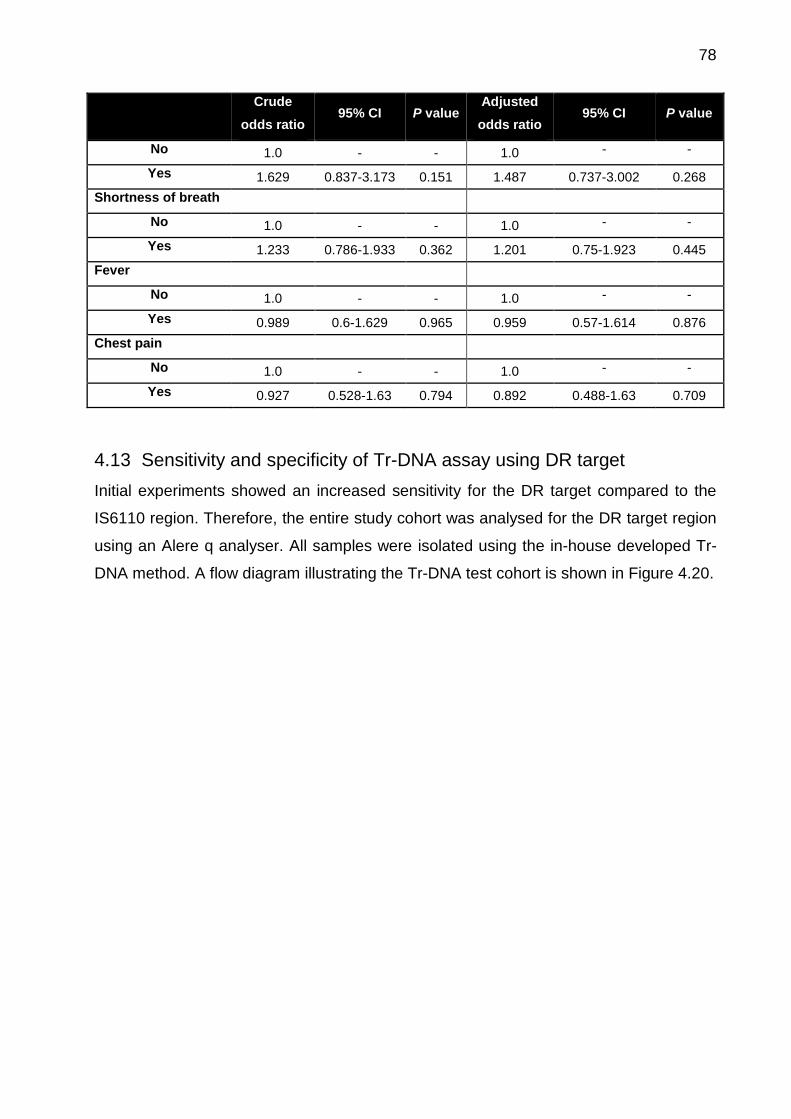
78
Crude
odds ratio 95% CI P value
Adjusted
odds ratio 95% CI P value
No 1.0 - - 1.0 - -
Yes 1.629 0.837-3.173 0.151 1.487 0.737-3.002 0.268
Shortness of breath
No 1.0 - - 1.0 - -
Yes 1.233 0.786-1.933 0.362 1.201 0.75-1.923 0.445
Fever
No 1.0 - - 1.0 - -
Yes 0.989 0.6-1.629 0.965 0.959 0.57-1.614 0.876
Chest pain
No 1.0 - - 1.0 - -
Yes 0.927 0.528-1.63 0.794 0.892 0.488-1.63 0.709
4.13 Sensitivity and specificity of Tr-DNA assay using DR target
Initial experiments showed an increased sensitivity for the DR target compared to the
IS6110 region. Therefore, the entire study cohort was analysed for the DR target region
using an Alere q analyser. All samples were isolated using the in-house developed Tr-
DNA method. A flow diagram illustrating the Tr-DNA test cohort is shown in Figure 4.20.
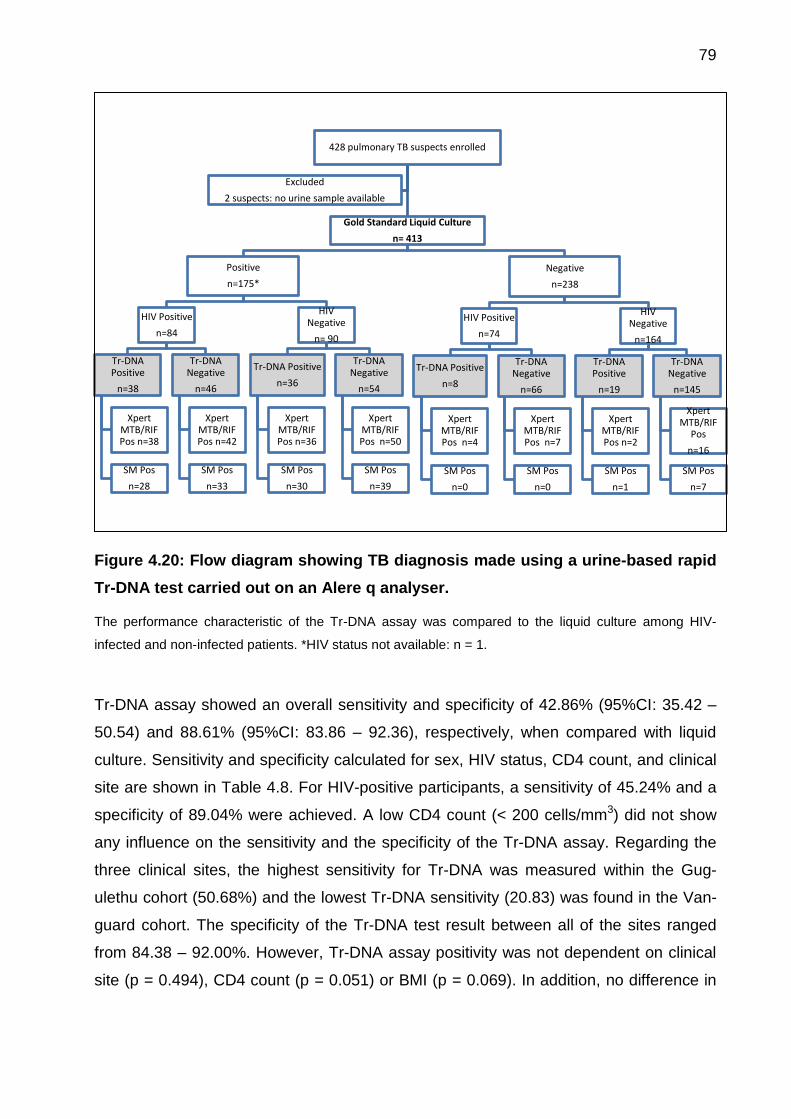
79
Figure 4.20: Flow diagram showing TB diagnosis made using a urine-based rapid
Tr-DNA test carried out on an Alere q analyser.
The performance characteristic of the Tr-DNA assay was compared to the liquid culture among HIV-
infected and non-infected patients. *HIV status not available: n = 1.
Tr-DNA assay showed an overall sensitivity and specificity of 42.86% (95%CI: 35.42 –
50.54) and 88.61% (95%CI: 83.86 – 92.36), respectively, when compared with liquid
culture. Sensitivity and specificity calculated for sex, HIV status, CD4 count, and clinical
site are shown in Table 4.8. For HIV-positive participants, a sensitivity of 45.24% and a
specificity of 89.04% were achieved. A low CD4 count (< 200 cells/mm3) did not show
any influence on the sensitivity and the specificity of the Tr-DNA assay. Regarding the
three clinical sites, the highest sensitivity for Tr-DNA was measured within the Gug-
ulethu cohort (50.68%) and the lowest Tr-DNA sensitivity (20.83) was found in the Van-
guard cohort. The specificity of the Tr-DNA test result between all of the sites ranged
from 84.38 – 92.00%. However, Tr-DNA assay positivity was not dependent on clinical
site (p = 0.494), CD4 count (p = 0.051) or BMI (p = 0.069). In addition, no difference in
428 pulmonary TB suspects enrolled
Gold Standard Liquid Culture
n= 413
Positive
n=175*
HIV Positive
n=84
Tr-DNA Positive
n=38
Xpert MTB/RIF Pos n=38
SM Pos
n=28
Tr-DNA Negative
n=46
Xpert MTB/RIF Pos n=42
SM Pos
n=33
HIV Negative
n= 90
Tr-DNA Positive
n=36
Xpert MTB/RIF Pos n=36
SM Pos
n=30
Tr-DNA Negative
n=54
Xpert MTB/RIF Pos n=50
SM Pos
n=39
Negative
n=238
HIV Positive
n=74
Tr-DNA Positive
n=8
Xpert MTB/RIF Pos n=4
SM Pos
n=0
Tr-DNA Negative
n=66
Xpert MTB/RIF Pos n=7
SM Pos
n=0
HIV Negative
n=164
Tr-DNA Positive
n=19
Xpert MTB/RIF Pos n=2
SM Pos
n=1
Tr-DNA Negative
n=145
Xpert MTB/RIF
Pos
n=16
SM Pos
n=7
Excluded
2 suspects: no urine sample available
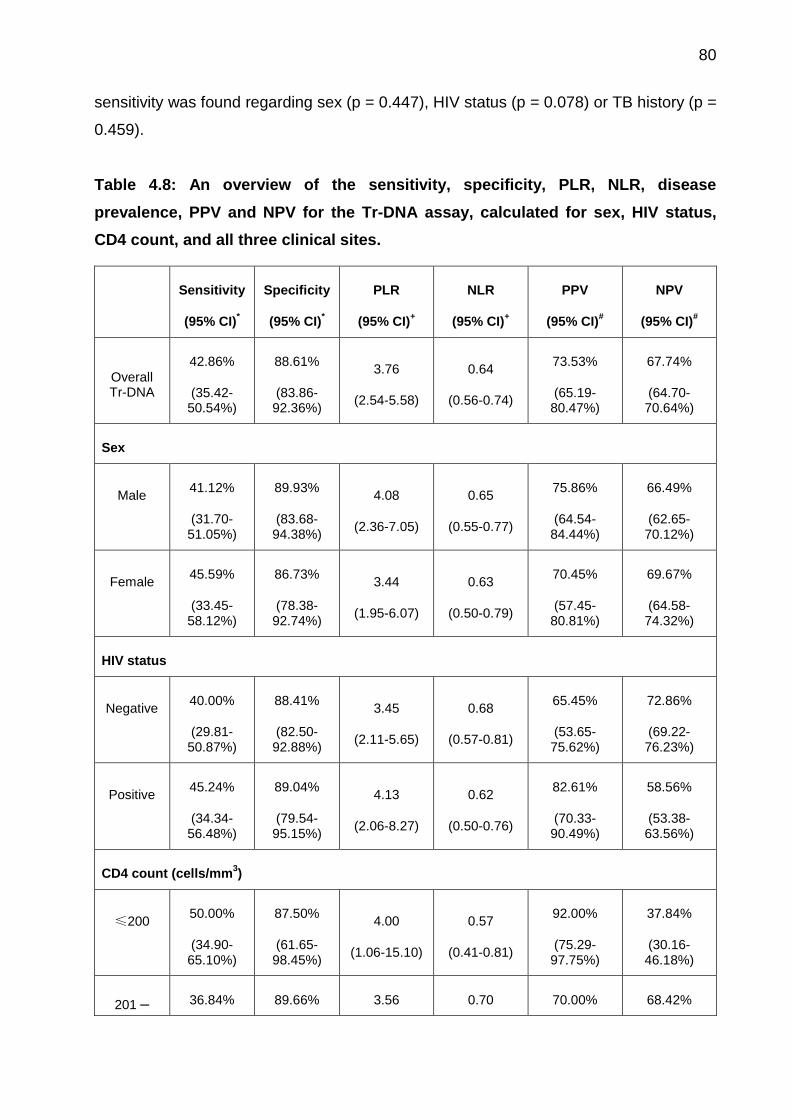
80
sensitivity was found regarding sex (p = 0.447), HIV status (p = 0.078) or TB history (p =
0.459).
Table 4.8: An overview of the sensitivity, specificity, PLR, NLR, disease
prevalence, PPV and NPV for the Tr-DNA assay, calculated for sex, HIV status,
CD4 count, and all three clinical sites.
Sensitivity
(95% CI)*
Specificity
(95% CI)*
PLR
(95% CI)+
NLR
(95% CI)+
PPV
(95% CI)#
NPV
(95% CI)#
Overall Tr-DNA
42.86%
(35.42-50.54%)
88.61%
(83.86-92.36%)
3.76
(2.54-5.58)
0.64
(0.56-0.74)
73.53%
(65.19-80.47%)
67.74%
(64.70-70.64%)
Sex
Male
41.12%
(31.70-51.05%)
89.93%
(83.68-94.38%)
4.08
(2.36-7.05)
0.65
(0.55-0.77)
75.86%
(64.54-84.44%)
66.49%
(62.65-70.12%)
Female
45.59%
(33.45-58.12%)
86.73%
(78.38-92.74%)
3.44
(1.95-6.07)
0.63
(0.50-0.79)
70.45%
(57.45-80.81%)
69.67%
(64.58-74.32%)
HIV status
Negative
40.00%
(29.81-50.87%)
88.41%
(82.50-92.88%)
3.45
(2.11-5.65)
0.68
(0.57-0.81)
65.45%
(53.65-75.62%)
72.86%
(69.22-76.23%)
Positive
45.24%
(34.34-56.48%)
89.04%
(79.54-95.15%)
4.13
(2.06-8.27)
0.62
(0.50-0.76)
82.61%
(70.33-90.49%)
58.56%
(53.38-63.56%)
CD4 count (cells/mm3)
≤200
50.00%
(34.90-65.10%)
87.50%
(61.65-98.45%)
4.00
(1.06-15.10)
0.57
(0.41-0.81)
92.00%
(75.29-97.75%)
37.84%
(30.16-46.18%)
201 – 36.84% 89.66% 3.56 0.70 70.00% 68.42%
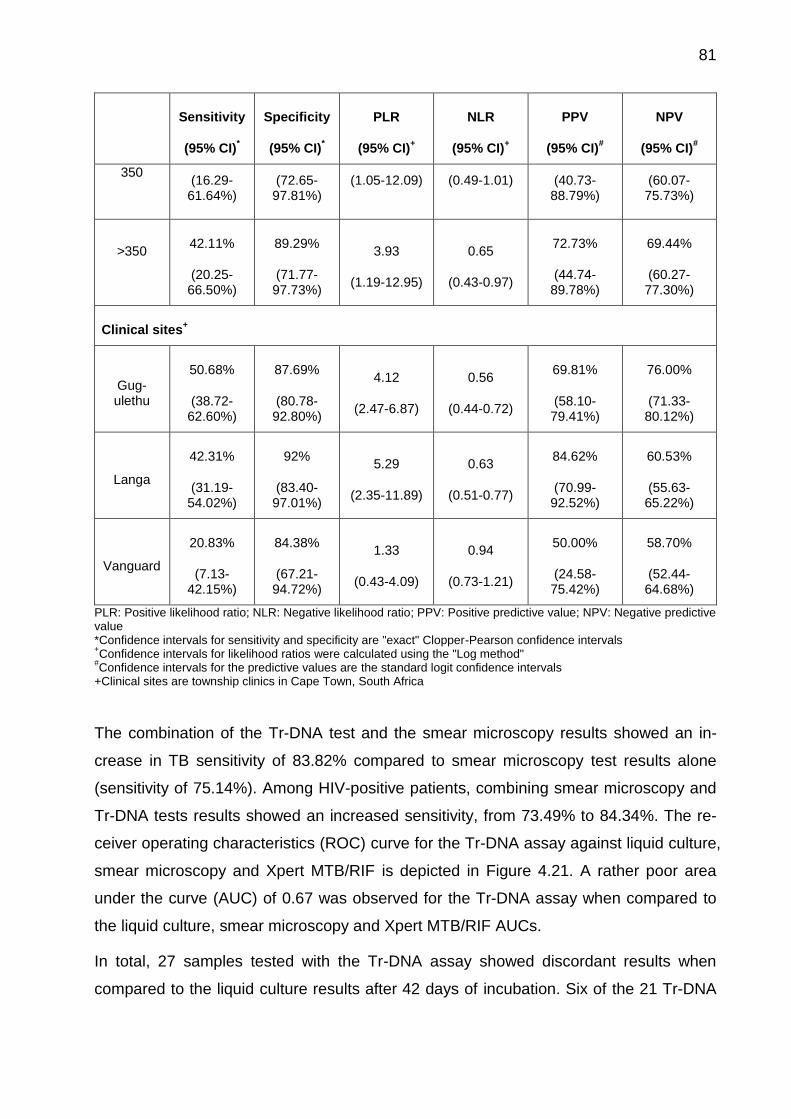
81
Sensitivity
(95% CI)*
Specificity
(95% CI)*
PLR
(95% CI)+
NLR
(95% CI)+
PPV
(95% CI)#
NPV
(95% CI)#
350
(16.29-61.64%)
(72.65-97.81%)
(1.05-12.09) (0.49-1.01) (40.73-88.79%)
(60.07-75.73%)
>350
42.11%
(20.25-66.50%)
89.29%
(71.77-97.73%)
3.93
(1.19-12.95)
0.65
(0.43-0.97)
72.73%
(44.74-89.78%)
69.44%
(60.27-77.30%)
Clinical sites+
Gug-ulethu
50.68%
(38.72-62.60%)
87.69%
(80.78-92.80%)
4.12
(2.47-6.87)
0.56
(0.44-0.72)
69.81%
(58.10-79.41%)
76.00%
(71.33-80.12%)
Langa
42.31%
(31.19-54.02%)
92%
(83.40-97.01%)
5.29
(2.35-11.89)
0.63
(0.51-0.77)
84.62%
(70.99-92.52%)
60.53%
(55.63-65.22%)
Vanguard
20.83%
(7.13-42.15%)
84.38%
(67.21-94.72%)
1.33
(0.43-4.09)
0.94
(0.73-1.21)
50.00%
(24.58-75.42%)
58.70%
(52.44-64.68%)
PLR: Positive likelihood ratio; NLR: Negative likelihood ratio; PPV: Positive predictive value; NPV: Negative predictive value *Confidence intervals for sensitivity and specificity are "exact" Clopper-Pearson confidence intervals +Confidence intervals for likelihood ratios were calculated using the "Log method"
#Confidence intervals for the predictive values are the standard logit confidence intervals
+Clinical sites are township clinics in Cape Town, South Africa
The combination of the Tr-DNA test and the smear microscopy results showed an in-
crease in TB sensitivity of 83.82% compared to smear microscopy test results alone
(sensitivity of 75.14%). Among HIV-positive patients, combining smear microscopy and
Tr-DNA tests results showed an increased sensitivity, from 73.49% to 84.34%. The re-
ceiver operating characteristics (ROC) curve for the Tr-DNA assay against liquid culture,
smear microscopy and Xpert MTB/RIF is depicted in Figure 4.21. A rather poor area
under the curve (AUC) of 0.67 was observed for the Tr-DNA assay when compared to
the liquid culture, smear microscopy and Xpert MTB/RIF AUCs.
In total, 27 samples tested with the Tr-DNA assay showed discordant results when
compared to the liquid culture results after 42 days of incubation. Six of the 21 Tr-DNA
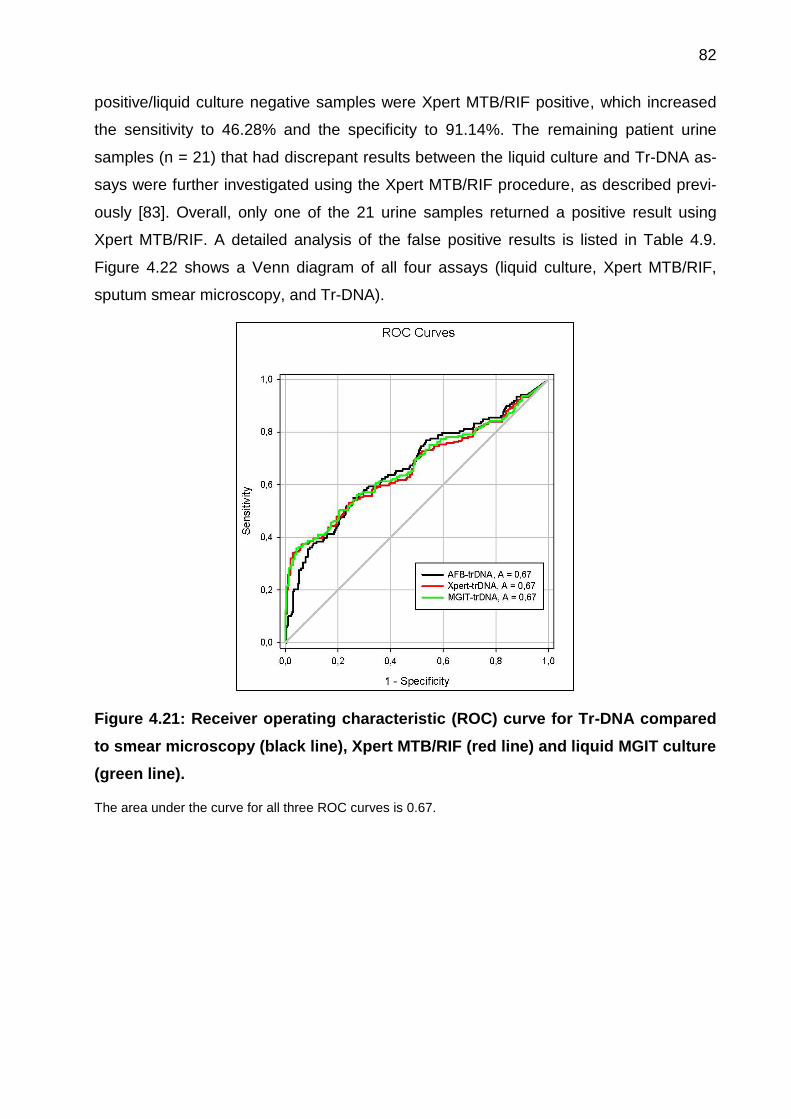
82
positive/liquid culture negative samples were Xpert MTB/RIF positive, which increased
the sensitivity to 46.28% and the specificity to 91.14%. The remaining patient urine
samples (n = 21) that had discrepant results between the liquid culture and Tr-DNA as-
says were further investigated using the Xpert MTB/RIF procedure, as described previ-
ously [83]. Overall, only one of the 21 urine samples returned a positive result using
Xpert MTB/RIF. A detailed analysis of the false positive results is listed in Table 4.9.
Figure 4.22 shows a Venn diagram of all four assays (liquid culture, Xpert MTB/RIF,
sputum smear microscopy, and Tr-DNA).
Figure 4.21: Receiver operating characteristic (ROC) curve for Tr-DNA compared
to smear microscopy (black line), Xpert MTB/RIF (red line) and liquid MGIT culture
(green line).
The area under the curve for all three ROC curves is 0.67.
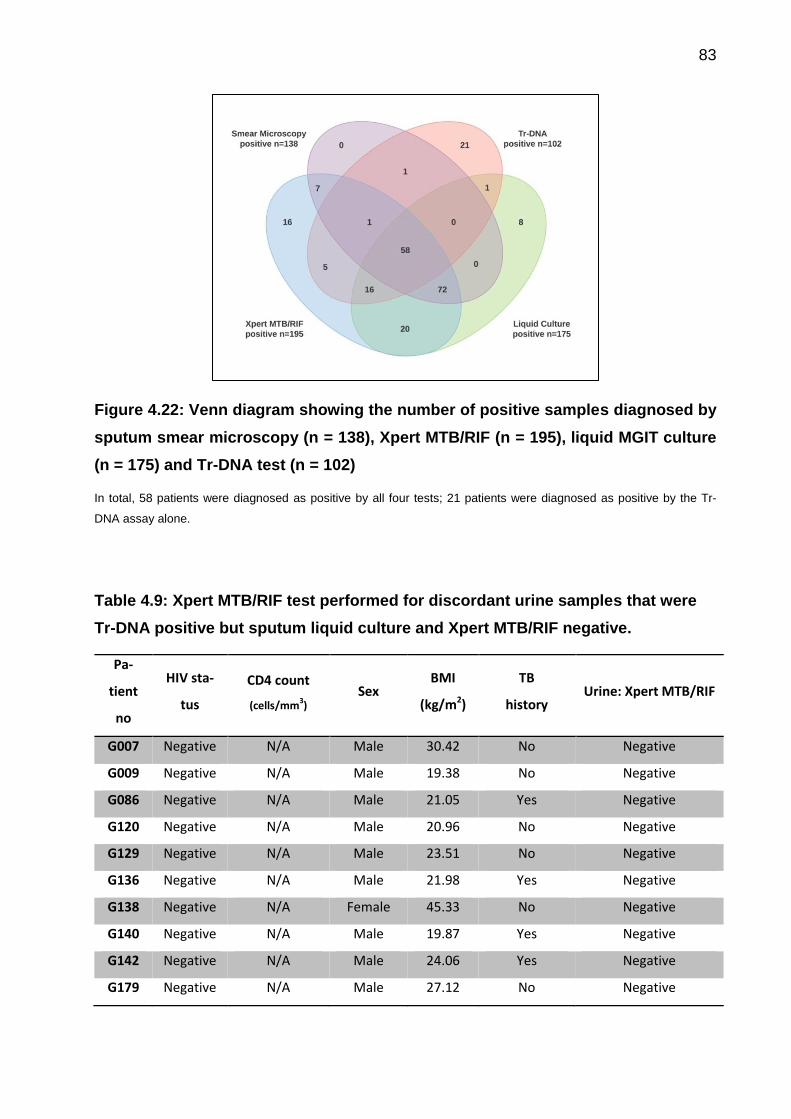
83
Figure 4.22: Venn diagram showing the number of positive samples diagnosed by
sputum smear microscopy (n = 138), Xpert MTB/RIF (n = 195), liquid MGIT culture
(n = 175) and Tr-DNA test (n = 102)
In total, 58 patients were diagnosed as positive by all four tests; 21 patients were diagnosed as positive by the Tr-
DNA assay alone.
Table 4.9: Xpert MTB/RIF test performed for discordant urine samples that were
Tr-DNA positive but sputum liquid culture and Xpert MTB/RIF negative.
Pa-
tient
no
HIV sta-
tus
CD4 count
(cells/mm3)
Sex BMI
(kg/m2)
TB
history Urine: Xpert MTB/RIF
G007 Negative N/A Male 30.42 No Negative
G009 Negative N/A Male 19.38 No Negative
G086 Negative N/A Male 21.05 Yes Negative
G120 Negative N/A Male 20.96 No Negative
G129 Negative N/A Male 23.51 No Negative
G136 Negative N/A Male 21.98 Yes Negative
G138 Negative N/A Female 45.33 No Negative
G140 Negative N/A Male 19.87 Yes Negative
G142 Negative N/A Male 24.06 Yes Negative
G179 Negative N/A Male 27.12 No Negative
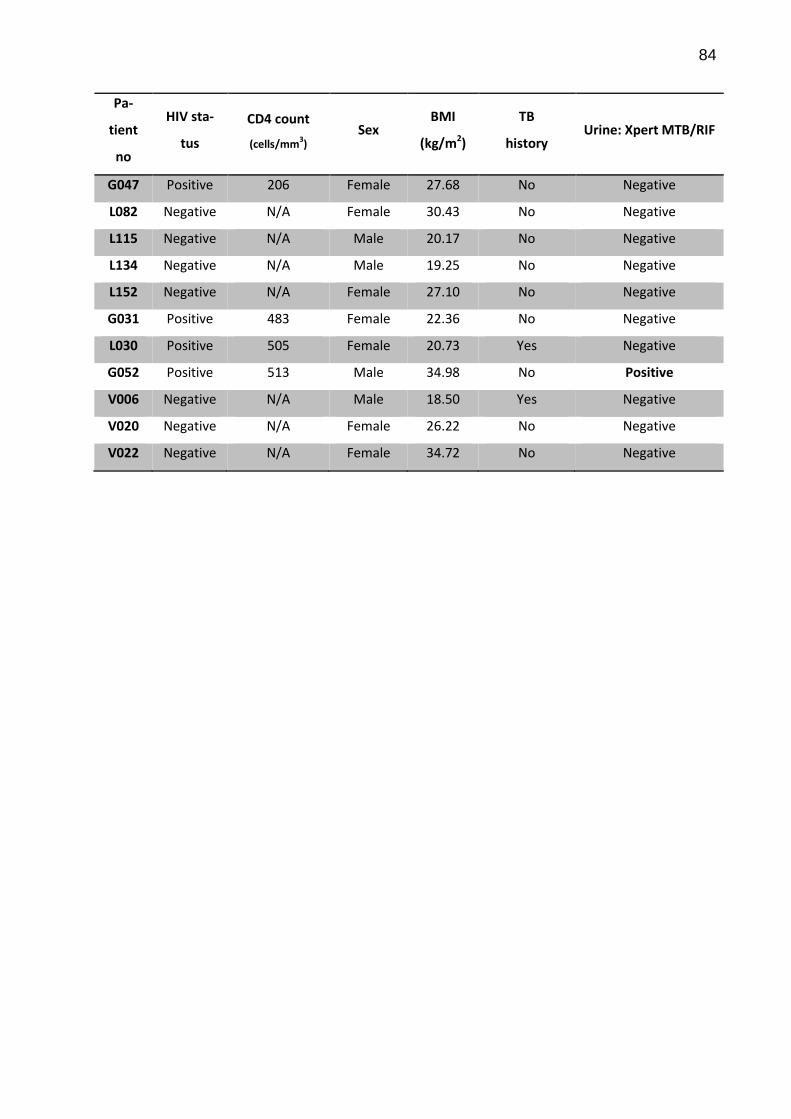
84
Pa-
tient
no
HIV sta-
tus
CD4 count
(cells/mm3)
Sex BMI
(kg/m2)
TB
history Urine: Xpert MTB/RIF
G047 Positive 206 Female 27.68 No Negative
L082 Negative N/A Female 30.43 No Negative
L115 Negative N/A Male 20.17 No Negative
L134 Negative N/A Male 19.25 No Negative
L152 Negative N/A Female 27.10 No Negative
G031 Positive 483 Female 22.36 No Negative
L030 Positive 505 Female 20.73 Yes Negative
G052 Positive 513 Male 34.98 No Positive
V006 Negative N/A Male 18.50 Yes Negative
V020 Negative N/A Female 26.22 No Negative
V022 Negative N/A Female 34.72 No Negative
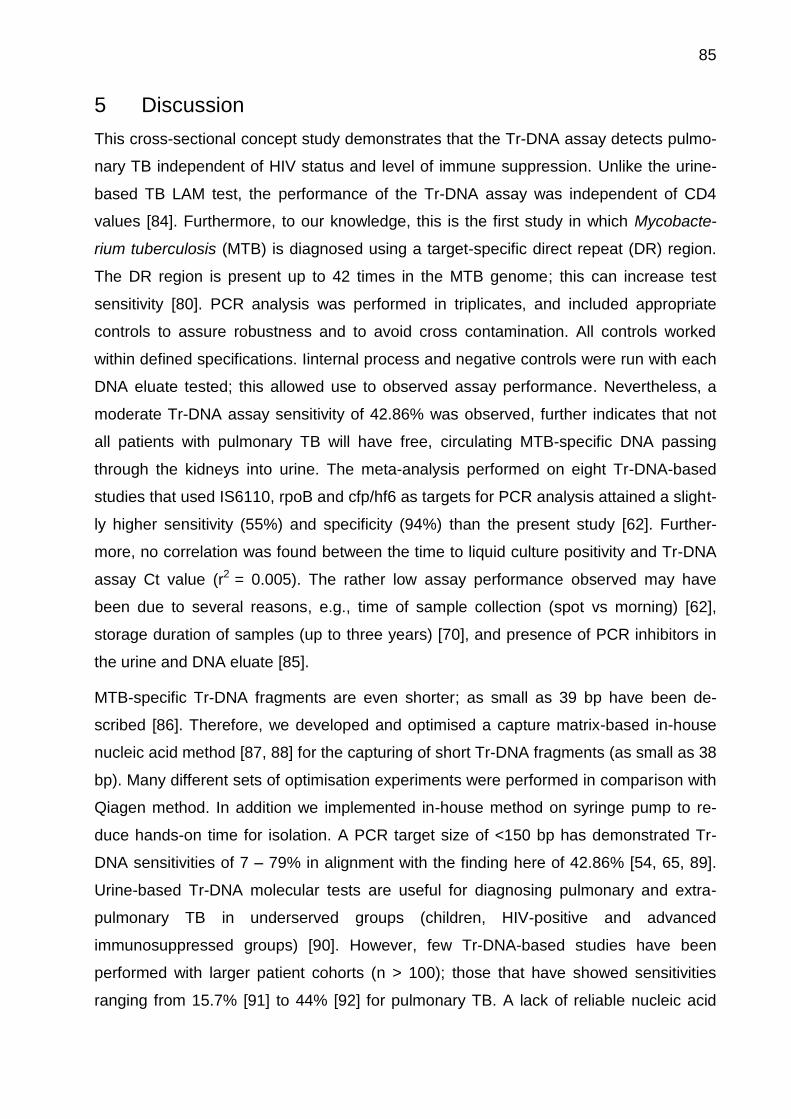
85
5 Discussion
This cross-sectional concept study demonstrates that the Tr-DNA assay detects pulmo-
nary TB independent of HIV status and level of immune suppression. Unlike the urine-
based TB LAM test, the performance of the Tr-DNA assay was independent of CD4
values [84]. Furthermore, to our knowledge, this is the first study in which Mycobacte-
rium tuberculosis (MTB) is diagnosed using a target-specific direct repeat (DR) region.
The DR region is present up to 42 times in the MTB genome; this can increase test
sensitivity [80]. PCR analysis was performed in triplicates, and included appropriate
controls to assure robustness and to avoid cross contamination. All controls worked
within defined specifications. Iinternal process and negative controls were run with each
DNA eluate tested; this allowed use to observed assay performance. Nevertheless, a
moderate Tr-DNA assay sensitivity of 42.86% was observed, further indicates that not
all patients with pulmonary TB will have free, circulating MTB-specific DNA passing
through the kidneys into urine. The meta-analysis performed on eight Tr-DNA-based
studies that used IS6110, rpoB and cfp/hf6 as targets for PCR analysis attained a slight-
ly higher sensitivity (55%) and specificity (94%) than the present study [62]. Further-
more, no correlation was found between the time to liquid culture positivity and Tr-DNA
assay Ct value (r2 = 0.005). The rather low assay performance observed may have
been due to several reasons, e.g., time of sample collection (spot vs morning) [62],
storage duration of samples (up to three years) [70], and presence of PCR inhibitors in
the urine and DNA eluate [85].
MTB-specific Tr-DNA fragments are even shorter; as small as 39 bp have been de-
scribed [86]. Therefore, we developed and optimised a capture matrix-based in-house
nucleic acid method [87, 88] for the capturing of short Tr-DNA fragments (as small as 38
bp). Many different sets of optimisation experiments were performed in comparison with
Qiagen method. In addition we implemented in-house method on syringe pump to re-
duce hands-on time for isolation. A PCR target size of <150 bp has demonstrated Tr-
DNA sensitivities of 7 – 79% in alignment with the finding here of 42.86% [54, 65, 89].
Urine-based Tr-DNA molecular tests are useful for diagnosing pulmonary and extra-
pulmonary TB in underserved groups (children, HIV-positive and advanced
immunosuppressed groups) [90]. However, few Tr-DNA-based studies have been
performed with larger patient cohorts (n > 100); those that have showed sensitivities
ranging from 15.7% [91] to 44% [92] for pulmonary TB. A lack of reliable nucleic acid
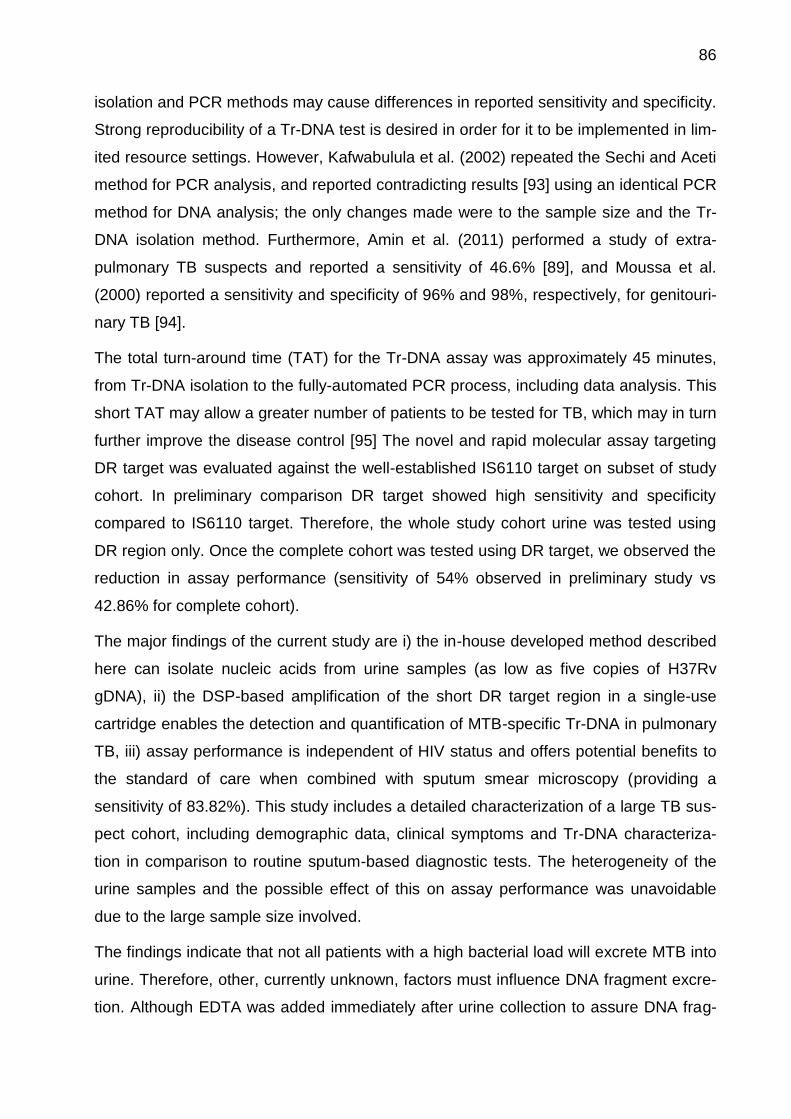
86
isolation and PCR methods may cause differences in reported sensitivity and specificity.
Strong reproducibility of a Tr-DNA test is desired in order for it to be implemented in lim-
ited resource settings. However, Kafwabulula et al. (2002) repeated the Sechi and Aceti
method for PCR analysis, and reported contradicting results [93] using an identical PCR
method for DNA analysis; the only changes made were to the sample size and the Tr-
DNA isolation method. Furthermore, Amin et al. (2011) performed a study of extra-
pulmonary TB suspects and reported a sensitivity of 46.6% [89], and Moussa et al.
(2000) reported a sensitivity and specificity of 96% and 98%, respectively, for genitouri-
nary TB [94].
The total turn-around time (TAT) for the Tr-DNA assay was approximately 45 minutes,
from Tr-DNA isolation to the fully-automated PCR process, including data analysis. This
short TAT may allow a greater number of patients to be tested for TB, which may in turn
further improve the disease control [95] The novel and rapid molecular assay targeting
DR target was evaluated against the well-established IS6110 target on subset of study
cohort. In preliminary comparison DR target showed high sensitivity and specificity
compared to IS6110 target. Therefore, the whole study cohort urine was tested using
DR region only. Once the complete cohort was tested using DR target, we observed the
reduction in assay performance (sensitivity of 54% observed in preliminary study vs
42.86% for complete cohort).
The major findings of the current study are i) the in-house developed method described
here can isolate nucleic acids from urine samples (as low as five copies of H37Rv
gDNA), ii) the DSP-based amplification of the short DR target region in a single-use
cartridge enables the detection and quantification of MTB-specific Tr-DNA in pulmonary
TB, iii) assay performance is independent of HIV status and offers potential benefits to
the standard of care when combined with sputum smear microscopy (providing a
sensitivity of 83.82%). This study includes a detailed characterization of a large TB sus-
pect cohort, including demographic data, clinical symptoms and Tr-DNA characteriza-
tion in comparison to routine sputum-based diagnostic tests. The heterogeneity of the
urine samples and the possible effect of this on assay performance was unavoidable
due to the large sample size involved.
The findings indicate that not all patients with a high bacterial load will excrete MTB into
urine. Therefore, other, currently unknown, factors must influence DNA fragment excre-
tion. Although EDTA was added immediately after urine collection to assure DNA frag-
87
ment stability, the limited sensitivity achieved here may have been associated with a
minor degradation process, as the samples were not processed fresh [96]. Furthermore,
the excess amount of EDTA added may also have inhibited the PCR process, which
may in turn have resulted in reducing assay sensitivity [97]. In order to allow interpreta-
tion of the discordant results observed for extra-pulmonary and disseminated TB, partic-
ipant follow up would be required; this is missing from the current study. Furthermore,
negative bacteriological tests results among discordant samples raises the question
regarding which diagnostic method should be used as gold standard. Thus, the present
study reveals a significant discrepancy between established methods of TB diagnosis
and the Tr-DNA assay tested here. Therefore, this study serves as a preliminary inves-
tigation on which to base the future research and assay development. The effort to de-
velop a Tr-DNA-based molecular assay that runs on an automated analyser should fur-
ther be pursued to gain an understanding of the potential benefits it could bring to diag-
nostics. Likewise, the current in-house developed Tr-DNA isolation method requires
technical skills to perform and to make it suitable to be used in limited resource settings;
therefore, further simplification is required. This novel Tr-DNA diagnostic test should be
evaluated for its impact on public health and its clinical utility to be used for diagnostics
[98, 99]. A future Tr-DNA study should include the analysis of fresh urine samples, and
participant inclusion criteria should not be limited to pulmonary TB only.
6 Conclusion
TB remains a major problem in developing the country and among HIV-infected pa-
tients. The TB diagnosis method is particularly valuable in a limited resource setting for
timely initiation of therapy. Newer urine-based molecular methods could be an alterna-
tive to the current smear microscopy tests performed using sputum. This first proof-of-
concept, cross-sectional study demonstrates the possibility of diagnosing pulmonary TB
using a novel Tr-DNA molecular assay implemented using a single-use cartridge, which
is processed using an automated molecular analyser. Considering that MTB specific
cell-free circulating DNA fragments present in the blood that pass through the kidney in
urine. Furthermore, in-house developed method capable enough to extract the DNA
fragments from larger urine volume. The overall sensitivity was moderate; however, a
higher specificity was obtained. This in-house developed Tr-DNA isolation method also
has the potential to be used for other body fluids, such as plasma. Although unsuitable
88
to be implemented as a stand-alone test, in combination with sputum smear microscopy,
this Tr-DNA assay may have the potential to aid TB diagnosis in HIV-endemic regions,
where sputum scarce and extra-pulmonary TB are common [100, 101].
89
7 References
1. Hershkovitz, I., et al., Detection and molecular characterization of 9,000-year-old Mycobacterium tuberculosis from a Neolithic settlement in the Eastern Mediterranean. PLoS One, 2008. 3(10): p. e3426.
2. Daniel, T.M., Robert Koch and the pathogenesis of tuberculosis. International Journal of Tuberculosis and Lung Disease, 2005. 9(11): p. 1181-1182.
3. Daniel, T.M., The history of tuberculosis. Respir Med, 2006. 100(11): p. 1862-70. 4. Fu, L.M. and C.S. Fu-Liu, Is Mycobacterium Tuberculosis a closer relative to
Gram-positive or Gram–negative bacterial pathogens? Tuberculosis (Edinb), 2002. 82(2-3): p. 85-90.
5. Riley, R.L., Disease Transmission and Contagion Control. American Review of Respiratory Disease, 1982. 125: p. 16-19.
6. Gupta, S., et al., Role of risk factors and socio-economic status in pulmonary tuberculosis: a search for the root cause in patients in a tertiary care hospital, South India. Trop Med Int Health, 2011. 16(1): p. 74-8.
7. Esmail, H., et al., The ongoing challenge of latent tuberculosis. Philos Trans R Soc Lond B Biol Sci, 2014. 369(1645): p. 20130437.
8. Kingkaewa, N., et al., HIV-associated extrapulmonary tuberculosis in Thailand: epidemiology and risk factors for death. international Journal of Infectious Diseases, 2009. 13: p. 722-729.
9. Leeds, I.L., et al., Site of extrapulmonary tuberculosis is associated with HIV infection. Clin Infect Dis, 2012. 55(1): p. 75-81.
10. WHO Global Tuberculosis Report 2015 World Health Organization, Geneva, 2015. Accessed on 25 Feb. 2017 at http://apps.who.int/iris/bitstream/10665/191102/1/9789241565059_eng.pdf.
11. Hermans, S., C.R. Horsburgh, Jr., and R. Wood, A Century of Tuberculosis Epidemiology in the Northern and Southern Hemisphere: The Differential Impact of Control Interventions. PLoS One, 2015. 10(8): p. e0135179.
12. WHO, WHO Global Tuberculosis Report 2016.World Health Organization, Geneva, 2016. Accessed on 25 Feb 2017 at http://apps.who.int/iris/bitstream/10665/250441/1/9789241565394-eng.pdf?ua=1. 2016.
13. WHO, Global Tuberculosis Report 2015 WHO, in who.int. 2015. 14. Geldmacher, C., A. Zumla, and M. Hoelscher, Interaction between HIV and
Mycobacterium tuberculosis: HIV-1-induced CD4 T-cell depletion and the development of active tuberculosis. Curr Opin HIV AIDS, 2012. 7(3): p. 268-75.
15. Daniel, T.M., Leon Charles Albert Calmette and BCG vaccine. international Journal of Tuberculosis and Lung Disease, 2005. 9(9): p. 944-945.
16. Moliva, J.I., J. Turner, and J.B. Torrelles, Prospects in Mycobacterium bovis Bacille Calmette et Guerin (BCG) vaccine diversity and delivery: why does BCG fail to protect against tuberculosis? Vaccine, 2015. 33(39): p. 5035-41.
17. Campos, L.C., et al., Characteristics of Patients with Smear-Negative Pulmonary Tuberculosis (TB) in a Region with High TB and HIV Prevalence. PLoS One, 2016. 11(1): p. e0147933.
18. van Cleeff, M.R., et al., The role and performance of chest X-ray for the diagnosis of tuberculosis: a cost-effectiveness analysis in Nairobi, Kenya. BMC Infect Dis, 2005. 5: p. 111.
90
19. Weinrich, J.M., et al., Yield of chest X-ray tuberculosis screening of immigrants during the European refugee crisis of 2015: a single-centre experience. Eur Radiol, 2017.
20. Muyoyeta, M., et al., The Sensitivity and Specificity of Using a Computer Aided Diagnosis Program for Automatically Scoring Chest X-Rays of Presumptive TB Patients ompared with Xpert MTB/RIF in Lusaka Zambia. PloS One, 2014. 9(4).
21. Alzahrani, S.A., et al., Systematic review and meta-analysis for the use of ultrasound versus radiology in diagnosing of pneumonia. Crit Ultrasound J, 2017. 9(1): p. 6.
22. Singhal, R. and V.P. Myneedu, Microscopy as a diagnostic tool in pulmonary tuberculosis. Int J Mycobacteriol, 2015. 4(1): p. 1-6.
23. Gupta, R.K., et al., Impact of human immunodeficiency virus and CD4 count on tuberculosis diagnosis: analysis of city-wide data from Cape Town, South Africa. Int J Tuberc Lung Dis, 2013. 17(8): p. 1014-22.
24. Tostmann, A., et al., Tuberculosis transmission by patients with smear-negative pulmonary tuberculosis in a large cohort in the Netherlands. Clin Infect Dis, 2008. 47(9): p. 1135-42.
25. Swai, H.F., F.M. Mugusi, and J.K. Mbwambo, Sputum smear negative pulmonary tuberculosis: sensitivity and specificity of diagnostic algorithm. BMC Research Notes, 2011. 4(475).
26. Cudahy, P. and S.V. Shenoi, Diagnostics for pulmonary tuberculosis. Postgrad Med J, 2016. 92(1086): p. 187-93.
27. Hepple, P., et al., Implementation of liquid culture for tuberculosis diagnosis in a remote setting: lessons learned. internal journal of tuberculosis and lung disease, 2011. 15(3): p. 405-407.
28. Storla, D.G., S. Yimer, and G.A. Bjune, A systematic review of delay in the diagnosis and treatment of tuberculosis. BMC Public Health, 2008. 8: p. 15.
29. Burman, W.J. and R.R. Reves, Review of False-Positive Cultures for Mycobacterium tuberculosis and Recommendations for Avoiding Unnecessary Treatment. Clinical Infectious Diseases, 2000. 31: p. 1390-5.
30. Pai, M. and M. Schito, Tuberculosis diagnostics in 2015: landscape, priorities, needs, and prospects. J Infect Dis, 2015. 211 Suppl 2: p. S21-8.
31. Chang, K., et al., Rapid and effective diagnosis of tuberculosis and rifampicin resistance with Xpert MTB/RIF assay: a meta-analysis. J Infect, 2012. 64(6): p. 580-8.
32. Denkinger, C.M., S.V. Kik, and M. Pai, Robust, reliable and resilient: designing molecular tuberculosis tests for microscopy centers in developing countries. Expert Rev Mol Diagn, 2013. 13(8): p. 763-7.
33. Sabiiti, W., et al., Optimising molecular diagnostic capacity for effective control of tuberculosis in high-burden settings. Int J Tuberc Lung Dis, 2016. 20(8): p. 1004-9.
34. Tortoli, E., et al., Clinical validation of Xpert MTB/RIF for the diagnosis of extrapulmonary tuberculosis. Eur Respir J, 2012. 40(2): p. 442-7.
35. Cheon, S.A., et al., Recent tuberculosis diagnosis toward the end TB strategy. J Microbiol Methods, 2016. 123: p. 51-61.
36. Lalvani, A., Diagnosing tuberculosis infection in the 21st century: new tools to tackle an old enemy. Chest, 2007. 131(6): p. 1898-906.
37. Sester, M., et al., Interferon-gamma release assays for the diagnosis of active tuberculosis: a systematic review and meta-analysis. Eur Respir J, 2011. 37(1): p. 100-11.
91
38. Metcalfe, J.Z., et al., Interferon-gamma release assays for active pulmonary tuberculosis diagnosis in adults in low- and middle-income countries: systematic review and meta-analysis. J Infect Dis, 2011. 204 Suppl 4: p. S1120-9.
39. Santin, M., L. Munoz, and D. Rigau, Interferon-gamma release assays for the diagnosis of tuberculosis and tuberculosis infection in HIV-infected adults: a systematic review and meta-analysis. PLoS One, 2012. 7(3): p. e32482.
40. Sollai, S., et al., Systematic review and meta-analysis on the utility of Interferon-gamma release assays for the diagnosis of Mycobacterium tuberculosis infection in children: a 2013 update. BMC Infect Dis, 2014. 14 Suppl 1: p. S6.
41. Hamasur, B., et al., Rapid diagnosis of tuberculosis by detection of mycobacterial lipoarabinomannan in urine. Journal of Microbiological Methods, 2001. 45(1): p. 41-52.
42. Shah, M., et al., Lateral flow urine lipoarabinomannan assay for detecting active tuberculosis in HIV-positive adults. Cochrane Database Syst Rev, 2016(5): p. CD011420.
43. Minion, J., et al., Diagnosing tuberculosis with urine lipoarabinomannan: systematic review and meta-analysis. Eur Respir J, 2011. 38(6): p. 1398-405.
44. Lawn, S.D., et al., Clinical significance of lipoarabinomannan detection in urine using a low-cost point-of-care diagnostic assay for HIV-associated tuberculosis. AIDS, 2012. 26(13): p. 1635-43.
45. Dheda, K., et al., Clinical utility of a commercial LAM-ELISA assay for TB diagnosis in HIV-infected patients using urine and sputum samples. PLoS One, 2010. 5(3): p. e9848.
46. Hanifa, Y., et al., The diagnostic accuracy of urine lipoarabinomannan test for tuberculosis screening in a South African correctional facility. PLoS One, 2015. 10(5): p. e0127956.
47. WHO, The use of lateral flow urine lipoarabinomannan assay (LF-LAM) for the diagnosis and screening of active tuberculosis in people living with HIV. WHO, 2015.
48. WHO 2015. The use of lateral flow urine lipoarabinomannan assay (LF-LAM) for the diagnosis and screening of active tuberculosis in people living with HIV. World Health Organization, Geneva, 2015. Accessed on 25 Feb. 2017 at . http://apps.who.int/iris/bitstream/10665/193633/1/9789241509633_eng.pdf?ua=1&ua=1.
49. McNerney, R., et al., Tuberculosis diagnostics and biomarkers: needs, challenges, recent advances, and opportunities. J Infect Dis, 2012. 205 Suppl 2: p. S147-58.
50. Doherty, T.M., R.S. Wallis, and A. Zumla, Biomarkers of disease activity, cure, and relapse in tuberculosis. Clin Chest Med, 2009. 30(4): p. 783-96, x.
51. Bryzgunova, O.E., et al., Isolation and comparative study of cell-free nucleic acids from human urine. Ann N Y Acad Sci, 2006. 1075: p. 334-40.
52. Green, C., et al., Rapid diagnosis of tuberculosis through the detection of mycobacterial DNA in urine by nucleic acid amplification methods. The Lancet Infectious Diseases, 2009. 9(8): p. 505-511.
53. Anker, P., H. Mulcahy, and M. Stroun, Circulating nucleic acids in plasma and serum as a noninvasive investigation for cancer: time for large-scale clinical studies? Int J Cancer, 2003. 103(2): p. 149-52.
54. Rebollo, M.J., et al., Blood and urine samples as useful sources for the direct detection of tuberculosis by polymerase chain reaction. Diagn Microbiol Infect Dis, 2006. 56(2): p. 141-6.
92
55. Jamshidi Makiani, M., et al., Urine-Based Nested PCR for the Diagnosis of Mycobacterium tuberculosis: A Comparative Study Between HIV-Positive and HIV-Negative Patients. Jundishapur J Microbiol, 2016. 9(8): p. e35634.
56. Drain, P.K., et al., Rapid Urine LAM Testing Improves Diagnosis of Expectorated Smear-Negative Pulmonary Tuberculosis in an HIV-endemic Region. Sci Rep, 2016. 6: p. 19992.
57. Joel, D.R., et al., Diagnosis of paediatric tuberculosis using sputum induction in Botswana: programme description and findings. Int J Tuberc Lung Dis, 2014. 18(3): p. 328-34.
58. Kramer, F., et al., Delayed diagnosis of tuberculosis in patients with human immunodeficiency virus infection. Am J Med, 1990. 89(4): p. 451-6.
59. Davis, J.L., et al., Nucleic acid amplification tests for diagnosis of smear-negative TB in a high HIV-prevalence setting: a prospective cohort study. PLoS One, 2011. 6(1): p. e16321.
60. Alavi, S.M., P. Bakhtiyariniya, and A. Albagi, Factors associated with delay in diagnosis and treatment of pulmonary tuberculosis. Jundishapur J Microbiol, 2015. 8(3): p. e19238.
61. Virenfeldt, J., et al., Treatment delay affects clinical severity of tuberculosis: a longitudinal cohort study. BMJ Open, 2014. 4(6): p. e004818.
62. Marangu, D., B. Devine, and G. John-Stewart, Diagnostic accuracy of nucleic acid amplification tests in urine for pulmonary tuberculosis: a meta-analysis. Int J Tuberc Lung Dis, 2015. 19(11): p. 1339-47.
63. El Bali, L., et al., Comparative study of seven commercial kits for human DNA extraction from urine samples suitable for DNA biomarker-based public health studies. J Biomol Tech, 2014. 25(4): p. 96-110.
64. Kolk, A.H., et al., Detection of Mycobacterium tuberculosis in Clinical Samples by Using Polymerase Chain Reaction and a Nonradioactive Detection System. Journal of Clinical Microbiology, 1992. 30(10): p. 2567-2575.
65. Cannas, A., et al., Mycobacterium tuberculosis DNA detection in soluble fraction of urine from pulmonary tuberculosis patients. International Journal of Tuberculosis and Lung Disease, 2008. 12(2): p. 146-151.
66. Peeling, R.W. and R. McNerney, Emerging technologies in point-of-care molecular diagnostics for resource-limited settings. Expert Rev Mol Diagn, 2014. 14(5): p. 525-34.
67. Denkinger, C.M. and M. Pai, Point-of-care tuberculosis diagnosis: are we there yet? The Lancet Infectious Diseases, 2012. 12(3): p. 169-170.
68. Hsiao, N.Y., et al., Laboratory Evaluation of the Alere q Point-of-Care System for Early Infant HIV Diagnosis. PLoS One, 2016. 11(3): p. e0152672.
69. Niemz, A., T.M. Ferguson, and D.S. Boyle, Point-of-care nucleic acid testing for infectious diseases. Trends Biotechnol, 2011. 29(5): p. 240-50.
70. Labugger, I., et al., Detection of transrenal DNA for the diagnosis of pulmonary tuberculosis and treatment monitoring. Infection, 2016.
71. Lemaire, J.F. and M. Casenghi, New diagnostics for tuberculosis: fulfilling patient needs first. J Int AIDS Soc, 2010. 13: p. 40.
72. Stinson, K.W., et al., Mycobacteriology Laboratory Manual. Global Laboratory Initiative a Working Group of the Stop TB Partnership, 2014(1).
73. Theron, G., et al., Evaluation of the Xpert MTB/RIF assay for the diagnosis of pulmonary tuberculosis in a high HIV prevalence setting. Am J Respir Crit Care Med, 2011. 184(1): p. 132-40.
93
74. Van Rie, A., et al., Sputum smear microscopy: evaluation of impact of training, microscope distribution, and use of external quality assessment guidelines for resource-poor settings. J Clin Microbiol, 2008. 46(3): p. 897-901.
75. Won, E.J., et al., Multiplex Real-Time PCR Assay Targeting Eight Parasites Customized to the Korean Population: Potential Use for Detection in Diarrheal Stool Samples from Gastroenteritis Patients. PLoS One, 2016. 11(11): p. e0166957.
76. Rao, X., et al., An improvement of the 2ˆ(–delta delta CT) method for quantitative real-time polymerase chain reaction data analysis. Biostat Bioinforma Biomat, 2013. 3(3): p. 71-85.
77. Pau, C.P., et al., A rapid real-time PCR assay for the detection of HIV-1 proviral DNA using double-stranded primer. J Virol Methods, 2010. 164(1-2): p. 55-62.
78. Ullrich, T., et al., Competitive Reporter Monitored Amplification (CMA) - Quantification of Molecular Targets by Real Time Monitoring of Competitive Reporter Hybridization. PLoS One, 2012. 7(4): p. 1-13.
79. BEGGS, M.L., et al., Characterization of Mycobacterium tuberculosis Complex Direct Repeat Sequence for Use in Cycling Probe Reaction. journal of Clinical Microbiology, 1996. 34(12): p. 2985-2989.
80. Becq, J., et al., Contribution of horizontally acquired genomic islands to the evolution of the tubercle bacilli. Mol Biol Evol, 2007. 24(8): p. 1861-71.
81. Whiting, P.F., et al., Graphical presentation of diagnostic information. BMC Med Res Methodol, 2008. 8: p. 20.
82. Altman, D.G. and J.M. Bland, Diagnostic tests 3: receiver operating characteristic plots. British Medical Journal (Clinical Research Ed.), 1994. 309(188): p. 188.
83. Peter, J.G., et al., The diagnostic accuracy of urine-based Xpert MTB/RIF in HIV-infected hospitalized patients who are smear-negative or sputum scarce. PLoS One, 2012. 7(7): p. e39966.
84. Kontanis, E.J. and F.A. Reed, Evaluation of real-time PCR amplification efficiencies to detect PCR inhibitors. J Forensic Sci, 2006. 51(4): p. 795-804.
85. Melkonyan, H.S., et al., Transrenal Nucleic Acids: From Proof of Principle to Clinical Tests. Annals of the New York Academy of Sciences, 2008: p. 73-81.
86. BOOM, R., et al., Improved Silica-Guanidiniumthiocyanate DNA Isolation Procedure Based on Selective Binding of Bovine Alpha-Casein to Silica Particles. Journal of Clinical Microbiology, 1999. 37(3): p. 615-619.
87. Kiyomi, O., et al., A DNA Extraction Method Using a Silica-base Resin Type Kit for the Detection of Genetically Modified Papaya. Journal of the Food Hygienic Society of Japan, 2007. 49(2): p. 63-69.
88. Amin, I., et al., PCR could be a method of choice for identification of both pulmonary and extra-pulmonary tuberculosis. BMC Research Notes, 2011. 4(332): p. 1-5.
89. Peter, J., et al., Urine for the diagnosis of tuberculosis: current approaches, clinical applicability, and new developments. Current Opinion in Pulmonary Medicine, 2010. 16(3): p. 262-270.
90. Sechi, L.A., et al., Detection of Mycobacterium tuberculosis by PCR analysis of urine and other clinical samples from AIDS and non-HIV-infected patients. Molecular and Cellular Probes, 1997: p. 281-285.
91. Torrea, G., et al., PCR-based detection of the Mycobacterium tuberculosis complex in urine of HIV-infected and uninfected pulmonary and extrapulmonary tuberculosis patients in Burkina Faso. Journal of Medical Microbiology 2005. 54(1): p. 39-44.
94
92. Kafwabulula, M., et al., Evaluation of PCR-based methods for the diagnosis of tuberculosis by identification of mycobacterial DNA in urine samples. International Journal of Tuberculosis and Lung Disease, 2002. 6(8): p. 732-7.
93. MOUSSA, O.M., et al., RAPID DIAGNOSIS OF GENITOURINARY TUBERCULOSIS BY POLYMERASE CHAIN REACTION AND NON-RADIOACTIVE DNA HYBRIDIZATION. the Journal of Urology, 2000. 164(2): p. 584-588.
94. Niemz, A. and D.S. Boyle, Nucleic acid testing for tuberculosis at the point-of-care in high-burden countries. expert reviews molecular diagnostics, 2012. 12(7): p. 687-701.
95. Milde, A., H. Haas-Rochholz, and H.J. Kaatsch, Improved DNA typing of human urine by adding EDTA. International Journal of Legal Medicine, 1999. 112(3): p. 209-210.
96. Huggett, J.F., et al., Differential susceptibility of PCR reactions to inhibitors: an important and unrecognised phenomenon. BMC Res Notes, 2008. 1: p. 70.
97. Lessells, R.J., et al., Evaluation of tuberculosis diagnostics: establishing an evidence base around the public health impact. J Infect Dis, 2011. 204 Suppl 4: p. S1187-95.
98. Bossuyt, P.M., et al., Beyond diagnostic accuracy: the clinical utility of diagnostic tests. Clin Chem, 2012. 58(12): p. 1636-43.
99. Zar, H.J., et al., Sputum induction for the diagnosis of pulmonary tuberculosis in infants and young children in an urban setting in South Africa. Archives of Disease in Childhood, 2000. 82(4).
100. Gonzalez-Angulo, Y., et al., Sputum induction for the diagnosis of pulmonary tuberculosis: a systematic review and meta-analysis. Eur J Clin Microbiol Infect Dis, 2012. 31(7): p. 1619-30.
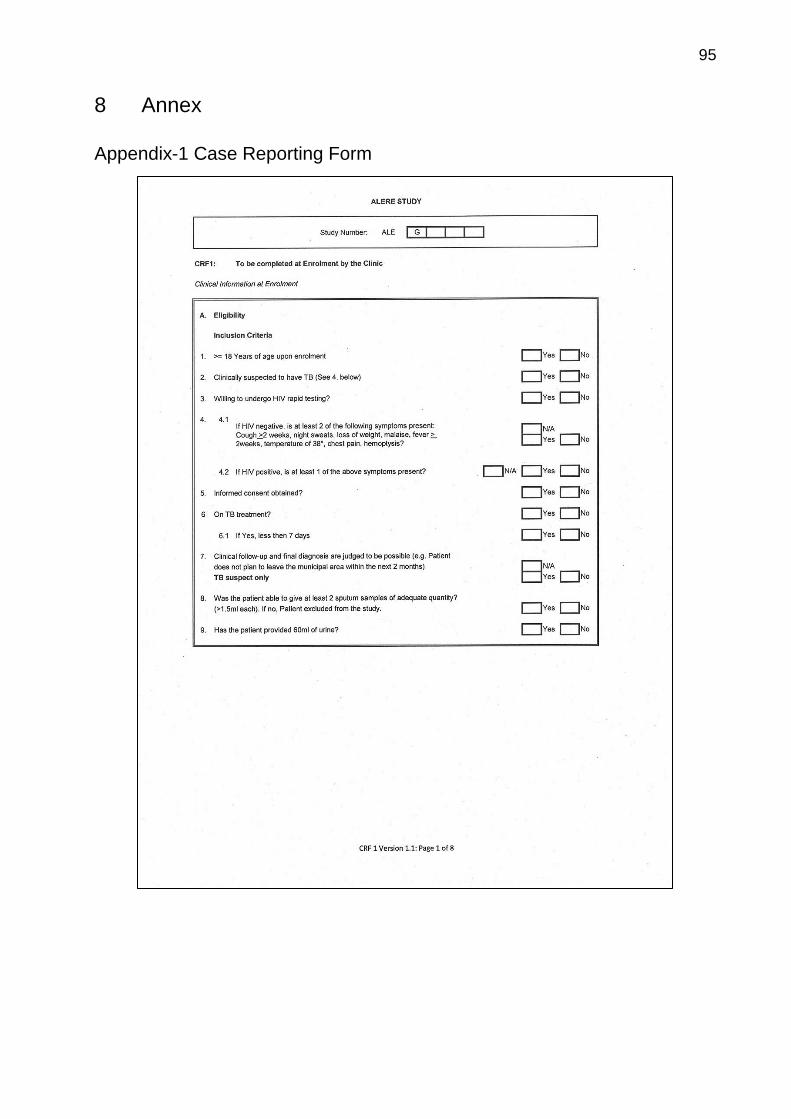
95
8 Annex
Appendix-1 Case Reporting Form
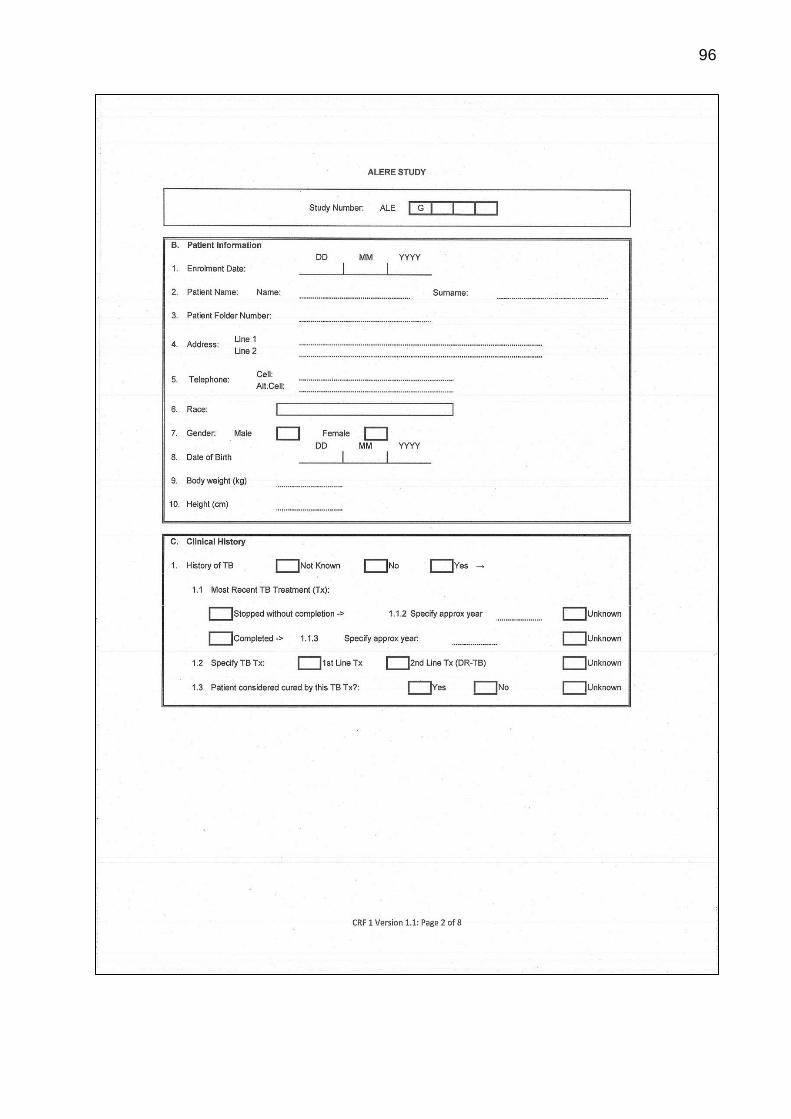
96
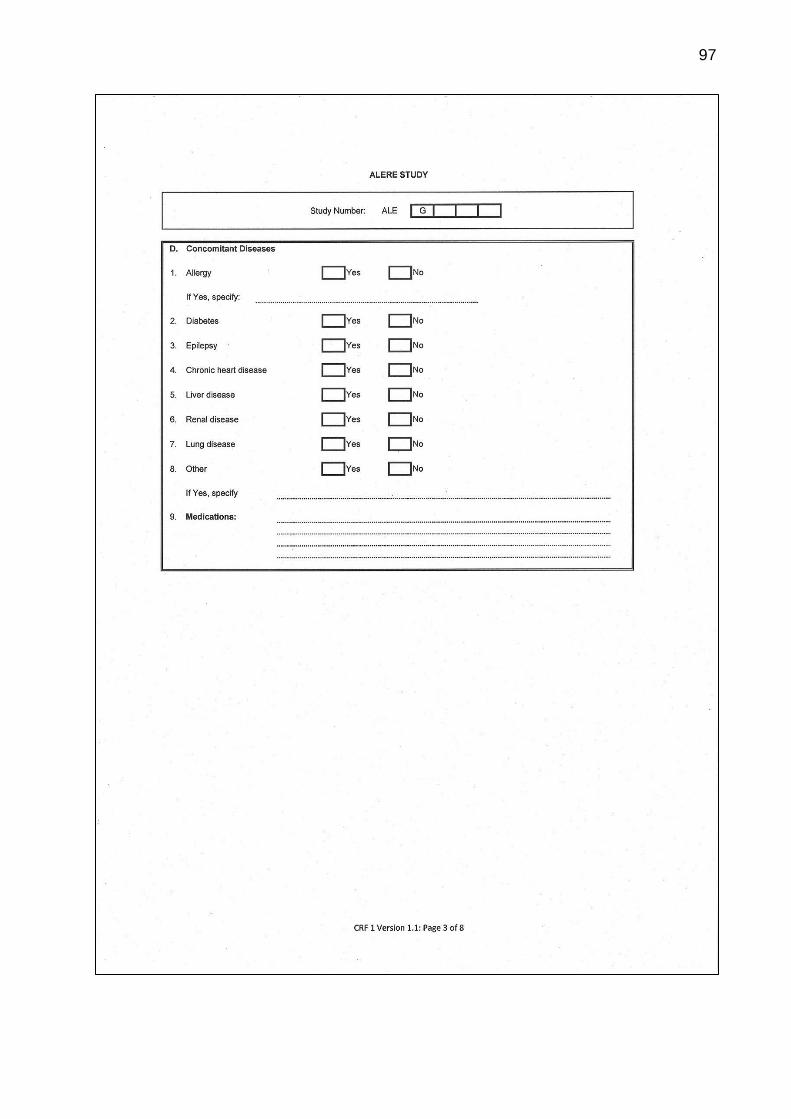
97
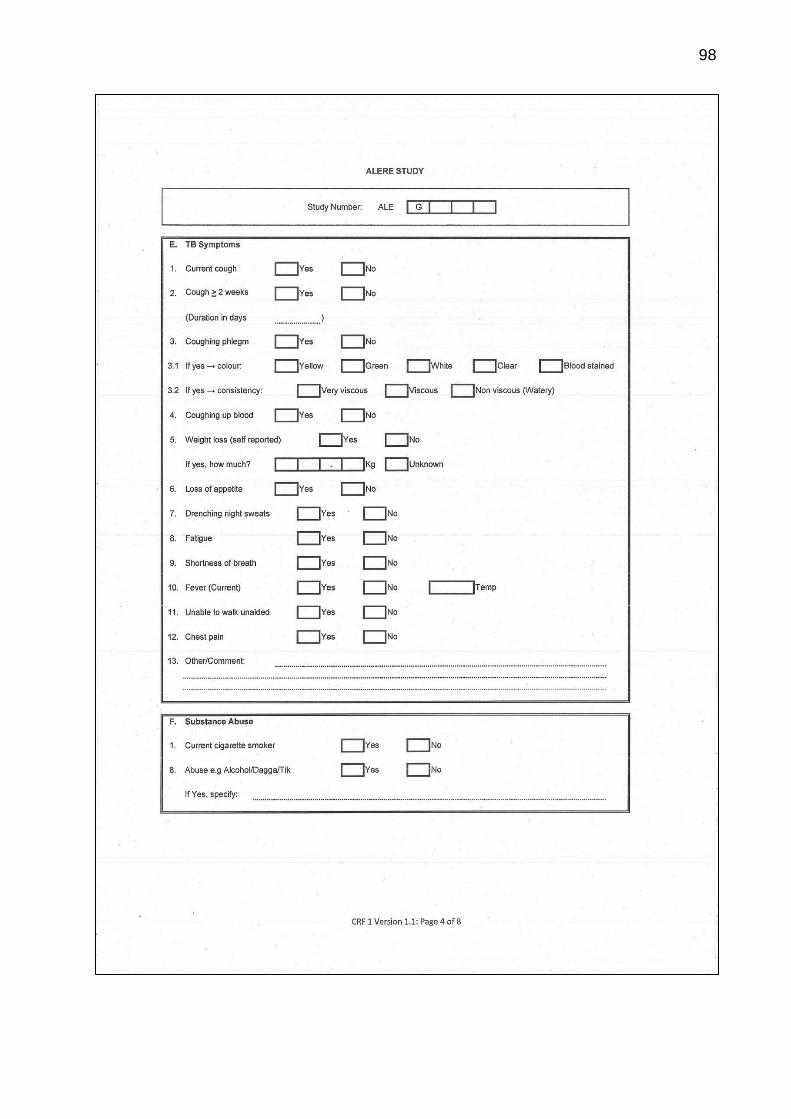
98
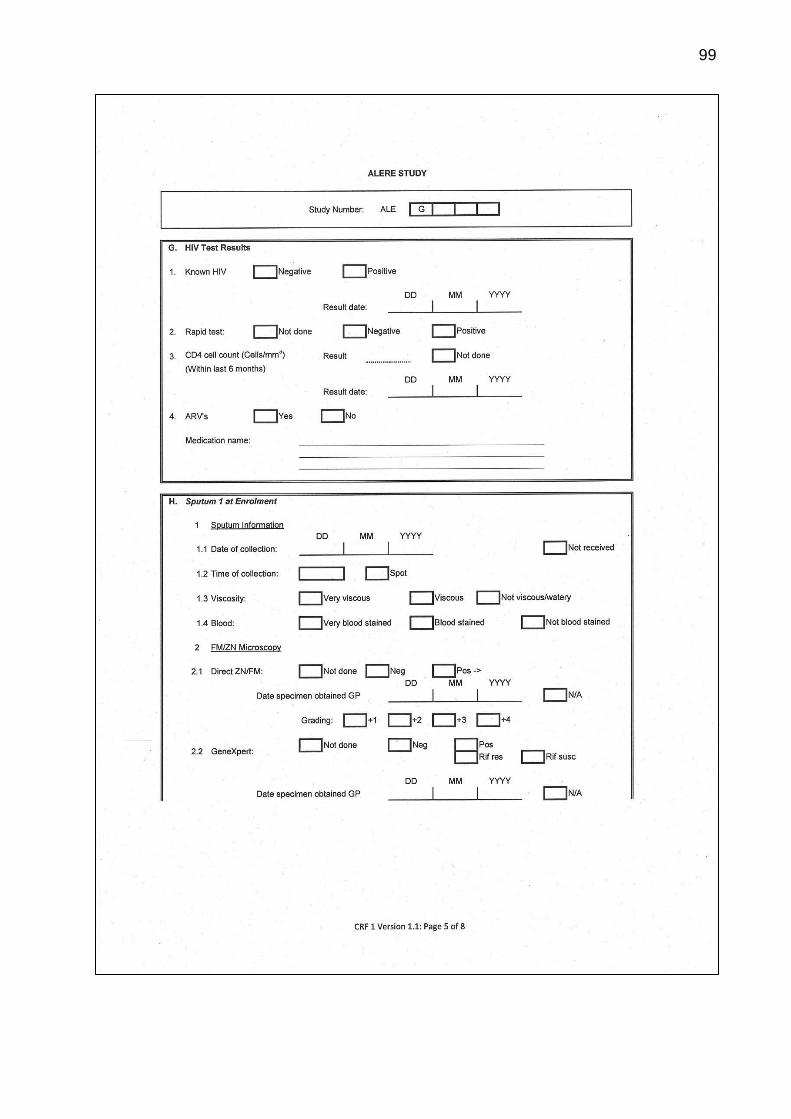
99
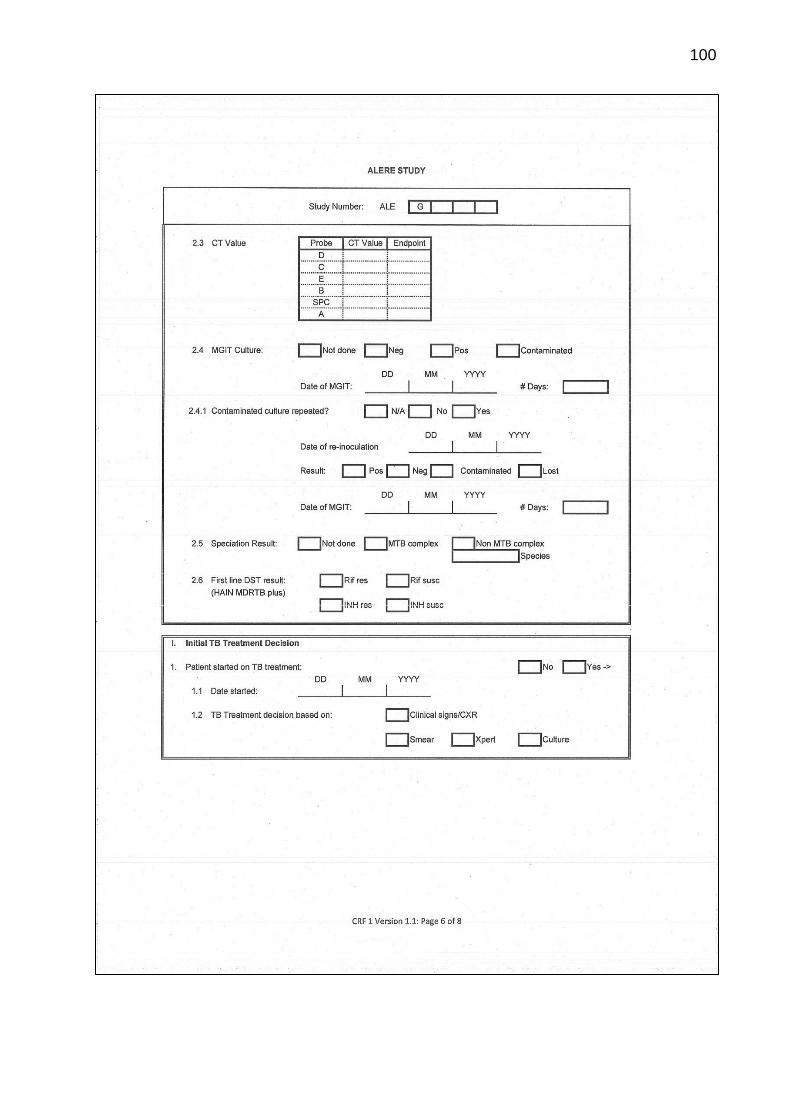
100
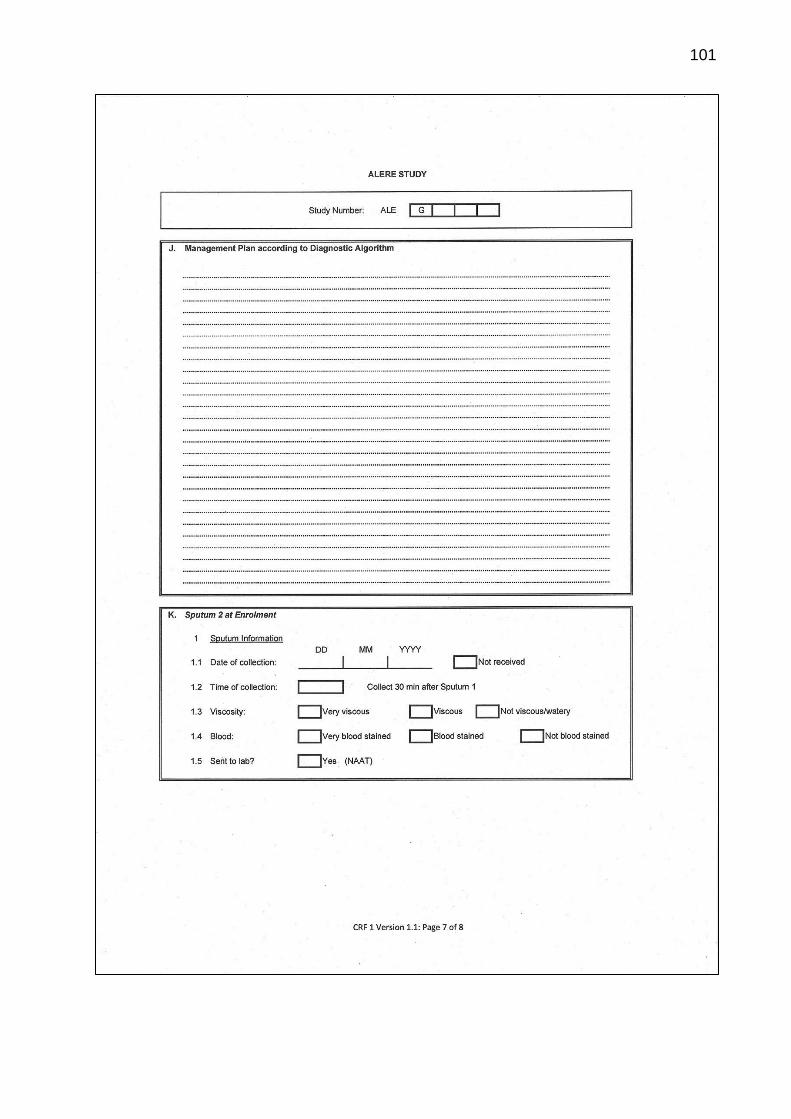
101
102
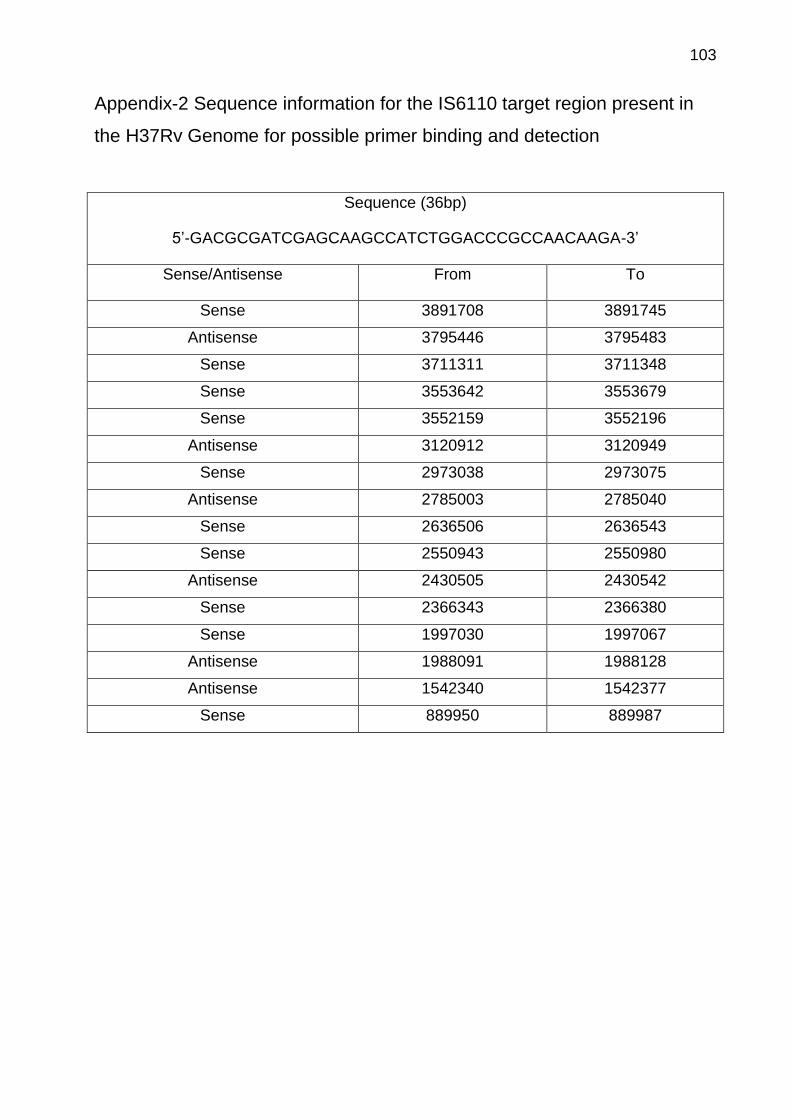
103
Appendix-2 Sequence information for the IS6110 target region present in
the H37Rv Genome for possible primer binding and detection
Sequence (36bp)
5’-GACGCGATCGAGCAAGCCATCTGGACCCGCCAACAAGA-3’
Sense/Antisense From To
Sense 3891708 3891745
Antisense 3795446 3795483
Sense 3711311 3711348
Sense 3553642 3553679
Sense 3552159 3552196
Antisense 3120912 3120949
Sense 2973038 2973075
Antisense 2785003 2785040
Sense 2636506 2636543
Sense 2550943 2550980
Antisense 2430505 2430542
Sense 2366343 2366380
Sense 1997030 1997067
Antisense 1988091 1988128
Antisense 1542340 1542377
Sense 889950 889987

104
List of Publication(s)
Following Paper is submitted to the Journal of molecular diagnostics on 27.04.2017.
Patel K, Geldmacher C, Wesolowski M, Rivera-Milla E, Nagel M, Dheda K, Hoelscher M,
Labugger I et al. Evaluation of a Urine-Based Rapid Molecular Diagnostic Test with Po-
tential to be Used at Point of Care for Pulmonary Tuberculosis: Cape Town Cohort.
105
Statement on Pre-release and Contribution
The PhD thesis
“Development and Evaluation of Urine based Rapid Molecular Diagnostic Test for
Pulmonary Tuberculosis with Potential for Point of Care: Cape Town Cohort.”
has not been submitted for publication or previously published.
I, Krutarth Patel have made substantial contributions to the study, starting from design
of the work, experiments, data collection, analysis and its interpretation.
I have drafted the work and revised it critically for important intellectual properties, and I
agree to be accountable for all aspects of the work.

106
Acknowledgments
I would like to express deep sense of gratitude to PhD mentor Dr. rer. nat. Christof
Geldmacher, PD and local supervisor Dr. Ines Labugger for their invaluable and
constant encouragement throughout the PhD program and preparation of the thesis. I
would also like to express my deep sense of gratitude to my family member especially
my wife Anna who motivate me and supported me for whole PhD duration. It is my sin-
cere duty to express thanks to my colleagues – Matilda Nagel, friends, and other family
members who have shown deep interest and provided timely co-operation throughout
the study duration.
Finally, I would like to appreciate the supports received from the Federal Ministry for
Economic Cooperation and Development (BMZ); German Academic Exchange Service
(DAAD); Excellence Centers for Exchange and Development (EXCEED) and Center for
International Health at Ludwig-Maximilians-Universität, Munich, Germany.
107
Affidavit
Krutarth Patel
Name
Street
Zip code, town
Country
I hereby declare, that the submitted thesis entitled
Development and Evaluation of Urine based Rapid Molecular Diagnostic Test for
Pulmonary Tuberculosis with Potential for Point of Care: Cape Town Cohort
is the result of my own work. I have only used the sources indicated and have not made
unauthorised use of services of a third party. Where the work of others has been quoted
or reproduced, the source is always given.
The submitted thesis or parts thereof have not been presented as part of an examina-
tion degree to any other university.
I further declare that the electronic version of the submitted thesis is congruent with the
printed version both in content and format.
Place, Date Signature of PhD Candidate