development and experimental study of machining parameters
TRANSCRIPT

Development and Experimental Study of
Machining Parameters in
Ultrasonic Vibration-assisted Turning
BIKASH CHANDRA BEHERA
Department of Mechanical Engineering
National Institute of Technology, Rourkela-769008, India
2011
Development and Experimental Study of
Machining Parameters in
Ultrasonic Vibration-assisted Turning
Thesis submitted in partial fulfillment of
the requirements for the degree of
Master of Technology (Research)
In
Mechanical engineering
By
Bikash Chandra Behera
Roll No: 609ME602
Under the guidance of
Prof S. K. Sahoo
Prof K.P. Maity
Department of Mechanical Engineering
National Institute of Technology, Rourkela-769008, India
2011

Department of Mechanical Engineering
National Institute of Technology, Rourkela
Rourkela 769008, Orissa, India
This is to certify that the thesis entitled,
Machining Parameters in Ultrasonic Vibration
Bikash Chandra Behera in partial fulfillment o
Master of Technology (Research) in
Technology, Rourkela is an authentic work carried out by him under
supervision. To the best of our
submitted to any other University or Institute for the award of any Degree or Diploma.
Prof S.K. Sahoo Prof K.P. Maity
Department of Mechanical Engineering
NIT Rourkela NIT Rourkela
Department of Mechanical Engineering
National Institute of Technology, Rourkela
Rourkela 769008, Orissa, India
CERTIFICATE
This is to certify that the thesis entitled, “Development and Experimental Study of
Ultrasonic Vibration-assisted Turning” submitted by
in partial fulfillment of requirements for the award of Degree of
Master of Technology (Research) in Mechanical Engineering at National Institute of
Technology, Rourkela is an authentic work carried out by him under our guidance and
our knowledge the matter embodied in the thesis has not been
submitted to any other University or Institute for the award of any Degree or Diploma.
Prof S.K. Sahoo Prof K.P. Maity
gineering Department of Mechanical Engineering
NIT Rourkela NIT Rourkela
iii
xperimental Study of
submitted by Mr.
f requirements for the award of Degree of
at National Institute of
our guidance and
atter embodied in the thesis has not been
submitted to any other University or Institute for the award of any Degree or Diploma.
Prof S.K. Sahoo Prof K.P. Maity
Department of Mechanical Engineering
NIT Rourkela NIT Rourkela

iv
ACKNOWLEDGEMENT
I take this opportunity to express my reverence to my supervisor Prof. S.K. Sahoo and Co-
supervisor Prof. K.P. Maity for their guidance, inspiration and innovative technical discussions
during the course of this work. Their perpetual energy and enthusiasm in research had
motivated others, including me. In addition, they were always accessible and willing to help
their students with their research. As a result, research life became smooth and rewarding for
me.
Prof.C.K.Biswas, Prof K.C. Biswal, Prof S.C.Mishra and Prof. R.K.Sahoo deserves special
thanks as my thesis committee members and Chairman for their critical suggestions.
I also express my sincere gratitude to all faculty and staffs members of Mechanical Engineering
Department and Central workshop for providing valuable departmental facilities.
I would like to express my thanks to Mr. L.N.Patra, Mr. B. N. Sahoo, Mr M.P. Rout and Mr.
K.K. Kanaujia for helping me for conducting experimental works.
I would like to thank all my friends and especially my classmates for all the thoughtful and
mind stimulating discussions we had, which prompted us to think beyond the obvious.
Last but not least I would like to thank my parents, who taught me the value of hard work by
their own example. They rendered me enormous support being apart during the whole tenure of
my stay in NIT Rourkela.
Bikash Chandra Behera
Roll No: 609ME602
v
ABSTRACT
In recent years applications of hard materials in different industries, like aerospace,
defence and petrochemicals sectors etc. have been increased remarkably. The machining of
these hard materials is very difficult in conventional turning process. Ultrasonic assisted turning
is a suitable and advanced process for machining hard and brittle material because of its
intermittent cutting mechanism. In the present work, an ultrasonic vibratory tool (UVT) is
designed and analyzed using ANSYS® environment for calculation of its natural frequency and
working amplitude of vibration. An ultrasonic assisted turning system is designed considering
cutting tool as a cantilever beam. Experimental study has been carried out to find the difference
between ultrasonic-assisted and conventional turning at different cutting conditions taking
carbon steel (a general purpose engineering material) as the work piece material. It is found that
ultrasonic assisted turning reduces the surface roughness and cutting force in comparison with
conventional turning. It is well known that cutting force and surface finish/roughness are two
major parameters which affect the productivity of the turning process. In the present work, Grey
based Taguchi method is used to optimize both cutting force and surface roughness to find the
best possible machining parameters under the used experimental working conditions. Also,
second order response models for the surface roughness and cutting force are developed and
confirmation experiments are conducted.
Key words: UAT, UVT, Longitudinal vibration, Modal analysis, Harmonic analysis,
Triangular rule, GRA, RSM
vi
ABBREVIATIONS
ANOVA Analysis of variance
ANSYS Analysis of system
CNC Computer numerical control
CT Conventional turning
1D One-dimensional
2D Two-dimensional
3D Three dimensional
DAQ Data acquisitions
DF Degree of freedom
DOE Design of experiment
FEM Finite element modeling
FRF Frequency response function
GRA Grey relation analysis
GRG Grey relation grade
Hz Hertz
MB Mega byte
MMC Metal matrix composite
MS Mean square
NC Numerical control
NI National instrument
PC Personal computer
PZT Piezoelectric transducer
RAM Random access memory
RSM Response surface methodology
SEM Scanning electron microscope
SS Sum of square
TWCR Tool work-piece contact ratio
UAC Ultrasonic assisted cutting
UAT Ultrasonic assisted turning
UVT Ultrasonic vibratory tool

vii
NOMENCLATURE
A Area of cross section
a Amplitude
ac Acceleration
C Velocity of sound
cos Cosine
D Diameter
d Depth of cut
E Young’s modulus
Fm Forces of momentum
Fx Cutting force in X-axis direction
Fy Cutting force in Y-axis direction
Fz Cutting force in Z-axis direction
f Frequency
h Height
i Complex number
K Stress concentration
L Length
M Mass
Mz Moment in Z-axis direction
N Spindle speed
Ra Surface roughness
r Radius
S Feed
sin Sine
s Stress
sm Maximum stress
t Time
V Cutting velocity
Vc Velocity of chip
Vt Velocity of tip
v Velocity
W Weight
xn Nodal plane
λ Wave length
γ Poison’s ratio
γi Grey relational grade
ξ Displacement
ξM Maximum displacement
∆ Triangle
ρ Density
ω Angular velocity

viii
LIST OF FIGURES
Page No.
CHAPTER 1
Figure 1.1 Principal vibration directions during ultrasonically assisted turning [10]................... 2
CHAPTER 2
Figure 2.1 Pulse cutting state in the UVC method [22] .............................................................. 8
Figure 2.2 Ultrasonic assisted cutting system design by Frauhofer Institute [18, 41] ................ 10
Figure 2.3 Practical ultrasonic vibration cutting tool system designed by Nippon Institute of
Technology, Japan [11] ........................................................................................................... 10
Figure 2.4 An auto resonant ultrasonic turning system designed by Wolfson School of
Mechanical and Manufacturing Engg, Loughborough University, UK [10] ............................. 11
Figure 2.5 The vibration device designed by School of Mechanical and Production Engineering
Nanyang Technology University, Singapore [20] .................................................................... 12
Figure 2.6 One dimensional vibration assisted cutting [1] ........................................................ 13
Figure 2.7 One dimensional vibration assisted machining [37]………………………………...13
CHAPTER 3
Figure 3.1 Different types of vibratory tool…………………………………………………….15
Figure 3.2 Forces on an increment normal to the direction of propagation of a longitudinal plane
wave in a uniform slender bar ................................................................................................. 16
Figure 3.3 Propagation of longitudinal wave in a tapered horn ................................................ 18
Figure 3.4 Steeped cylindrical half wave vibratory tool ........................................................... 19
Figure 3.5 Double cylinder with square shoulder and fillet ...................................................... 20
Figure 3.6 Solid 92 elements reproduce from ANSYS® 12.0 user guides [46] ......................... 22
Figure 3.7 Geometry generation of UVT ................................................................................. 23
Figure 3.8 Displacement load applied at big end...................................................................... 23
Figure 3.9 Modal analysis of UVT (mode 1) ........................................................................... 24
Figure 3.10 Modal analysis of UVT (mode 2) ......................................................................... 25
Figure 3.11 Modal analysis of UVT (mode 3) ......................................................................... 25
Figure 3.12 Frequency response function of UVT ................................................................... 26
Figure 3.13 Harmonic response analysis of UVT ..................................................................... 26
CHAPTER 4
Figure 4.1 Cutting tool during ultrasonic vibration (treated as a cantilever ) ............................ 28
Figure 4.2 3D views of experimental set up (the cutting tool treated as cantilever ) ................. 29

ix
Figure 4.3 Schematic diagram of ultrasonic assisted turning system ........................................ 29
Figure 4.4 Experimental setup ................................................................................................. 30
Figure 4.5 Lathe by which all experiments are performed (HMT Model NH 26) ..................... 31
Figure 4.6 Work piece after machining operation .................................................................... 33
Figure 4.7 Relative surface roughness(Ra) verses cutting speed(V) (a) depth of cut, d =0.1 (b)
d=0.15 (c) d=0.2...................................................................................................................... 36
Figure 4.8 Relative surface roughness (Ra) verses feed (f) (a) depth of cut,d =0.1 (b) d =0.15 (c)
d =0.2 ...................................................................................................................................... 38
Figure 4.9 Relative surface roughness (Ra) verses depth of cut (d) (a) speed, V =14.32296 (b) V
=18.59472 (c) V =24.12288 .................................................................................................... 40
Figure 4.10 Principal cutting force (Fz) verses speed (V) (a) depth of cut, d =0.1 (b) d=0.15 (c)
d=0.2 ....................................................................................................................................... 42
Figure 4.11 Principal cutting force (Fz) verses feed(S) (a) depth of cut, d =0.1 (b) d=0.15 (c)
d=0.2 ....................................................................................................................................... 44
Figure 4.12 Principal cutting force (Fz) verses depth of cut (d) (a) speed, V = 24.12288 (b) V
=18.59472 (c) V =14.32296 .................................................................................................... 46
CHAPTER 5
Figure 5.1 Main effect plots for Ra .......................................................................................... 54
Figure 5.2 Main effects for Fz .................................................................................................. 55
Figure 5.3 Grey relation grade ................................................................................................. 56
Figure 5.4 Effect of UAT parameter level on the multi performance........................................ 57

x
LIST OF TABLE
Page No.
CHAPTER 3
Table 3.1 Concentration value (K) for various fillet radii ......................................................... 20
Table 3.2 Dynamic analysis of UVT ....................................................................................... 26
CHAPTER 4
Table 4.1 Composition of specimen (carbon steel) .................................................................. 31
Table 4.2 Specifications ultrasonic system .............................................................................. 31
Table 4.3 Specification of cutting tool ..................................................................................... 31
Table 4.4 Specifications of Kistler model 9272 dynamometer ................................................. 32
Table 4.5 Specification of UVT ............................................................................................... 32
Table 4.6 Specifications of data acquisitions (DAQ) ............................................................... 32
Table 4.7 Specifications of control unit ................................................................................... 33
Table 4.8 cutting condition used in experiment ........................................................................ 34
CHAPTER 5
Table 5.1 Experimental factor and their levels ......................................................................... 50
Table 5.2 Response surface design (UAT) ............................................................................... 51
Table 5.3 ANOVA for Ra (RSM model) .................................................................................. 53
Table 5.4 ANOVA for Fz (RSM model) .................................................................................. 53
Table 5.5 Experimental result of Taguchi L9 orthogonal array ................................................. 53
Table 5.6 ANOVA for Ra (Taguchi) ........................................................................................ 54
Table 5.7 ANOVA for Fz (Taguchi) ........................................................................................ 55
Table 5.8 Grey relation analysis table ...................................................................................... 56
Table 5.9 Response table for GRG .......................................................................................... 57
Table 5.10 ANOVA for grey relation grade ............................................................................. 57
Table 5.11 Results of confirmatory experiment ....................................................................... 58

CONTENTS
CERTIFICATE iii
ACKNOWLEDGEMENT iv
ABSTRACT v
ABBREVIATIONS vi
NOMENCLATURE vii
LIST OF FIGURES viii
LIST OF TABLE x
CHAPTER 1
INTRODUCTION 1
1.1 Outline of Ultrasonic Assisted Turning 1
1.2 The Current Needs in Industry 3
1.3 Aim and Objectives of the Research 3
1.3.1 Aim of the research 3
1.3.2 Objectives of the present research 3
CHAPTER 2
LITERATURE SURVEY 5
2.1 Introduction 5
2.2 Review of Ultrasonic Assisted Cutting 6
2.2.1 Experimental study on ultrasonic assisted turning 6
2.2.2 Finite element study on ultrasonic assisted turning. 9
2.2.3 Review on experimental set-up 10
2.3 Some Other Vibration Assisted Cutting 12
2.4 Cutting Mechanism of One Dimensional Ultrasonic Assisted Cutting 13
2.5 Summary 14
CHAPTER 3
DESIGN AND FINITE ELEMENT MODELING OF UVT 15
3.1 Ultrasonic Vibratory Tool 15
3.2 Vibratory Tool Equation and its Specific Solution 16
3.2.1 Plane wave equation 16
3.2.2 Plane wave equation of tapered horn 17
3.2.3 Plane wave equation of stepped cylindrical horn or vibratory tool 18
3.2.4 Stress concentration at a step in horn 20

3.2.5 Calculation of nodal plane in stepped cylindrical vibratory tool. 21
3.3 Finite Element Modeling of Ultrasonic Vibratory Tool 21
3.3.1 The finite element 21
3.3.2 Finite element modeling 21
3.3.2.1 Geometrical modeling 21
3.3.2.2 Material properties 22
3.3.2.3 Element type selection 22
3.3.2.4 Mesh generation 22
3.3.2.5 Boundary condition 23
3.4 Results and Analysis 23
3.4.1. Modal analysis 23
3.4.2 Harmonic analyses 24
3.4.3 Finite element analysis of ultrasonic vibratory tool 24
3.5 Conclusions 27
CHAPTER 4
EXPERIMENT 28
4.1 Calculation of Tool Tip Amplitude 28
4.2 Experimental Setup and Procedures 29
4.2.1 Description of experimental set-up 32
4.2.2 Work piece preparation and processing 33
4.2.3 Measurement of cutting force 33
4.2.4 Measurement of surface roughness 34
4.3 Experimental Condition 34
4.3.1 Composition of the material 34
4.3.2 Specification of the insert grades 34
4.3.3 Cutting condition 34
4.4 Results and Discussion 34
4.4.1 Effect of cutting speed on surface finish 34
4.4.2 Effect of feed on surface finish 37
4.4.3 Effect of depth of cut on surface finish 39
4.4.4 Effect of cutting speed on cutting force 41
4.4.5 Effect of feed on cutting force 43
4.4.6 Effect of depth of cut on cutting force 44

4.5 Conclusions 46
CHAPTER 5
OPTIMIZATION OF UAT PARAMETERS 48
5.1 Design of Experiment 48
5.1.1 Full factorial design 48
5.1.2 ANOVA 48
5.1.3 Response surface methodology (RSM) 48
5.1.4 Taguchi method 49
5.1.5 Calculation of Grey relational grade 49
5.2 Results and Discussion 50
5.2.1 Development of model based on RSM 50
5.2.1.1 Model of surface roughness 51
5.2.1.2 Model of principal cutting force 52
5.2.1.3 Adequacy test for surface roughness and principal cutting force 52
5.2.3 Parametric optimization 53
5.2.3.1 Influence on surface roughness 53
5.2.3.2 Influence on principal cutting force 54
5.2.3.3 Optimization by Grey relation analysis 55
5.4 Conclusions 58
CHAPTER 6
CONCLUSIONS AND FUTURE RECOMMENDATIONS 59
6.1 Conclusions 59
6.2 Future Recommendations 60
REFERENCES 61
APPENDIX A 65
A.1 SUM OF SQUARES (SS) 65
A.2 DEGREE OF FREEDOM (DF) 65
A.3 MEAN SQUARE (MS) 65
A.4 F-VALUE 66
A.5 P-VALUE 66
A.6 MODEL ADEQUACY CHECK 66
BIODATA 68

Introduction
INTRODUCTION
1 NATIONAL INSTITUTE OF TECHNOLOGY, ROURKELA
CHAPTER 1
INTRODUCTION
1.1 Outline of Ultrasonic Assisted Turning
Ultrasonic provides a group of facilities in our life, such as in manufacturing, medical,
communications, transport, industries, etc. In the machining process, ultrasonic can bring
about improvements when applied in the correct manner. Ultrasonic assisted turning is a
cutting technique in which a certain frequency (in ultrasonic range) of vibration is applied to
the cutting tool or the work-piece (besides the original relative motion between these two) to
achieve better cutting performance (Shamoto et al. [1]). A number of experimental setup has
been proposed to make the process simpler, but the tendency is to apply the process to a wide
range of materials and to study the effect of machining parameters. Many researchers have
reported significant improvements in noise reduction, tool wear reduction, surface finish, etc.
by applying ultrasonic vibration during machining operations in general, the turning
processes in particular [2,3], This pointed out possible advantages of the ultrasonic
technology for industrial machining. The present research is particularly focused on
ultrasonic vibration-assisted turning.
In ultrasonic assisted machining, vibration amplitude (normally sine wave) lead to an
alternating gap during cutting and was identified as an important mechanism in vibration
cutting. Increasing the vibration amplitude means an enlargement in the gap that allows more
cutting fluid to extract the heat during the cutting process, thus enhancing the tool’s life,
improved work-piece finish, reduction in cutting forces and decreasing the chance of build-
up-edge formation [4-6]. In turning process there are three independent principal directions in
which ultrasonic vibration can be applied (Figure 1.1).Significant advantages were obtained
when the usual continuous interaction between the cutting tip and the work-piece was
replaced by intermittent cutting [7-8]. However, when the cutting tip is vibrated ultrasonically
the following restrictions are imposed:
Tangential direction: Vc=πND < Vt=2πaf
Where Vc is the cutting speed during turning operation, N is the rotational speed of work-
piece, Vt is the tip velocity, f is the frequency of vibration and a is the amplitude of vibration.
A rheological model of ultrasonic vibration cutting projected by Astashev [7] and ensuing

INTRODUCTION
2 NATIONAL INSTITUTE OF TECHNOLOGY, ROURKELA
experiments confirmed a evident reduction in the cutting force for ultrasonic cutting with
vibration in tangential direction (f =20kHz, a=10µm). It was also reported that cutting force
reduction was less at higher cutting speeds and, with a cutting speeds exceeding a certain
level (Vt > ωa, where ω is the angular frequency), vibration did not affect the cutting force.
The resistance forces were considered to be caused by plastic deformation of the layer being
cut off by frictional forces acting on the working faces of the cutting tool. These experimental
results have been explained theoretically by Astashev and Babitsky [9] within the frame work
of rheological models. Reduction in the cutting force caused by superimposition of ultrasonic
vibration was derived for the elasto-plastic material model. It was concluded that the
vibrating process transforms and reduces the friction force due to the effect of dynamic
fluidization of dry friction. Dynamic characteristics of transformed machining processes were
obtained, including the dependence of reduced cutting forces on the material and vibrations
parameters. Dynamics of an ultrasonic cutting machine under technological load was
investigated and the nonlinear amplitude response of vibrating tool in the process of cutting
was obtained by many researchers. The auto resonant control system keeping the resonant
conditions of excitation under variable technological loads was constructed by Astashev and
Babitsky [9].
Figure1.1 Principal vibration directions during ultrasonically assisted turning [10]
Babitsky et al [10] designed an auto resonant ultrasonic assisted turning system, maintaining
the constant level of vibration provided by the transducer and therefore improving the
precision of ultrasonic machining. Vibration in the feed directions was also studied. It was
Work piece
Tangential direction
Radial direction
Feed direction Tool
X
Z
Y
INTRODUCTION
3 NATIONAL INSTITUTE OF TECHNOLOGY, ROURKELA
pointed out that application of ultrasonic vibration along the feed direction enables
overcoming the restriction on the level of rotational speeds, which is of great importance for
industrial UAT requiring high levels of productivity.
Mashiko and Murakawa [11] developed practical ultrasonic vibration cutting tool system and
their investigation on tool wear and surface finish in ultrasonic and conventional turning and
they found that chipping of the cutting edge can be effectively prevented and good surface
finish obtained in ultrasonic assisted turning. Some other researcher [12-18] also investigated
on vibration assisted turning and they found that ultrasonic assisted turning improves surface
finish and reduces average cutting forces as compared to conventional turning in case of hard
and brittle material.
1.2 The Current Needs in Industry
Generally the machining surface quality is usually measured by the surface roughness and
physical mechanical properties of the surface layer. The surface quality has a great impact on
wear resistance, fatigue strength of the product and fit precision of the part. Hard and brittle
material has excellent mechanical properties at low and intermediate temperature. It plays an
important part in recent years in aerospace, nuclear and petroleum industries. Hard materials
are very difficult to machine because of a tendency of the maximum temperature of tool face
existing at the tip of tool. Micro welding at the tool tip and chip interface takes place so as to
lead to the built up edge formation which effect the surface quality of material. In ultrasonic
assisted turning these effects are reduced due its vibro-impact cutting.
1.3 Aim and Objectives of the Research
1.3.1 Aim of the research
The present research aims to get a technical understanding of the ultrasonic assisted turning
process against the principal cutting force and surface roughness generation. The research
includes the design and FEM analysis of ultrasonic vibratory tool, design and development of
an ultrasonic assisted vibration turning system, taking cutting tool as a cantilever beam.
Turning carbon steel work-piece material (a general purpose engineering material) using both
conventional and ultrasonic assisted turning and analyzing the results. Mathematical relations
between responses and factors of ultrasonic assisted turning (UAT) are developed and the
ultrasonic turning process parameters are optimized.
1.3.2 Objectives of the present research
• FEM analysis of ultrasonic vibratory tool (UVT).
• Design and manufacture of the experimental set-up.

INTRODUCTION
4 NATIONAL INSTITUTE OF TECHNOLOGY, ROURKELA
• Experimental investigations using both conventional and ultrasonic assisted
turning processes taking a general purpose engineering material (carbon steel) as
work-piece.
• Comparison of both conventional and ultrasonic assisted turning based on
experimental data.
• Mathematical modeling of process parameters using response surface
methodology (RSM).
• Optimization of the process parameters using grey based Taguchi method.

Literature Survey

LITERATURE SURVEY
5 NATIONAL INSTITUTE OF TECHNOLOGY, ROURKELA
CHAPTER 2
LITERATURE SURVEY
2.1 Introduction
Ultrasonic vibration has been harnessed with considerable benefits for a variety of
manufacturing processes, for example, ultrasonic cleaning, ultrasonic grinding, ultrasonic
welding and ultrasonic turning etc. The ultrasonic vibration method in which periodic or
oscillating cycles are forced on the cutting tool or the work-piece, besides the original relative
motion between these two, so as to get improvements in cutting performance. The
fundamental feature of Ultrasonic Assisted Turning (UAT) is that the tool face is separated
from the work-piece repeatedly (velocity of the tool is more than cutting velocity during half
of an oscillating cycle). First attempt to employ the ultrasonic power is attempted by Russian
[2, 12] as well as Japanese [3, 13] researchers.
Kumabe [3] in his monograph summarized some of research results up to the time of his
publication and also presented the outcomes of his own experiments on the application of
ultrasonic vibrations for various conventional material removal processes. Markov [2, 14] in
his book “ultrasonic machining of intractable materials” described the use of ultrasonic
vibration in turning of heat resistance alloys. He applied vibration in his experiments in the
radial and tangential direction with the help of a magnetostrictive transducer. He emphasized
that rigidity of the system comprising a machine tool, fitting, cutting tool and work-piece is
important. If rigidity of this system is not enough, the tool life is shortened and the overall
advantage of UAT may be small. He also suggested that the influence of ultrasonic vibration
on the turning process could be explained by the thermal effects, which cause softening and
micro-melting of the deformed material in the contact points with the cutting tip and affect
the nature of frictional processes at the tool chip interface considerably.
Shampto [1], Moriwaki et al.[8] explored ultra precision diamond turning of glass and
SU303Se-JIS stainless steel by applying ultrasonic vibration (f=40kHZ, a=3µm) to a single
crystal diamond tool in the direction of cutting velocity. They argued that an increase in
vibration frequency reduced generation of vibration marks at the finished surface. These
experiments were carried out on an ultra precision turning machine and a mirror like finish of
the stainless steel with a surface roughness of 0.026µm was obtained. An increased tool life
was reported due to a reduction in both crater and flank wear.

LITERATURE SURVEY
6 NATIONAL INSTITUTE OF TECHNOLOGY, ROURKELA
Other notable works include that of Kim and Lee [15], experiments on the cutting of carbon
fiber reinforced plastics, Weber et al. [16], find effect of cutting speed on surface roughness
in UAT, Kim and Choi [17], use of UAT on brittle optical plastic, Locke and Rubenism [18],
use of synthetic singe crystal diamond tools in UAT for manufacture of ultra precision parts
and many more. The foremost part of the present study is to construct a vibration assisted
turning system, by which various investigations can be carried out to analyze the process,
which is the critical and essential component of this research.
2.2 Review of Ultrasonic Assisted Cutting
Ultrasonic assisted cutting technique is becoming very challenging in many recent
engineering developments, especially in relation to surface finish and tool wear and material
removal rate. The very basic component of ultrasonic assisted cutting system is piezoelectric
transducer and ultrasonic vibratory tool. For different applications different designs have
been developed, such as, ultrasonic assisted turning, welding, milling, drilling, grinding.
Ultrasonic assisted machining technology has been studied by many cited references. All of
these studies analyze in different ways, concept, design and dynamics of setup, characteristics
and finite element modeling and comparison of cutting forces during machining processes.
2.2.1 Experimental study on ultrasonic assisted turning
Skelton [19] studied using ultrasonic vibration in turning operation, using a magnetostrictive
transducer. He applied vibration in vertical and horizontal directions on carbide tip cutting
tool, found that cutting force components are less than with a static tool, particularly at low cutting
speeds and also justified it due to a reduction in the mechanical strength of the workpiece material in
the presence of ultrasonic vibration.
Masahiko and Murakawa [11] developed an ultrasonic vibration cutting tool device which is
more rigid and stable than which was used previously [7] by them. They observed that the
chipping of the cutting edge is reduced and a good surface finish obtained by both continuous and
intermittent cutting modes when cutting hardened steels.
Babitsky et al. [10] developed an auto resonant ultrasonic vibration turning system for turning
of some modern aviation material. They applied ultrasonic vibration in the feed direction and
compared conventional and ultrasonic turning. They found that the application of ultrasonic
vibration can improve the surface quality considerably, up to 25–50%.
Zhong and Lin [20, 21] developed an ultrasonic vibration device to investigate diamond
turning of an aluminum-based metal matrix composite (MMC) reinforced with SiC particles.
In their experiments ultrasonic vibration is applied to the cutting tool, small-size vibration

LITERATURE SURVEY
7 NATIONAL INSTITUTE OF TECHNOLOGY, ROURKELA
device (without using booster) was designed to mount a piezoelectric transducer and cutting
is done by vertical CNC milling machine. They found that surface roughness of the MMC
samples cut with ultrasonic vibrations is better than that of the MMC sample cut
conventionally; and also cutting parameters, like, depth of cut and cutting speed also affect
the surface finish significantly and they adopted theory of light depression phenomenon for
measurement.
Liu et al. [22] have performed experimental study on distinctiveness of ultrasonic vibration-
assisted cutting of tungsten carbide material using a CNC lathe with CBN tool inserts. In their
experiments they found that the radial force is much larger than the tangential and axial force
as their vibration was is in cutting depth direction. The SEM observations on the machined
work-piece surfaces and chip formation indicated that the critical condition for ductile mode
cutting of tungsten carbide was mainly the maximum undeformed chip thickness when the
tool cutting edge radius was fixed, that is, the ductile mode cutting can be achieved when the
maximum undeformed chip thickness was smaller than a critical value. Corresponding to the
chip formation mode (ductile or brittle), three types of the machined work-piece surfaces
were obtained: fracture-free surface, semi-fractured surface and fractured surface. It was also
found that the cutting speed has no significant effect on the ductile chip formation mode.
Chen et al. [23] performed experimental study on turning W-Fe-Ni alloy by conventional
turning and ultrasonically assisted turning. They found that in ultrasonic assisted turning,
feed rate still has significant influence on surface roughness, next to important factors are
vibration parameters, while the influence of depth of cut and cutting speed on surface
roughness become less profound than others parameters. Comparing with CT, the surface
roughness machined by UAT reduced by the range of 7.05%-30.06%. They observed that
UAT can give smoother surface, but the residual stress is larger than that in CT. It confirms
that the rake surface of the vibration cutter has an intense ironing effect on the work piece
surface.
Hsu et al. [24] study on the machining characteristics of Inconel 718 by combining ultrasonic
vibration with high-temperature-aided cutting. Experiment is done using Taguchi
experimental design to clarify the influence of various machining parameters on the
machining characteristics. They found that the percentage contributions of the cutting tool,
feed rate, working temperature and depth of cut for surface roughness are 33.16, 25.00, 13.36
and 9.17, respectively and the percentage contributions of the cutting speed, feed rate, cutting
tool and depth of cut for cutting force are 22.27, 16.88, 13.80 and 13.37, respectively and also

LITERATURE SURVEY
8 NATIONAL INSTITUTE OF TECHNOLOGY, ROURKELA
found that Ultrasonic-aided cutting improved the surface roughness by 9.10–51.61%, as well
as decreasing cutting force by 32.34–24.47%. As a result, ultrasonic-aided cutting can
enhance the cutting quality of Inconel 718.
Nath et al. [25] studied the mechanism of UVC and proposed that it is influenced by three
important parameters, namely, vibration frequency, vibration amplitude and working cutting
speed that determine the cutting force. On their theoretical study they established that tool
work piece contact ratio (TWCR) (Figure 2.1) plays a key role in the UVC process where
increase in both the tool vibration parameters (frequency and amplitude of cutting tool) and
decrease in cutting speed reduce the TWCR, which in turn reduces both cutting force and tool
wear, and improves surface quality and prolongs tool life. They have successfully
implemented this theory by means of turning Inconel 718 work piece material, both
conventionally and ultrasonically, and found that TWCR plays key role in UVC method.
Figure 2.1 Pulse cutting state in the UVC method (Nath and Rahaman [22])
Jiao et al. [26] experimentally studied both ultrasonic and conventional assisted turning of
quenched steel and found that surface micro-geometrical characteristics in ultrasonic assisted
turning are better than that of conventional turning, especially when adopting lower
machining speed; ultrasonic assisted turning of quenched steel is much easier to realize
turning instead of grinding.
Lacalle et al. [27] experimentally studied both ultrasonic and conventional assisted turning of
mild steel and found that surface roughness and tool temperature decrease and a tool life
increase as compared to conventional turning (CT).

LITERATURE SURVEY
9 NATIONAL INSTITUTE OF TECHNOLOGY, ROURKELA
2.2.2 Finite element study on ultrasonic assisted turning
FEM is the major computational tool for simulation of the tool work-piece interaction in
orthogonal cutting. From literature review of FE models on turning, it is found that major
works are carried out by Childs et al. [28] and Trent and Wright [29] on conventional turning.
A number of three dimensional finite element models for CT are developed and used to study
forces in the tool; temperature, stress and strain distribution in the cutting zone and chip
formation mechanism (Ceretti et al.[30], Anagonye and Stephenson[31], Pantel et al.[32] and
Strenkowski et al.[33]).
Ramesh et al. [34] developed a three dimensional finite element model using isotropic
materials and study the effect of the convective heat transfer. Pantale et al. [32] introduced
another 3D model and that took into account dynamic effects, thermo mechanical coupling,
constitutive damage law and contact with friction and its effect on the cutting forces and
plastic deformation.
Mitrofanov et al. [35] first developed a 2D finite element model to understand the mechanics
of the tool-chip interaction in vibration assisted turning and also analyzed distributions of
stresses and strains in the cutting region, process of heat transfer in the work-piece material
and in the cutting tool as well as to determine cutting forces and also Mitrofanov et al. [36-
37] compared the CT and UAT methods numerically.
Mitrofanov et al. [38] also studied numerically the effect of lubrications in UAT method
using 2D and 3D finite element models. It was demonstrated that the chip formed in
lubricated UAT process was significantly more curled than the one produced in dry cutting.
Ahmed et al. [39] investigated the thermally induced strains and residual stresses in the
surface layer of the work-piece machined with UAT and CT.
Amini et al. [40] studied machining forces and stresses when turning IN738 with a tool
vibrating at ultrasonic frequency and find the effect of process parameters using commercial
package software Ansys® and MSC-Marc® and found improvement with an increase in the
ultrasonic vibration amplitude and cutting speed. They also found that clearance angle has no
significant effect on the magnitude of the machining force, but higher forces are produced
with smaller tool rake angles. Conical–cylindrical aluminum vibratory tool with
concentrically attached tool insert deliver more suitable performance.

LITERATURE SURVEY
10 NATIONAL INSTITUTE OF TECHNOLOGY, ROURKELA
2.2.3 Review on experimental set-up
The development and market demand for vibration cutting tool changed rapidly when more
and more researchers enhanced the piezo-actuator in their machine design on the shop floor.
Klocke et al. [18, 41] developed an ultrasonic assisted turning system using diamond cutting
tool in Frauhofer institute for investigation focused on hard and brittle material (glass and
steel) as shown in Figure 2.2.
Figure 2.2 Ultrasonic assisted cutting system design by Frauhofer Institute [18, 41]
Masahiko and Murakawa [11] designed and developed a bolted type Langavin type
transducer with nominal frequency of 21 kHZ and power of 1 kW to generate ultrasonic
vibration (Figure 2.3). Their investigation is focused on chipping and surface quality of UAT
as compare to CT method.
Figure 2.3 Practical ultrasonic vibration cutting tool system designed by Nippon Institute of
Technology, Japan (Masahiko and Murakawa[11])
Slideway
Diamond tool
Sonotrode and booster Ultrasonic transducer
Work-piece
180mm
Cutting insert

LITERATURE SURVEY
11 NATIONAL INSTITUTE OF TECHNOLOGY, ROURKELA
Babitsky and his co-workers [10], at Wolfson School of Mechanical and Manufacturing
Engineering, Loughborough University, UK, developed an auto resonant ultrasonic turning
system (Figure 2.4) using a commercially ultrasonic piezoelectric transducer for self tuning
the system to keep the resonant mode of oscillations under variable conditions. The vibration
of tip is measured by laser vibro-meter and the signal is processed by phase shifter, limiter
and band pass filter to from an autoresonant control. The total system is controlled by a
control system (PC). He also discussed about clamping method of the system. Clamping
method used securing the inserts to the transducer is very important in order to obtain
maximum amplitude of vibration at the tool tip. He also stated that external weight added to
the system had some impact on the system.
Zhong et al. [20] devised a vibration device (Figure 2.5) for vibration assisted turning at
school of mechanical and production engineering, NTU, Singapore. They used a lead-
zincronate-titanium type piezoelectric transducer. The device not only holds the transducer
firmly but also minimizes degree of freedom. He also discussed about the importance of one
dimensional translation movement because undesired movements affects turning results.
Figure 2.4 An auto resonant ultrasonic turning system designed by Wolfson School of
Mechanical and Manufacturing Engg, Loughborough University, UK, (Babitsky et al.[10])
Workpiece
Chuck
Cross slide
Tool post
Piezoelectric ceramic rings
Concentrator
Phase shifter
Limiter
Filter
Filter
Amplifier Comparator
Sensor
PLC
Vibration Stabilizing System
Ultrasonically vibrated Tool

LITERATURE SURVEY
12 NATIONAL INSTITUTE OF TECHNOLOGY, ROURKELA
Figure 2.5 The vibration device designed by School of Mechanical and Production
Engineering Nanyang Technology University, Singapore (Zhong and Lin [20])
2.3 Some Other Vibration Assisted Cutting
Adachi and Arai [42] developed an electronic servo that vibrates in low frequency up to 1000
Hz. On their experimental study using aluminum work-piece for drilling and they found that
burr size could be reduced considerable with the assistant of vibration cutting. They built
their servo machine on the spindle of the NC milling machine. A benefit of this design is the
simplicity with which it can be modified for different applications. The idea of their work
was to develop a technique applicable to the drilling process for surface-roughness
measurement in the wall paths.
Wu and Fan [43] developed a centre less grinding technique called the ultrasonic elliptic-
vibration shoe centre less grinding. This new method employs an ultrasonic elliptic-vibration
shoe to hold up the work-piece and control the work-piece rotational motion instead of using
a modifiable wheel such as that employed in conventional centre less grinding. The vibration
ellipse is applied into the shoe or bed of the work-piece with frequency of 20 kHz. The shoe
is given an intermittent force in micron scale to push the cylindrical work-piece towards a
spot between the bed and the grinding wheel. They discovered the rotation of the work-piece
was controlled by the friction force between the work-piece and the shoe so that the
Piezoelectric transducer
Cutting inserts
Tool holder

LITERATURE SURVEY
13 NATIONAL INSTITUTE OF TECHNOLOGY, ROURKELA
peripheral speed of the work-piece is the same as the bending vibration speed on the shoe
end-face. On the other hand, the geometry or roundness of the work-piece can be controlled
by tilting the two angles for shoe and for bed-piezo.
2.4 Cutting Mechanism of One Dimensional Ultrasonic Assisted Cutting
The one dimensional ultrasonic cutting, the tool in one plane parallel to the work-piece
surfaces so as inline to the principal cutting force as shown in Figure 2.6. Figure 2.6 shows
the kinematic of one dimensional ultrasonic assisted cutting where the tool drives in a linear
path subjected to the vibration frequency and vibration amplitude. It has been used by
Shamoto [1], Kumbabe [3], Moriwaki [8] and Isaev et al. [12] in their early respective
investigations of ultrasonic assisted machining.
Figure 2.6 One dimensional vibration assisted cutting (Shamato, [1])
The alternating get-in-touch with of tool rake face relative to the work-piece is expressed as:
sinx a t Vt= ω + (2.1)
cosx
a t Vt
∂= ω ω +
∂ (2.2)
Figure 2.7 One dimensional vibration assisted machining [37]
Workpiece
x’(t)
Tool
Workpiece
x’(t)
Tool
Workpiece
x’(t)
Tool
Workpiece
x’(t)
Tool
1 2 3 4
Workpiece
Tool vibratory motion
Chip
Center line
Y
X

LITERATURE SURVEY
14 NATIONAL INSTITUTE OF TECHNOLOGY, ROURKELA
Where x(t) and x
t
∂
∂are the instantaneous position and velocity at time t, a is the amplitude of
the tool vibration, f is the vibration frequency, and angular frequency 2 fω = π . In Figure 2.7
(1&2) the tool velocity is in positive direction and work piece velocity is in negative
direction. At position 1 the tool rake face has just come into contact with the uncut material
and in position 2 the tool has cut the material. In position 3 the velocity of tool and work-
piece is same direction and the velocity of tool is more than the velocity of work-piece that’s
why the tool is withdraw from the work piece and in position 4 the tool and work-piece again
in opposite direction and procedure of cutting is a cyclic process in which tool is contact and
withdraw from the work-piece surface, which gives better surface finish and improvement of
tool life etc in ultrasonic assisted cutting.
Brehl and Dow [44] reviewed the vibration assisted machining in 1D (linear vibratory tool
path) and 2D (circular/elliptical vibratory tool path) and described the periodic separation
between the tool rake face and uncut material. They found that characteristic of vibration
assisted machining is related to observed reductions in machining forces and chip thickness.
The reduced tool forces in turning are related to improvements in surface finish and extended
tool life. They believed that the intermittent cutting characteristic reduces the effect of
thermo-chemical mechanisms during turning and responsible for rapid wear of diamond tools
when machining ferrous materials. This feature of vibration assisted machining increases its
ability to machine brittle materials in the ductile regime at increased depth of cut.
2.5 Summary
This chapter has presented a literature survey with a critical review on one dimensional
ultrasonic assisted turning. Different ultrasonic assisted turning setup, previous experimental
and finite element studies on ultrasonic assisted turning has been discussed. The mechanism
of one dimensional ultrasonic assisted turning is also discussed.
The previous works presented are adapted and improved to produce a novel idea in ultrasonic
assisted turning system development and its applications by using piezo-actuator as a
vibration generator. Experiments have been conducted and obtained data are analyzed
statistically.

Design and Finite Element Modeling of
Ultrasonic Vibratory Tool (UVT)

DESIGN AND FEM OF UVT
15
CHAPTER 3
DESIGN AND FINITE ELEMENT MODELING OF UVT
3.1 Ultrasonic Vibratory Tool
Ultrasonic vibratory tool (UVT) is an element operating in a longitudinal mode used for
efficient transfer of ultrasonic energy from a source element (transducer) to a second horn,
coupler, tool, or load. Equivalently, it is a transmission line, generally (but not always)
providing a change of amplitude of vibration between the input and the output ends of the
horn. The main purpose of the horn is to provide amplitude of vibration at its output end that
is greater than that at the input end. Thus this is the critical link in the UAT.
a) Stepped vibratory tool b) Conical vibratory tool
c) Exponential vibratory tool
Figure 3.1 Different types of vibratory tool
This has got several names like mechanical focusing device, shank, velocity transformer,
concentrator, amplifier etc. The ultrasonic vibratory tools are specially shaped to provide a
reduction in cross section at the driven end. Ultrasonic vibratory are generally made of metals
that have high fatigue strengths and low acoustic losses and they should be easily brazed or
soldered. The metals most often used to construct ultrasonic vibratory tool are monel,
titanium, stainless steel, heat treated steel and aluminium. Ultrasonic vibratory tools can be
manufactured in various shapes and dimensions, the most common shapes being shown in
Figure 3.1.

DESIGN AND FEM OF UVT
16
3.2 Vibratory Tool Equation and its Specific Solution
3.2.1 Plane wave equation
Let us consider the motion of plane wave in a velocity of sound, C, and attenuation of the
waves is assumed to be zero. The waves are free to move in both the positive and negative
directions of X-axis as described by equation (3.1)
1 2( ) ( )f x ct f x ctξ = − + + (3.1)
Figure 3.2 Forces on an increment normal to the direction of propagation of a longitudinal
plane wave in a uniform slender bar
Where f1(x-ct) refers to waves moving in the positive direction of X-axis and f2(x+ct) to
waves moving in the negative direction of X-axis. ξ is the displacement of dx . If f(x-ct) and
f(x+ct) are continuous, equation 3.1 may be differentiated twice with respect to x (keeping t
constant), giving
2
1 22
''( ) ''( )f x ct f x ctx
∂ ξ= − + +
∂ (3.2)
Similarly, differentiating equation 3.1 with respect to t (keeping x constant)
2
1 22 2
1''( ) ''( )f x ct f x ct
C t
∂ ξ= − + +
∂ (3.3)
By comparing equations (3.2) and (3.3),
2 22
2 2C
t X
∂ ξ ∂ ξ=
∂ ∂ (3.4)
The equation 3.1 is the general solution of plane wave equation 3.4. The characteristics of a
true plane wave are that pressure and motions at every position in a plane normal to the
� � ���� x
�� �� ��
Propagation direction
dx

DESIGN AND FEM OF UVT
17
direction of propagation are equal in amplitude and phase. The kind of wave is not defined
by the velocity ‘C’ in equation 3.4. The bar is assumed to be so slender ( D λ≫ ) that the
effects of poison’s ratio can be neglected is a specific example of equation 3.4. Where λ the
wavelength and D is is the diameter of the bar.
Let us consider a uniform, narrow, homogeneous, elastic bar as being composed of series of
incremental elements of density ρ, longitudinal thickness dx, and cross section area A (Figure
3.2). Losses are assumed to be negligible. Balancing the forces of momentum of an element
2
2m cF Ma dxx
∂ ξ= = ρΑ
∂ (3.5)
Where, M=ρAdx, ξ is displacement of the element dx, 2
2cax
∂ ξ=
∂ and t is the time against the
elastic reaction of a neighboring element situated between x and (x+dx), in the same way
using deriving spring equation,
2
2s p r in gF E A d xx
∂ ξ=
∂ (3.6)
xF EAx
∂ξ= −
∂ x
x dx x
dFF dF dx
dx+ =
From Figure 3.2 Fm=Fspring,
So 2 2
2 2dx EA dx
x x
∂ ξ ∂ ξρΑ =
∂ ∂ (3.7)
or 2 2 2
2
2 2 2
Ec
t x x
∂ ξ ∂ ξ ∂ ξ= =
∂ ρ ∂ ∂ (3.8)
Where E
C =ρ
(3.9)
C is the velocity of sound and E is young’s modulus of elasticity in the medium of the bar.
3.2.2 Plane wave equation of tapered horn
Similarly, the wave equation of tapered horn (Figure 3.3) in terms of particle displacement, ξ
is,
2 2
2 2 2
1 10
A
C t A x x x
∂ ξ ∂ ∂ξ ∂ ξ− − =
∂ ∂ ∂ ∂ (3.10)
And in terms of particle velocity, v, and implying harmonic motion,
2
2 2
10
v A v
x A x x C
2∂ ∂ ∂ ω− − =
∂ ∂ ∂ (3.11)

DESIGN AND FEM OF UVT
18
Figure 3.3 Propagation of longitudinal wave in a tapered horn
3.2.3 Plane wave equation of stepped cylindrical horn or vibratory tool
For uniform cross section bar 0A
x
∂=
∂,
the equation of tapered bar(equations 3.10 & 3.11) reduces to the plane wave equation for
which the general solution, in terms of the displacement, ξ, will be
cos sin cos( )x x
A B tc c
ω ω ξ = + ω
(3.12)
or in terms of particle velocity
cos sin sin( )x x
v A B tc c
ω ω = −ω + ω
(3.13)
Fx
AL
L
A0
x
dx
Fx+dx
Fx
Ax
DESIGN AND FEM OF UVT
19
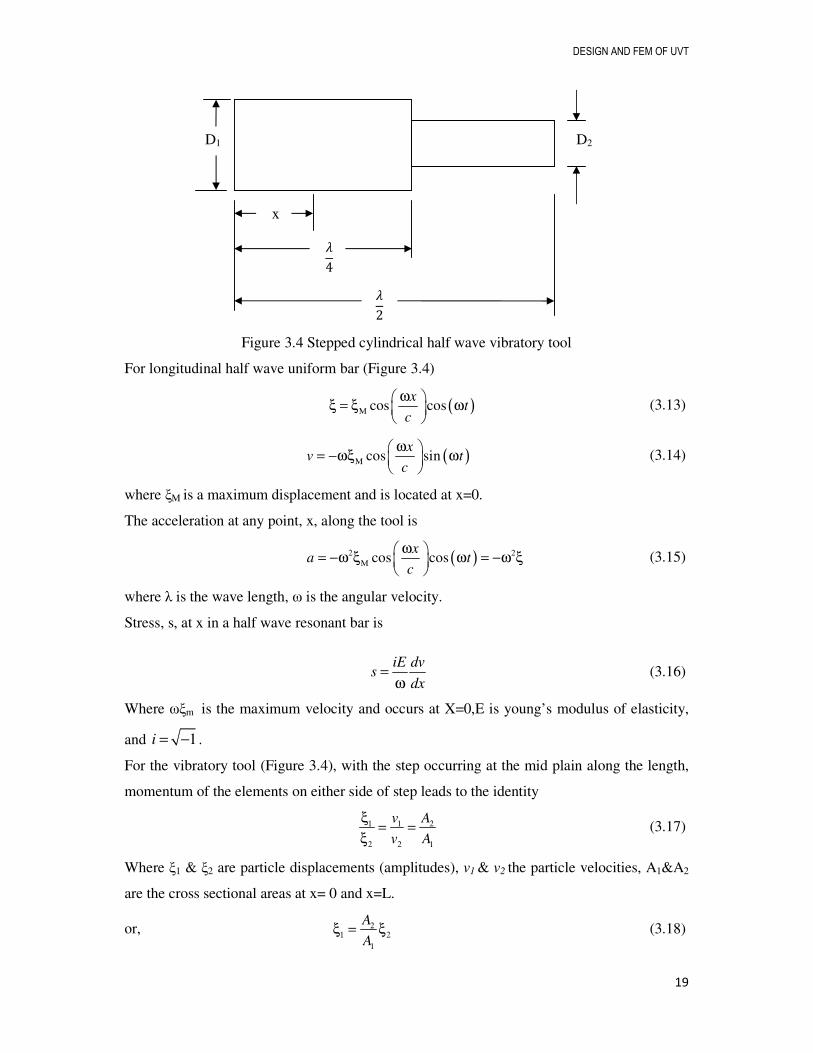
Figure 3.4 Stepped cylindrical half wave vibratory tool
For longitudinal half wave uniform bar (Figure 3.4)
( )cos cos
xt
cΜ
ω ξ = ξ ω
(3.13)
( )cos sinx
v tc
Μ
ω = −ωξ ω
(3.14)
where ξM is a maximum displacement and is located at x=0.
The acceleration at any point, x, along the tool is
( ) 2cos cosx
a tc
2Μ
ω = −ω ξ ω = −ω ξ
(3.15)
where λ is the wave length, ω is the angular velocity.
Stress, s, at x in a half wave resonant bar is
iE dvs
dx=
ω (3.16)
Where ωξm is the maximum velocity and occurs at X=0,E is young’s modulus of elasticity,
and 1i = − .
For the vibratory tool (Figure 3.4), with the step occurring at the mid plain along the length,
momentum of the elements on either side of step leads to the identity
1 2
2 1
v A
v A
1
2
ξ= =
ξ (3.17)
Where ξ1 & ξ2 are particle displacements (amplitudes), v1 & v2 the particle velocities, A1&A2
are the cross sectional areas at x= 0 and x=L.
or, 2
1
A
A1 2ξ = ξ
(3.18)
D1 D2
x
�
4
�
2

DESIGN AND FEM OF UVT
20
ξ1 & ξ2 are the amplitudes at driving and driven end of the vibratory tool.
3.2.4 Stress concentration at a step in horn
When double cylinders are used as a half wave vibratory tool with step at the node (λ/4), the
maximum stress occurs at the step is calculated approximately by using the stress occurs at
the step. The maximum stress is calculated approximately by using the stress in the smaller
diameter sector. The stress at node is
2
1
A
mA
s E EC
11
2
ωξ ω= = ξ
Χξ (3.19)
A horn designed according to Figure 3.4 will fail in fatigue at the junction between the two
elements. This junction is a position of maximum stress, and abrupt change in diameter
increases the stress near the surface of the smaller diameter segment and the nodal face of the
larger diameter. In practice, these horns are designed with a highly polished fillet located
between the larger diameter and the smaller diameter segments to reduce the stress
concentration at the junction. The concentration value, K, (Table 3.1) for various fillet radii
can be determined by using the relationship [45] (Figure 3.5)
2 3
1 2 3 4
2 2 2h h hK K K K K
D D D
= + + +
(3.20)
Figure 3.5 Double cylinders with square shoulder and fillet
Table 3.1 Concentration value (K) for various fillet radii
For 0.25≪ h/r≪ 2.0 For 2.0≪ h/r≪ 20.0
K1 .927+1.149(h/r)0.5-0.086h/r 1.225+0.831(h/r)0.5-0.010h/r
K2 0.011-3.029(h/r)0.5+0.948h/r -1.831-0.318(h/r)0.5-0.049h/r
K3 0.304+3.979(h/r)0.5-1.737h/r 2.236-0.522(h/r)0.5+0.176h/r
K4 0.366-2.098(h/r)0.5+0.875h/r -0.630+0.009(h/r)0.5-0.117h/r
The concentration stress, sc, is
sc=Ksm (3.21)
D
h
r
D

DESIGN AND FEM OF UVT
21
Where sm is the values of stress calculated using equation 3.19.
3.2.5 Calculation of nodal plane in stepped cylindrical vibratory tool.
Locations of nodal planes are necessary to clamping the ultrasonic system. The plane where
particle displacement of vibratory tool is zero is called nodal plane. For rigidity of the
ultrasonic system it is better to clamp at nodal plane. Clamping the ultrasonic system other
than nodal plane fluctuate the amplitude and frequency of the ultrasonic vibratory tool which
affect the ultrasonic assisted tuning (UAT).
Referring equation 3.13
( )cos cos 0
xt
cΜ
ω ξ = ξ ω =
(3.22)
(At nodal plane ξ=0)
It implies, cos 0x
C
ω =
(3.23)
4n
nCx
f= (n=odd number) (3.24)
Where x is nodal plane position, f is frequency and C is velocity of sound.
3.3 Finite Element Modeling of Ultrasonic Vibratory Tool
3.3.1 The finite element
The finite element is the basic unit of analysis in an FE problem. The entire structure under
consideration is a group of finite elements with continuity of displacements and equilibrium
of stresses maintained at the nodes belonging to a individual element. The solution of the
problem becomes one of matrix algebra, which provides efficient numerical calculation.
3.3.2 Finite element modeling
FEA has been used for more than 50 years to various structural, thermal, and acoustic
problems. In this present problem ANSYS software package is used to analyze dynamic
analysis of ultrasonic vibratory tool. Both modal and harmonic analysis of UVT are carried
out to calculate the natural frequency and amplitude of tool.
3.3.2.1 Geometrical modeling
The geometry (Figure 3.7) is generated in preprocessor modeling. The length of the horn is
the resonance length (120.75mm).The input and output diameter is 40 and 20mm and fillet
dimension (h/r) is taken 2 (Table 3.1).

DESIGN AND FEM OF UVT
22
3.3.2.2 Material properties
The titanium is used as the horn material for the analysis with properties, elastic modulus E=
110 GPa, Poisson ratio, γ=0.33, mass density ρ = 4700 Kg/m3.
3.3.2.3 Element type selection
Selection of suitable element types according to material and design of the UVT are made to
ensure the analytical correctness. The UVT is predominantly divided into metallic materials.
Element selection varies due to differing features. Considering the special curved surface
structure of the vibrating system, solid 92, a tetrahedron with 10 nodes (Figure 3.6) is
selected as the element. As the tetrahedron element allows the finite element analysis
software to grid a complex geometric model easily, it is considered to be suitable for the
shape requirement of the vibrating tool.
Figure 3.6 Solid 92 elements [Reproduced from ANSYS® 12.0 user guides [46]]
3.3.2.4 Mesh generation
According to the basic principles of finite element analysis theory, the smaller the mesh
element size is, the more accurate the results of an analysis will be. If the mesh element sizes
infinitely small, the theoretical model will approach the optimal solution. However, this is
only a presupposition. In the analysis process, when elements are too small, element meshing
generates too many elements, nodes and freedom for the model in general. This increases
computational intensity, resulting in a model that is either too time-consuming to solve, or
potential errors in values. Thus, reasonable mesh element size (number of elements) is a
factor that should be considered in a finite element analysis. 14491 numbers of elements with
21517 nodes are used for the model in the present analysis.
DESIGN AND FEM OF UVT
23
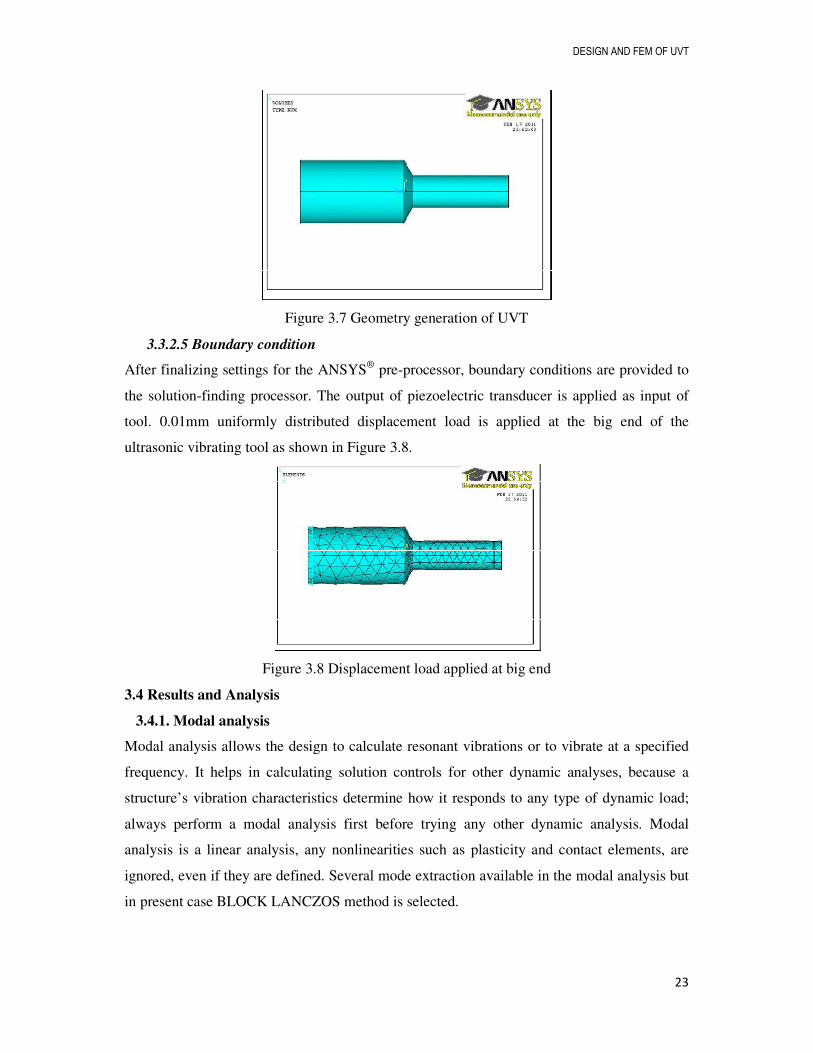
Figure 3.7 Geometry generation of UVT
3.3.2.5 Boundary condition
After finalizing settings for the ANSYS® pre-processor, boundary conditions are provided to
the solution-finding processor. The output of piezoelectric transducer is applied as input of
tool. 0.01mm uniformly distributed displacement load is applied at the big end of the
ultrasonic vibrating tool as shown in Figure 3.8.
Figure 3.8 Displacement load applied at big end
3.4 Results and Analysis
3.4.1. Modal analysis
Modal analysis allows the design to calculate resonant vibrations or to vibrate at a specified
frequency. It helps in calculating solution controls for other dynamic analyses, because a
structure’s vibration characteristics determine how it responds to any type of dynamic load;
always perform a modal analysis first before trying any other dynamic analysis. Modal
analysis is a linear analysis, any nonlinearities such as plasticity and contact elements, are
ignored, even if they are defined. Several mode extraction available in the modal analysis but
in present case BLOCK LANCZOS method is selected.

DESIGN AND FEM OF UVT
24
3.4.2 Harmonic analyses
The technique to determine the steady state response of a structure to sinusoidal (harmonic)
loads of known frequency where the input harmonic loads are forces, pressures, imposed
displacements, and imposed voltage of known frequency. The output parameter is harmonic
displacement at each DOF, current flow for piezoelectric elements, stresses and strains.
3.4.3 Finite element analysis of ultrasonic vibratory tool
Figure 3.9 Modal analysis of UVT (mode 1)
There are numbers of resonant frequencies recorded (Table 3.2). The longitudinal axial mode
shape of UVT is at 19539Hz as shown in Figure 3.9. There are also other modes (Table 3.2)
around longitudinal mode at 22791 Hz and 22799 Hz shown in Figures 3.10 and 3.11. It is
clear from Figures 3.10 and 3.11 cause a bending mode superimposed on the main
longitudinal mode of ultrasonic vibration. This is an undesirable phenomenon which can
jeopardize the advantages of UAT such as worst turning operation. The frequency response
functions (FRF) of UVT is shown in Figure 3.12 which shows that the amplitude is maximum
at resonance frequency 19539Hz. The natural frequency 19539Hz is also within the working
frequency range of the generator (19,500Hz-20,000Hz).
From harmonic response analysis shown in Figure 3.13, it is clear from figure that the
working amplitude of the tool is 0.039234 mm when the driving amplitude is 0.01 and the
result found from ANSYS® is nearly equal to the theoretical result 0.04 (Eq. 3.17) and the
nodal plane is located at mid section of the UVT which is also good agreement with
theoretical result. The percentage of error between theoretical and ANSYS® is 1.9% (Table-
3.2).

DESIGN AND FEM OF UVT
25
Figure3.10 Modal analysis of UVT (mode 2)
Figure 3.1 Modal analysis of UVT (mode 3)

DESIGN AND FEM OF UVT
26
19500 19510 19520 19530 19540 19550
0
1
2
3
4
5
Am
plit
ude(
mm
)
Frequency(Hz)
Figure 3.12 Frequency response function of UVT
Table3.2 Dynamic Analysis of UVT
Mode Natural Frequency (Hz) Figure 1 19539 3.8
2 22791 3.9 3 22799 3.10
Figure 3.1 Harmonic response analysis of UVT
Horn material Titanium
D1
(mm) D2 Fillet
dimension (h/r)
Resonance length
Driving amplitude
Nodal point xn
Amplitude at working end (theoretical)
Amplitude at working end (ANSYS®)
% of error
20mm 10mm 2 120.75mm 0.01mm 60.375mm 0.04mm 0.039234mm 1.9

DESIGN AND FEM OF UVT
27
3.5 Conclusions
It is very important to know the amplitude of vibration at every point of the ultrasonic horn,
because: it allows precise determination of the nodal plane position for clamping; gives exact
displacement value at tool-workpiece contact points which depend on amplitude at the top of
the horn; tests various shapes of ultrasonic horns before manufacturing a real prototype.
The results of modal analysis show that used horn configuration gives definite and wide
nodal band for clamping purpose. An additional point to be considered when designing UAT
setup is that the horn should have at least one natural frequency within the allowable
ultrasonic frequency, in this case 19539 Hz (19,500–20,500 Hz). It can be concluded that the
geometrical dimension and material properties of UVT used in analysis of horn can deliver
the required frequency. This frequency matches with other part of the ultrasonic system and
the resonance frequency of the horn under the generator frequency and the UVT is amplified
4 times of source amplitude to working amplitude.

Experiment

EXPERIMENT
28
CHAPTER 4
EXPERIMENT
4.1 Calculation of Tool Tip Amplitude
Figure 4.1 Cutting tool during ultrasonic vibration (treated as a cantilever beam)
As shown in Figure 4.1 and Figure 4.2 the cutting tool treated as a cantilever beam in this
experiment. The vibratory tool is placed 35mm from the fixed end and cutting tip is 70mm
from the fixed end. The output amplitude of vibration of UVT is 8µm.
From Figure 4.1 (using triangular rule)
DAE ABC≅△ △
or BC AB
DE AD=
or AB
BC DEAD
=
16µmBC =
BC is the amplitude of vibration of cutting tip.
EXPERIMENT
29
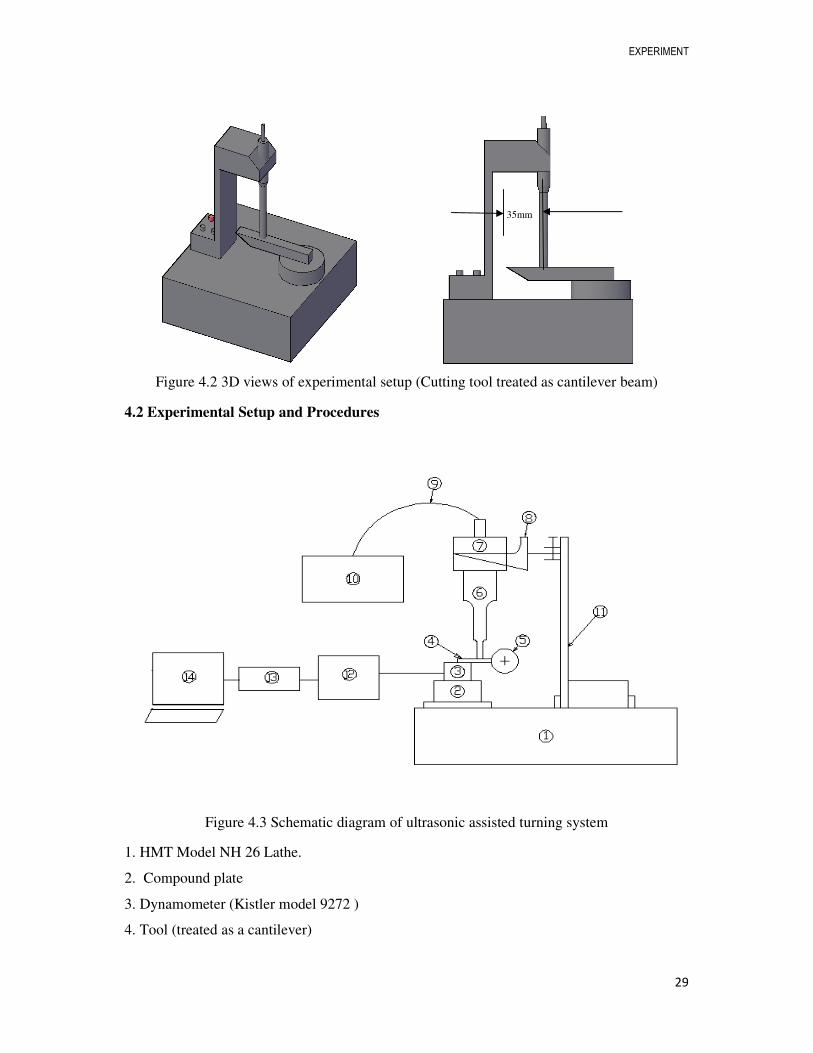
Figure 4.2 3D views of experimental setup (Cutting tool treated as cantilever beam)
4.2 Experimental Setup and Procedures
Figure 4.3 Schematic diagram of ultrasonic assisted turning system
1. HMT Model NH 26 Lathe.
2. Compound plate
3. Dynamometer (Kistler model 9272 )
4. Tool (treated as a cantilever)
35mm

EXPERIMENT
30
5. Work-piece
6. Ultrasonic vibratory tool (UVT)
7. Booster/converter
8. Bracket
9. H.F.Cable with 4 pin coaxially (M) to (F) connector connects 20 kHz high voltage to
converter.
10. Generator
11. L-type holder
12. Charge amplifier model 5070A
13. DAQ
14. PC (CONTROL UNIT)
Figure 4.4 Experimental setup

EXPERIMENT
31
Figure 4.5 Lathe by which all experiments are performed (HMT Model NH 26)
Table 4. 1 Composition of specimen (carbon steel)
Table 4. 2 Specifications Ultrasonic system
Line voltage 220V/230V AC Single phase Input frequency 50 Hz Current consumption 220V, 50Hz.-6A Output frequency 20kHz Amplitude 8µm Output power 2kW Output control Auto tuning with load output power range 30
to 100% of nominal converter amplitude. Operational mode Continuous mode:-on/off & timer mode. Tuning Auto tuning operation in normal mode. Also
manual tuning facility. Converter weight with horn Approx. 1Kg Generator weight Approx. 3Kg
Table 4. 3 Specification of cutting tool
Material Rake angle Clearance angle Cutting edge angle Nose radius
Tool steel 00 24.9320 43.6310 0.2mm
c Si Mn P S Cr Mo Ni
0.75% 0.01% 1.141% 0.072% 0.307% 0.75% 0.006% 0.27%

EXPERIMENT
32
4.2.1 Description of experimental set-up
Figure 4.3 shows a schematic diagram of the ultrasonic vibration turning system used in the
present experiments. As shown in Figure 4.4 the work-piece (Table 4.1) is clamped by the
three jaw chuck of ‘HMT model NH 26’ lathe (Figure 4.4).The commercial piezoelectric
transducer (unloaded 20�0.5 kHz frequency, Table 4.2) provides vibration to the ultrasonic
vibratory tool (UVT). The tip of UVT is placed vertically on the cutting tool. The cutting tool
(Table 4.3) is treated as a cantilever beam as shown in Figure 4.1, which is fixed on Kistler
model 9272 dynamometer (Table 4.4) as shown in Figure 4.4. The UVT (Table 4.5) placed
perpendicularly to the work-piece in the horizontal plane allows the cutting tool to make the
ultrasonic vibration movement in the cutting velocity direction. The amplitude of vibration is
16µm at cutting tool tip as calculated (section-4.1), which is the working amplitude for all
experiments.
The ultrasonic transducer is clamped at its nodal point by a light weight bracket and the
bracket is fixed by sliding mechanism with special designed L-shape holder. This L-shaped
holder maintained the height of the ultrasonic transducer, which is fixed on cross slide of the
lathe. The UVT is connected to generator by H.F. Cable with 4 pin coaxially (M) to (F). The
generator is generating high frequency around 20�0.5kHz with 2.0kW (max) power from the
input mains voltage 230V AC, 50Hz frequency.
Table 4. 4 Specifications of Kistler model 9272 dynamometer
Measuring range Force/moment Range FX -5-5kN FY -5-5kN FZ -5-5kN MZ -200-200N-m
Table 4. 5 Specification of UVT
Material Titanium Geometry( D1-D2-L) 40mm-20mm-120.75mm Young’s modulus (E) 110 Gpa Poisson’s ratio (γ) 0.33 Density (ρ) 4700 Natural frequency(f) 19539Hz
Table 4. 6 Specifications of Data acquisitions (DAQ)
-National Instrument make USB based 14 bit 8 channels data card along with Labview based data acquisition software to acquire the necessary parameters in the range of +/- 5V. Model no-NI-DAQmxTM8.9.5, Sampling rate 1000 per second
EXPERIMENT
33
Table 4. 7 Specifications of control unit (PC)
Processor Pentium 4 RAM 526MB Screen resolutions 800�600 pixels Operating system Windows XP
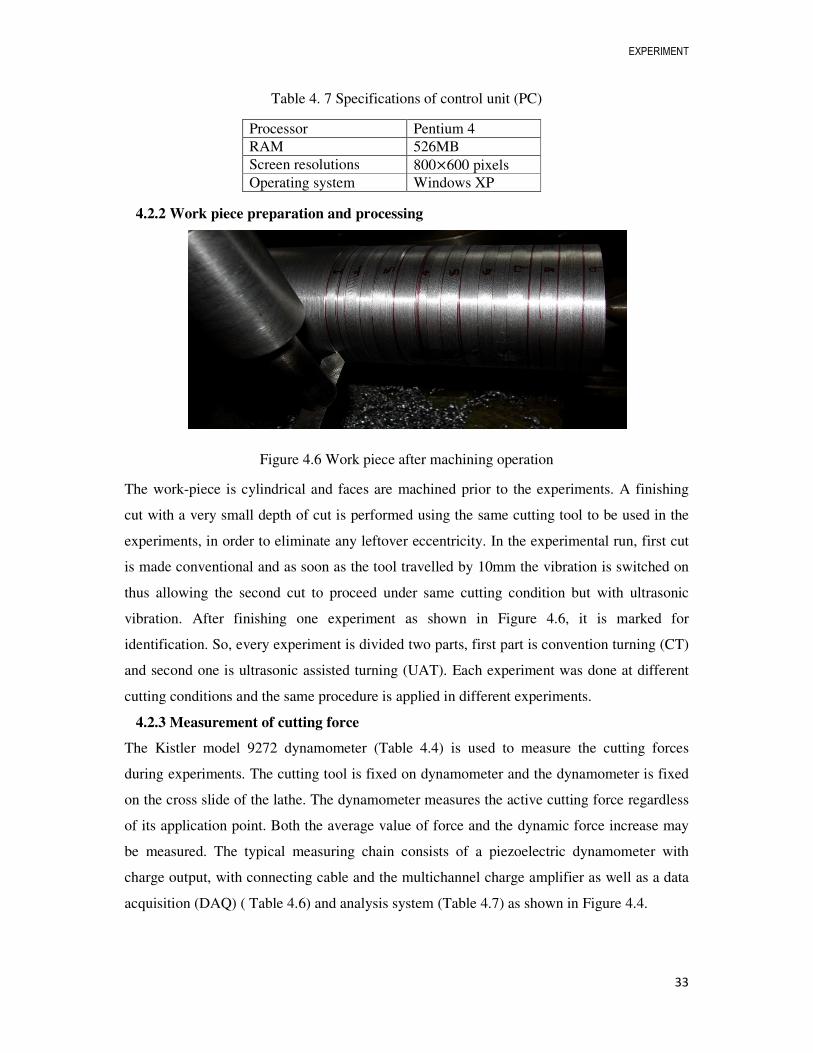
4.2.2 Work piece preparation and processing
Figure 4.6 Work piece after machining operation
The work-piece is cylindrical and faces are machined prior to the experiments. A finishing
cut with a very small depth of cut is performed using the same cutting tool to be used in the
experiments, in order to eliminate any leftover eccentricity. In the experimental run, first cut
is made conventional and as soon as the tool travelled by 10mm the vibration is switched on
thus allowing the second cut to proceed under same cutting condition but with ultrasonic
vibration. After finishing one experiment as shown in Figure 4.6, it is marked for
identification. So, every experiment is divided two parts, first part is convention turning (CT)
and second one is ultrasonic assisted turning (UAT). Each experiment was done at different
cutting conditions and the same procedure is applied in different experiments.
4.2.3 Measurement of cutting force
The Kistler model 9272 dynamometer (Table 4.4) is used to measure the cutting forces
during experiments. The cutting tool is fixed on dynamometer and the dynamometer is fixed
on the cross slide of the lathe. The dynamometer measures the active cutting force regardless
of its application point. Both the average value of force and the dynamic force increase may
be measured. The typical measuring chain consists of a piezoelectric dynamometer with
charge output, with connecting cable and the multichannel charge amplifier as well as a data
acquisition (DAQ) ( Table 4.6) and analysis system (Table 4.7) as shown in Figure 4.4.

EXPERIMENT
34
4.2.4 Measurement of surface roughness
Surface quality was assessed by measuring surface roughness along the axial direction of the
work pieces. Both surfaces produced by application of ultrasonic vibration, and under
conventional conditions, are evaluated using the “HANDYSURF E-35A” surface measuring
instrument. Centre line average (Ra) value is used to analyze the surface roughness of
machined work-piece.
4.3 Experimental condition
4.3.1 Composition of the material
Carbon steel is chosen as work piece material for all experiments. The chemical composition
of carbon steel is given in Table 4.1.
4.3.2 Specification of the insert grades
Tool steel is used as cutting tool for these experiments. Specifications of the cutting tool are
given in Table 4.3. This is treated as cantilever beam for these experiments.
4.3.3 Cutting condition
Cutting condition used in machining work pieces is given in Table 4.8. The cutting is in dry
state, the presented value was chosen to investigate the effect of superimposed ultrasonic
vibration.
Table 4. 8 cutting condition used in experiment
Work piece material N(rev/min) D(mm) V(m/min) S(mm/rev) d (mm)
Carbon steel
57 80 14.32296 0.04 0.1
74 80 18.59472 0.05 0.15 96 80 24.12288 0.06 0.2
4.4 Results and Discussion
4.4.1 Effect of cutting speed on surface finish
The relation between cutting speed and surface roughness in conventional turning (CT) and
ultrasonic assisted turning (UAT) is shown in Figure 4.7 at different feed and depth of cut.
The best data collected from a number of tests under the same cutting conditions in both
cases are plotted in the graphs. Dashed lines and continuous solid lines show the variation of
surface roughness in UAT and CT respectively. In the range of the cutting speeds
investigated, the achieved surface roughness of carbon steel work-pieces machined under the
application of ultrasonic vibration is superior to the surface roughness of work-pieces
machined by conventional cutting. Improvement of surface roughness is about 15-20 % in the

EXPERIMENT
35
whole range of cutting speeds under investigation. As it is mentioned earlier, when the
ultrasonic vibration was applied in the tangential direction the actual surface cutting speed
must be well below the critical cutting speed, which is determined by the amplitude and the
frequency of the vibrating system. In UAT, because of the effect of pulse cutting force, the
width and depth of cutting marks on machined surface are much more uniform.
14 16 18 20 22 24
2.0
2.5
3.0
3.5
4.0
4.5
5.0 S=0.06
S=0.05
S=0.04
UATCT
Ra(µ
m)
Speed, V(m/min)
(a)

EXPERIMENT
36
14 16 18 20 22 24
2.8
3.0
3.2
3.4
3.6
3.8
4.0
4.2
4.4
4.6
4.8
5.0
5.2
5.4
5.6
UATCT
S=0.06
S=0.05S=0.04
Ra,(
µm
)
Speed,V(m/min)
(b)
14 16 18 20 22 24
2.0
2.2
2.4
2.6
2.8
3.0
3.2
3.4
3.6
3.8
4.0
4.2
4.4
4.6
4.8
5.0
5.2
5.4
5.6
5.8
UATCT
S=0.06
S=0.05
S=0.04
Ra,(
µm
)
Speed,V(m/min)
(c)
Figure 4.7 Relative surface roughness(Ra) verses cutting speed(V) (a) depth of cut, d =0.1 (b) d=0.15 (c) d=0.2
During UAT cutting process, it is an intermittent contact between cutter cutting chip and
work-piece & cutting chip, so the cooling condition in processing region is better. In addition,
at lower cutting speed, curled ribbon chip can produced in ultrasonic turning and the turning
process is relatively stable, which is another reason get smaller surface roughness. Low
surface roughness in UAT than CT may also be attributed to the fact that built-up-edge
formation, the amount of crack and scale are less due to reduced plastic deformation in UAT.
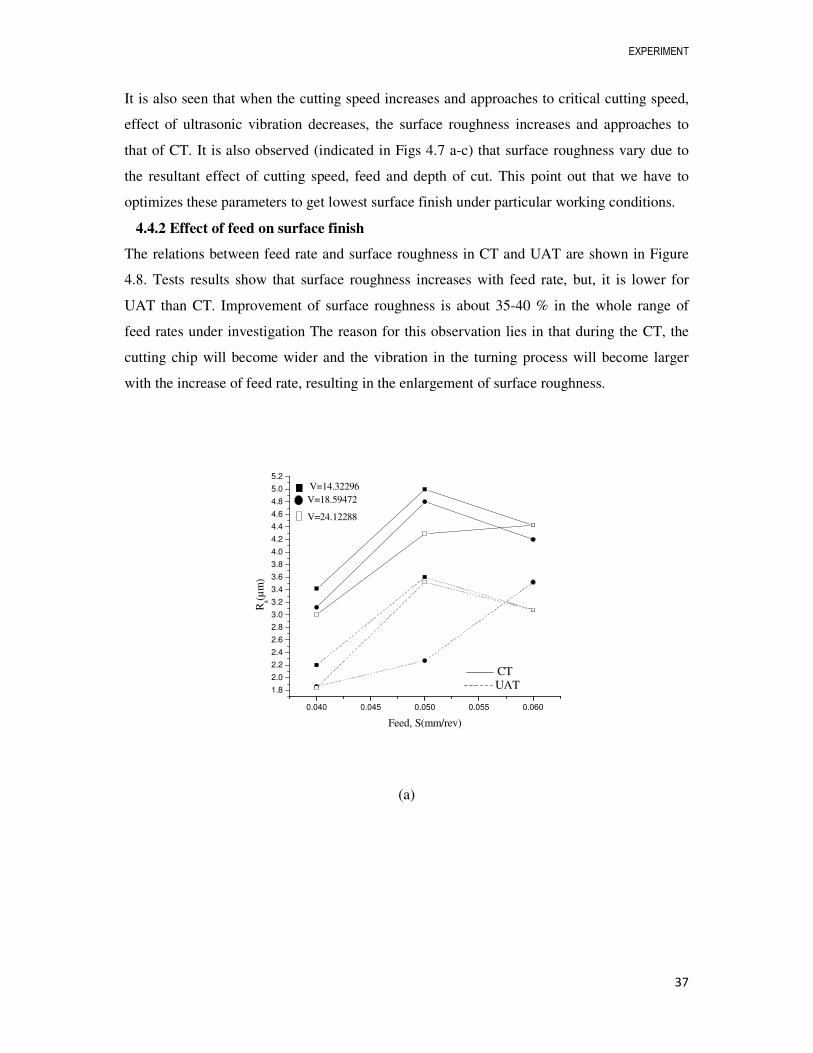
EXPERIMENT
37
It is also seen that when the cutting speed increases and approaches to critical cutting speed,
effect of ultrasonic vibration decreases, the surface roughness increases and approaches to
that of CT. It is also observed (indicated in Figs 4.7 a-c) that surface roughness vary due to
the resultant effect of cutting speed, feed and depth of cut. This point out that we have to
optimizes these parameters to get lowest surface finish under particular working conditions.
4.4.2 Effect of feed on surface finish
The relations between feed rate and surface roughness in CT and UAT are shown in Figure
4.8. Tests results show that surface roughness increases with feed rate, but, it is lower for
UAT than CT. Improvement of surface roughness is about 35-40 % in the whole range of
feed rates under investigation The reason for this observation lies in that during the CT, the
cutting chip will become wider and the vibration in the turning process will become larger
with the increase of feed rate, resulting in the enlargement of surface roughness.
0.040 0.045 0.050 0.055 0.060
1.8
2.0
2.2
2.4
2.6
2.8
3.0
3.2
3.4
3.6
3.8
4.0
4.2
4.4
4.6
4.8
5.0
5.2
V=24.12288
V=18.59472V=14.32296
UATCT
Ra(µ
m)
Feed, S(mm/rev)
(a)

EXPERIMENT
38
0.040 0.045 0.050 0.055 0.060
2.5
3.0
3.5
4.0
4.5
5.0
5.5
UATCT
V=24.12288
V=18.59472V=14.32296
Ra(µ
m)
Feed,S(mm/rev)
(b)
0.040 0.045 0.050 0.055 0.060
2.0
2.5
3.0
3.5
4.0
4.5
5.0
5.5
UATCT
V=24.12288
V=18.59472V=14.32296
Ra(µ
m)
Feed,S(mm/rev)
(c)
Figure 4.8 Relative surface roughness (Ra) verses feed (f) (a) depth of cut, d =0.1 (b) d=0.15 (c) d =0.2
While in UAT, the ultrasonic vibration direction is perpendicular to the direction of main
cutting force, and the contact between cutter and work-piece is pulse and discontinuous,
which is equivalent to reduce the feed rate. So even though under the same cutting
conditions, the effect of feed rate in UAT is less than that in CT. A minimum Ra value of

EXPERIMENT
39
1.8µm was achieved in the test. It is also observed (indicated in Figs 4.8 a-c) that in many
cases surface roughness also decreases after reaching a higher value due to the effect of other
cutting parameters like cutting speed and depth of cut. It indicates that, it is required to
optimize all these parameters to get lowest surface finish under particular working conditions.
4.4.3 Effect of depth of cut on surface finish
Figure 4.9 (a-c) shows the influence of depth of cut on surface roughness. From the figures, it
is evident that in the both case of CT and UAT, surface roughness increases with the increase
of depth of cut. Although it is lower in case of UAT than CT. Improvement of surface
roughness is about 12-18 % in the whole range of cutting speeds under investigation it may
be because that cutting force increases with depth of cut, which leads to the increase of
vibration in the turning process and the scratches between cutting tool and work piece.
0.10 0.12 0.14 0.16 0.18 0.20
1.8
2.0
2.2
2.4
2.6
2.8
3.0
3.2
3.4
3.6
3.8
4.0
4.2
UATCT
Ra(µ
m)
Depth of cut,d(mm)
S=0.06
S=0.05S=0.04
(a)
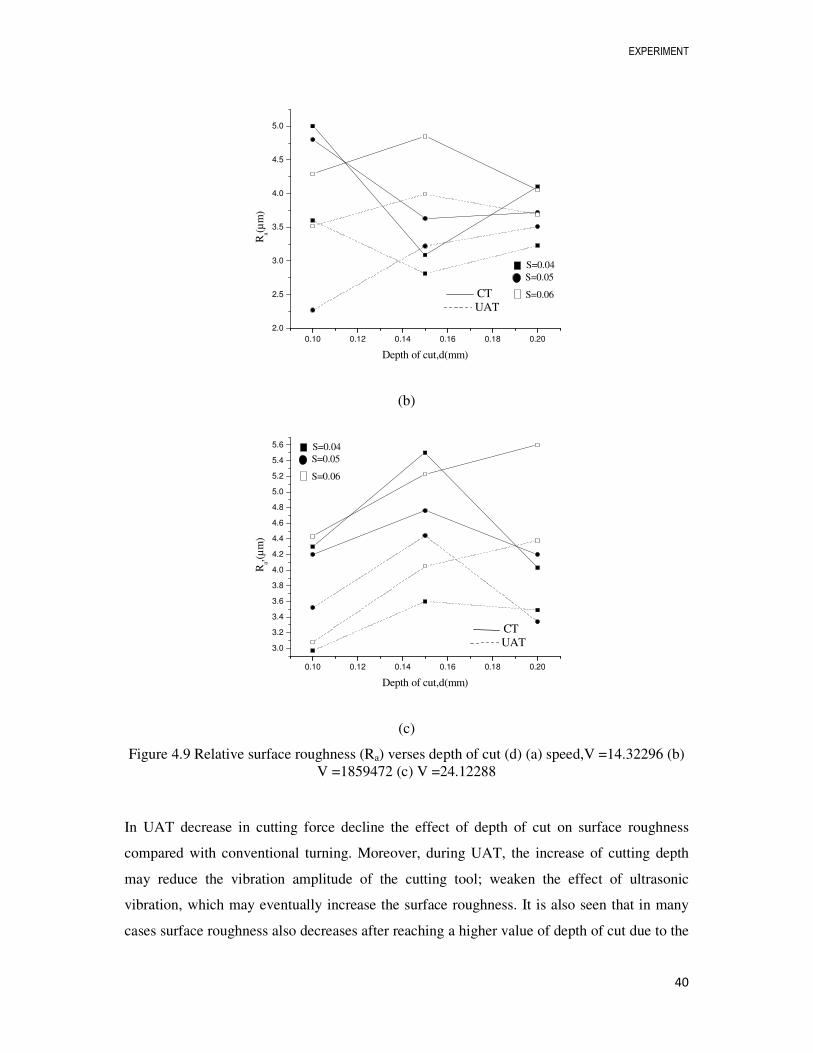
EXPERIMENT
40
0.10 0.12 0.14 0.16 0.18 0.20
2.0
2.5
3.0
3.5
4.0
4.5
5.0
S=0.06
S=0.05S=0.04
UATCT
Ra(µ
m)
Depth of cut,d(mm)
(b)
0.10 0.12 0.14 0.16 0.18 0.20
3.0
3.2
3.4
3.6
3.8
4.0
4.2
4.4
4.6
4.8
5.0
5.2
5.4
5.6
S=0.06
S=0.05S=0.04
UATCT
Ra,(
µm
)
Depth of cut,d(mm)
(c)
Figure 4.9 Relative surface roughness (Ra) verses depth of cut (d) (a) speed,V =14.32296 (b) V =1859472 (c) V =24.12288
In UAT decrease in cutting force decline the effect of depth of cut on surface roughness
compared with conventional turning. Moreover, during UAT, the increase of cutting depth
may reduce the vibration amplitude of the cutting tool; weaken the effect of ultrasonic
vibration, which may eventually increase the surface roughness. It is also seen that in many
cases surface roughness also decreases after reaching a higher value of depth of cut due to the

EXPERIMENT
41
effect of overlapping of feed marks influenced by other cutting parameters like cutting speed
and feed. It may be due to the minimal difference among the process parameters, limited
precision of machine and measuring equipments and interaction among different cutting
parameters.
4.4.4 Effect of cutting speed on cutting force
Figures 4.10(a)–(c) sequentially shows the effects of cutting speed on cutting force, namely,
average tangential force (Fz) for both the cutting techniques at different feed rate and depth of
cut. It can be observed cutting force for the UAT method are reduced up to 25–35% that is
required for the CT method at all the cutting speeds. As explained earlier, it is due to the fact
that UAT gives rise to intermittent contact between cutting tool tip and chip and work-piece
& cutting chip, so better cooling condition in processing region. In addition, UAT promotes
curled ribbon chip, relatively stable turning process, lessen formation of built-up-edge
formation due to reduced plastic deformation.
14 16 18 20 22 24
40
45
50
55
60
65
70
75
80
85
90
95
100
UATCT
S=0.06
S=0.05S=0.04
Cut
ing
forc
e,F
z,(N
)
Speed,V(m/min)
(a)

EXPERIMENT
42
14 16 18 20 22 24
50
60
70
80
90
100
110
UATCT
S=0.06
S=0.05S=0.04
Cut
ting
for
ce,F
z,(N
)
Speed,V(m/min)
(b)
14 16 18 20 22 24
45
50
55
60
65
70
75
80
85
90
95
100
UATCT
S=0.06
S=0.05S=0.04
Cut
ting
for
ce,F
z(N)
Speed,V(m/min)
(c)
Figure 4.10 Principal cutting force (Fz) verses speed (V) (a) depth of cut, d =0.1 (b) d=0.15 (c) d=0.2
It can be noticed that the tangential force values decrease with the increase in spindle speed
(or nominal cutting speed). Two reasons can be realized with this observation. One reason is
that larger shear angle and thus a smaller resultant average force value is induced by the
increased speed. Another reason is that an increased speed ratio, which is linearly related with

EXPERIMENT
43
nominal cutting speed, leads to more overlapping cutting cycle and hence a relatively smaller
thickness of cut. This smaller thickness of cut decreases the material load on the tool rake
face eventually lead to a smaller cutting force.
4.4.5 Effect of feed on cutting force
In Figures 4.11 (a-c), the cutting force in most of the cases increases insignificantly with the
increase in feed rate in UAT, like the variation trend in the CT method. However, cutting
force, at almost all the feed rates, in the UAT process are reduced approximately to about 25–
30% of that of the CT process. Such phenomenon is deemed to be caused by the increase in
uncut chip thickness induced by the increment in feed rate. Due to the bigger uncut chip
thickness, more cutting area leads to increase of cutting force.
0.040 0.045 0.050 0.055 0.060
40
45
50
55
60
65
70
75
80
85
90
95
UATCT
V=24.12288
V=18.59472V=14.32296
Cut
ting
for
ce,F
z,(N
)
Feed,S(mm/rev)
(a)
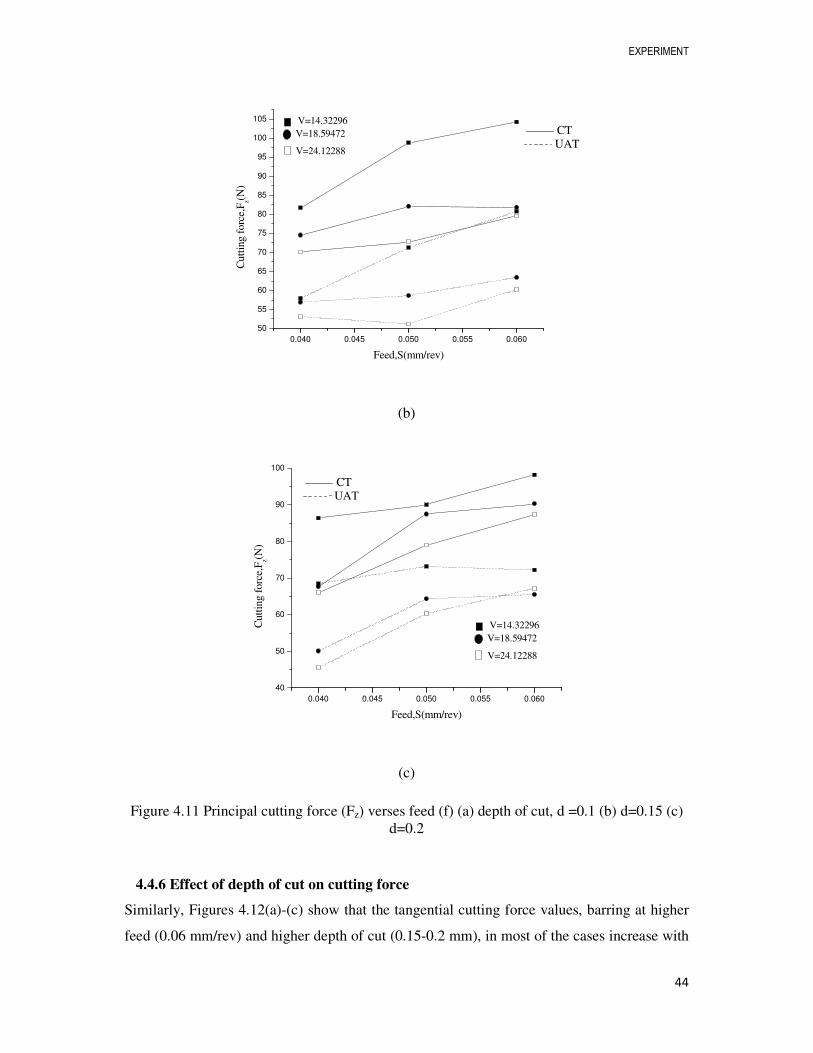
EXPERIMENT
44
0.040 0.045 0.050 0.055 0.060
50
55
60
65
70
75
80
85
90
95
100
105
UATCT
V=24.12288
V=18.59472V=14.32296
Cut
ting
for
ce,F
z(N)
Feed,S(mm/rev)
(b)
0.040 0.045 0.050 0.055 0.060
40
50
60
70
80
90
100
UATCT
V=24.12288
V=18.59472V=14.32296C
utti
ng f
orce
,Fz(N
)
Feed,S(mm/rev)
(c)
Figure 4.11 Principal cutting force (Fz) verses feed (f) (a) depth of cut, d =0.1 (b) d=0.15 (c) d=0.2
4.4.6 Effect of depth of cut on cutting force
Similarly, Figures 4.12(a)-(c) show that the tangential cutting force values, barring at higher
feed (0.06 mm/rev) and higher depth of cut (0.15-0.2 mm), in most of the cases increase with

EXPERIMENT
45
the increase in depth of cut in the UAT method, similar to the observation in the CT process,
due to increased pressure on the tool rake face. However, cutting force, at almost all the depth
of cuts, in the UAT process are reduced approximately to about 20–25% of that of CT
process. It is also seen that in some cases cutting force decreases after reaching a higher value
due to the effect of other cutting parameters like cutting speed and feed. It signifies that,
optimization of all the cutting parameters is essential to get minimum cutting force at a
particular working condition.
0.10 0.12 0.14 0.16 0.18 0.20
55
60
65
70
75
80
85
90
95
100
105
S=0.06
S=0.05S=0.04
UATCT
Cut
ting
for
ce,F
z(N)
Depth of cut,d(mm)
(a)

EXPERIMENT
46
0.10 0.12 0.14 0.16 0.18 0.20
45
50
55
60
65
70
75
80
85
90
95
100
UATCT
Cut
ting
for
ce,F
z(N)
Depth of cut,d(mm)
S=0.06
S=0.05S=0.04
(b)
0.10 0.12 0.14 0.16 0.18 0.20
40
45
50
55
60
65
70
75
80
85
90
UATCT
Cut
ting
for
ce,F
z(N)
Depth of cut,d(mm)
S=0.06
S=0.05S=0.04
(c)
Figure 4.12 principal cutting force (Fz) verses depth of cut (d) (a) speed, V = 24.12288
(b) V =18.59472 (c) V =14.32296
4.5 Conclusions
The following conclusions can be drawn based on the results of the experimental study on
turning carbon steel by conventional turning (CT) and ultrasonic assisted turning (UAT).
In UAT, feed rate has considerable influence on surface roughness while the influence of
depth of cut and cutting speed on surface roughness become less intense than others

EXPERIMENT
47
parameters. UAT improved the surface roughness by 12.0–40.0%. It proves that UAT can
obtain smoother surface.
Because of the unstable turning process in CT, the surface can easily produce some defects
such as burrs, tearing and so on, so the quality of surface becomes poor. While the UAT can
reduce the influence of deformation and built-up-edge formation because of high frequency
reciprocating movement between the contacting surfaces of the tool and the work piece, so as
to make the turning process more stable.
The test results show that the cutting force for the UAT method decreases by 25.0–35.0 % in
comparison with CT. As a result, ultrasonic-aided cutting can enhance the cutting quality of
carbon steel.
Optimization of UAT parameters
OPTIMIZATION OF UAT PARAMETERS
48
CHAPTER 5
OPTIMIZATION OF UAT PARAMETERS
5.1 Design of Experiment
In the present work experiments are done according to design of experiment [47] and the data
analyses are made with application of design of experiment (DOE) techniques and response
surface methodology in developing mathematical model relating important input variables i.e.
cutting speed, feed, depth cut, surface roughness and principal cutting force. All these
statistical analysis are done by commercial available software Minitab 15[48].
Objectives:
• To use response surface methodology in developing mathematical model relating
important input variables and responses.
• Adapting L9 orthogonal array to the design of experiment .The experimental design
has 3 levels and 3 factors.
• Optimize Process parameters using Grey-based Taguchi method.
5.1.1 Full factorial design
In full factorial experiment, responses are measured at all combinations of the experimental
factor levels. The combinations of factor levels represent the conditions at which responses
will be measured. Each experimental condition is a called a "run" and the response
measurement an observation. The entire set of runs is the “design”.
5.1.2 ANOVA
ANOVA (analysis of variance) is a method of computation to identify the differences
between two or more sovereign groups of data collected. Source of variation are explained in
their degree of freedom (DF), total sum of square (SS), and the mean square (MS). The
analysis will calculate also the F-statistic and p-values which are to determine whether the
predictor of factors is significant or insignificant related to the response (The detail
calculations are provided in Appendix A).
5.1.3 Response surface methodology (RSM)
Response Surface Methodology is one of the useful tools in statistical analysis used to
examine the relationship between one or more response variables and a set of quantitative
experimental variables. It is common in industries that when the data are not manageable and

OPTIMIZATION OF UAT PARAMETERS
49
unstructured leads to a brunt in waste of energy and correctness of components. RSM is a
technique of identifying the handy and disobedient data to find the optimum performance and
optimize the response.
In the present analysis a central composite matrix is used in order to optimize the
experimental conditions of surface texturing process. Central composite second order design
is found to be the most efficient tool in response surface modeling using the smallest possible
number of tests that still guaranteed a good accuracy. The Mathematical model of Response
surface methodology (RSM) model corresponds to a second-order polynomial expressed by
(Eq 5.1)
n n2
0 i ii i ij i j
i=1 i=1 , 1
Ÿ = b + b x b x b x xi
i ji j
n
=≠
+ +∑ ∑ ∑
(5.1)
Where Ÿ is the corresponding objective function, Xi the coded values of the ith influencing
factor, n the numbers of factors and b0, bi, bii, bij, are the regression coefficients.
5.1.4 Taguchi method
This is a statistical experimental design to calculate a single or multiple groups of data
(variable) to find the optimum and steadiness in the operating surroundings (response). It also
can distinguish the convenient and uncontainable factors in order to minimize the effect of
noise factors. Taguchi design is used in an orthogonal array which can estimate the effect of
each factor relative to the means and variation. The orthogonal array design is for
investigating the effect of each factor independently from the other in an economic way
which reduces time and cost efficiently. The main objective is to identify the factors that
affect the mean response and control them into the optimum level.
Herein we deal with the analysis of the experiment by the Taguchi methodology, which
consists of the orthogonal arrays. L9 orthogonal arrays have been used to determine the
importance of the factors or the parameters. For the experimental work our main responses
are: Surface roughness (Ra) and Principal cutting force (Fz)
5.1.5 Calculation of Grey relational grade
Taguchi method alone cannot solve multi-objective problems. Grey relational analysis is used
to convert a multi-objective problem into a single objective problem. In Grey relational
analysis firstly the experimental data i.e., measured quantity characteristics are normalized
ranging from zero to one. This process is called as Grey relational generation. Depending
upon the criteria objective function may be Lower-the-Better, Higher-the-Better or Nominal-
is-Best.

OPTIMIZATION OF UAT PARAMETERS
50
Step-1: Grey relation generation
For Lower-the-Better
max ( ) ( )
( )max ( ) min ( )
Yi k Yi kXi k
Yi k Yi k
−=
− (5.2)
For Higher-the-Better
( ) min ( )
( )max ( ) min ( )
Yi k Yi kXi k
Yi k Yi k
−=
− (5.3)
Where Xi(k)= Value after Grey relational generation
Min Yi(k)= minimum of Yi(k) for Kth Response
Max Yi(k)= maximum of Yi(k) for kth Response
Step-2: Calculation of Grey relation co-efficient
min max
( )( ) max
i ki k
∆ + Ψ∆Ψ =
∆0 + Ψ∆ (5.4)
Where ∆0i(k) = |x0(k) - xi(k)| = Difference between absolute Values of x0(k) and xi(k)
Step-3: After taking average of the Grey relational coefficients, the Grey relational grade ( iγ ) can be
calculated
n
i i
k = 1
= ( )kγ ξ∑ (5.5)
5.2 Results and Discussion
5.2.1 Development of model based on RSM
Table 5.1 Experimental factor and their levels
Process parameter Level-1 Level-2 Level-3
Depth of cut (d) 0.1 mm 0.15 mm 0.2 mm
Feed(S) 0.04mm/rev 0.05mm/rev 0.06 mm/rev
Speed(V) 14.323 m/min 19.223 m/min 24.122 m/min
Amplitude 16 µm
Frequency 20kHz
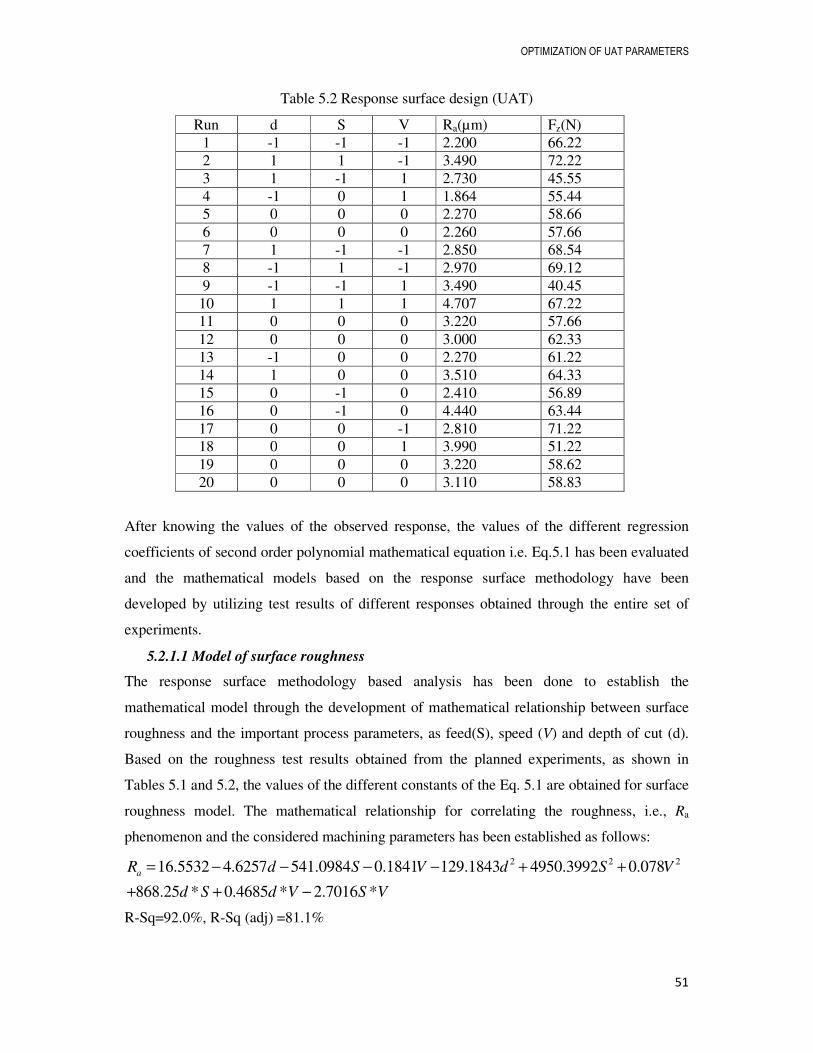
OPTIMIZATION OF UAT PARAMETERS
51
Table 5.2 Response surface design (UAT)
Run d S V Ra(µm) Fz(N) 1 -1 -1 -1 2.200 66.22 2 1 1 -1 3.490 72.22 3 1 -1 1 2.730 45.55 4 -1 0 1 1.864 55.44 5 0 0 0 2.270 58.66 6 0 0 0 2.260 57.66 7 1 -1 -1 2.850 68.54 8 -1 1 -1 2.970 69.12 9 -1 -1 1 3.490 40.45
10 1 1 1 4.707 67.22 11 0 0 0 3.220 57.66 12 0 0 0 3.000 62.33 13 -1 0 0 2.270 61.22 14 1 0 0 3.510 64.33 15 0 -1 0 2.410 56.89 16 0 -1 0 4.440 63.44 17 0 0 -1 2.810 71.22 18 0 0 1 3.990 51.22 19 0 0 0 3.220 58.62 20 0 0 0 3.110 58.83
After knowing the values of the observed response, the values of the different regression
coefficients of second order polynomial mathematical equation i.e. Eq.5.1 has been evaluated
and the mathematical models based on the response surface methodology have been
developed by utilizing test results of different responses obtained through the entire set of
experiments.
5.2.1.1 Model of surface roughness
The response surface methodology based analysis has been done to establish the
mathematical model through the development of mathematical relationship between surface
roughness and the important process parameters, as feed(S), speed (V) and depth of cut (d).
Based on the roughness test results obtained from the planned experiments, as shown in
Tables 5.1 and 5.2, the values of the different constants of the Eq. 5.1 are obtained for surface
roughness model. The mathematical relationship for correlating the roughness, i.e., Ra
phenomenon and the considered machining parameters has been established as follows:
2 2 216.5532 4.6257 541.0984 0.1841 129.1843 4950.3992 0.078
868.25 * 0.4685 * 2.7016 *aR d S V d S V
d S d V S V
= − − − − + +
+ + −
R-Sq=92.0%, R-Sq (adj) =81.1%

OPTIMIZATION OF UAT PARAMETERS
52
5.2.1.2 Model of principal cutting force
Based on Eq. 5.1, the effects of various machining process variables, e.g. depth of cut (d),
feed(S) and speed (V) on principal cutting force (Fz) has been evaluated by computing the
values of different constants of Eq. 5.1 utilizing the relevant experimental data from Table
5.2. The mathematical relationship for correlating the average principal cutting force and the
considered machining process parameters is obtained as follows:
2 2 2165.0085 369.026 431.9322 6.8666 714.000 8250.000 0.0096 1865.000 5.8470
76.7355z
F d S V d S V dS dV
SV
= − − − + − + + +
+R-Sq=96.2%, R-Sq (adj) =92.8%
5.2.1.3 Adequacy test for surface roughness and principal cutting force
An ANOVA table is generally used to check the adequacy of the model developed.
Depending upon F-value (variance ratio), p-value (probability of significance) is calculated.
If p value of model is less than 0.05, significance of corresponding term is established and is
desirable as it indicates that the terms in the model have a significant effect on the response.
From ANOVA Tables 5.3 and 5.4, analyzing of variance shows that the regression model is
significant as the values of probability less than 0.05. The model proposed is statistically
significant and adequate because of high R2 value. The co-efficient of determination is more
than 80% for the above model developed, which shows the high co-relation, existing between
the experimental and predicted values. The adjusted R2 value is particularly useful when
comparing models with different number of terms. When the R2 approaches to unity, the
better the response model fits the actual data.
In surface response model, the adjusted R2 (81.1) is closed to the predicted R2 (92.0) and in
principal cutting force model, the adjusted R2 (92.8) is closed to the predicted R2 (96.2). So
the predicted R2 is in reasonable agreement with the adjusted R2. It is understood that
unnecessary terms are not added in the model. The model presented high determination
coefficient (R2=92.0 & 96.2 close to unity) explaining 92.05% & 96.2% of variability in the
response which indicates the goodness of fit for the model & high significance of the model.
This analysis shows that the prediction model sufficiently explains the relationship between
the responses and independent variables.

OPTIMIZATION OF UAT PARAMETERS
53
Table 5.3 ANOVA for Ra (RSM model)
Source DF Seq SS Adj SS Adj MS F p Regression 9 6.4646 6.46464 0.71829 6.95 0.006 Linear 3 3.6644 3.66442 1.22147 11.82 0.003 Square 3 1.0481 1.04813 0.34938 3.38 0.075*
Interaction 3 1.7521 1.75210 0.58403 5.65 0.022 Residual Error
8 0.8269 0.82690 0.10336
Total 19 10.3988 *= insignificant factor
Table 5.4 ANOVA for Fz (RSM model)
Source DF Seq SS Adj SS Adj MS F p
Regression 9 1225.61 1225.61 136.179 28.36 0.000
Linear 3 1077.05 1077.05 359.016 74.76 0.000
Square 3 12.09 12.09 4.029 0.84 0.503*
Interaction 3 136.47 136.47 45.491 9.47 0.003
Residual Error
10 48.02 48.02 4.802
Total 19 1273.63
*= insignificant factor
5.2.3 Parametric optimization
Table 5.5 Experimental result of Taguchi L9 orthogonal array
Run D S V Ra Fz
1 1 1 1 2.2 66.22 2 1 2 2 2.27 62.33 3 1 3 3 3.08 55.44 4 2 1 2 2.41 56.89 5 2 2 3 3.13 51.22 6 2 3 1 3.6 80.77 7 3 1 3 2.73 45.55 8 3 2 1 3.23 73.22 9 3 3 2 3.34 65.55
5.2.3.1 Influence on surface roughness
During the process of UAT, the effects of various machining parameters like d, S, V on Ra
are shown in Figure 5.1.This figure indicates that the effect of depth of cut on surface finish
is more as compared to speed and feed. So the percentage of contribution according to
ANOVA Table 5.6 of depth of cut, feed and speed are 55.76, 29.41, and 9.17 respectively.

OPTIMIZATION OF UAT PARAMETERS
54
From the present analysis it is found that all factors are insignificant and the percentage of
contribution of depth of cut for surface finish in UAT is more and followed by feed and
speed.
M
ean
of
Mean
s
0.200.150.10
3.50
3.25
3.00
2.75
2.50
0.060.050.04
24.122919.223014.3230
3.50
3.25
3.00
2.75
2.50
d S
V
Figure 5.1 Main effect plots for Ra
Table 5.6 ANOVA for Ra (Taguchi)
Source DF SS MS F p %contribution d 2 1.5291 0.76453 9.86 0.092* 55.76 S 2 0.8066 0.40328 5.20 0.161* 29.41 V 2 0.2515 0.12577 1.62 0.381* 9.17 Error 2 0.1550 0.07750 5.65 Total 8 2.7421 100
*=insignificant
5.2.3.2 Influence on principal cutting force
Influence on Fz is shown in Figure 5.2 indicates that effects of speed is more as compared to
feed and depth of cut. From ANOVA, Table 5.7, it is shown that both speed and feed are
significant factors at 95% confidence level and percentage of contribution of speed, feed and
depth of cut are 79.94,18.98,.05 respectively.

OPTIMIZATION OF UAT PARAMETERS
55
Table 5.7 ANOVA for Fz (Taguchi)
Source DF SS MS F p %Contribution d 2 4.979 2.490 0.93 0.518* 0.05 S 2 183.142 91.571 34.20 0.028 18.98 V 2 771.127 385.564 143.91 0.007 79.94 Error 2 5.355 2.678 0.055 Total 8 964.605 100
*=insignificant factor
Mean
of
Mean
s
0.200.150.10
70
65
60
55
50
0.060.050.04
24.122919.223014.3230
70
65
60
55
50
d S
V
Figure 5.2 Main effect plots for Fz
5.2.3.3 Optimization by Grey relation analysis
In the present Grey relation analyses, optimal parametric combination for surface roughness
& principal cutting force (multi objective) of UAT has been evaluated. The Grey relation
grade and rank is shown in Table 5.8 and Figure 5.3. Thus, the multi criteria optimization
problem has been transferred into a single equivalent objective function optimization problem
using the combination of the Taguchi approach and grey relation analyses. The higher the
value of the grey relation grade, the corresponding factor combination is said be close to the
optimal. The mean of the grey relation grade for each level of cutting parameters, and the
total mean of the grey relation grade is summarized in Table 5.9. Figure 5.4 shows that the
grey relation grade (GRG) graph and is represented graphically in main effect plot. With the
help of mean grey relation grade, the optimal parametric combination becomes d3-S1-V3 &

OPTIMIZATION OF UAT PARAMETERS
56
from mean effective for GRG graph the optimal parametric combination become d1-S1-V3.
The significance of the factors on the overall quality characteristics of ultrasonic assisted
turning (UAT) process has also been evaluated quantitatively with the analysis of variance
(ANOVA) method for grey relation grade and shown in Table 5.10. Results of ANOVA
indicate that feed is the most significant factor followed by cutting speed as the p-values is
less than 0.05. Cutting speed and depth of cut are found to be insignificant from the study.
Optimal results were verified through confirmation test. Table 5.11 shows the comparison of
the estimated grey relation grade with the actual grey relation experiments using optimal
cutting parameters. It may be noted that there is good agreement between the estimated value
0.784553 and experimental value 0.810078. The improvement of grey relation grade from
initial parameter is 0.476748.
0 1 2 3 4 5 6 7 8 9 10
0.3
0.4
0.5
0.6
0.7
0.8
Gre
y re
lati
on g
rade
Experimental number
Figure 5.3 Grey relation grade
Table 5.8 Grey relation analysis table
Run Ra Fz Normalizing GRC GRG(γ) Ranking Ra Fz Ra Fz
1 2.2 66.22 1 0.413118 1 0.460031 0.730016 2 2 2.27 62.33 0.95 0.523566 0.909091 0.512067 0.710579 3
3 3.08 55.44 0.371429 0.719194 0.443038 0.640364 0.541701 6 4 2.41 56.89 0.85 0.678024 0.769231 0.60829 0.68876 4 5 3.13 51.22 0.335714 0.839012 0.429448 0.756443 0.592946 5 6 3.6 80.77 0 0 0.333333 0.333333 0.333333 9 7 2.73 45.55 0.621429 1 0.569106 1 0.784553 1
8 3.23 73.22 0.264286 0.214367 0.404624 0.388913 0.396769 8 9 3.34 65.55 0.185714 0.432141 0.380435 0.468227 0.424331 7

OPTIMIZATION OF UAT PARAMETERS
57
Table 5.9 Response table for GRG
UAT Parameter
Average GRG by Factor Level Max-Min Level 1 Level 2 Level 3
d 0.6608 0.5383 0.5352 0.1255 S 0.7344 0.5668 0.4331 0.3031 V 0.4867 0.6079 0.6397 0.1530
Total mean relation grade=0.57811
Mean
of
GR
G=
0.5
78
11
0.200.150.10
0.7
0.6
0.5
0.4
0.060.050.04
24.122919.223014.3230
0.7
0.6
0.5
0.4
d S
V
Figure 5.4 Effect of UAT parameter level on the multi performance
Table 5.10 ANOVA for grey relation grade
Source DF SS MS F p %Contribution d 2 0.030758 0.030758 4.50 0.182* 14.38 S 2 0.136771 0.136771 2.02 0.048 63.95 V 2 0.039117 0.039117 5.72 0.149* 18.29 Error 2 0.006833 0.006833 3.19 Total 8 0.213840 100
*=insignificant factor

OPTIMIZATION OF UAT PARAMETERS
58
Table 5.11 Results of confirmatory experiment
Initial factor setting
Optimal cutting factors Prediction by GRG Experimental(Figure 5.4 )
Level d2-S3-V1 d3-S1-V3 d1-S1-V3
Ra 3.6 2.8 Fz 80.77 44.22 GRG(γ) 0.333333 0.784553 0.810078
Improvement in grey relation grade=0.476748
5.4 Conclusions
In this study, response surface methodology for the optimization of machining parameters is
proposed. Statistical models have been developed for the cutting force (Fz) and surface
roughness (Ra) using central composite design with three level factors. Mathematical models’
output revealed that the RSM model proposed are statistically significant and adequate for all
the environmental conditions because of higher R2 value (0.92 and 0.962), which is close to
1. It shows the high correlation exist between the experimental and predicted values.
Optimization of multiple performance characteristics of the UAT such as surface roughness
and cutting force has been carried out using Taguchi-based GRA technique. The factors
considered for the L9 orthogonal array construction are the cutting speed, feed, and depth of
cut. The contribution of each factor towards the multi-response optimization has been studied
and it is inferred that combining Taguchi method and GRA are well applicable for the
optimal design of UAT.
Further the developed models from multiple response optimizations, the optimum machining
conditions for the spindle speed, feed rate and depth of cut are determined as, 24.122 m/min,
0.04mm/rev and 0.1mm respectively. The optimized machining parameters are used for the
confirmation of experiments for validation and it is observed that the improvement of grey
relation grade from initial parameter is 0.476748, showing good agreement with the predicted
responses.

Conclusions and Future Recommendations

CONCLUSIONS AND FUTURE RECOMMENDATIONS
59
CHAPTER 6
CONCLUSIONS AND FUTURE RECOMMENDATIONS
6.1 Conclusions
In this work the influence of cutting parameters (cutting speed, feed and depth of cut) on
UAT cutting force and surface roughness acting on carbon steel has been investigated. The
results have been compared with those obtainable from the conventional turning process. The
influencing parameters of the horn design have also been investigated. The following
conclusions could be drawn from this investigation:
• In UAT, feed rate has considerable influence on surface roughness while the influence
of depth of cut and cutting speed on surface roughness become less intense than
others parameters. UAT improved the surface roughness by 12.0–40.0%. The test
results show that the cutting force for the UAT method decreases by 25.0–35.0 % in
comparison with CT.
• Modal analysis of the cutting tool is performed. During the analysis of frequency
response characteristics it is found out, that dominant peaks correspond the respective
modes. Dominant peaks are in longitudinal direction at approximately 19.5 kHz
excitation frequency. According to modal analysis the 2nd mode is at excitation
frequency 22.7 kHz. Here the cutting tool is vibrating in longitudinal direction. After
this analysis the conclusion can be made, that: for exiting longitudinal vibrations and
vibrations in cutting direction is purposeful to excite in 1st mode of the cutting tool.
• The present study develops roughness and cutting force models for three different
cutting parameters using response surface method. The second-order response models
have been validated with analysis of variance. It is found that all the three cutting
parameters (spindle speed, depth of cut and feed rate) and their interactions have
significant effect on roughness parameters considered in the present study though the
influences may vary with the nature of work-piece material. An attempt has been
made to estimate the optimum cutting conditions to produce the best possible surface
quality and lowest cutting force requirement separately within the experimental
CONCLUSIONS AND FUTURE RECOMMENDATIONS
60
constraints. Optimum machining parameter combinations for different roughness
parameters are also tested through confirmation experiments that show fairly good
agreement with prediction of response surface method.
• UAT process has several performance measures (responses) and some of these
responses are correlated. Reported researches in the literature on UAT processes
mainly deal with the optimization of single performance measure at a time. In this
work, GRA method which can be effectively used to optimize multiple correlated
responses of UAT process is presented. Using this method, two sets of past
experimental data on UAT process are analysed and the optimization performance
found out.
• To conclude, the UAT method has been found to be a suitable technique to achieve
high-quality finish surfaces and lower cutting force requirement not only for hard
material but also for general purpose engineering material, like carbon steel.
6.2 Future Recommendations
• Further investigation is necessary to assess the impact of cutting tool edge condition,
effect of rake angle and effect of the process on various materials.
• More study is essential to know the effect of vibration parameters amplitude,
frequency, direction of vibration on cutting performance, location of the UAT on the
tool.
• Further analysis is required to find out the tool life, residual stress and temperature
rise in UAT method
• The same experiment needs to be carried out at least more than 3 times for its
repeatability and error bar can be plotted.
• The sensitivity analysis for the FE mesh needs to be done.
• In the FE analysis, the elastic deformation of the vibrating tool and stress distribution
may be included to get better result.

REFERENCES

REFERENCES
61
REFERENCES
[1] Shamato, E.C., X. Ma and T. Morowaki, “Ultraprecision ductile cutting of glass by applying ultrasonic elliptical vibration cutting”, Precision Engineering Nanotechnology, 1,
1999, pp 408-411. [2] Markov, A. I., “Ultrasonic machining of intractable materials”, 1996, London: Iliffe
Books Ltd.
[3] Kumabe, J., “Vibratory cutting”, 1979, Dzikke Sjuppan, Tokyo.
[4] Devin, J., “Ultrasonically assisted metal removal”, SAMPLE Quarterly, 10, 1979, pp 485-
496.
[5] Takeyama, H. and Iijima, “Machinability of glass fiber reinforced plastics and application
of ultrasonic machining”, Annals CIRP, 37(1), 1988, pp 93-96.
[6] Kremer, D., “Ultrasonically assisted machining”, Mech. Ind. Mater., 48, 1995, pp.15-21.
[7] Astashev, V.K., “Effect of ultrasonic vibrations of a single point tool on the process of
cutting”, Journal of Machinery Manufacturing and Reliability, 5, 1992, pp 65–70.
[8] Morowaki, T., E., Shamoto and K. Inoue, “Ultra precision ductile cutting of glass by
applying ultrasonic vibration”, CIRP Annals, 41, 1992, pp 559-562.
[9] Astashev, V. K., and V. I. Babitsky, “Ultrasonic cutting as a nonlinear (vibro-impact)
process”, Ultrasonics, 36, 1998, pp 89-96.
[10] Babitsky, V.I., A. N. Kalashnikov, and A. Meadows, “Ultrasonically assisted turning of
aviation materials”, Journal of Materials Processing Technology, 132, 2003, pp 157-167.
[11] Masahiko, Jin, Masao Murakawa, “Development of a practical ultrasonic vibration
cutting tool system”. Journal of Materials Processing Technology, 113, 2001, pp 342-347
[12] Isaev, A. and V. Anochin, Vestnik Mashinostroenia, 5, 1961, pp 56.
[13] Kubota, M., J. Tamura and N. Shimamura, Bull. Jap.Soc.Proc.Engng, 11, 1977, pp.127.
[14] Markov, A.I., “Ultrasonic Machining of Hard Materials”, 2nded.1968, Moscow:
Machinostroenie.
[15] Kim, J.D. and E.S. Lee, “A study of ultrasonic vibration cutting of carbon fiber
reinforced plastics”, International Journal of Advance Manufacturing Technology, 12, 1996,
pp 78-86.
[16] Weber, H., J.Heberger and R. Plitz, “Turning of machinable glass ceramics with an
ultrasonically vibrated tool”, Annals of the CIRP, 33, 1984, pp 85-87.

REFERENCES
62
[17] Kim, J.D. and I.H.Choi, “Micro surface phenomenon of ductile cutting in the ultrasonic
vibration cutting of optical plastics”, Journal of Materials Processing Technology, 68, 1997,
pp 89-98.
[18] Klocke, F. and O.Rubenach, “Ultrasonic–assisted diamond turning of glass and steel”,
Industrial Diamond Review. 60, 2000, pp 227-239.
[19] Skelton, R.C., “Effect of ultrasonic vibration on the turning process”, International
Journal of Machine Tool Design and Research, 9, 1969, pp. 363-374.
[20] Zhong, Z.W. and G. Lin, “Diamond Turning of a Metal Matrix Composite with
Ultrasonic Vibrations”. Materials and Manufacturing Processes, 20, 2005, pp 727-735.
[21] Zhong, Z.W. and G. Lin, “Ultrasonic assisted turning of an aluminium-based metal
matrix composite reinforced with SiC particles”. The International Journal of Advanced
Manufacturing Technology, 27, 2005, pp 1077-1081.
[22] Liu, K., X.P. Li, and M. Rahman, “Characteristics of ultrasonic vibration-assisted ductile
mode cutting of tungsten carbide”. The International Journal of Advanced Manufacturing
Technology, 35, 2008, pp 833-841.
[23] Chen, J., G.Tian, Y.Chi, M.Liu, D.Shan and Y.Liu, “Surface Roughness and
Microstructure in Ultrasonically Assisted Turning of W-Fe-Ni Alloy”, Journal of Materials
Processing Technology, 199, 2008, pp 441-444.
[24] Hsu, C., Y. Lin, W. Lee, and S. Lo, “Machining characteristics of Inconel 718 using
ultrasonic and high temperature-aided cutting”, Journal of Materials Processing Technology,
198, 2008, pp 359-365.
[25] Nath, C., and M. Rahman, “Effect of machining parameters in ultrasonic vibration
cutting”, International Journal of Machine Tools and Manufacture, 48, 2008, pp 965-974.
[26] Jiao, F., X. Liu, C.Y. Zhao, and X. Zhang, “Experimental Study on the Surface Micro-
Geometrical Characteristics of Quenched Steel in Ultrasonic Assisted Turning”, Advanced
Materials Research, 189, 2011, pp 4059-4063.
[27] Cheng X. and X.Ma, “Microstructure Analysis of SiCp / Al Composites with Ultrasonic
Vibration Turning”, International Conference on Biomedical Engineering and Informatics, 3,
2010, pp 2321-2324.
[28] Childs, T., K.Maekawa, T.Obikawa, and Y.Yamane, “Metal machining theory and
application”, Arnold, London,2000.
[29] Trent, E. and P.Wright, “Metal cutting”, Butterworth-Heinemann, London, 2000.
[30] Ceretti, E.,M.Lucchi and T.Alan “FEM simulation of orthogonal cutting; serrated chip
formation”, Journal of Materials Processing Technology, 95, 1999, pp 95-99.

REFERENCES
63
[31] Anagonye, A. and D. Stephenson, “Modelling cutting temperature for turning inserts
with various tool geometries and materials”, Transaction. ASME. Journal of Manufacturing
Science and Engineering , 124, 2002, pp 78-85.
[32] Pantale, O., J.L.Bacaria, O.Dalverny, R.Rakotomalala and S.Capera “2D and 3D
numerical models of metal cutting with damage effects”, Computational method for Applied
Mechanical Engineering, 193, 2004, pp 134-139. [33] Strenkowski, J., Shih, A & Lin, J, “An analytical finite element model for predicting
three dimensional tool force and chip flow”, International, Journal of Machine Tool and
Manufacturing, 42, 2002, pp, 67-73.
[34] Ramesh, M. K.N. Seetharamu, N. Ganesan and G. Kuppuswamy, “Finite element
modeling of heat transfer analysis in machining of isotropic materials”, International Journal
of Heat and Mass Transfer, 42, 1999, pp 1569–1583.
[35] Mitrofanov, A., Babitsky, V. and V. Silberschmidt, “Finite element simulations of
ultrasonically assisted turning”, Computational Materials Science, 28, 2003, pp 3-4.
[36] Mitrofanov, A., V.Babitsky and V.Silberschmidt, “Finite element modeling of
ultrasonically assisted turning of Inconel 718”, Journal of Materials Processing Technology,
153-154, 2004, pp 233-239.
[37] Mitrofanov, A., N.Ahmed, V. Babitsky and V. Silberschmidt, “Thermomechanical finite
element simulations of ultrasonically assisted turning”, Computational Materials Science, 32,
2005, pp 463-471.
[38] Mitrofanov, A., N.Ahmed, V. Babitsky and V. Silberschmidt, “Effect of lubrication and
cutting parameters on ultrasonically assisted turning of Inconel718”, Journal of Materials
Processing Technology, 163, 2005, pp 649-654.
[39] Ahmed, N., A.Mitrofanov, V. Babitsky and V. Silberschmidt, “Analysis of material
response to ultrasonic vibration loading in turning Inconel718”, Materials Science and
Engineering, 424, 2006. pp 318-325.
[40] Amini, S., H.Soleimanimehr, M.J.Nategh, A.Abudolah and M.H.Sadeghi, “FEM
analysis of ultrasonic vibration-assisted turning and the vibratory tool”, journal of material
Processing Technology,201, 2008, pp.43-47.
[41] Klocke, F.,H. Kratz, “Advanced tool-edge geometry for high-precision hard
turning”,CIRP Annals, 54, 2005; pp 47–50.
[42] Adachi, K., N. Arai, S. Harada, K.Okita and S.Wakisaka, “A study on burr in low
frequency vibratory drilling of aluminum”, Surface Metrology, Measurement Science and
Technology, 8, 1997, pp. 955-972
REFERENCES
64
[43] Wu, Y. and Y.Fan, “Develop an ultrasonic elliptical vibration shoe center less
technique”, Journal of Materials Processing Technology, 156, 2004, pp 1780-1787.
[44] Berlh, D.E., and T.A.Dow, “Review of vibration-assisted machining”, Precision
Engineering,32, 2008, pp. 153-172.
[45] Roark, R.J. and W.C. Young, “Formulas for stress and strain”, 5th ed., McGraw-Hill,
NY, 1975.
[46] ANSYS® 12.0 User guides.
[47] Myers R. and D. Montgomery., “Response Surface Methodology, Process and Product
Optimization Using Designed Experiments”. Wiley, New York, 1995.
[48] Minitab®15.0 User guides.
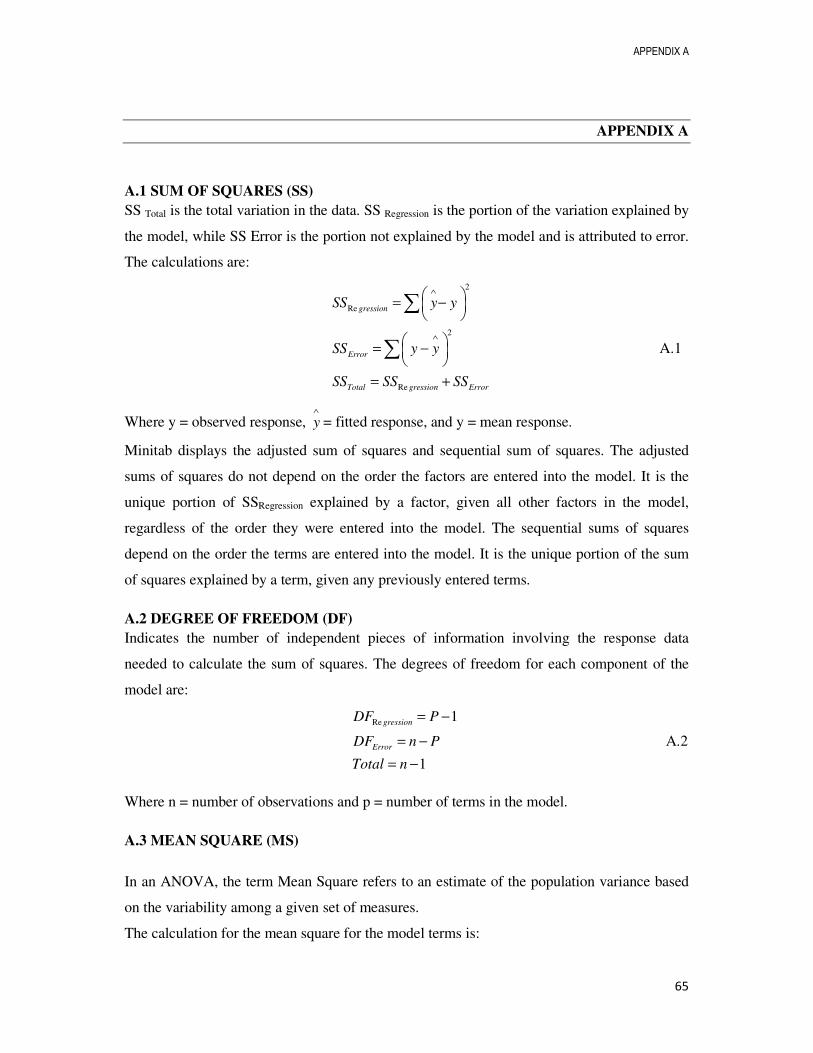
APPENDIX A
65
APPENDIX A
A.1 SUM OF SQUARES (SS)
SS Total is the total variation in the data. SS Regression is the portion of the variation explained by
the model, while SS Error is the portion not explained by the model and is attributed to error.
The calculations are:
2
Re
2
Re
gression
Error
Total gression Error
SS y y
SS y y
SS SS SS
∧
∧
= −
= −
= +
∑
∑ A.1
Where y = observed response, y∧
= fitted response, and y = mean response.
Minitab displays the adjusted sum of squares and sequential sum of squares. The adjusted
sums of squares do not depend on the order the factors are entered into the model. It is the
unique portion of SSRegression explained by a factor, given all other factors in the model,
regardless of the order they were entered into the model. The sequential sums of squares
depend on the order the terms are entered into the model. It is the unique portion of the sum
of squares explained by a term, given any previously entered terms.
A.2 DEGREE OF FREEDOM (DF)
Indicates the number of independent pieces of information involving the response data
needed to calculate the sum of squares. The degrees of freedom for each component of the
model are:
Re 1
1
gression
Error
DF P
DF n P
Total n
= −
= −
= −
A.2
Where n = number of observations and p = number of terms in the model.
A.3 MEAN SQUARE (MS)
In an ANOVA, the term Mean Square refers to an estimate of the population variance based
on the variability among a given set of measures.
The calculation for the mean square for the model terms is:
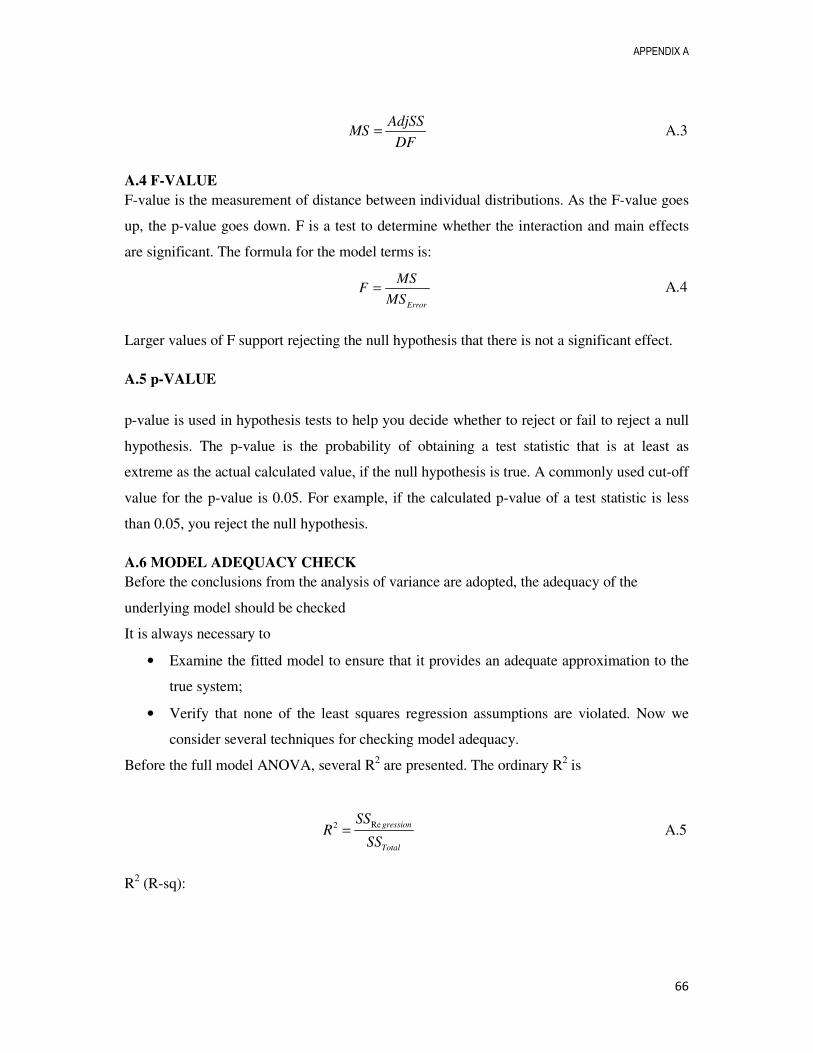
APPENDIX A
66
AdjSS
MSDF
= A.3
A.4 F-VALUE
F-value is the measurement of distance between individual distributions. As the F-value goes
up, the p-value goes down. F is a test to determine whether the interaction and main effects
are significant. The formula for the model terms is:
Error
MSF
MS= A.4
Larger values of F support rejecting the null hypothesis that there is not a significant effect.
A.5 p-VALUE
p-value is used in hypothesis tests to help you decide whether to reject or fail to reject a null
hypothesis. The p-value is the probability of obtaining a test statistic that is at least as
extreme as the actual calculated value, if the null hypothesis is true. A commonly used cut-off
value for the p-value is 0.05. For example, if the calculated p-value of a test statistic is less
than 0.05, you reject the null hypothesis.
A.6 MODEL ADEQUACY CHECK
Before the conclusions from the analysis of variance are adopted, the adequacy of the
underlying model should be checked
It is always necessary to
• Examine the fitted model to ensure that it provides an adequate approximation to the
true system;
• Verify that none of the least squares regression assumptions are violated. Now we
consider several techniques for checking model adequacy.
Before the full model ANOVA, several R2 are presented. The ordinary R2 is
Re2 gression
Total
SSR
SS= A.5
R2 (R-sq):

APPENDIX A
67
2 1 Error
Total
SSR
SS= − A.6
Another presentation of the formula is:
Re2 gression
Total
SSR
SS= A.7
R2 can also be calculated as the Correlation 2( , )Y y∧
Adjusted R2 (R-sq Adj):
Adjusted R2 accounts for the number of factors in your model. The formula is:
2 ( )
/Total Total
MS ErrorR
SS DF= A.8

BIODATA
68
BIODATA
BIKASH CHANDRA BEHERA
S/o-Mr.Damodar Behera & Miss. Satyabhama Behera
Correspondence:
Department of Mechanical Engineering,
National Institute of Technology Rourkela,
Rourkela – 769 008, Odisha, India.
Ph: +91 9439782840
E-mail: [email protected], [email protected]
Web: www.bikashbehera.co.nr
Qualification
Master of Technology (Mechanical Engineering)
NIT Rourkela, [Continuing]
Bachelor of Engineering (Mechanical Engineering)
BPUT (Orissa)
Professional Experience
Project Fellow, NIT Rourkela
Permanent Address:
At-Tentulimal, Po-Aghirapada
Via-Oupada, Dist-Balasore
State-Odisha, India
Pin-756049