development and optimization of in-situ forming ...japsonline.com/admin/php/uploads/2528_pdf.pdf ·...
TRANSCRIPT
© 2018 Deepak N. Kapoor et al. This is an open access article distributed under the terms of the Creative Commons Attribution License -NonCommercial-
ShareAlikeUnported License (http://creativecommons.org/licenses/by-nc-sa/3.0/).
Journal of Applied Pharmaceutical Science Vol. 8 (01), pp. 59-72, January, 2018 Available online at http://www.japsonline.com DOI: 10.7324/JAPS.2018.8110
ISSN 2231-3354
Development and optimization of in-situ forming microparticles for
long term controlled delivery of deslorelin acetate
Deepak N. Kapoor
1*, Om Prakash Katare
2, Hemlata Kaurav
1, Sanju Dhawan
2
1School of Pharmaceutical Sciences, Shoolini University of Biotechnology and Management Sciences, Solan, H.P., India.
2UGC-CAS, University Institute of Pharmaceutical Sciences, Panjab University, Chandigarh, India.
ARTICLE INFO
ABSTRACT
Article history:
Received on: 21/07/2017
Accepted on: 30/09/2017
Available online: 28/01/2018
Deslorelin is a nonapeptide analogue of the natural gonadotropin releasing hormone or luteinizing hormone
releasing hormone used to treat prostate cancer, endometriosis and uterine fibroids. In-situ forming
microparticles were developed for deslorelin using smart, biodegradable polymer i.e. PLGA. Response surface,
I-optimal design were used to design, formulate and characterize different formulations of deslorelin. To
determine the optimized formulation, numerical and graphical optimization techniques were employed. The
resulting optimized formulation was evaluated for other physicochemical parameters viz., rheology, particle size
distribution, surface morphology of the particles, peptide conformation stability in the formulation and stability
study at different environmental conditions. It was concluded that the optimized deslorelin acetate ISFM
formulation effectively extended the peptide release for 30 days while maintaining its conformational stability
during the period of study. The optimized ISFM formulation was found to be stable at 5°C ± 2°C and 25°C ±
2°C during 6 months stability studies.
Key words:
PLGA, Implants, Optimal
Design, Peptide and Protein
Delivery.
INTRODUCTION
Unlike conventional small molecules, therapeutic
proteins are difficult to be administered orally because they are
liable to degradation by the harsh gastric environment, hepatic
metabolism and short half-lives thereby necessitating frequent
administration of high doses by parenteral route (Cleland et al.,
2001; Fu et al., 2000; Robinson and Talmadge, 2002). This may
lead to major compliance issues in case of geriatric and pediatric
patients on replacement therapy. To improve the patient
compliance and convenience, prefilled syringes, needleless
injectors, auto injectors, pen devices and syringe injectors have
been introduced in the market (Arslanoglu et al., 2000; Oberye et
al., 2000). However, even these modified and improved versions
have their own limitations like higher cost and complex
manufacturing process. Moreover, they do not address the
requirement for decrease in the dosing frequency.
* Corresponding Author
Deepak N Kapoor, School of Pharmaceutical Sciences, Shoolini
University of Biotechnology and Management Sciences, Solan-173212,
H.P., India. Email: deepakpharmatech @ gmail.com
Deslorelin is a luteinizing hormone releasing hormone
(LHRH)/Gonadotropin releasing hormone (GnRH) analogue which
is 144 times more potent than the native LHRH/GnRH (Suprelorin,
2010). It is used to treat prostate cancer, endometriosis, uterine
fibroids, precocious puberty and breast cancer (Kiesel et al., 2002).
Treatment with GnRH or its agonists require long term therapy
primarily by parenteral route (i.v., s.c. or i.m.) since these peptides
are vulnerable to gastrointestinal peptidase degradation which
makes them inappropriate for oral administration with only 0.1%
bioavailability (Conn and Crowley, 1991; Chrisp and Goa, 1990).
Intra-nasal administration of deslorelin is also ineffective and
inconstant, with only 4 to 21% being available relative to s.c. or
i.v. injection, necessitating frequent large doses (Gudmundsson et
al., 1984).
Phase-sensitive, in-situ forming injectable systems can be
used to achieve controlled release of peptides and proteins which
works on the principle of phase inversion and utilize solvent(s) and
a polymeric matrix (Okuma et al., 2001). It is prepared by
dissolving biodegradable polymers in biocompatible organic
solvents, forming a homogenous solution or a suspension
depending on its solubility (Wang et al., 2004).
60 Kapoor et al. / Journal of Applied Pharmaceutical Science 8 (01); 2018: 59-72
The drug loaded suspension or solution is injected
subcutaneously and forms an in-situ forming implant that slows
down the drug release over an extended period of time. These
systems consist of drug dissolved or dispersed in a biodegradable
polymer. When liquid composition is injected by i.m. or s.c. route,
diffusion of organic solvent takes place in the body fluids allowing
the water to penetrate into the polymer matrix, gradually replacing
the organic solvent. Consequently, phase separation and polymer
precipitation takes place resulting in the formation of solid
polymeric implant at the injection site which releases the drug in a
controlled manner (Al-Tahami et al., 2006). Drug release from the
implant thus formed is controlled by the properties of the polymer,
solvent and drug. Various ISFI based peptide and protein drug
delivery systems have been successfully commercialized e.g.,
Eligard®, an in-situ forming implant system for the controlled
delivery of a protein drug leuprolide acetate used in the treatment
of prostate cancer (Ravivarapu et al., 2000).
ISFI systems may however, present with some
limitations such as poor injectability because of highly viscous
polymer solution, burst release and poor reproducibility of the
drug release because of varied injection techniques and different
physiological conditions at implantable site. Thus, to overcome
these drawbacks, “in-situ forming microparticles” (ISFM), another
variation of an ISFI system has been reported (Kranz and
Bodmeier, 2007; Kranz et al., 2008). ISFM systems are based on
emulsification of a biodegradable polymer solution and a
continuous oil or aqueous phase. Once injected, polymer solution
droplets solidify to form microparticles in-situ. In ISFM, the
viscosity of the emulsion formed is low in comparison to pure
polymeric solution which reduces pain during injection and the
presence of an external oil phase also reduces initial burst release.
In addition, ISFM are multiparticulate systems that may reduce the
morphological dissimilarities of single unit implants and release
the drug in more consistent and reproducible manner (Luan et al.,
2006). Thus, in-situ forming systems could be explored for
controlled delivery of deslorelin acetate. Since, the normal human
dose of deslorelin is low i.e., 100 µgm/day, it was decided to
develop ISFM system of deslorelin for long term (30 days)
delivery.
MATERIALS ANDMETHODS
Materials
Deslorelin acetate was purchased from Bachem AG,
Bubendorf (Switzerland). PLGA (75:25) [poly (D,L-lactide-co-
glycolide)] having inherent viscosity 0.55-0.75 dl/g and resorption
time of 1-2 months was obtained from Lactel Absorbable
Polymers, Durect Corporation (USA). DMSO
(Dimethylsulfoxide), Iso propyl myristate, Peanut oil
(Pharmaceutical grade), span 80 and tween 80 were procured from
Loba Chemie Pvt. Ltd., Mumbai (India). Benzyl benzoate (BZ)
and Benzyl alcohol (BA), Triacetin (TR) were procured from SD
Fine Chem. Ltd., Mumbai (India). All other chemicals and
reagents were of AR grade.
Analytical method validation
The analysis of drug during preformulation studies was
carried out by UV spectroscopy. During optimization studies
HPLC method was used for the analysis of deslorelin. For UV
analysis, standard plot of concentration vs. absorbance for
deslorelin acetate was prepared in pH 7.4 phosphate buffer at λmax
280 nm. For HPLC analysis of deslorelin acetate, a modified
version of previously reported HPLC method was used (Kompella
and Dani, 1996; Kompella and Dani, 1997; Wood et al., 1998).
Method
The method was validated by determining linearity,
accuracy, precision, LOD and LOQ.
Chromatographic conditions
A Bondapack® C-18 column (250 x 4 mm i.d.) with a
particle diameter of 10 μm and a pore size of 125 Å from Waters®
was used. The mobile phase consisted of 30% acetonitrile and
70% HPLC grade water containing 0.1% trifluoroacetic acid. The
flow rate was 1 mL/min and the injection volume was 100 μL. The
analysis was carried out at a wavelength of 220 nm (Kompella and
Dani, 1996; Kompella and Dani, 1997; Wood et al., 1998).
Standard solution preparation
A set of 10 standard solutions containing deslorelin
acetate were prepared using deslorelin acetate stock solution (1000
μg/mL). The diluent used was mobile phase and concentrations of
prepared standard solutions were 1, 6, 15, 30, 60, 90, 120, 150,
180 and 300 μg/mL.
Validation of HPLC Method of analysis for deslorelin acetate
Linearity
Three sets of pure drug standards were prepared by
dissolving deslorelin acetate in the diluent to give concentrations
of 1 – 300 μg/mL. The samples were analyzed by HPLC. The data
was analyzed to determine whether a linear relationship existed
between the absorbance and concentration over the expected range
of concentrations in the analysis. Ratio of response to
concentration (sensitivity) vs log of concentration was plotted to
determine the linearity of the method (Kapil et al., 2009).
Accuracy
Quality control solutions of different concentrations viz.,
low (LQC: 15 μg/mL), medium (MQC: 90 μg/mL) and high
(HQC: 180 μg/mL) were prepared using stock solution of
deslorelin acetate followed by HPLC analysis. Accuracy was
measured as the percentage relative error and mean percentage
recovery (Kapil et al., 2009; Kapoor et al., 2012).
Precision
The intermediate precision was assessed by analyzing
three different concentrations (15, 90 and 180 μg/mL) of deslorelin
acetate on three different days for inter day variation (n=3). The
precision was determined from the RSD of predicted
Kapoor et al. / Journal of Applied Pharmaceutical Science 8 (01); 2018: 59-72 61
concentrations that were obtained from the regression equation.
The values of limit of quantitation (LOQ) and limit of detection
(LOD) of deslorelin were calculated using standard calibration
curve as 3.3 σ/S and 10 σ/S, respectively, where S is the slope of
the calibration curve and σ is the standard deviation of the
response (Kapil et al., 2009).
Preparation of In-situ Forming Microparticles (ISFM) of
deslorelin acetate
Different batches using different quantities of excipients
and same quantity of drug (1mg/100 mg formulation) were
prepared. For the preparation of different ISFM formulations,
PLGA (75:25) [poly (D,L-lactide-co-glycolide)], BA:BZ (30:70)
(Benzyl alcohol: Benzyl benzoate), DMTR (60:40) (Dimethyl
sulfoxide: Triacetin), peanut oil, Span 80 and aluminium
monostearate were selected as different components of the
formulation. Oil phase 2 (a solution of deslorelin acetate and
PLGA in the solvent mixture) was added drop wise from a syringe
to oil phase 1 (Peanut oil containing 2% Span 80 and 2.5%
aluminum monostearate) taken in a beaker. The mixture was
continuously homogenized at 10,000 rpm, using an Ultra
Turrax®
for 10 min, to form PLGA microglobules dispersed in the
continuous oil phase and stabilized by Span 80 & aluminium-
monostearate. The system thus obtained was termed as an ‘ISFM
system’ (Jain et al., 1998; Jain et al., 2000; Luan and Bodmeier,
2006). The capability of ISFM system to form microspheres in-situ
was confirmed in phosphate buffer solution (Jain et al., 2000). The
ISFM system was introduced into a 15 mL glass vial containing
pH 7.4 phosphate buffer and 0.1% Tween 80. A turbid white
dispersion of ‘suspended microparticles’ was formed that was
shaken on a water bath shaker at 37°C for 5 h. The suspension was
then filtered to separate the microparticles that were vacuum dried
to obtain ‘dried microspheres’.
Experimental Design and Optimization Studies
Design of Experiment (DoE) was applied to determine
the quantities and number of batches required to determine the
optimized deslorelin ISFM formulation. Accordingly, all the
formulations were prepared, responses measured and the results
analyzed using a DoE software Design Expert® ver. 8.0.1
(www.statease.com). Table 1 shows the factors and levels of the
independent variables that were evaluated.
Table 1: DoE factors and levels explored to prepare deslorelin ISFM
formulations.
Factors Type Levels
L1 (-1) L2 (+1)
PLGA Concentration (%) w.r.t.
internal phase O2 (X1)
Numeric 15 25
O1 / O2 w/w ratio (X2) Numeric 1:1 2:1
Solvent type (X3) Catagoric DMTR BABZ
A Response Surface I-optimal design was employed to
predict the optimal formulation. Response surface designs are
applied to quantify the relationships between one or more
measured responses and the vital input factors
(www.statease.com). An I-optimal design seeks to minimize the
integral of the prediction variance across the design space. I-
Optimal designs are best used with response surface analysis and
experiments that include both numeric as well as catagoric factors.
The design was assessed by quadratic model using the following
equation:
Y=β0 + β1X1+ β2X2 + β3X3 + β4 X1X2 + β5 X1X3 + β6X2X3 + β7X12 +
β8X22 + β9X3
2 … (1)
where, Y is the response variable, β0 the constant and β1, β2….β9are
the regression coefficients. X1, X2and X3 stand for the main effect,
X1X2, X1X3, X2X3 are the interaction terms and show how the
response changes when two factors are simultaneously changed.
X12, X2
2and X3
2 are quadratic terms of the independent variables to
evaluate the nonlinearity (Singh et al., 2004; Antony, 2003). One
way ANOVA and multiple linear response analysis (MLRA) was
used to generate the equation for each response parameter (Kapoor
et al., 2012). Constraints for the drug release at 1 day, 14 days and
30 days were set as minimum, 40-60 (medium) and maximum,
respectively.
Validation of optimization results
The optimized formulation was prepared and evaluated
for different response parameters. To validate the results,
practically obtained experimental values were compared with
predicted values obtained by optimization technique.
Evaluation of ISFM formulations
In vitro release studies
ISFM equivalent to 3 mg deslorelin acetate was injected
into 10 mL phosphate buffer pH 7.4, containing 0.1% sodium
azide and 0.1% Tween 80 maintained at 37°C and shaken in a
water bath shaker. Aliquots of release samples (n=3)were
withdrawn and replaced by fresh release media at 0.25, 0.5, 1, 2, 4,
6, 8, 10, 12, 14, 18, 22, 26 and 30 days. The deslorelin
concentration in the withdrawn samples was determined by HPLC
method. Cumulative percent drug release was calculated after
correcting the values for withdrawn sample (Singh and Singh,
1998). The in vitro drug release data obtained from ISFM systems
were fitted to various release kinetic models viz., zero-order, first-
order, Hixson-Crowell, Higuchi and Korsemeyer-Peppas
mathematical models (Higuchi, 1963; Korsemeyer et al., 1983;
Peppas and Sahlin, 1989).
Rheological studies
Rheological studies are mainly determine the relationship
between viscosity, shear stress and stress strain (Plaizier et al.,
1989). The shear strain exerted by the formulations due to the
application of shear stress was calculated using equation (Dhawan
et al., 2011):
… (2) strainShear
stressShearViscosity
62 Kapoor et al. / Journal of Applied Pharmaceutical Science 8 (01); 2018: 59-72
Drug loading and encapsulation efficiency
Weighed quantities of dried microparticles were
solubilize in methylene chloride under vigorous vortexing.
Phosphate buffer pH 7.4 was added to the methylene chloride and
the samples were agitated to extract drug in the aqueous phase and
to evaporate methylene chloride. The precipitated polymer in the
buffer was separated by ultracentrifugation at 10,000 rpm and the
drug in the aqueous supernatant was analyzed using UV
spectrophotometer (Koushik et al., 2004). The percent
encapsulation efficiency was calculated using the following
equation:
Encapsulation Efficiency (%) = … (3)
Particle size distribution
Particle size distribution of formed, suspended deslorelin
microparticles was determined by using Malvern Mastersizer.
Dispersion of ‘suspended microparticles’ was sonicated on a bath
sonicator for 5 min to uniformly disperse the particles. The
redispersed sample was used for particle size analysis.
Surface morphology
The shape and surface characteristics of ISFM was
assessed using images obtained by optical microscopy and
transmission electron microscopy (Jain et al., 2000). For
transmission electron microscopy (TEM), a drop of suspended
microparticles was placed on copper electron microscopy grid.
Excess sample was removed by using filter paper after 30 sec. The
sample was air dried and examined by TEM (Shen et al., 2008;
Bansal et al., 2011).
DSC and FTIR
The Differential Scanning Calorimetry (DSC) analysis
for different samples was carried out to determine glass transition
temperature (Tg). The FTIR spectra of different samples were
obtained in the frequency range of 500 – 4000 cm-1
which were
compared with FTIR spectra of pure drug to determine any
interaction of the drug with other excipients used in the
formulation.
Conformation stability by CD spectroscopy (Circular Dichroism)
The samples collected from in vitro release studies were
screened for conformational stability using CD spectroscopy
(Kapil et al., 2009). Spectra were collected at 25°C using a 0.1 cm
cell over the wavelength range of 190 – 250 nm. The absorbance
obtained was plotted against the respective wavelength for both
the samples and the plots were compared for conformational
stability of proteins (Dhawan et al., 2009; Dhawan et al., 2011).
Stability studies
Stability study of the final formulation was carried out at
accelerated and long term conditions of temperature and humidity
(25°C ± 2°C/ 60% ± 5% RH; 5°C ± 2°C) for 6 months (WHO)
(ICHQ1F). At predetermined intervals (0, 1, 3 and 6 months),
samples were withdrawn and analyzed for various performance
parameters i.e., drug content, viscosity and drug release (Kapoor et
al., 2012).
RESULTS AND DISCUSSION
Validation of HPLC method of analysis for deslorelin acetate
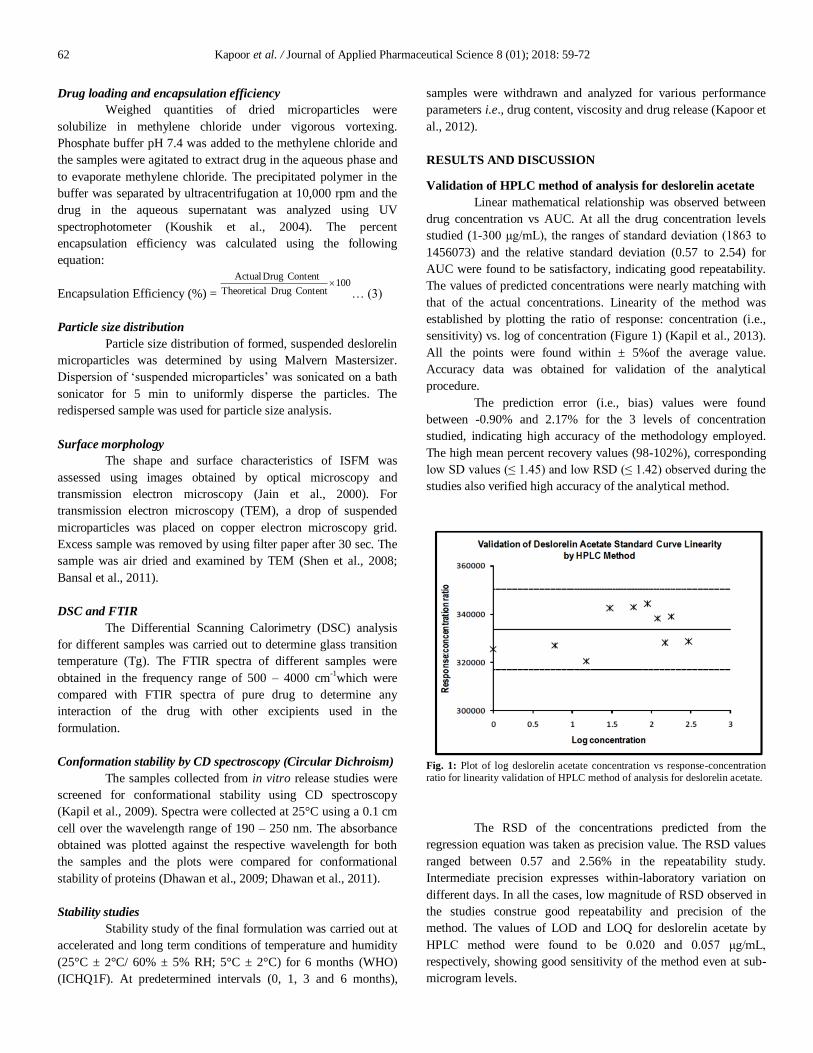
Linear mathematical relationship was observed between
drug concentration vs AUC. At all the drug concentration levels
studied (1-300 μg/mL), the ranges of standard deviation (1863 to
1456073) and the relative standard deviation (0.57 to 2.54) for
AUC were found to be satisfactory, indicating good repeatability.
The values of predicted concentrations were nearly matching with
that of the actual concentrations. Linearity of the method was
established by plotting the ratio of response: concentration (i.e.,
sensitivity) vs. log of concentration (Figure 1) (Kapil et al., 2013).
All the points were found within ± 5%of the average value.
Accuracy data was obtained for validation of the analytical
procedure.
The prediction error (i.e., bias) values were found
between -0.90% and 2.17% for the 3 levels of concentration
studied, indicating high accuracy of the methodology employed.
The high mean percent recovery values (98-102%), corresponding
low SD values (≤ 1.45) and low RSD (≤ 1.42) observed during the
studies also verified high accuracy of the analytical method.
Fig. 1: Plot of log deslorelin acetate concentration vs response-concentration
ratio for linearity validation of HPLC method of analysis for deslorelin acetate.
The RSD of the concentrations predicted from the
regression equation was taken as precision value. The RSD values
ranged between 0.57 and 2.56% in the repeatability study.
Intermediate precision expresses within-laboratory variation on
different days. In all the cases, low magnitude of RSD observed in
the studies construe good repeatability and precision of the
method. The values of LOD and LOQ for deslorelin acetate by
HPLC method were found to be 0.020 and 0.057 μg/mL,
respectively, showing good sensitivity of the method even at sub-
microgram levels.
100Content Drug lTheoretica
Content Drug Actual
Kapoor et al. / Journal of Applied Pharmaceutical Science 8 (01); 2018: 59-72 63
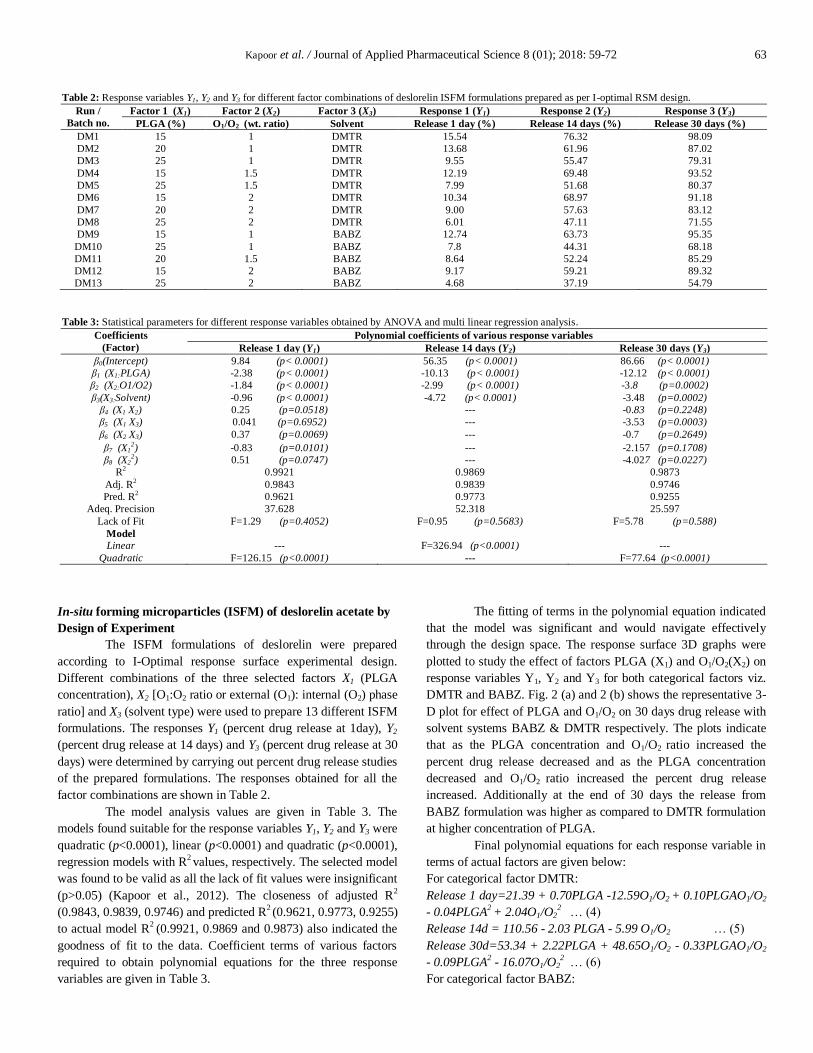
In-situ forming microparticles (ISFM) of deslorelin acetate by
Design of Experiment
The ISFM formulations of deslorelin were prepared
according to I-Optimal response surface experimental design.
Different combinations of the three selected factors X1 (PLGA
concentration), X2 [O1:O2 ratio or external (O1): internal (O2) phase
ratio] and X3 (solvent type) were used to prepare 13 different ISFM
formulations. The responses Y1 (percent drug release at 1day), Y2
(percent drug release at 14 days) and Y3 (percent drug release at 30
days) were determined by carrying out percent drug release studies
of the prepared formulations. The responses obtained for all the
factor combinations are shown in Table 2.
The model analysis values are given in Table 3. The
models found suitable for the response variables Y1, Y2 and Y3 were
quadratic (p<0.0001), linear (p<0.0001) and quadratic (p<0.0001),
regression models with R2 values, respectively. The selected model
was found to be valid as all the lack of fit values were insignificant
(p>0.05) (Kapoor et al., 2012). The closeness of adjusted R2
(0.9843, 0.9839, 0.9746) and predicted R2 (0.9621, 0.9773, 0.9255)
to actual model R2
(0.9921, 0.9869 and 0.9873) also indicated the
goodness of fit to the data. Coefficient terms of various factors
required to obtain polynomial equations for the three response
variables are given in Table 3.
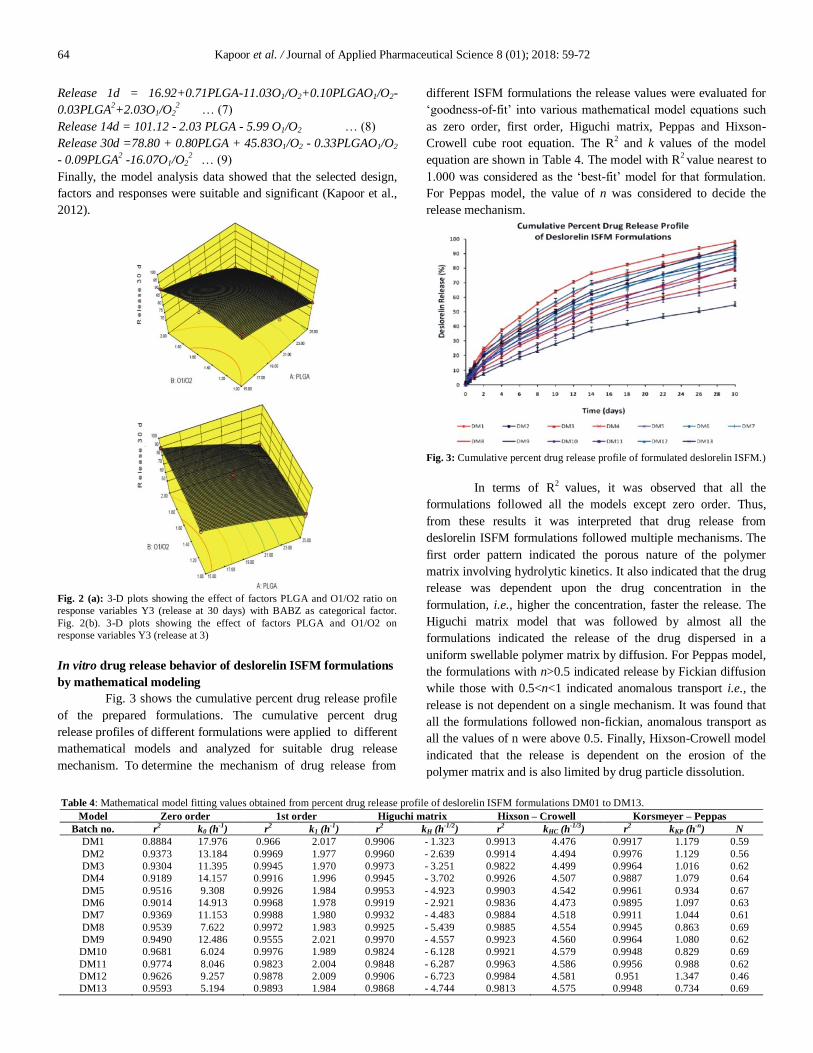
The fitting of terms in the polynomial equation indicated
that the model was significant and would navigate effectively
through the design space. The response surface 3D graphs were
plotted to study the effect of factors PLGA (X1) and O1/O2(X2) on
response variables Y1, Y2 and Y3 for both categorical factors viz.
DMTR and BABZ. Fig. 2 (a) and 2 (b) shows the representative 3-
D plot for effect of PLGA and O1/O2 on 30 days drug release with
solvent systems BABZ & DMTR respectively. The plots indicate
that as the PLGA concentration and O1/O2 ratio increased the
percent drug release decreased and as the PLGA concentration
decreased and O1/O2 ratio increased the percent drug release
increased. Additionally at the end of 30 days the release from
BABZ formulation was higher as compared to DMTR formulation
at higher concentration of PLGA.
Final polynomial equations for each response variable in
terms of actual factors are given below:
For categorical factor DMTR:
Release 1 day=21.39 + 0.70PLGA -12.59O1/O2 + 0.10PLGAO1/O2
- 0.04PLGA2 + 2.04O1/O2
2 … (4)
Release 14d = 110.56 - 2.03 PLGA - 5.99 O1/O2 … (5)
Release 30d=53.34 + 2.22PLGA + 48.65O1/O2 - 0.33PLGAO1/O2
- 0.09PLGA2 - 16.07O1/O2
2 … (6)
For categorical factor BABZ:
Table 2: Response variables Y1, Y2 and Y3 for different factor combinations of deslorelin ISFM formulations prepared as per I-optimal RSM design.
Run /
Batch no.
Factor 1 (X1) Factor 2 (X2) Factor 3 (X3) Response 1 (Y1) Response 2 (Y2) Response 3 (Y3)
PLGA (%) O1/O2 (wt. ratio) Solvent Release 1 day (%) Release 14 days (%) Release 30 days (%)
DM1 15 1 DMTR 15.54 76.32 98.09
DM2 20 1 DMTR 13.68 61.96 87.02
DM3 25 1 DMTR 9.55 55.47 79.31
DM4 15 1.5 DMTR 12.19 69.48 93.52
DM5 25 1.5 DMTR 7.99 51.68 80.37
DM6 15 2 DMTR 10.34 68.97 91.18
DM7 20 2 DMTR 9.00 57.63 83.12
DM8 25 2 DMTR 6.01 47.11 71.55
DM9 15 1 BABZ 12.74 63.73 95.35
DM10 25 1 BABZ 7.8 44.31 68.18
DM11 20 1.5 BABZ 8.64 52.24 85.29
DM12 15 2 BABZ 9.17 59.21 89.32
DM13 25 2 BABZ 4.68 37.19 54.79
Table 3: Statistical parameters for different response variables obtained by ANOVA and multi linear regression analysis.
Coefficients
(Factor)
Polynomial coefficients of various response variables
Release 1 day (Y1) Release 14 days (Y2) Release 30 days (Y3)
β0(Intercept) 9.84 (p< 0.0001) 56.35 (p< 0.0001) 86.66 (p< 0.0001)
β1 (X1:PLGA) -2.38 (p< 0.0001) -10.13 (p< 0.0001) -12.12 (p< 0.0001)
β2 (X2:O1/O2) -1.84 (p< 0.0001) -2.99 (p< 0.0001) -3.8 (p=0.0002)
β3(X3:Solvent) -0.96 (p< 0.0001) -4.72 (p< 0.0001) -3.48 (p=0.0002)
β4 (X1 X2) 0.25 (p=0.0518) --- -0.83 (p=0.2248)
β5 (X1 X3) 0.041 (p=0.6952) --- -3.53 (p=0.0003)
β6 (X2 X3) 0.37 (p=0.0069) --- -0.7 (p=0.2649)
β7 (X12) -0.83 (p=0.0101) --- -2.157 (p=0.1708)
β8 (X22) 0.51 (p=0.0747) --- -4.027 (p=0.0227)
R2 0.9921 0.9869 0.9873
Adj. R2 0.9843 0.9839 0.9746
Pred. R2 0.9621 0.9773 0.9255
Adeq. Precision 37.628 52.318 25.597
Lack of Fit F=1.29 (p=0.4052) F=0.95 (p=0.5683) F=5.78 (p=0.588)
Model
Linear --- F=326.94 (p<0.0001) ---
Quadratic F=126.15 (p<0.0001) --- F=77.64 (p<0.0001)
64 Kapoor et al. / Journal of Applied Pharmaceutical Science 8 (01); 2018: 59-72
Release 1d = 16.92+0.71PLGA-11.03O1/O2+0.10PLGAO1/O2-
0.03PLGA2+2.03O1/O2
2 … (7)
Release 14d = 101.12 - 2.03 PLGA - 5.99 O1/O2 … (8)
Release 30d =78.80 + 0.80PLGA + 45.83O1/O2 - 0.33PLGAO1/O2
- 0.09PLGA2 -16.07O1/O2
2 … (9)
Finally, the model analysis data showed that the selected design,
factors and responses were suitable and significant (Kapoor et al.,
2012).
Fig. 2 (a): 3-D plots showing the effect of factors PLGA and O1/O2 ratio on
response variables Y3 (release at 30 days) with BABZ as categorical factor.
Fig. 2(b). 3-D plots showing the effect of factors PLGA and O1/O2 on
response variables Y3 (release at 3)
In vitro drug release behavior of deslorelin ISFM formulations
by mathematical modeling
Fig. 3 shows the cumulative percent drug release profile
of the prepared formulations. The cumulative percent drug
release profiles of different formulations were applied to different
mathematical models and analyzed for suitable drug release
mechanism. To determine the mechanism of drug release from
different ISFM formulations the release values were evaluated for
‘goodness-of-fit’ into various mathematical model equations such
as zero order, first order, Higuchi matrix, Peppas and Hixson-
Crowell cube root equation. The R2 and k values of the model
equation are shown in Table 4. The model with R2 value nearest to
1.000 was considered as the ‘best-fit’ model for that formulation.
For Peppas model, the value of n was considered to decide the
release mechanism.
Fig. 3: Cumulative percent drug release profile of formulated deslorelin ISFM.)
In terms of R2
values, it was observed that all the
formulations followed all the models except zero order. Thus,
from these results it was interpreted that drug release from
deslorelin ISFM formulations followed multiple mechanisms. The
first order pattern indicated the porous nature of the polymer
matrix involving hydrolytic kinetics. It also indicated that the drug
release was dependent upon the drug concentration in the
formulation, i.e., higher the concentration, faster the release. The
Higuchi matrix model that was followed by almost all the
formulations indicated the release of the drug dispersed in a
uniform swellable polymer matrix by diffusion. For Peppas model,
the formulations with n>0.5 indicated release by Fickian diffusion
while those with 0.5<n<1 indicated anomalous transport i.e., the
release is not dependent on a single mechanism. It was found that
all the formulations followed non-fickian, anomalous transport as
all the values of n were above 0.5. Finally, Hixson-Crowell model
indicated that the release is dependent on the erosion of the
polymer matrix and is also limited by drug particle dissolution.
Table 4: Mathematical model fitting values obtained from percent drug release profile of deslorelin ISFM formulations DM01 to DM13.
Model Zero order 1st order Higuchi matrix Hixson – Crowell Korsmeyer – Peppas
Batch no. r2 k0 (h
-1) r
2 k1 (h
-1) r
2 kH (h
-1/2) r
2 kHC (h
-1/3) r
2 kKP (h
-n) N
DM1 0.8884 17.976 0.966 2.017 0.9906 - 1.323 0.9913 4.476 0.9917 1.179 0.59
DM2 0.9373 13.184 0.9969 1.977 0.9960 - 2.639 0.9914 4.494 0.9976 1.129 0.56
DM3 0.9304 11.395 0.9945 1.970 0.9973 - 3.251 0.9822 4.499 0.9964 1.016 0.62
DM4 0.9189 14.157 0.9916 1.996 0.9945 - 3.702 0.9926 4.507 0.9887 1.079 0.64
DM5 0.9516 9.308 0.9926 1.984 0.9953 - 4.923 0.9903 4.542 0.9961 0.934 0.67
DM6 0.9014 14.913 0.9968 1.978 0.9919 - 2.921 0.9836 4.473 0.9895 1.097 0.63
DM7 0.9369 11.153 0.9988 1.980 0.9932 - 4.483 0.9884 4.518 0.9911 1.044 0.61
DM8 0.9539 7.622 0.9972 1.983 0.9925 - 5.439 0.9885 4.554 0.9945 0.863 0.69
DM9 0.9490 12.486 0.9555 2.021 0.9970 - 4.557 0.9923 4.560 0.9964 1.080 0.62
DM10 0.9681 6.024 0.9976 1.989 0.9824 - 6.128 0.9921 4.579 0.9948 0.829 0.69
DM11 0.9774 8.046 0.9823 2.004 0.9848 - 6.287 0.9963 4.586 0.9956 0.988 0.62
DM12 0.9626 9.257 0.9878 2.009 0.9906 - 6.723 0.9984 4.581 0.951 1.347 0.46
DM13 0.9593 5.194 0.9893 1.984 0.9868 - 4.744 0.9813 4.575 0.9948 0.734 0.69
Kapoor et al. / Journal of Applied Pharmaceutical Science 8 (01); 2018: 59-72 65
Determination of optimal formulation
Numerical and graphical optimization techniques were
used to determine the optimized formulation. The constraints of X
and Y variables were adjusted to anticipated goals and examined
throughout the experimental domain to determine the formulations
achieving values nearest to the desired goals. Table 5 presents the
constraints, the resulting optimized solutions, and formulation
compositions with corresponding response and desirability values.
The results obtained by numeric optimization present the four best
solutions for two catagoric factors, DMTR and BABZ. The
solutions achieve the goal of maximum overall release and
minimum burst release at low to intermediate levels of PLGA
(15 to 20) and O1/O2 ratio (1.7 to 2). Among the four solutions,
solution 1 and 3 were selected because solution 1 contains BABZ
as solvent and provides higher percent drug release and
desirability as compared to solution 2. Solution 3 was selected as it
contained DMTR as solvent and had higher release and
desirability as compared to solution 4. Finally, the formulations
corresponding to solution 1 and 3 were selected as the optimum
formulation which had the values of response variables in the
desired range with desirability (Kapoor et al., 2012).
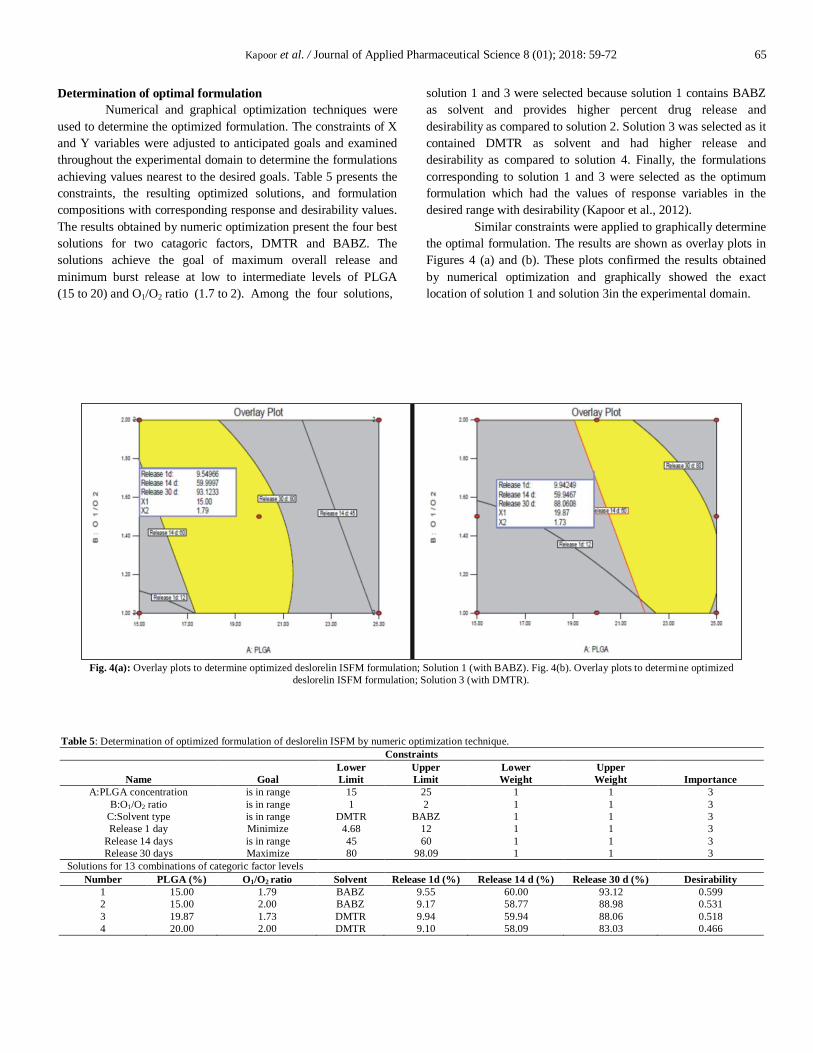
Similar constraints were applied to graphically determine
the optimal formulation. The results are shown as overlay plots in
Figures 4 (a) and (b). These plots confirmed the results obtained
by numerical optimization and graphically showed the exact
location of solution 1 and solution 3in the experimental domain.
Fig. 4(a): Overlay plots to determine optimized deslorelin ISFM formulation; Solution 1 (with BABZ). Fig. 4(b). Overlay plots to determine optimized
deslorelin ISFM formulation; Solution 3 (with DMTR).
Table 5: Determination of optimized formulation of deslorelin ISFM by numeric optimization technique.
Constraints
Name
Goal
Lower
Limit
Upper
Limit
Lower
Weight
Upper
Weight
Importance
A:PLGA concentration is in range 15 25 1 1 3
B:O1/O2 ratio is in range 1 2 1 1 3
C:Solvent type is in range DMTR BABZ 1 1 3
Release 1 day Minimize 4.68 12 1 1 3
Release 14 days is in range 45 60 1 1 3
Release 30 days Maximize 80 98.09 1 1 3
Solutions for 13 combinations of categoric factor levels
Number PLGA (%) O1/O2 ratio Solvent Release 1d (%) Release 14 d (%) Release 30 d (%) Desirability
1 15.00 1.79 BABZ 9.55 60.00 93.12 0.599
2 15.00 2.00 BABZ 9.17 58.77 88.98 0.531
3 19.87 1.73 DMTR 9.94 59.94 88.06 0.518
4 20.00 2.00 DMTR 9.10 58.09 83.03 0.466
66 Kapoor et al. / Journal of Applied Pharmaceutical Science 8 (01); 2018: 59-72
Evaluation of optimized deslorelin ISFM formulation
Validation of optimized results
The optimized formulations obtained by numeric and
graphical optimization were validated for their performance by
preparing three replicates of both the formulations (DO1 and DO2)
and determining their release. The contents of formulations DO1
and DO2 are shown in Table 6. Percent prediction error was
obtained by comparing predicted results with experimental results.
Table 7 shows the actual values, predicted values and percent
prediction error of response variables Y1 (percent release at 1 day),
Y2 (percent release at 14 days) and Y3 (percent release at 30 days)
for DO1 and DO2. From these results, it was observed that
formulation DO1 presented faster and most acceptable release rate
and pattern. Thus, formulation DO1 containing 15 % PLGA 75:25,
1.8:1 O1/O2 ratio and BABZ (30:70) as the solvent for internal
phase was selected as the optimized and validated formulation.
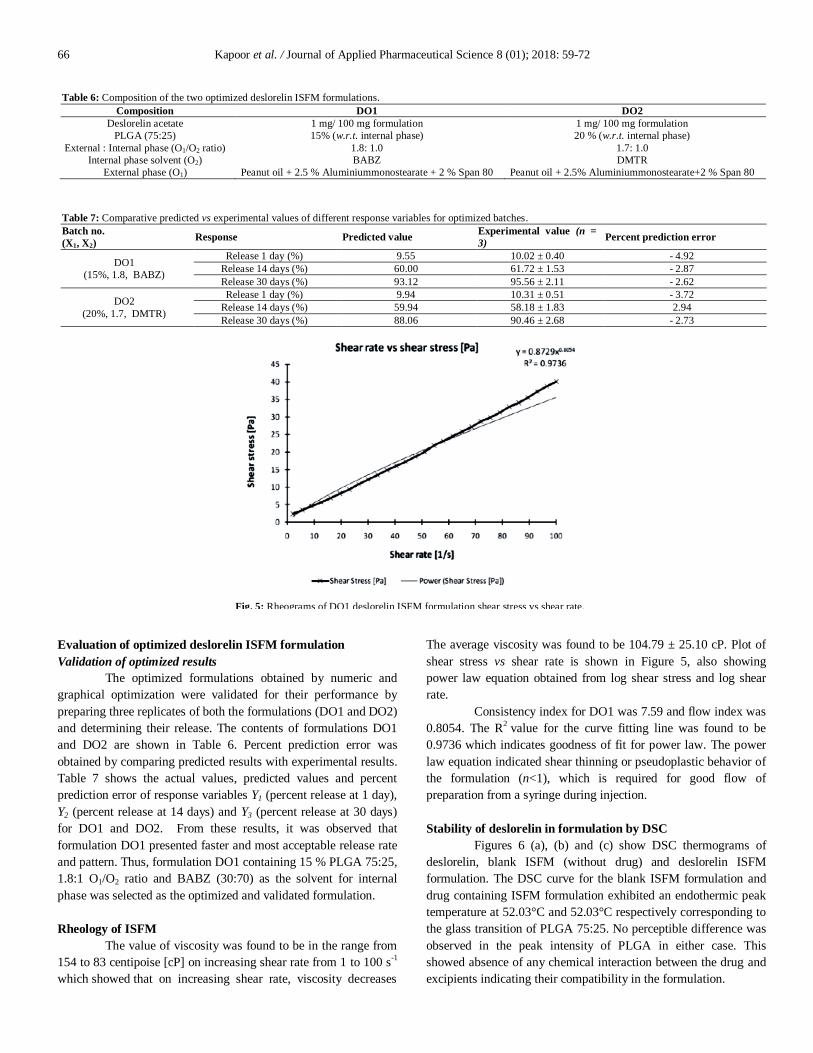
Rheology of ISFM
The value of viscosity was found to be in the range from
154 to 83 centipoise [cP] on increasing shear rate from 1 to 100 s-1
which showed that on increasing shear rate, viscosity decreases
The average viscosity was found to be 104.79 ± 25.10 cP. Plot of
shear stress vs shear rate is shown in Figure 5, also showing
power law equation obtained from log shear stress and log shear
rate.
Consistency index for DO1 was 7.59 and flow index was
0.8054. The R2
value for the curve fitting line was found to be
0.9736 which indicates goodness of fit for power law. The power
law equation indicated shear thinning or pseudoplastic behavior of
the formulation (n<1), which is required for good flow of
preparation from a syringe during injection.
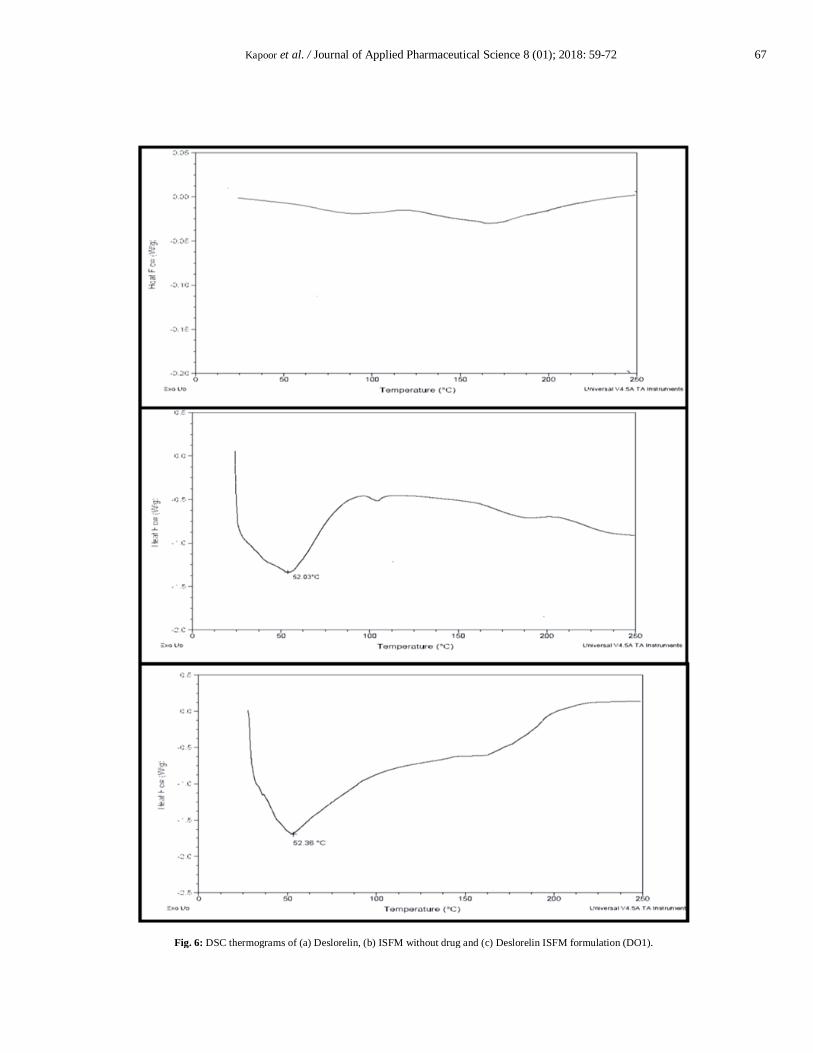
Stability of deslorelin in formulation by DSC
Figures 6 (a), (b) and (c) show DSC thermograms of
deslorelin, blank ISFM (without drug) and deslorelin ISFM
formulation. The DSC curve for the blank ISFM formulation and
drug containing ISFM formulation exhibited an endothermic peak
temperature at 52.03°C and 52.03°C respectively corresponding to
the glass transition of PLGA 75:25. No perceptible difference was
observed in the peak intensity of PLGA in either case. This
showed absence of any chemical interaction between the drug and
excipients indicating their compatibility in the formulation.
Table 6: Composition of the two optimized deslorelin ISFM formulations.
Composition DO1 DO2
Deslorelin acetate 1 mg/ 100 mg formulation 1 mg/ 100 mg formulation
PLGA (75:25) 15% (w.r.t. internal phase) 20 % (w.r.t. internal phase)
External : Internal phase (O1/O2 ratio) 1.8: 1.0 1.7: 1.0
Internal phase solvent (O2) BABZ DMTR
External phase (O1) Peanut oil + 2.5 % Aluminiummonostearate + 2 % Span 80 Peanut oil + 2.5% Aluminiummonostearate+2 % Span 80
Table 7: Comparative predicted vs experimental values of different response variables for optimized batches.
Batch no.
(X1, X2) Response Predicted value
Experimental value (n =
3) Percent prediction error
DO1
(15%, 1.8, BABZ)
Release 1 day (%) 9.55 10.02 ± 0.40 - 4.92
Release 14 days (%) 60.00 61.72 ± 1.53 - 2.87
Release 30 days (%) 93.12 95.56 ± 2.11 - 2.62
DO2
(20%, 1.7, DMTR)
Release 1 day (%) 9.94 10.31 ± 0.51 - 3.72
Release 14 days (%) 59.94 58.18 ± 1.83 2.94
Release 30 days (%) 88.06 90.46 ± 2.68 - 2.73
Fig. 5: Rheograms of DO1 deslorelin ISFM formulation shear stress vs shear rate.
Kapoor et al. / Journal of Applied Pharmaceutical Science 8 (01); 2018: 59-72 67
Fig. 6: DSC thermograms of (a) Deslorelin, (b) ISFM without drug and (c) Deslorelin ISFM formulation (DO1).
68 Kapoor et al. / Journal of Applied Pharmaceutical Science 8 (01); 2018: 59-72
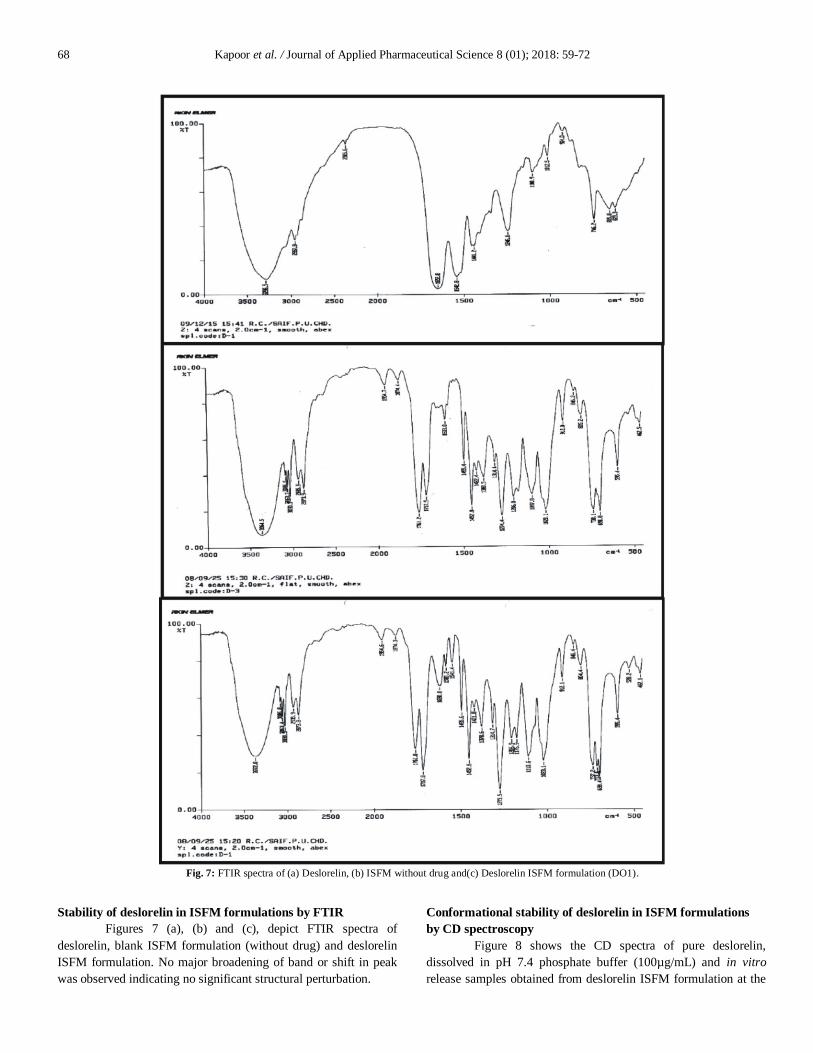
Stability of deslorelin in ISFM formulations by FTIR
Figures 7 (a), (b) and (c), depict FTIR spectra of
deslorelin, blank ISFM formulation (without drug) and deslorelin
ISFM formulation. No major broadening of band or shift in peak
was observed indicating no significant structural perturbation.
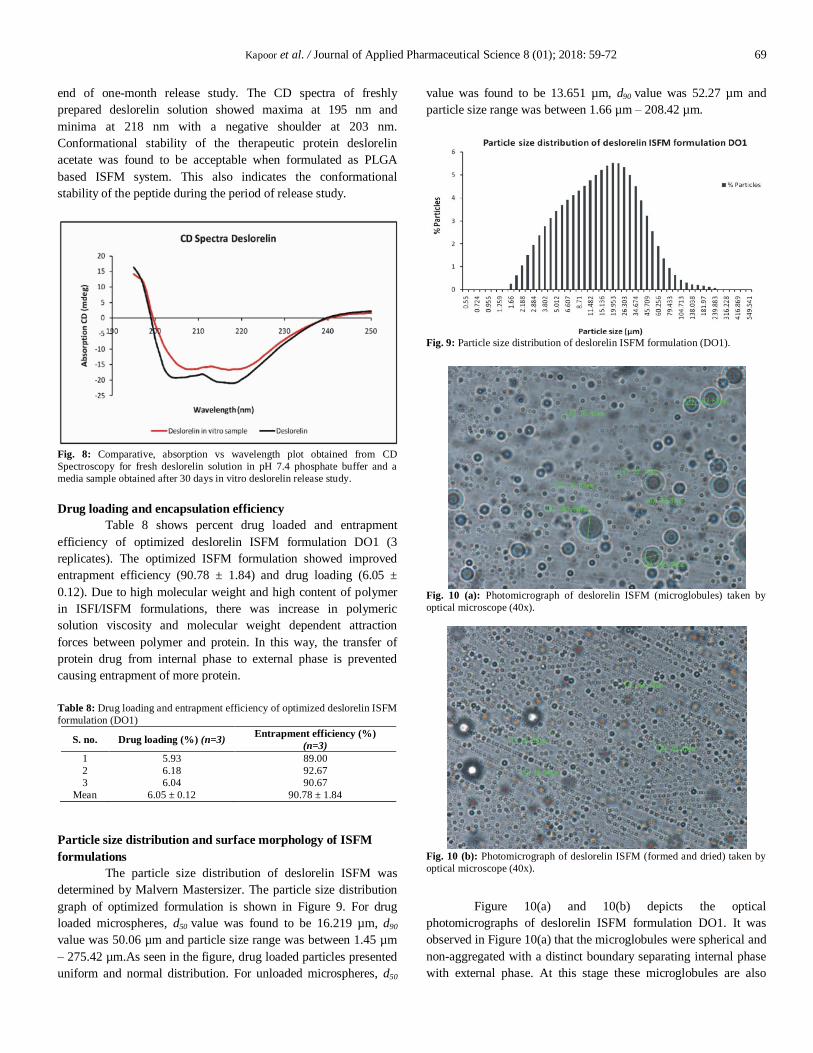
Conformational stability of deslorelin in ISFM formulations
by CD spectroscopy
Figure 8 shows the CD spectra of pure deslorelin,
dissolved in pH 7.4 phosphate buffer (100µg/mL) and in vitro
release samples obtained from deslorelin ISFM formulation at the
Fig. 7: FTIR spectra of (a) Deslorelin, (b) ISFM without drug and(c) Deslorelin ISFM formulation (DO1).
Kapoor et al. / Journal of Applied Pharmaceutical Science 8 (01); 2018: 59-72 69
end of one-month release study. The CD spectra of freshly
prepared deslorelin solution showed maxima at 195 nm and
minima at 218 nm with a negative shoulder at 203 nm.
Conformational stability of the therapeutic protein deslorelin
acetate was found to be acceptable when formulated as PLGA
based ISFM system. This also indicates the conformational
stability of the peptide during the period of release study.
Fig. 8: Comparative, absorption vs wavelength plot obtained from CD
Spectroscopy for fresh deslorelin solution in pH 7.4 phosphate buffer and a
media sample obtained after 30 days in vitro deslorelin release study.
Drug loading and encapsulation efficiency
Table 8 shows percent drug loaded and entrapment
efficiency of optimized deslorelin ISFM formulation DO1 (3
replicates). The optimized ISFM formulation showed improved
entrapment efficiency (90.78 ± 1.84) and drug loading (6.05 ±
0.12). Due to high molecular weight and high content of polymer
in ISFI/ISFM formulations, there was increase in polymeric
solution viscosity and molecular weight dependent attraction
forces between polymer and protein. In this way, the transfer of
protein drug from internal phase to external phase is prevented
causing entrapment of more protein.
Table 8: Drug loading and entrapment efficiency of optimized deslorelin ISFM
formulation (DO1)
S. no. Drug loading (%) (n=3) Entrapment efficiency (%)
(n=3)
1 5.93 89.00
2 6.18 92.67
3 6.04 90.67
Mean 6.05 ± 0.12 90.78 ± 1.84
Particle size distribution and surface morphology of ISFM
formulations
The particle size distribution of deslorelin ISFM was
determined by Malvern Mastersizer. The particle size distribution
graph of optimized formulation is shown in Figure 9. For drug
loaded microspheres, d50 value was found to be 16.219 µm, d90
value was 50.06 µm and particle size range was between 1.45 µm
– 275.42 µm.As seen in the figure, drug loaded particles presented
uniform and normal distribution. For unloaded microspheres, d50
value was found to be 13.651 µm, d90 value was 52.27 µm and
particle size range was between 1.66 µm – 208.42 µm.
Fig. 9: Particle size distribution of deslorelin ISFM formulation (DO1).
Fig. 10 (a): Photomicrograph of deslorelin ISFM (microglobules) taken by
optical microscope (40x).
Fig. 10 (b): Photomicrograph of deslorelin ISFM (formed and dried) taken by
optical microscope (40x).
Figure 10(a) and 10(b) depicts the optical
photomicrographs of deslorelin ISFM formulation DO1. It was
observed in Figure 10(a) that the microglobules were spherical and
non-aggregated with a distinct boundary separating internal phase
with external phase. At this stage these microglobules are also
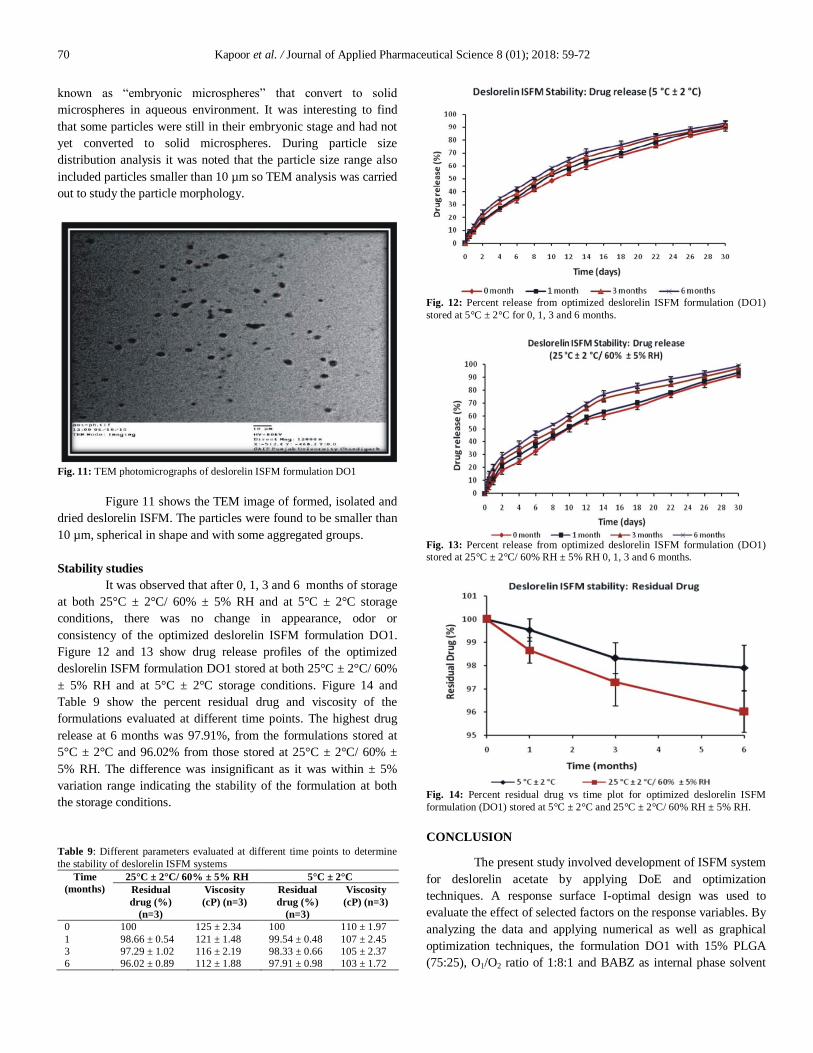
70 Kapoor et al. / Journal of Applied Pharmaceutical Science 8 (01); 2018: 59-72
known as “embryonic microspheres” that convert to solid
microspheres in aqueous environment. It was interesting to find
that some particles were still in their embryonic stage and had not
yet converted to solid microspheres. During particle size
distribution analysis it was noted that the particle size range also
included particles smaller than 10 µm so TEM analysis was carried
out to study the particle morphology.
Fig. 11: TEM photomicrographs of deslorelin ISFM formulation DO1
Figure 11 shows the TEM image of formed, isolated and
dried deslorelin ISFM. The particles were found to be smaller than
10 µm, spherical in shape and with some aggregated groups.
Stability studies
It was observed that after 0, 1, 3 and 6 months of storage
at both 25°C ± 2°C/ 60% ± 5% RH and at 5°C ± 2°C storage
conditions, there was no change in appearance, odor or
consistency of the optimized deslorelin ISFM formulation DO1.
Figure 12 and 13 show drug release profiles of the optimized
deslorelin ISFM formulation DO1 stored at both 25°C ± 2°C/ 60%
± 5% RH and at 5°C ± 2°C storage conditions. Figure 14 and
Table 9 show the percent residual drug and viscosity of the
formulations evaluated at different time points. The highest drug
release at 6 months was 97.91%, from the formulations stored at
5°C ± 2°C and 96.02% from those stored at 25°C ± 2°C/ 60% ±
5% RH. The difference was insignificant as it was within ± 5%
variation range indicating the stability of the formulation at both
the storage conditions.
Table 9: Different parameters evaluated at different time points to determine
the stability of deslorelin ISFM systems
Time
(months)
25°C ± 2°C/ 60% ± 5% RH 5°C ± 2°C
Residual
drug (%)
(n=3)
Viscosity
(cP) (n=3)
Residual
drug (%)
(n=3)
Viscosity
(cP) (n=3)
0 100 125 ± 2.34 100 110 ± 1.97
1 98.66 ± 0.54 121 ± 1.48 99.54 ± 0.48 107 ± 2.45
3 97.29 ± 1.02 116 ± 2.19 98.33 ± 0.66 105 ± 2.37
6 96.02 ± 0.89 112 ± 1.88 97.91 ± 0.98 103 ± 1.72
Fig. 12: Percent release from optimized deslorelin ISFM formulation (DO1)
stored at 5°C ± 2°C for 0, 1, 3 and 6 months.
Fig. 13: Percent release from optimized deslorelin ISFM formulation (DO1)
stored at 25°C ± 2°C/ 60% RH ± 5% RH 0, 1, 3 and 6 months.
Fig. 14: Percent residual drug vs time plot for optimized deslorelin ISFM
formulation (DO1) stored at 5°C ± 2°C and 25°C ± 2°C/ 60% RH ± 5% RH.
CONCLUSION
The present study involved development of ISFM system
for deslorelin acetate by applying DoE and optimization
techniques. A response surface I-optimal design was used to
evaluate the effect of selected factors on the response variables. By
analyzing the data and applying numerical as well as graphical
optimization techniques, the formulation DO1 with 15% PLGA
(75:25), O1/O2 ratio of 1:8:1 and BABZ as internal phase solvent
Kapoor et al. / Journal of Applied Pharmaceutical Science 8 (01); 2018: 59-72 71
was found to be optimized formulation. The results indicated that
it was possible to obtain small sized microparticles with desired
drug release behaviour from an ISFM system prepared with right
combination of excipients in optimized quantities. Further, in vivo
pharmacokinetic and pharmacodynamic studies in suitable animal
models are required to establish the feasibility of exploring the
potential of developed formulation in clinical settings.
ACKNOWLEDGEMENT
Project Grant (No. 01(2093)/06/EMR-II) provided by
CSIR, New Delhi to SanjuDhawan is gratefully acknowledged.
Senior research fellowship provided by CSIR, New Delhi and
project fellowship by IPCA laboratories to Deepak N. Kapoor is
gratefully acknowledged. The authors are grateful to Prof.
Bhupinder Singh, UIPS, Panjab University, Chandigarh, for his
advice on optimization studies.
Conflict of Interest: The authors declare that there is no conflict
of interest.
REFERENCES
Al-Tahami, K., Meyer, A. and Singh, J. Poly lactic acid based
injectable delivery systems for controlled release of a model protein,
lysozyme. Pharmaceutical development and technology, 2006; 11(1):79-
86.
Antony J. 2003. Design of Experiments for Engineers and
Scientists. Maryland Heights, MO, USA: Elsevier Science and
Technology Books.
Arslanoglu I, Saka N, Bundak R, Gunoz H, Darendeliler F. A
comparison of the use of premixed insulins in pen-injectors with
conventional patient-mixed insulin treatment in children and adolescents
with IDDM. Is there a decreased risk of night hypoglycemia? J
PediatrEndocrinolMetab,2000;13:313-18.
Bansal, A., Kapoor, D., Kapil, R., Chhabra, N. and Dhawan, S.
Design and development of paclitaxel-loaded bovine serum albumin
nanoparticles for brain targeting. ActaPharmaceutica, 2011;61(2):141-156.
Chrisp P, Goa KL. Nafarelin-a review of its pharmacodynamic
and pharmacokinetic properties, and clinical potential in sex hormone-
related conditions. Drugs, 1990;39:523-51.
Cleland JL, Daughtery A, Mrsny R. Emerging protein delivery
methods. CurrOpinBiotechnol,2001;12:212-9.
Conn PM, Crowley WF. Gonadotropin releasing hormone and
its analogues. N Engl J Med, 1991;324:93-103.
Dhawan, S., Kapil, R., Kapoor, D.N. and Kumar, M.
Development and evaluation of in situ gel forming system for sustained
delivery of cyclosporine. Current drug delivery, 2009; 6(5):495-504.
Dhawan, S., Kapil, R. and Kapoor, D.N. Development and
evaluation of in situ gel-forming system for sustained delivery of insulin.
Journal of biomaterials applications, 2011; 25(7):699-720.
Fu K, Klibanov AM, Langer R. Protein stability in controlled-
release systems. Nature Biotech, 2000;18:24-5.
Gudmundsson JA, Nillius SJ, Bergquist C. Inhibition of
ovulation by intranasal nafarelin-a new superactive agonist of GnRH.
Contraception, 1984;30:107-14.
Higuchi T. Mechanism of sustained action medication:
theoretical analysis of rate of release of solid drugs dispersed in solid
matrices. J Pharm Sci, 1963;52:1145-9.
ICHQ1F. Explanatory note on the withdrawal of ICH Q1F for
the ICH website. Geneva, Switzerland: International Conference on
Harmonization; 2006 [updated 2006; cited accessed December 2010];
Available at: http://www.ich.org/products/guidelines.html.
Jain R, Shah NH, Malick AW, Rhodes CT. Controlled drug
delivery by biodegradable poly(ester) devices: Different preparative
approaches. Drug Development and Industrial Pharmacy, 1998;24(8):703-
27.
Jain RA, Rhodes CT, Railkar AM, Malick AW, Shah NA.
Controlled release of drugs from injectable in-situ formed biodegradable
PLGA microspheres: effect of various formulation variables. Eur J Pharm
Biopharm, 2000;50:257-62.
Jain RA, Rhodes CT, Railkar AM, Malick AW,
Shah NH. Comparison of various injectable protein loaded
biodegradable poly (lactide-co-glycolide) (PLGA) devices: in-situ formed
implant vsin-situ formed microspheres vs isolated
microspheres. Pharmaceutical Development and Technology, 2000; 5(2):
201-7.
Kapil, R., Dhawan, S., Beg, S. and Singh, B. Buccoadhesive
films for once-a-day administration of rivastigmine: systematic
formulation development and pharmacokinetic evaluation. Drug
development and industrial pharmacy, 2013; 39(3):466-480.
Kapil R, Dhawan S, Singh B. Development and validation of a
spectrofluorimetric method for the estimation of rivastigmine in
formulations. Indian Journal of Pharmaceutical Sciences, 2009;71(5):581-
5.
Kapil R, Kapoor DN, Dhawan S. Flow, compressive, and
bioadhesive properties of various blends of poly(ethylene oxide). Drug
DevInd Pharm, 2009.
Kapoor, D.N., Katare, O.P. and Dhawan, S. In situ forming
implant for controlled delivery of an anti-HIV fusion inhibitor.
International journal of pharmaceutics, 2012; 426(1):132-143.
Kiesel LA, Rody A, Greb RR, Szilagyi A. Clinical use of GnRH
analogues. ClinEndocrinol (Oxf), 2002;56:677-87.
Kompella, UB, Dani, BA. Metabolism of [DES-GLY 10, D-
TRP 6] LHRH ethylamide in rabbit nasal tissue. Life sciences, 1996;
58(24): 2201-2207.
Kompella, UB,Dani, BA. Metabolism of [des-Gly10, D-Trp6]
LHRH ethylamide in the rabbit conjunctiva. Journal of ocular
pharmacology and therapeutics, 1997; 13(2): 163-170.
Korsemeyer RW, Gurny R, Doelker E, Buri P, Peppas NA.
Mechanisms of solute release from porous hydrophilic polymers.
International Journal of Pharmaceutics, 1983;15:25-35.
Koushik K, Dhanda DS, Cheruvu NP, Kompella UB.
Pulmonary delivery of deslorelin: large-porous PLGA particles and
HPbetaCD complexes. Pharm Res, 2004;21(7):1119-26.
Kranz H, Bodmeier R. A novel in-situ forming drug delivery
system for controlled parenteral drug delivery. International Journal of
Pharmaceutics, 2007;332(1-2):107-14.
Kranz H, Yilmaz E, Brazeau GA, Bodmeier R. In vitro and in
vivo drug release from a novel in-situ forming drug delivery system.
Pharmaceutical research, 2008; 25(6): 1347-1354.
Luan X, Bodmeier R. Influence of the poly(lactide-co-
glycolide) type on the leuprolide release from in-situ forming
microparticle systems. Journal of Controlled Release, 2006;110(2):266-72.
Luan, X. and Bodmeier, R. In situ forming microparticle system
for controlled delivery of leuprolide acetate: influence of the formulation
and processing parameters. European journal of pharmaceutical sciences,
2006;27(2):143-149.
Oberye J, Mannaerts B, Huisman J, Timmer C. Local tolerance,
pharmacokinetics, and dynamics of ganirelix (Orgalutran) administration
by Medi-Jector compared to conventional needle injections. Hum Reprod,
2000;15:245-49.
Okuma FW, Daugherty A, Dao L, Filder PJ, Brooks D, Sane S,
et al., editors. Sustained delivery of growth hormone from a novel
injectable liquid. PLAD Proceed Intern Symp Control Rel Blood Maser;
2001.
Peppas NA, Sahlin JJ. A simple equation for the description of
solute release (III): coupling of diffusion and relaxation. International
Journal of Pharmaceutics, 1989;57:169-72.
Plaizier-Vercammen JA, Lecluse E, Boute P. Rheological
properties of topical fluoride gels. Dent Mater, 1989;5(5):301-5.
72 Kapoor et al. / Journal of Applied Pharmaceutical Science 8 (01); 2018: 59-72
Ravivarapu HB, Moyer KL, Dunn RL. Sustained activity and
release of leuprolide acetate from an in-situ forming polymeric implant.
PharmaSciTechnol, 2000;1:1-8.
Robinson SN, Talmadge JE. Sustained release of growth
factors. In Vivo, 2002;16:535-40.
Shen ZY, Ma GH, Dobashi T, Maki Y, Su ZG. Preparation and
characterization of thermo-responsive. International Journal of
Pharmaceutics, 2008; 346:133–142.
Singh B. and Singh S. "A comprehensive computer program for
the study of drug release kinetics from compressed matrices." Indian
Journal of Pharmaceutical Sciences, 1998; 60 (6): 358-362.
Singh B, Kumar R, Ahuja N. Optimizing drug delivery systems
using systematic "Design of Experiments" Part I: Fundamental Aspects.
Critical Reviews in Therapeutic Drug Carrier Systems, 2004;22(1):27-105.
Stat-Ease. Design Expert® v 8.0.1. v 8.0.1 (Trial version) ed.
Minneapolis, MN, USA: Stat-Ease, Inc.; 2010.
Suprelorin: Scientific Discussion (INN: Deslorelin Acetate)
[database on the Internet]. Committee for Medicinal Products for
Veterinary Use (CVMP), European Medicines Evaluation Agency
(EMEA). 2002 [cited December 2010]. Available at: www.ema.europa.eu.
WHO. Stability testing of active pharmaceutical ingredients and
finished pharmaceutical products. Geneva: World Health Organization;
2009.
Wood GC, Iyer MR, Geller AM, Fleischner AM, Sheth BB. A
high pressure liquid chromatography assay method for analysis of
deslorelin and benzyl alcohol in deslorelin injection. Journal of liquid
chromatography & related technologies, 1998; 21(14):2183-2190.
Zhang, Z., Shousheng, X.I.E., Jinhai, H.U., Zhuoguang,
M.I.A.O. and Lei, W.A.N.G. Assembly Variation Identification of High
Pressure Spool by Response Surface Based Model Updating Using IV-
optimal Designs. Chinese Journal of Aeronautics, 2012; 25(5), pp.817-
824.
How to cite this article:
Kapoor DN, Katare OP, Kaurav H, Dhawan S. Development and optimization of in-situ forming microparticles for long term controlled delivery of deslorelin acetate. J App Pharm Sci, 2018; 8 (01): 59-72.