development and test of a virtual reality system for ... and test of a virtual reality system for...
TRANSCRIPT

Development and test of a virtual reality system for tethered
walking Drosophila
Tomás Lopes da Cruz
Thesis to obtain the Master of Science Degree in
Physics Engineering
Examination Committee
Chairperson: Dra Ana Maria Cidade Mourão
Supervisor: Dra Maria Eugenia Chiappe
Co-Supervisor: Dr Goncalo Nuno Marmelo Foito Figueira
Members of the commitee: Pedro José Oliveira Sebastião
Adam Raymond Kampff
September 2013

ii

iii
Acknowledgments
I would like to start by thanking my tutor and supervisor Eugenia Chiappe not only for the constant support
during the whole project but also for the important tutoring about science, how to do good science and how to be a
scientist. Working with Eugenia was a fun and very rewarding experience where I learned very important lessons for
life.
I would also like to thank my family for their constant support, for always encouraging me to do what I like to
do even though I have not been very present.
I'm grateful as well for all my friends from IST and CCU with whom I have had so many fun moments
together. Their ability to keep a cheerful mood even under working pressure is truly inspiring.

iv

v
Abstract
This dissertation describes the work done in designing, building, and testing a virtual reality (VR) system for
tethered walking Drosophila melanogaster. The VR system FlyVRena, compromises a treadmill tracking system, a novel
custom made software platform for VR experiments, and a novel custom made high speed wide angle projection
system.
In the first set of experiments I found that 3-day-old starved DL flies were the best biological conditions for
walking behavior on the ball. Furthermore, the increase of the treadmill ball size resulted in a more naturalistic
walking. I showed that the difference observed in walking for free and tethered flies depends both on the spherical
treadmill and on fixing the fly’s head to a tether.
Using the developed system I obtained orientation responses of the fly to for small field objects. The
performance of the tracking behavior depends on the size of the object. Finally, it is shown that flies can perceive the
3D VR world and are able to control it through closed loop conditions. When confronted with a simulated 3D arena
with a pole, flies tend to consistently visit the object independently of its position, provided is within the field of
view of the fly. I also tested the flies in virtual corridor, to evaluate their interaction with the rules of the world.
These results are a proof of the power of the developed system than will be now used to investigate the neural basis
of natural behavior in a novel way.
Keywords: Virtual Reality, Drosophila, Visually guided behavior, Neuroscience

vi
Resumo
Na presente tese está descrito trabalho de design e construção de uma realidade virtual para tethered
Drosophila. O sistema de realidade virtual (FlyVRena) é composto por um sistema para medição de trajectória
baseado numa bola de esteira, numa nova plataforma para experiências em realidade virtual e num sistema de
projecção de alta frequência e elevado ângulo de projecção.
As primeiras experiências foi encontrado que moscas DL com 3 dias e com fome são as que optimizam o andar
sobre a bola e que o aumentar do tamanho da bola resultou num caminhar mais naturalista. Motrei ainda que as
diferenças entre caminhar livre e caminhar na bola não se devem exclusivamente à bola mas que a manipulação de
fixar a cabeça afecta o caminhar da mosca.
Utilizando o sistema desenvolvido observou-se o comportamento de orientação para pequenos objectos e que a
qualidade do tracking que a mosca faz a objectos depende do tamanho dos objectos, sendo melhor para objectos
maiores. Por fim demonstrou-se que as moscas conseguem entender estímulos 3D e controlar o ambiente simulado
em full closed loop. Quando confrontadas com uma arena virtual 3D com um objecto, algumas moscas tendem a
visitar o objecto independentemente da sua posição tal como acontece naturalmente. Foi ainda testada a interação da
mosca com diferentes regras de colisões utilizando um corredor 3D. Estes resultados demonstram a qualidade do
sistem desenvolvido que pode agora ser utilizado para estudar a base neural de comportamentos naturais de uma
forma nova e única.
Palavras-Chave: Realidade Virtual, Drosophila, Comportamentos guidos pela visão, Neurociência

vii
Table of Contents
INTRODUCTION 2
1.1 Virtual Reality 2
1.1.1 What is Virtual Reality? 2
1.1.2 Why would Virtual Reality be useful? 3
1.2 Virtual Reality in Neuroscience and Ethology 4
1.3 Senses, muscles and neurons 4
1.4 Virtual Reality as a mean to study sensory-motor processes 5
1.5 Drosophila melanogaster as a model organism for neuroscience 5
1.6 A Virtual Reality system for Drosophila 6
1.7 Outline of the thesis 8
VIRTUAL REALITY SOFTWARE 10
2.1 Software Overview 10
2.1.1 Basic requirements for a scientific VR software 10
2.1.2 Building up a VR platform – The materials 11
2.2.2 Camera properties 14
2.2.3 Item Behavior and Update 15
2.2.4 Physical rules: Collisions 16
2.2.5 Create a Virtual World 17
2.3 Run an experiment 19
2.3.1 Experimental protocol language - Behavior Tree 19
2.3.2 Create experiment and store as a .XML file 19
VIRTUAL REALITY PROJECTION SYSTEM 22
3.1 Overview of the projection system 22
3.1.1 Specifications for the projection system 22
3.1.2 Materials and methods 23
3.2 Projection system implementation 23
3.2.1 360 Hz Projector 23
3.2.2 Projection surface design 24
3.2.3 Image splitting and homogeneous projection in a 180º surface 26
3.3 Summary of the developed VR system 27
BEHAVIORAL ANALYSIS OF TETHERED WALKING 30
4.1 Optimization of the walking in a ball behavior 30
4.1.1 Analysis of walking in head-free and head-fix flies 30
4.1.2 Biological and physical optimization of walking on the spherical treadmill 34

viii
4.1.2.1 Methods 34
4.1.2.2 Results and discussion 35
4.2 Analysis of the walking on a ball behavior 37
4.2.1 Modes of walking and relevance 37
4.2.4 Learning and performance improvement 38
4.2.5 Effect of the projector’s light 40
ANALYSIS OF FLY ORIENTATION BEHAVIORS USING FLYVRENA 42
5.1 Response to small objects – Object tracking open loop 42
5.1.1 Object tracking 42
5.1.2 Method 42
5.1.3 Results and discussion 43
5.2 Response to rotational closed loop – Edge fixation 45
5.2.1 Edge Fixation 45
5.2.2 Method 45
5.2.3 Results and discussion 45
5.3 Explorative behaviors in a 3D world 48
5.3.1 Full 3D Virtual Reality 48
5.3.2 Method 48
5.3.3 Results and discussion 49
5.4 Analysis of the collisions in the virtual world 51
CONCLUSION 54
REFERENCES 58
APPENDICES
A TREADMILL SYSTEM FOR HIGH RESOLUTION TRACKING OF INSECT
WALKING 60
A.1 Principle of operation 60
A.2 Treadmill system mechanics 61
A.2.1 The ball 61
A.2.2 The ball holder 61
A.3 Treadmill system electronics 62
A.3.1 Sensor board 62
A.3.2 Microcontroller board 62
A.4 System alignment and calibration 63
A.4.1 System alignment with calibration cube 63
A.4.2 System Calibration 64
3D RENDERING 65

ix
B.1 The World transformation 65
B.2 The View transformation 66
B.3 The Projection transformation 66
BEHAVIOR TREE 68
C.1 What is a behavior tree? 68
C.2 Principal logic components of a BT 68
C.3 Example: Trial/Inter Trial routine used for the first experiments in the dark. 69
C.4 Example: Protocol used in the bar tracking in open loop 69

x

xi
Table of Figures
Fig. 1 The Sensorama machine. ............................................................................................................................................. 3
Fig. 2 A model VR for neuroscience and ethology. ........................................................................................................... 4
Fig. 3 Examples of Drosophila brains from Drosophila lines. ........................................................................................ 6
Fig. 4 A visual scene can be decomposed in different items. ......................................................................................... 13
Fig. 5 Left: Schematic view of the virtual world architecture. Right: List of Subsystems. ........................................ 14
Fig. 6 Closed loop geometrical transformations to reconstruct the virtual trajectory of the fly. ............................. 15
Fig. 7 Example of bounding boxes. The models are surrounded by sets of squares. ................................................ 16
Fig. 8 Main window of the CreateWorld program. .......................................................................................................... 18
Fig. 9 Object Editor window. This window pops-up if the user adds a new object .................................................. 18
Fig. 10 GUI to create an experimental protocol. .............................................................................................................. 19
Fig. 11 Example of a virtual world composed of a drum with a chequerboard floor and stripped wall. ............... 20
Fig. 12 Summary of the biological constrains introduced in the projection system design. ..................................... 22
Fig. 13 Scheme of the vertical view angle of the fly. ........................................................................................................ 25
Fig. 14 Designed cylindrical screen: The fly is located in the center of the screen ..................................................... 25
Fig. 15 Left: picture of the image splitting structures. Right: Design of the mirror holders to split the image..... 26
Fig. 16 Top: Intensity profiles measured using and not using the split system. Bottom: Flicker rate test. ............ 27
Fig. 17 Picture of the fly behaving in the Virtual Reality system. .................................................................................. 28
Fig. 18 Schematic showing the various steps of information flow and stimulus generation in the FlyVRena.. .... 29
Fig. 19 Previously obtained results for free walking flies and tethered flies walking over a 6mm ball. .................. 31
Fig. 20 Box plots of the total distance walked (a) and percentage of time walking (b). ............................................ 31
Fig. 21 Walking speed distributions across the different categories.. ............................................................................ 32
Fig. 22 Quantization of the effect observed in the histograms of Fig. 21.. ................................................................. 33
Fig. 23 Mean speed across Starved DL flies in free walking conditions for the previous studies ........................... 33
Fig. 24 Pictures of a tethered fly on the ball. Left: back view. Right: side view. ......................................................... 34
Fig. 25 Box plots of the percentage of time moving for each trial for the 4 categories. ........................................... 35
Fig. 26 Box plots of the percentage of time walking for each trial across 5 different ages ....................................... 36
Fig. 27 Box plots of the percentage of time walking for each trial across 4 different times of the day .................. 36
Fig. 28 Mean forward (left) and rotational (right) speeds calculated for the starved DL flies .................................. 37
Fig. 29 Scatter plot of the rotations versus the travelled distance for each trial.......................................................... 37
Fig. 30 The two modes of walking have differences in terms of ................................................................................... 38
Fig. 31 By observing the mean and standard deviation of the improvement indices ................................................ 39
Fig. 32 Data for the flies behaving in mixed mode .......................................................................................................... 40
Fig. 33 There were no strong significant effects of the light on the percentage of time moving. ........................... 41
Fig. 34 Example representative of good tracking ............................................................................................................. 43
Fig. 35 Filtered version of the data from Fig. 34. ............................................................................................................. 44
Fig. 36 Maximum cross covariance for each bar size for each fly. ................................................................................ 44
Fig. 37 Mean cross covariance for all the trials above chance level against bar size. ................................................. 45
Fig. 38 2D reconstruction of walking trajectories............................................................................................................. 46
Fig. 39 Temporal sequence of the absolute heading angle of the fly. ........................................................................... 46
Fig. 40 2D trajectories for a fixating fly .............................................................................................................................. 47

xii
Fig. 41 Overall histograms of the angular position of the fly....................................................................................47
Fig. 42 Fraction of trials in which the percentage of time that the fly kept the edge in front of her..................47
Fig. 43 Top: Initial visual scene presented to the fly before being processed by the projection system............48
Fig. 44 Percentage of trial time that the fly spent around the object averaged across trials.................................49
Fig. 45 Heat maps of the positions of the flies for the 3 different pole positions.................................................49
Fig. 46 Flies can navigate on a 3D virtual corridor.....................................................................................................50
Fig. 47 After the first collision the flies tend to get trapped.....................................................................................51

xiii
List of Abbreviations
(VR) Virtual Reality
(VW) Virtual World
(MRI) Magnetic Resonance Imaging
(JFRC) Janelia Farm Research Campus
(GUI) Graphical User Interface
(API) Application Programming Interface
(IR) Infrared

1

2
Chapter 1
Introduction
1.1 Virtual Reality
1.1.1 What is Virtual Reality?
The names Virtual Reality (VR), Artificial Reality, or Cyberspace, introduced to us since the 50s, describe
artificial worlds with real agents that are able to interact with it. A more formal definition for VR is given by Sherman
and Craig1:
“Virtual Reality is a medium composed of interactive computer simulations that sense the participant’s
position and actions and replace or augment the feedback to one or more senses, given the feeling of being mentally
immersed or present in the simulation (virtual world)”
In Walser’s simple definition2, a model VR consist of a computer-controlled feedback loop between “puppets”
(virtual objects) and “patrons” (real objects). Puppets acquire knowledge of events that take place in the physical
world by means of devices called sensors. At the same time, puppets can influence the real world by devices called
effectors. A patron can influence the virtual space by its puppet’s sensors and can learn about events in the virtual
world by its puppet’s effectors. Thus, the feedback loop is established from the fact that the puppet’s sensors are the
patron effectors and the puppet’s effectors are the patron’s sensors.
The required fundamental architecture to achieve this model VR is:
1. An engine to generate the simulated world and to mediate the patron’s interaction with it.
2. A physical space in which the patron’s actions are tracked.
3. A set of sensors to monitor the patron’s actions.
4. A set of effectors to produce various physical effects and stimulate the patron’s senses.

3
1.1.2 Why would Virtual Reality be useful?
An example of an early prototype of a VR system was called Sensorama3 (Fig. 1). Sensorama is a multi-sensory
stimulation environment developed in the mid 50’s. It was designed as an arcade game in which the participant sat
on a seat, held a pair of motorcycle handlebars and pressed his eyes against a binocular lenses. While the 3D movie is
being displayed to the eyes of the user, the seats and handlebars vibrate and wind is blown to its face, creating the
illusion of driving around the city.
Fig. 1 The Sensorama machine.
Nowadays VR systems are used beyond a sophisticated toy. VR like technologies have been successfully applied
in education, physical training and behavioral neuroscience. For example, surgical simulators4 allows medical
students to practice complex surgeries. In such a system, the student performs the surgeries using real tools with
force sensors that send a feedback signal to a real time simulation that is shown in a screen. Flight simulators are the
best example of the use of VR systems for pilot and military physical training.
In neuroscience, VR systems are now widely used in behavioral research on spatial navigation, on vision and
action, and on motor learning in insects, rodents and humans5-8. Because VR systems control complex 3D stimuli
precisely while behavior is recorded, often in simultaneous with neural recordings9, VR gives a unique opportunity to
study animal behavior in more realistic and relevant environments while keeping precise control over events.
Bringing VR tools to ethology and neuroscience has opened the possibility to study in the lab questions about
the neural mechanisms of natural behavior, impossible to tackle in the natural environment because of the difficulty
to manipulate physical rules of the world.

4
1.2 Virtual Reality in Neuroscience and Ethology
A VR system for neuroscience and ethology will have an animal as its patron. The animal actions must be
tracked online, and the visual feedback must operate close to real time to update a virtual simulation and provide an
immersive experience for the animal. Constrains of the real-time temporal resolution will be determined by the
animal’s physiology (for example, the fly’s visual system is about an order of magnitude faster than ours).
The puppets are generated by the software, which maps the tracking system’s data to actions in the virtual
world. A puppet can be the whole virtual world itself or smaller objects inside the world. A virtual world does not
have to be confined to our physical rules and behaviors, allowing to explore new situations, or to manipulate the
scene parameters in order to investigate the limits of behavior (Fig. 2).
Fig. 2 A model VR for neuroscience and ethology.
Humans navigate VR worlds in close correspondence to how they do it in the physical reality10. For this reason,
VR have already tested the effect of different sensory signals of the spatial orientation of humans in VR systems with
distorted physical rules5, 11. Similarly, primates have shown immersive experience in VR-based navigational tasks as
suggested by the expression of place-field sensitive responses of neurons of the hippocampal formation, a
mammalian brain region involved in cognitive spatial information12. More recently, the same has been demonstrated
in rats and mice13, suggesting that VR systems may be used universally to study visually-guided orientation and
navigation behaviors14. However, it remains unclear whether another well-established animal system in visual
neuroscience, the vinegar fly Drosophila melanogaster, is capable of interacting successfully with a VR world during
explorative behavior. Although there are many behavioral studies demonstrating that the fly can respond to simple,
VR-like visual stimulation15, 16, the same level of immersive VR experience as obtained with humans, primates and
rodents, has not been achieved for the fly yet, partially because of the lack of an optimized VR system for this
species.
1.3 Senses, muscles and neurons
In order to provide animals with accurate information about what is going on in their environment, evolution
has equipped them with a large range of sensors that detect from variations in air pressure (audition), to variations in
light intensity, wavelength and/or polarization (vision), to variations in chemical species (taste/olfaction/internal
regulators).

5
One advantage of having so many different kinds of sensors is to be able to adapt efficiently and rapidly
behavioral output in response to sudden changes in the external environment. When certain sensory information
leads to movement or when movement leads to sensory stimulation, we are in the presence of a sensory-motor
process. Examples of visuomotor processes are collision avoidance responses, or orientation towards or away from a
specific object.
While sensors transform physical properties of the environment to a neural code, muscles transform neural
codes to physical movement. In between, neural networks transform sensory signals into motor commands that lead
to the muscular movement. The animals own movement, in turn generate sensory signals. Although these types of
processes are in essence the most basic function of any brain, they can become very complex, with the existence of
feedback loops between sensors, neurons and movement actuators. How the brain interprets the information that
comes from the senses to generate motor responses? How the motor behavior re-interacts with the senses to affect
our perception? Although sensorimotor research is developing fast, and it is known that sensory motor integration
malfunctions are the bases of some frequent diseases17, these questions are still unanswered mostly by the lack of
tools that allow to study them correctly. One such tool is a VR environment.
1.4 Virtual Reality as a mean to study sensory-motor processes
In VR systems there is a precise knowledge of the sensory input, and of the behavioral output. This makes VR
systems particularly attractive to study the neural mechanisms of sensorimotor processing underlying sensory-guided
behaviors18.
One can apply VR technology in two ways. The first one is to have an animal (with its behavior tracked), freely
moving through a controlled environment that can change according to the animal’s behavior15, 19. In the second
one, the animal is fixed in place or tethered, and behaves on top of a treadmill14, 16, 20. Although much more
restrictive in terms of behavior, the second type allows for high precision of visual stimulation, and permits applying
methods like two-photon imaging, whole cell patch clamp or MRI to record neural activity in simultaneous with
behavior. Importantly, it has been already shown that many sensory guided behaviors can be reproduced in VR in a
pseudo-naturalistic way while keeping full control over the stimulus, and recording with high precision brain activity
and behavior20. Thus, applying VR tools to study animal behavior is a big step forward in addressing the questions
raised in the last section and to dissect the neural circuitry underlying natural behaviors.
1.5 Drosophila melanogaster as a model organism for neuroscience
The vinegar fly, Drosophila melanogaster, has been a model organism for excellence to study the genetic bases and
mechanisms of development, cell function and behavior. This is because Drosophila melanogaster possess a short
generation time, has its genome completely mapped, and it is amenable to genome manipulations for artificial
expression of proteins. Recently, a novel technique has been developed that allows simultaneous recordings of neural
activity with walking behavior20. This makes Drosophila a unique model to study the interphase between genes,
physiology and behavior.
The brain of Drosophila has around 105 neurons that make around 107 connections (synapses). When
compared to the 7.5 x 10⁶ neurons from the mouse brain, the 7 x 10⁸ neurons from the chimpanzee or the 8.5 x 10⁷
neurons from the human brain, Drosophila displays numerical simplicity in terms of neurons for the circuits that
process information and that guide behavior of comparable complexity to vertebrates, like locomotion. It is the

6
balance between numerical simplicity and behavioral complexity that makes the vinegar fly an attractive model to
study the neural bases of behavior.
The use of genetic tools to dissect neural circuits is a rapidly expanding field21. The basic idea of using a genetic
tool (insertion of fabricated pieces of DNA) in neuroscience is to be able to express proteins in genetically identified
neurons. Some examples using such techniques include: manipulating the activity of neurons using temperature
sensitive proteins (the neuron activates or is blocked when the temperature is raised), visualizing single neurons with
fluorescent proteins, or visualizing the activity of populations of neurons (by expressing proteins that became
fluorescent when the neuron is active).
Drosophila is an especially attractive organism to apply such techniques for the ease of inserting exogenous
DNA in its genome. Furthermore, a classical method allows targeting specific cells in Drosophila brain using the
transcription factor Gal422. Using this expression system, different laboratories have generated a collection of fly
lines with genetic access to specific neurons23 (Fig. 3). Because single cell resolution can be achieved using these
strategies, Drosophila became a very attractive model organism to dissect neuronal circuits (Fig. 3).
Fig. 3 Examples of Drosophila brains from Drosophila lines that target specific populations of neurons. Left, a
transgenic line labeling only 2 neurons per hemisphere. Right, another line labeling a class of neurons (as genetically
defined) in the optical neuropile.
Despite their small brains, insects are able to perform sophisticated behaviors that are in general highly robust.
In Drosophila, reliable visual guided behavior like tracking (orientation towards moving objects) or fixation
(orientation towards static objects) responses provide a solid framework to dissect the neural circuits underlying
visually guided behavior.
1.6 A Virtual Reality system for Drosophila
Combining the advantages that VR brings to sensorimotor research with the power of Drosophila as a model
organism for neuroscience, one can see an attractive opportunity to study the neural circuitries and algorithms
underlying sensorimotor processes. Because of the small size of the fly, simultaneous recordings of behavior and
neural activity required a tethered system: a fly is immobilized on a spot while rendering its locomotive organs free to
move, thus creating a fictive locomotion.
Historically, the experiments with tethered insects started with Hassenstein and Reichardt in 195621. They used
a tethered beetle walking on a treadmill apparatus (the “spangenglobus”) and measured its turning direction based on
motion visual stimulation. In the following decades, tethered preparations improved and became more sophisticated
in terms of sensory stimulation and of behavioral recordings of visually (or auditory)-guided locomotion.

7
In these primordial “VR systems”, either flying or walking behavior was measured as a function of visual
stimulation. For flight, a torque compensator was used to track yaw-turning behavior22. Torque meter systems for
flying insects were replaced by photodiode systems using light to measure the amplitude of the wing stroke. These
photodiode-based systems had better signal-to-noise ratios and extended bandwidth compared to the torque
compensators23. Recently, medium-speed videography has been also applied to measure the amplitude of the wing
stroke by following the leading edge of the wings in flight.
Walking in tethered insects is measured with spherical treadmills moved by the locomoting insect. Simple
treadmill systems, like the spangenglobus, have been replaced by trajectory tracking systems where photodiodes
record rotations of dotted balls24. Photodiodes were then replaced by cameras recording optic flow fields instead,
which originated from the moving ball. The more modern optic flow IR sensors used in game mice technology allow
for high speed and high resolution tracking systems20.
With respect to the sensory stimulation, early experiments used patterned cylinders that were mechanically
rotated around the fly to provide moving stimuli. These arenas could be used in closed loop conditions with the
animal behavior25, being a sort of virtual reality in one dimension (yaw). However, in such systems, the stimuli that
could be presented to the animal was very limited, and only closing the loop with the angular displacement of the
animal. Other methods used for visual stimulation included projecting images directly to the eye of the fly26, or more
elaborate systems consisting of multiple servomotors, each moving a small dot that can be positioned at various
locations relative to the fly’s retina27.
Because of the flicker rate of the fly1, which at room temperature is on the order of a couple of hundreds of
Hertz, neither the cathode ray tubes nor the liquid crystals screens of the 90’s could be used. The technological
solution to this problem appeared in the late 90s with the LED systems and fast electronic technology. An arena, or
a screen, coated with hundreds or thousands of small LEDs, each of which are not perceptible by the fly because of
its very poor spatial resolution, are controlled around the fly to create visual patterns updated at hundreds of Hertz.
LED arenas became the most popular VR-like setup to work with tethered insects and are the actual state of the
art28.
Although LEDs are better than the rotating arenas, allow simultaneous neuronal and behavioral recordings, and
are able to show virtually any kind of stimuli, these LED arenas still have some limitations. The LEDs are controlled
by microcontrollers to show pre-programmed patterns with each LED can be controlled individually. The limitation
arises when patterns become more complex, with depth perspective to recreate 3D environments. To update such
patterns at a rate of at least 200 Hz is actually not possible with the speed processing and buffering of the controller.
In consequence, when a more complex stimuli is needed, for example for closed loop experiments when azimuth,
elevation and depth are required or for the representation of complex objects, this type of system is not able to
satisfy the speed requirements of the visual system temporal resolution, and thus limit the immersive experience of
the fly.
One of the goals of this thesis work is to develop a VR system for Drosophila that tackles and solves the
limitations of the current systems, and allows for a wide range of experimental situations, from simple open loop
stimuli to complex closed loop situations (close to the real world conditions). Recently, new virtual reality systems
have been reported for tethered walking in mice14 and cockroaches29. The latter does use a high-speed projection and
a screen for insects walking on a treadmill tracking system, but this system still has limitations in terms of modularity,
1 The flicker rate of the retina of the fly is the minimum frequency at which the insect can perceive a continuous motion
instead of a flicker

8
effective control of the rules of the virtual world and naturalistic mechanisms of virtual collision. Adding to these
limitations, the optical system for projection was not suited to accommodate optical neural recordings in the
behaving animal.
In our opinion the limitations of the previously presented systems are relevant and should be overcome in our
system to have a real platform suited to study the neural basis of sensory-guided locomotion in Drosophila.
1.7 Outline of the thesis
In this master thesis work, I will describe FlyVRena, a much more realistic and flexible virtual reality system for
tethered Drosophila that I developed.
FlyVRena can be divided in three modules: The tracking system, the projection system and the software to
generate the virtual world and integrate the two other systems.
Drosophila uses two modes of locomotion, walking on the terrain and flying through the air. Because the 6
degrees of flight cannot be measured faithfully in tethered conditions, I will focus on a VR system for walking. The
tracking system is a treadmill system for walking Drosophila, functionally similar to the one previously developed in
the lab20.
The VR software is totally custom made and was designed to be a platform for various VR experiments. The
tools used to build it, its design and functionalities in terms of creating virtual worlds and experimental protocols are
discussed in the second chapter of this thesis.
There is a part of the software that adjusts the stimuli to our specific projection situation and that allows to
integrate the projection part with the rest of the VR system. Although it is integrated in the VR software, this part
will be specifically discussed in the third chapter, together with the projection system. Our projection system is based
on a modified 3D projector that can display images at a frame rate of 360 Hz (above the flicker rate of Drosophila).
In the fourth chapter, I discuss the experiments done to establish optimized biological conditions to improve
walking-on-the- ball performance of a fly, and explored the limitations of such a system.
The fifth chapter includes the experiments I performed as proof of concept of the system. I discuss results
obtained with other systems that were mimicked using our developed VR system, as well as some novel
observations, both related to visually-guided tracking and fixation behaviors.
I will finish the thesis by discussing the advantages and limitations of our system as shown by the performed
experiments.

9

10
Chapter 2
Virtual Reality Software
2.1 Software Overview
2.1.1 Basic requirements for a scientific VR software
A fundamental goal in neuroscience is to study the neural circuitry of an animal’s behavior. For this, it is critical
to link neural activity with behavior, working with experimental conditions that allow precise control of the stimuli,
quantitative measurements of the animal’s behavior, and simultaneous access to neural recordings. Because of these
requisites, controlled, simulated environments sensed by the animal and updated by the animal’s behavior hold great
promise as experimental platforms to study the neural basis of behavior.
With the advance on the development of faster processors and more powerful graphical cards, video game VR
systems have been well adapted for neuroscience18. However, because the commercial products are developed for
humans only, with limited requirements for stimuli control and no precise measurements of the player’s behavior,
they are not perfectly suited for behavioral experiments in insects (See Chapter 1 and Chapter 3). As a scientific
platform for a wide variety of animal systems, the VR software must fulfill the following conditions:
Render 3D images in a window display with a specified size, and at a specified frame rate defined by the
sensory physiology and/or motor system of the animal species under study.
Have the ability to communicate with external devices (to include stimulus associations and/or stimulus-
action associations).
Be able to generate any kind of 3D world.
Create and run any kind of protocols for experiments.
Give the user full control over the properties of the virtual objects (aspect, position, behavior...).
Give the user full control over the interactions between the subject and virtual objects.
A VR system with these specifications will provide a new platform to study the fly’s interactions with simulated
environments in more naturalistic but yet well-defined conditions.

11
2.1.2 Building up a VR platform – The materials
None of the commercial options to generate 3D worlds is able to fulfill all the above requirements. Therefore,
my goal has been to develop such a platform. The programming languages and tools I used, and the reasons for their
selection are discussed in the following paragraphs.
Adding to the previous requirements, the VR platform should be freeware and should have a user-friendly
interface so anyone could use it without having programming skills.
Visual Studio Express C# and XNA
The VR platform is developed within Window OS for its popular use and accessibility among neuroscientists,
while containing all the advanced tools necessary to develop the platform as described below. The program is written
in C# language because it guarantees the modularity and the handles of a high level object oriented programming
language.
The VR graphical interface makes use of the XNA libraries for game development, which guarantee the
flexibility for custom designs. These libraries are not very low level and allow focusing on the content either than on
the technical details.
The adopted programming environment is the Visual Studio C# Express 2010, that can easily access the XNA
libraries.
Blender
XNA is not powerful enough to generate (at least with a fast and easy procedure) any kind of virtual world. The
reason is that to draw a model (3D representation of an object) with XNA, it is necessary to write all the vertexes
and faces of the object in a non-trivial and non-visual way.
To produce mesh models for the objects that will be part of the VR in a relatively easy and highly visualized
way, I chose to use Blender from Blender Foundation. Blender is the dominant open source 3D computer graphics
software, and it is designed around 3D mesh modeling. Blender can attribute easily textures to mesh models by UV
mapping, which consists on matching texture coordinates to model coordinates, wrapping the mesh with a texture.
Blender models can be exported in .FBX format and models in this format can be integrated as content in
XNA projects and manipulated inside the VR environment.
Multithreading for data acquisition and FTDI
The software should be able to acquire data from the motion tracking system at 4kHz (see Introduction and
Appendix A and Chapter 3), use this data to update the rendered image at a biological meaningful rate of 360Hz (see
Introduction). To achieve this processing speed, data acquisition is done in a different thread from the one running
the main loop of the program. Multi-threading libraries for C# were used to create the multi-threading environment
and to make the data sharing a thread-safe process. Thread-safe data sharing is a time expensive process because
each time the shared variable is to be accessed, the program has to be locked. At present, protocols that do not
require direct update using the tracking system data can run at 360Hz, but protocols that need the data sharing can
only run at 120Hz. Future work includes search and implementation of higher performance tools for multi-threading
that would allow a 360Hz refresh rate for both situations.
The interface between the tracking system and the computer uses a FTDI port. The communication with the
device was integrated in the software using the FTD2XX_NET wrapper.

12
Shaders and communication with graphic card
To specify the frame rate or the size and position of the window displaying the VR, a direct channel for the
graphics device properties is required. Fortunately XNA libraries facilitate this communication (For application see
Chapter 3).
Projecting gray-scaled images at a 360Hz frame rate is not possible with the actual projector’s available
technology. I used a modified 3D projector [Anthony Leonardo, JFRC personal communication] that updates images
at 120Hz per color channel, without white segment between frames. Using post processing of the rendered image, I
set a different image to each color channel. In order to do that a texture shader was created. It receives three
rendered images, places them in each color channel and outputs the final texture, making the update three times
faster than using a single texture for all color channels.
Windows Forms
Windows Forms was used to develop the GUI. Windows Forms is a graphical API, part of the .NET
framework, that provides access to native Microsoft Windows interface elements. Visual Studio C# Express 2010
already includes the libraries needed to create Windows Forms projects and integrate them with XNA applications.
Experiment Storage
The program saves the configurations for the experiment (including the designed virtual worlds) in a .XML file.
XNA libraries include exporters and importers to this format. Also the .XML format is by essence hierarchical,
which is perfect to implement Behavior Trees (See Appendix C) and support the architecture of the virtual world
(see next section).
By using only open source tools it was possible to design a freeware platform and, as it will be shown next, the
power of these tools will allow achieving all the specific requirements stated in the first section of this chapter.
2.2 Program architecture
2.2.1 Virtual World architecture overview
In a virtual scene there are items that contain individual properties. Each property falls within a category, such
as position (where it is), aspect (how it looks like, defined by mesh and texture, volume occupation in space for
physical interactions), and behavior (what it does) (Fig. 4). Within the virtual world architecture these individual
items are called World Objects, and their categorized properties are called Services. The objects that start the
Services with its initial conditions are called Factories.

13
Fig. 4 A visual scene can be decomposed in different items. Each item has a group of properties that defines it. The
properties can be classified to a set of categories that are shared by most of the items in the world. The idea for the
software to build virtual worlds is do the opposite: the virtual world is the implementation of abstract objects
representing the items, and abstract objects representing the item features. In this sense the software is able to
generate essentially any type of virtual world.
World Objects
Every item that concerns the world is a World Object. An item with a model to draw is a World Object, the
Camera (i.e. the viewpoint) is a World Object, and the world itself is a World Object. Therefore, the implementation
of the World Object class in code is based on three lists: a list of other World Objects (to create a hierarchy), a list of
Services (properties of the item) and one list of Factories (initial conditions).
Services and Factories
The individuality of a World Object is guaranteed by the different services associated with it. Examples of
services are the name, the position, the 3D model to be rendered, and the behavior that the object will have. The
objects that initialize the Service with the initial conditions are called Factories. Specific services are updated during
runtime in specific and specialized subsets of the main loop called Subsystems.
Subsystems
XNA is able to divide its main loop in subsections called Game Components. Here the Game Components
were used to separate the moments in the game cycle when specialized routines, known as subsystems, happen.
Examples are the subsystem where the collisions are detected or the subsystem where the images are rendered. Each
Subsystem have a list of World Objects from which they call the relevant services for the action performed (models
to render, behaviors to update, etc).

14
Fig. 5 Left: Schematic view of the virtual world architecture. Right: List of Subsystems and relevant Services for each Subsystem.
2.2.2 Camera properties
The virtual environment is sensed by the animal and updated according its actions. In computer graphics the
object that watches the world is called Camera. In the virtual world the Camera represents the animal, and the
Camera behavior follows or represents the animal behavior.
The object Camera includes: position of the animal in the virtual world (position), where is the animal looking
at (reference) and the viewport properties (field of view, aspect ratio, near and far planes). For a more detailed
explanation about the 3D view see Appendix B.
Update Camera
The program is continuously reading, integrating and storing data from the tracking system, i.e. the locomotor
behavior of the animal. These processes are running in a thread different from the one where the main loop is
running. Each time the Camera update is called, the program gets an integrated version of the data, transforms it to
the correspondent movements in the virtual world and updates the Camera position and reference accordingly.
Several modes of updating the Camera are available:
Update with the tracking system - The program pulls and transforms data from the tracking system to
update the position and reference of the Camera in order to mimic the real animal’s behavior in the virtual
world.
Update with the tracking system and store the raw data - Same as previous but storing the behavioral data.
Update just the rotational aspect of the fly’s behavior - The same as previous but only updating the Camera
reference. In this way only the rotational component of the behavior is mimicked in the virtual world.
Update with raw data from an external file - Update with data taken from a file, this option is used for
offline visualization of the behavior and replaying an animal’s previous visual experience.
Update with the keyboard - User uses the keyboard to navigate the virtual world.
No update.

15
To update the Camera correspond to find the new values of its position and reference (Appendix B). These
values must be in the world referential. The tracking system gives values measured in the fly’s referential, so it is
necessary a set of transformations to transform the tracking system data to the Camera’s position and reference.
As a starting point it is considered that the Camera is at the position P1, looking at the reference R1 point. The
absolute angle for which the Camera is looking is:
Using the raw data from the tracking system, the forward (δf), side (δs) and rotational (δθ) displacements are
calculated (See Appendix A and Fig. 6). The translational displacement vector (red vector, Fig. 6) is transported to
the world referential:
is the rotational matrix around the y axis for an angle . The final position will be P2 = P1+d. Where
The final reference will have to take into account the rotational displacement:
Fig. 6 Closed loop geometrical transformations to reconstruct the virtual trajectory of the fly.
2.2.3 Item Behavior and Update
In a realistic implementation of a virtual world, the visual scene is integrated with the dynamic behavior of the
items. The visual scene is defined by the Camera, by the Models, and by the Positions of the items (see Appendix B).
The behavior is divided in two components: the Behavior and the Update Routine. The Behavior works as the
artificial intelligence of the item and allows it to respond with different actions (change the Update Routine) to
different conditions (example: collision with the Camera). The Update Routine is the update of the object’s
properties according to the imposed by the Behavior. This artificial intelligence is implemented through a Behavior
Tree organization (see Appendix C). The main reason to use such organization is that it provides a mechanism to
(2.1)
(2.2)
(2.3)

16
automatically arrange the experiment based on the contingencies defined by the experimenter and the behavior of
the animal. Thus, Behavior Trees provide the World Objects and the experiment itself with some level of artificial
intelligence. By using defined actions, conditions and decorators for the Behavior Tree (see Appendix C), the user
can set many different types of protocols without having to implement them in C#, allowing inexperienced users, or
non-programming users to be able to take full advantage of the software.
The update Routine updates the state of each World Object at each cycle. For each Update Routine there is a
Update Service:
Rotate Service - Receives the values of the speed and rotation axis, and generates a continuous rotation of
the model around the axis with the desired speed.
Move Service - Receives the final position in world coordinates and translate instantaneously the model to
that position.
Slide Service - Receives values for speed and direction, and moves the model through that direction with
the defined speed.
Move with Camera Service - Moves the model with the Camera so it looks like it did not moved at all
(generating an artificial open loop).
2.2.4 Physical rules: Collisions
A collision mechanism is a physical rule within the VR that detects the interception between two World
Objects. Detecting collisions with the mesh models of the objects can be a computationally heavy procedure, so a
good solution is to wrap the models with simple bounding surfaces and implement algorithms that detect the
interceptions between the simple surfaces.
Bounding surfaces
The simplistic collision mechanism implemented in the software is based on two objects: a rectangle and a
sphere. The sphere is the bounding surface for the Camera, while any other World Object model can be roughly
wrapped by a set of rectangles (Fig. 7).
Fig. 7 Example of bounding boxes. The models are surrounded by sets of squares. The Collision Service detects whether any of the squares intersects the camera’s bounding sphere.

17
Intersections
The Collision Service for the World Object includes the set of bounding objects that surround the object’s
model and the functions to detect intersections between the owner bounding objects and the other Collision Service
bounding objects. Furthermore, the Collision Service uses a method that calculates the penetration factor between
the Sphere and another surface.
The implemented Collision Services are:
Collision Sphere - This service bounds the model with a sphere centered in the World Object’s, given the
sphere radius.
Collision Cylinder: Bounds the model with a cylinder centered in the World Object’s position, given the
radius, the height and the number of faces.
Collision Box - Bounds the model with a box around the mesh model with well-defined higher and lower
vertexes, can accept the mesh model as an input, then the algorithm generates the box.
Collision Room - Bounds the model with a box centered in the object, given the height, width and length
of the box.
2.2.5 Create a Virtual World
The virtual world itself is a World Object called root. The root is the only World Object implemented in the
source code. Essentially, to build up a virtual world means to fill the lists of the root World Object.
The World Object hierarchy is created by placing children World Objects inside their parental World Object’s
list. Therefore the root will be the highest World Object, parent of all the others.
The individual features for each item are set in the Factory list. Each Factory initializes the correspondent
Service during runtime. Factories are very simple objects that receive the relevant parameters and initialize Services
when required. The list of Factories for each World Object must be defined completely (i.e., with the defined values
for all parameters). A special Factory is the Model Factory. The model Factory contains only the link to the location
where the mesh model file resides, and the name of the mesh model file.
A graphical user interface (GUI) was created to help the users to build their virtual worlds. Using this GUI, it is
possible to add and remove World Objects as well as their services from the World Object tree. The GUI also allows
visualizing in real time the world that is being designed. Figure 8 shows the main window of the CreateWorld
program. The program can be run from inside the VR software platform or opened independently to create a virtual
world.
While the user is adding World Objects to the World Object tree and setting their properties (Fig. 8) the
program displays the world that is being created. When the virtual world is finalized, the user press “Export World”
and the program automatically generates the .XML file in a user specified directory. The generated .XML file is ready
to run in the VR platform or to be integrated in an experimental protocol.
The mesh models for the objects are drawn and textured using Blender and exported to the .FBX format. To
be read by the XNA framework the .FBX models have to be converted to .XNB format. The Model Factory only
has two parameters that are the link to the directory where the respective .XNB file is located and the name of the
model. The GUI has the option to load the .FBX model and convert it to a .XNB file. The way the conversion is
done is by creating an MSBuild project in memory that builds the .XNB file and place it in a temporary directory,

18
then the file is transferred to a stable directory inside the program and the link to this directory is provided to a
Model Factory.
Fig. 8 Main window of the CreateWorld program.
Fig. 9 Object Editor window. This window pops-up if the user adds a new object or if the user double click an
existent object in the World Object tree.

19
2.3 Run an experiment
2.3.1 Experimental protocol language - Behavior Tree
The experimental protocol is written using the language of a Behavior Tree (Appendix C). The power of the
Behavior Tree allows creating any kind of Experimental Protocol. In Appendix C there are examples of protocols
used in the experimental part of this thesis that exemplify the power of this language.
2.3.2 Create experiment and store as a .XML file
The VR platform also allows creating the experimental protocols. If the user selects the option New
Experiment inside the Main Menu of the application, a window will pop-up. The program saves the configurations
for the experiment (including the designed virtual worlds) in a .XML file.
Fig. 10 GUI to create an experimental protocol.

20
Fig. 11 Example of a virtual world composed of a drum with a chequerboard floor and stripped wall. The drum
contains few items like the apple that is visible. In the right is a part of the XML file with the information for the
concretion of the virtual world
The VR software is a universal framework for experiments in VR whose modular architecture allows to
generate virtually any kind of virtual world and rules for the world as well as to set up any kind of experimental
protocol. This ability to adapt protocols to the evolution of the experiment project together with the ability to
communicate with different devices makes this novel software an important platform for different research that uses
closed loop. The software together with documentation and demos can be obtained for free at http://bit.ly/18ht9OB.

21

22
Chapter 3
Virtual Reality Projection System
3.1 Overview of the projection system
3.1.1 Specifications for the projection system
A major difference between the developed VR system and the state of the art VR systems is in the visual
stimulus presentation. The visual system of Drosophila has a very high temporal resolution but a very low spatial
resolution. For this reason, historically, visual stimuli have been presented in the form of physically moving screens
containing textures22 or patterns created by controllable LED arenas28. Both types of displays have practical temporal
limitations for the presentation of complex stimuli, or to generate a naturalistic full closed loop between the fly and
the virtual environment.
Another characteristic I took into account when designing the projection system was the very wide field of view
of the fly’s visual system. Drosophila has a horizontal view angle close to 270º and a vertical view angle of almost
180º. For this reason, even for a tethered animal, the projection system has to be placed all around the subject.
To present a controlled and well-defined stimuli, it is also necessary that the light intensity profile is
homogeneous everywhere.
Fig. 12 Summary of the biological constrains introduced in the projection system design.

23
3.1.2 Materials and methods
The developed projection system comprises the projector, the screen and the software used to adjust the image
to be shown by the projector.
Projector
The projector is a modification of a commercial version of a DepthQ-WXGA DLP projector from Lightspeed
Design, promoted by Anthony Leonardo at Janelia Farm. The main modification from the commercial version is the
removal of the color wheel, and of a 120Hz white segment characteristic of this type of projectors. Within the
principal features of the acquired projector are high resolution and independent control over the brightness, contrast
and sharpness of the image.
Screen
To project the image a diffusive paper supported by a cylindrical acrylic structure was used. Black cardboard
covered the non-stimulated regions of the field of view of the fly.
Software
The software to drive the stimulus to the projector was the VR software described in Chapter 2. The platform
described before was extended to accommodate the specific requirements of our projection system’s configuration.
3.2 Projection system implementation
3.2.1 360 Hz Projector
The principle of projection of a DLP projector is a chip with a matrix of small mirrors whose orientation
is driven by an electric signal. Light from the projector’s lamp gets to the matrix of mirrors and is reflected by them.
Different electrical signals are transduced into different percentages of reflected light, in that way it is possible to
generate light patterns that can update at very high speed. Color is added by rotating a color wheel in front of the
reflected image (the sum of the green, red and blue frames generates the color image). DLP projectors are a recent
technology and are being widely used in cinema and 3D projection technology for the requirement of high frame rate
and larger high definition systems.
In order to be able to achieve a 360Hz refresh rate it was necessary to remove the color wheel from the
projector and change each of the red, blue and green frames for a normal frame. In this way the normal 120Hz
projector can project images at a rate of 360Hz (Fig. 15).
The RGB frames were used as shader frames within the VR software. A shader is a post processing program
that adjusts the rendering effects in the GPU (Graphics Processing Unit). More specifically a pixel shader is the
shader responsible to compute color and other attributes like transparency.
To apply the shader in the VR platform, a mesh model (virtual screen) was created and textured with the
rendered VR image using a pixel shader. The VR image is updated and rendered to a texture format. This process
repeats 3 times so that 3 consecutive VR images are stored. Using the pixel shader to texture the virtual screen, the 3
color channels of the texture are used by the 3 updated VR images.

24
The projector is optimized to project big images far away from the light source. The developed system requires
a small image, projected close to the animal. To be able to focus such a small image with high resolution the optics
of the projector had to be changed. The easiest way of changing the magnification is to increase the distance between
the lens and the source:
Including the condition for focusing:
By introducing 3mm spacers between the lens set from the projector and the source, the magnification was
reduced without losing the focused image.
3.2.2 Projection surface design
Although the fly’s head is fixed in space, the high viewing angles makes it necessary to wrap the projection
surface all around the animal. The designed projection surface is made of diffusive paper in a cylindrical
configuration with 25 mm radius and 49 mm height, held by a custom made acrylic structure. The paper covers 180º
of the horizontal view angle of the fly and 63º of the vertical view angle of the fly that is not covered by the ball.
With some calculations considering the geometrical arrangement of the treadmill system and screen, the expected
amount of the vertical viewing angle covered by the ball is around 68º for an 8 mm ball and of about 78º for a 9 mm
ball (eq 3.4). The rest of the horizontal view angle of the fly is covered by black cardboard in order to reduce at
maximum the visual stimulation in those areas.
Considering that the fly’s head is aligned with the middle of the ball and the center of the ball as the origin; xi
and yi are the eye extremity coordinates and r is the ball’s radius. From the fly point of view, the angle is the
vertical view angle covered by the ball.
(3.1)
(3.2)
(3.3)
(3.4)

25
Fig. 13 Scheme of the vertical view angle of the fly.
To correct the XY image generated from the software in order to project it into a cylindrical surface the VR
software was used again. As explained in the previous section, the VR image is rendered to a virtual screen before it
is sent to the projector. The corrections are applied by manipulating the geometry of the virtual screen. For example,
if the screen is a cylinder, by using a cylinder with the correct dimensions as a virtual screen and by texturing the
external surface of the virtual screen cylinder with the VR image, the projected image will perfectly map the real
screen and no distortion will appear. With this method it is possible to apply, corrections that would allow to use a
big range of different configurations for the projection surface.
Fig. 14 Designed cylindrical screen: The fly is located in the center of the screen, the 180º in front of the fly are
made of diffusive paper and the lateral parts are black cardboard. An acrylic structure was built to support the whole
screen.

26
3.2.3 Image splitting and homogeneous projection in a 180º surface
Two problems of using a single light source and a cylindrical screen are that a profile of intensity will appear
(higher intensity in the frontal part and lower intensity in the lateral part) and the distance between the lateral and
front parts will introduce defocusing in one of them when the other is focused. The solution to these problems is to
introduce more than one light source. Using more than one projector could give rise to synchronization problems;
since we were using only a single image generator this option was discarded.
The second option was to split the image in two from the single projector and make the two images focus
laterally in the screen. The VR image splitting have to be divided in two using software and each part of the image
has to be collected by a different path that will send them to the respective side of the screen. The VR image splitting
was done inside the VR platform. Using as a virtual screen a split model, the VR image that texture the model will
appear split in two.
A mirror system was designed to collect both images and projects them to the respective sides. The central
piece has two mirrors at 45º and each part of the split image is collected by one of these mirrors (Figure 13). The
image from the central mirror is reflected by the lateral mirrors, which send the image to the screen.
By adjusting the size of the virtual screen and the mirror distance and orientation, it was possible to reconstruct
the initial VR image on the screen. Using this method I was able to get rid of the intensity profile and defocusing
problem (Fig. 15).
Fig. 15 Left: picture of the image splitting structures. The image is then joined and focused on the screen. 1 –
Neutral density filter holder; 2 – Lateral mirror holder; 3 – Central mirror holder. Right: Design of the mirror holders
to split the image.

27
Fig. 16 Top: Intensity profiles measured using and not using the split system. Measurements were performed with a
photodiode and projecting a white homogeneous image. Bottom: Flicker rate test. An image that changes from black
to white with a frequency of 360Hz was sent to the projector and the light was collected with a photodiode (black
trace).
3.3 Summary of the developed VR system
A virtual reality system for tethered walking Drosophila was designed and cosntructed. The system was named
of “FlyVRena” afterwards. The VR is composed of a tracking system, a projection system and the software.
For tracking, a treadmill system designed in Janelia Farm20 was used. The fly walks “on spot” on an air
suspended ball whose rotations are continuously tracked by a set of IR motion sensors. The rotation data is streamed
at 4kHz to the computer where it can be used to reconstruct the walking trajectory of the fly. It was part of the work
to build, test and calibrate the treadmill system (see Appendix A).
A new VR software platform with a unique architecture was developed. Such platform allows the user to
generate any kind of 2D or 3D virtual environment and to build any kind of experimental protocol. A GUI was also
created to allow inexperienced users to use the platform in an easy and visual way. The software can integrate the
data stream from the treadmill and use it to update the rendered VR image. Apart from the innovation in terms of
architecture and the possibility to generate any kind of virtual environments and protocols, the software is also an
improvement when compared with the existing platforms because it contains a collision mechanism that allows

28
introducing physical rules for interaction. Furthermore, because the VR system is very modular, it is easy to expand
and accommodate any specific projection system, or to control other external devices.
The projection system is based on a high frame rate projector and a cylindrical screen. The image is displayed
180º around the animal at a distance of 2.5 cm. A custom made method to split and guide the image was developed
to allow a homogenous image quality.
Fig. 17 Picture of the fly behaving in the Virtual Reality system: 1 – Fly on a walking on a 9mm floating
polyurethane ball; 2 – Ball holder; 3 – Pole to position and hold the fly on the ball; 4 – IR motion cameras that
record the rotations of the ball; 5 – Screen; 6 – Projection system; 7 – Dimmer intensity photo to observe the
presented stimulus.
29
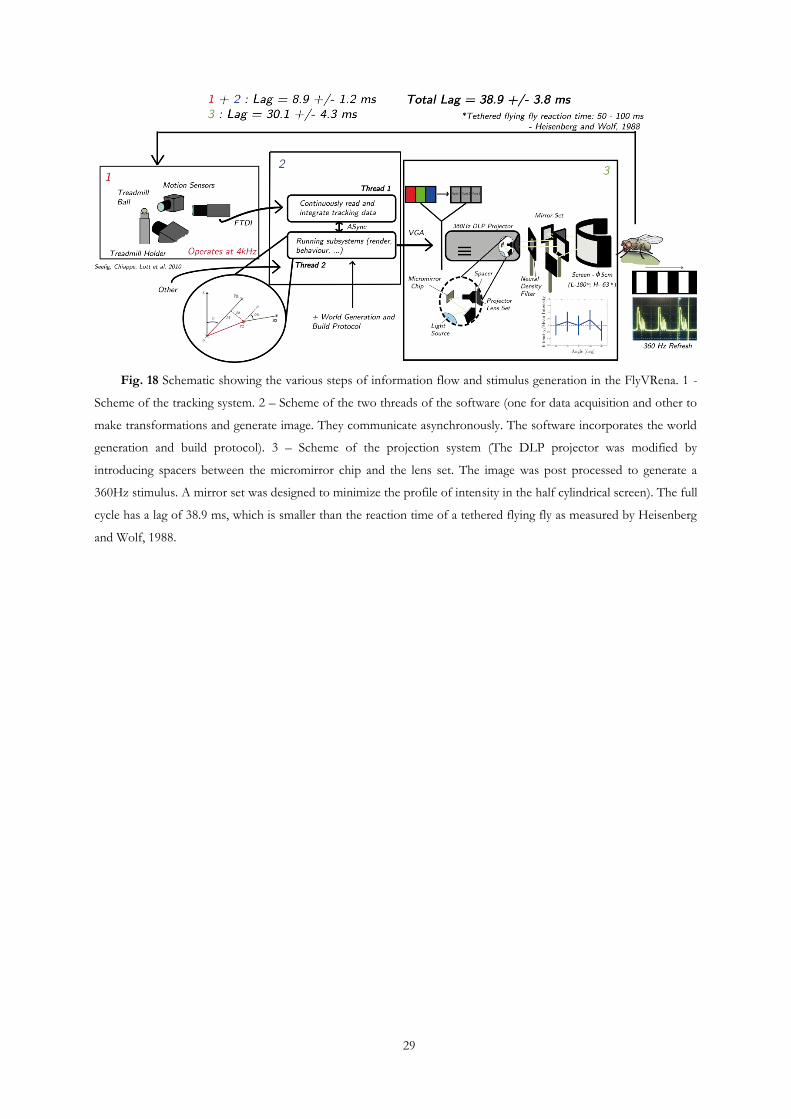
Fig. 18 Schematic showing the various steps of information flow and stimulus generation in the FlyVRena. 1 -
Scheme of the tracking system. 2 – Scheme of the two threads of the software (one for data acquisition and other to
make transformations and generate image. They communicate asynchronously. The software incorporates the world
generation and build protocol). 3 – Scheme of the projection system (The DLP projector was modified by
introducing spacers between the micromirror chip and the lens set. The image was post processed to generate a
360Hz stimulus. A mirror set was designed to minimize the profile of intensity in the half cylindrical screen). The full
cycle has a lag of 38.9 ms, which is smaller than the reaction time of a tethered flying fly as measured by Heisenberg
and Wolf, 1988.

30
Chapter 4
Behavioral analysis of tethered walking
A system designed to reproduce natural behavior in simulated environments must allow the animal to do
normal locomotion. The tethered fly on a ball is a paradigm that introduces some constrains to the animal’s normal
walking.
In this chapter, I will present a series of experiments that aimed at understanding the limits of such a system
when compared to free walking flies, and within this constrains, they also aimed at optimizing the locomotive
behavior of a fly on a ball.
4.1 Optimization of the walking in a ball behavior
4.1.1 Analysis of walking in head-free and head-fix flies
The real advantage of a tethered walking behavior system is that it can be incorporated in physiological studies
to record the activity of neurons in simultaneous with walking. This is specially relevant for tiny animals like
Drosopila. However, the fixation of the fly to a pin and the spherical surface of the treadmill will influence the
physics of walking, for head-fixed flies lack the neck connectives proprioceptive system, and the mechanics of
walking on a curved surface may be different than to a flat one. The gating structure of walking on curved surfaces
has not been characterized yet.
A hint of the effects of the ball and the head-fixation on walking came from previous experiments done in the
lab. The mean translational speed of the flies freely walking on a flat surface was about an order of maginitude larger
relatively to walking on a ball (Fig. 19). The rotational velocity, on the other hand, was comparable between the two
conditions, suggesting that animals walking on the ball had more difficulty in moving forward. I first wanted to
analyze the source affecting walking on the ball. The flies used in the previous experiments were the wild-type DL,
and animals were starved (with access to water, i.e., wet starved) over-night to increase locomotove activity.

31
Fig. 19 Previously obtained results for free walking flies and tethered flies walking over a 6mm ball, adapted from
Seelg, Chiappe et al 2010. The plots on top (a and b) represent the mean and standard deviation for the forward
velocity of individual flies in free walking conditions (a) and walking on a ball (b). The bottom plots (c and d)
represent the mean and standard deviation for the rotational velocity of individual flies in free walking conditions (c)
and walking on a ball (d).
The difference observed in free vs. tethered flies may be related to either the fixation of the head, the ball per se,
or a combination of the two. We first tested the head fixation hypothesis by tracking the movement of fully fed and
wet-starved head-free and head-fixed flies while they freely walk in a circular arena. This experiment was made in
collaboration with Veronica Corrales from the Ribeiro Lab, who developed a tracking system for free walking flies.
Individual flies were placed in circular homogenously illuminated arenas with no conspicuous landmarks. A
medium-speed camera (50 Hz) captured the fly’s positions for 90 minutes. The videos were analyzed offline, and the
positions of the fly’s centroid were extracted. I first compared the time moving and the distance walked by each
category (fixed/free head, metabolic state) (Fig. 20).
Fig. 20 Box plots of the total distance walked (a) and percentage of time walking (b) for the different categories:
Fully Fed Head Fixed (FF-HFix), Fully Fed Head Free (FF-HFree), Wet Starved Head Fixed (WS-HFix), Wet
Starved Head Free (WS-HFree). A Mann Whitney test showed non-significant differences (p > 0.05) between head

32
fixed and head free flies in terms of percentage of time walking, and significant differences for the total travelled
distance between the head fixed and head free flies.
There was no significant difference in the percentage of time walking among all categories, however, head-fixed
flies travelled significantly shorter distances than head-free flies, indicating that their walking speed might be on
averaged slower. I then analyzed the walking speed distributions in all four categories of flies. Head-free flies have an
increased probability of walking faster than head-fixed flies, whereas the opposite happens with head-fixed flies (Fig.
21). To quantify this, I divided speeds in two groups by setting two thresholds: the first, to distinguish walking from
non-walking animals was set at 1 mm/s. The second threshold, to differentiate slow from fast walkers, was set at the
point where distributions crossed each other, at 7 mm/s (Fig. 21 and Fig. 22).
Fig. 21 Walking speed distributions across the different categories. The solid line represents the mean distribution
and the shadow represents one standard deviation from the mean distribution. A threshold to cut small
displacements was applied in order to keep just the putative walking.
Comparing the distributions of all the animals within these “slow” and “fast” categories reveals that head-free
animals have a higher probability of walking fast independent of their metabolic state (fully fed vs. wet starved).
Head-fixed flies show a higher probability of walking slow, and this also seem independent of the metabolic state
although the in the wet starved animals the tendency does not reach statistical significance (Fig. 22).

33
Fig. 22 Quantization of the effect observed in the histograms of Fig. 21. Box plots for each fly’s category
representing the probability of exhibiting a certain speed category (slow of fast according to the criteria explained
above). Head fixed flies show higher probability of exhibiting slow speeds and head free flies show a higher
probability of exhibiting fast speeds. The performed statistical tests were non parametric Mann Whitney and the
differences were considered non-significant for p > 0.05.
The data collected with free walking flies demonstrates that fixating the head of the flies leads to a change in
walking behavior. Therefore, the reduced translation speed observed in walking flies on a ball when compared with
free walking conditions is partially due to head-fixation condition. To assess the effects of the ball on walking
behavior (inertia, surface curvature, potential uncontrolled vibrations) it is important to compare the head-fixed free
walking with the flies walking on a ball, which has not been done in the past. The mean forward speed of head-fixed,
free walking flies was calculated considering just the trajectories about 10-body length (2 cm) away from the walls of
the arena (Fig. 23).
Fig. 23 Mean speed across Starved DL flies in free walking conditions for the previous studies (a – same as Fig. 17a),
for the data collected in my experiments (b) and mean speed for head fixed free walking conditions (c).
The difference between flies walking on the ball and head fixed free walking flies is much smaller than the
difference between flies walking on the ball and free walking flies (Fig. 23). This result suggests that the head fixation
is having an effect on reducing the forward speed of the flies. The performance of flies on a ball is still worse than

34
head fixed free walking flies, suggesting that the effect of reduction of the forward speed is a combination of both
the ball and the manipulation of head fixating the flies.
4.1.2 Biological and physical optimization of walking on the spherical
treadmill
Physical Factors
Previous experiments were performed with a 6mm ball to minimize the mass of the treadmill20. However, a 6-
mm ball offers a higher radios of curvature and it is more prone to instabilities due to turbulence in the air stream. I
reasoned that, albeit heavier, a 9-mm ball provides an almost flat walking surface for the fly. I therefore use and
analyzed walking-on-a-ball performance with this larger spherical treadmill.
Biological Factors
Biological factors like genetic background of the fly (i.e. fly strains), the age, the metabolic state, or the animal
gender can influence the performance of a behavioral task. For poikilothermic animals, this behavioral performance
can be further modulated by temperature. Therefore I sought to find a proper set of biological factors that would
produce the best performance of tethered walking on a spherical treadmill.
This optimization is an important step since head-fixed animals can perform very poorly given their stress
because they are restrained. Knowing how to develop the conditions for the animals to walk as similar as in free-
walking conditions will facilitate our experiments in the VR set-up.
4.1.2.1 Methods
Flies were fixed between the head and the shoulders to a tungsten filament to prevent them from rotating their
head. The tungsten filament was soldered to a holder that was attached to a pole and a micromanipulator. A single
fly was positioned on top of a 9mm ball with the help of the micromanipulator. Usually, the fly stayed on the ball in
the dark for 30 min before the recording started to adapt to the ball (Fig. 24). Using the VR system, I recorded the
walking activity of flies on the ball in the dark for 95 minutes; separating the recording session in 2-minute trials
interleave with 20- second inter-trials.
Fig. 24 Pictures of a tethered fly on the ball. Left: back view. Right: side view.

35
All the fly strains were wild types, capture in the wild in Lisbon (WOL-) or in Southern California (DL). All flies
were tested in wet-starved and full- fed metabolic states (Fig. 25). The age of the animal and the time of the day at
which the experiment was run were always recorded.
4.1.2.2 Results and discussion
When flies are stressed or uncomfortable, they tend to stop walking and groom. For this reason, the parameters
to analyze behavior on the ball across flies were the percentage of time per trial that they spent walking, total
travelled distance, mean translational and mean rotational speed, and the relation between the two.
Fig. 25 Box plots of the percentage of time moving for each trial for the 4 categories – Starved and non-starved DL
(a); Starved and non-starved WOL- (b). For both plots the difference between starved and non-starved have a p <
0.05 with a Mann Whitney test.
For both wild types lines, starved flies tend to walk more time than the fully-fed flies. WOL- flies have a broader
distribution of percentage of time walking than DL flies, which means a more variable behavior. Starved DL flies
spent the largest amount of time walking, and this performance was observed in the majority of flies (Fig. 25).
To investigate the influence of the age of the animal and the time of the day of the experiment on the animal’s
behavior, I analyzed the percentage of time walking distribution for the starved DL group, dividing it in different
ages and times of the day (Fig. 26 and 27). Three-day old and starved DL flies tested in the morning was the group
that showed more walking behavior on the 9-mm ball. For the rest of the experiments I will use this group of
animals to analyze their walking performance on the ball.
.

36
Fig. 26 Box plots of the percentage of time walking for each trial across 5 different ages for the starved DL flies. 3
day old flies have a higher percentage of time moving with a significance of p < 0.05 with a Mann Whitney test for
all the other ages.
Fig. 27 Box plots of the percentage of time walking for each trial across 4 different times of the day at which the
experiment was performed. Only starved DL flies were used. Flies ran in the morning have a higher percentage of
time moving with a significance p < 0.05 with a Mann Whitney test when compared with noon and afternoon flies.
The difference against flies running during the night was not significant.
In contrast to the previous study [Seelig, Chiappe et al. 2010], DL flies walking on a 9-mm ball do not display a
striking difference in translational walking speed when compared to head-fixed free walking flies (see section 4.1.1)
(Fig. 28). Furthermore, rather, there is a reduction on the rotational speed (Fig. 28). The values for rotational speed
obtained with my data are also comparable with those for head-fixed free walking conditions, suggesting that the
flatter surface of the 9-mm relative to the 6-mm ball allows for a more natural walking gate albeit the difference in
the inertial properties of the larger ball (i.e, increase mass), which may affect reaction times (data not shown here).

37
Fig. 28 Mean forward (left) and rotational (right) speeds calculated for the starved DL flies used in the previous
experiment. The color means the mode (see section 4.2) the fly is exhibiting (blue – mode 1; red – mode 2; green –
mixed mode)
4.2 Analysis of the walking on a ball behavior
4.2.1 Modes of walking and relevance
Many parameters were used to calculate and characterize walking behavior on the spherical treadmill. In one set
of analysis, I compare total walked distance vs the number of rotations of the ball made by the walking fly. Basically,
this is a comparison between mean rotational and mean translational walking. When these parameters were plotted
for each trial (Fig. 29), I observed that some flies showed a correlation between the number of rotations (number of
times cumulative absolute value of the angular displacement was equivalent to a 360º turn) and the total distance
(cumulative translation) (blue data points aligned – mode one). Other flies display no such correlation; the value of
the correlation was comparable with zero (red sparse cloud of points – mode two). Moreover, there were also flies
whose cloud of points looked like a mixed state between the mode 1 and mode 2 (green, mixed mode) (Fig. 29).
.
Fig. 29 Scatter plot of the rotations versus the travelled distance for each trial. The size of the points code for the
percentage of time moving. The three modes are color coded. On top right is the frequency histogram for each
mode between the two wild types tested.

38
If the segregation in modes of walking was an effect purely induced by external factors like the positioning on
the ball, it would be expected equal frequency for both wild types to behave in a specific mode. This was not the
case. By analyzing the frequency that each mode occurerd for each wild type we concluded that DL flies tend to do
more mode 2 walking than any of the others. WOL- flies, on the other hand exhibit more the mixed mode. Using
this cathegorization, the next analysis checked if the walked distance, time moving and rotations have any variation
between walking modes (Fig. 30).
Fig. 30 The two modes of walking have differences in terms of time moving (a), total distance travelled (b) and less
significant difference for the number of rotations (c). Mode 2 flies displayed higher percentage of time walking and
higher total distance travelled.
Flies that exhibited mode 2 spend more time moving and walk larger distances when compared to flies that
exhibited mode 1. For the total number of rotations the difference between the two modes is not significative. Mode
2 seems to better perform over mode 1, mode 2 flies can translate forward realtively more easily on the ball than
mode 1 flies. However, it is still unclear whether these different modes relates to different walking gates on the ball.
For this, in the future, I will track legs motion in simultaneous with the ball rotations. When analyzing both forward
and angular velocities, I observe that flies exhibiting mode 2 show larger forward speeds than mode 1 and mixed
mode flies (Fig. 29).
The biological significance of these modes of walking is still an open question.
4.2.4 Learning and performance improvement
Interestingly, flies tend to improve their performance of walking on a ball with the passage of time. In this
section I will focus on this effect in my analysis of the collected data. The improvement index for the time moving,
forward speed and rotational speed were calculated by fitting a linear function to the values of the parameters across
the sequence of trials. The slope of the function was used as quantification for the improvement over time (Fig. 31).
There is a strong and consistent tendency towards positive improvement indexes. This means that the flies improve
their performance over trials, they “learn” to walk on the ball.

39
Fig. 31 By observing the mean and standard deviation of the improvement indices for the percentage of time
walking (a), forward speed (b) and rotational speed (c) one can see that different modes of walking show different
improvement tendencies.
I next analyzed if walking learning was similar across flies displaying different walking modes. No difference
was obtained for the time moving improvement index between mode 1 and mode 2 flies. There is a significant
difference between the forward speed improvement between mode 1 and mode 2, being the mean value higher for
mode 2 flies. For rotational speed, the mean value for the mean improvement index was higher for mode 1 flies than
for mode 2 flies, although the difference was not significant (Fig. 31).
Mixed mode flies tend to have higher improvement indexes than any of the other modes for all the parameters
analyzed. To further investigate the temporal aspect of this mode of walking, the data for the flies behaving in this
mode was plotted as rotations versus walking distance, using a color map to give the information of the temporal
sequence of trials (Fig. 32).

40
Fig. 32 Data for the flies behaving in mixed mode plotted in the space of rotations versus walking distance using a
color map to give the information of the trial number.
Flies in mixed mode have an initial behavior as mode 1 flies and transition into mode 2 during the experiment.
Because mode 2 flies have higher forward speeds and spend more time walking than mode 1 flies, this result
supports the hypothesis that mode2 is an improved walking mode over mode 1.
Although the biological meaning of these modes of walking is still unclear, these results together with the
comparison with free walking flies (Fig. 23 and 28) shows that mode 2 is more similar to free-walking conditions
than mode 1, as defined by the mean speeds and time spent walking. Furthermore, the flies that exhibited this mode
of walking more (starved DL) are the same flies that had higher and more consistent percentages of time moving
seen in the first section of this chapter.
4.2.5 Effect of the projector’s light
Except for the free walking flies, all the data discussed so far was obtained with flies walking on a ball in the
dark. The last analysis on the performance of fly walking on a ball tests if the light have any effect on the walking
behavior of the fly. A protocol was created where 3-day old starved DL flies were submitted to a 20-min interval of
dark environment followed by 20 minutes of homogeneous gray image followed by 20 minutes of a full field stripped
pattern with maximum contrast, ending with another 20 minutes of dark.

41
Fig. 33 There were no strong significant effects of the light on the percentage of time moving (a), forward speed (b)
and rotational speed (c). The plots represent the mean and standard deviation for each parameter for each segment
of the protocol.
No significant difference was observed for the percentage of time moving. The significant difference between
the two dark segments is explained by the improvement of performance with time shown in the last section. Similar
results were obtained for the other parameters. (Fig. 33) In conclusion, the presence of a static pattern or mean
illumination does not modify the results I obtained for the characterization of walking performance in the dark.
The results from this chapter show that 3 day old starved DL flies were the ones that performed better on the
ball. Using a 9mm instead of a 6mm ball for the virtual reality was an improvement in terms of approximating
tethered walking to free walking. It was observed that in terms of rotational speed the tethered flies approximated
the free walking conditions but in terms of forward speed they still under-perform. To further investigate the origin
of this problem, I analyzed free walking head fixed flies that showed similar under-performance in terms of walking
speed when compared with head free flies. This indicates that the difference seen between flies on the ball and free
flies can partially be explained by the manipulation itself (i.e. head fixation) and not only by the walking on a ball.
Such results are important to understand the developed system and characterize how different the walking
behavior in the VR system is from the natural free walking situation. They were also important to optimize the
system in order to increase the number of flies with good performance of walking on a ball behavior.

42
Chapter 5
Analysis of fly orientation behaviors
using FlyVRena
In chapters 2 and 3, together with the appendixes A, B and C, I described the design, development and
construction of a VR system for tethered walking Drosophila. In chapter 4, I have presented a set of experiments
that provide some explanation about the source for the observed differences between tethered- and free-walking
conditions, and optimize the some (biological and physical) parameters for fly-on-a-ball locomotion. Here, in the
fifth chapter of this thesis I will test the flyVRena system by evaluating the fly’s interacting behavior with static and
moving objects in open-loop, closed-loop, 2D and 3D experimental conditions.
5.1 Response to small objects – Object tracking open loop
5.1.1 Object tracking
It is known that two conspicuous and inaccessible objects located in opposed positions in a circular arena
engage the fly in back-and-forth, straight trajectories between them: flies keep visiting them continuously30. A similar
experiment was performed in tethered flies and virtual objects and the same oriented behavior was obtained31. In
such experiments the experimentalist used the measured rotations of the fly to update the angular position of a big
the stripe in relation to eyes of the fly. Such results were observed both on tethered flying flies and on tethered
walking flies. More recently a work was published were it was shown that flying flies responded differently
depending on the size of the objects32.
The next set of experiments are both a proof of concept for the VR system in terms of the animal response to
small field stimulus, and also a test about size preferences of walking flies tracking moving objects.
5.1.2 Method
Virtual worlds composed of a homogeneous white arena with a black stripe of different sizes were presented to
the fly. From the fly’s point of view the bars were 17º in width and could have 6 different heights. These are defined

43
as the percentage of the vertical stimulation area that they occupy. For the following experiments, I used 8%, 31%,
53%, 71%, 87% and 100% total elevation bars.
The bar oscillated in a sinusoidal way in front of the fly with a frequency of 0.13 Hz and amplitude of 22.5º.
Trials that incorporate different bar sizes were shuffled. The implementation of the protocol is explained at the end
of Appendix C.
5.1.3 Results and discussion
Figure 34 shows the angular displacement of the fly (black trace) and the bar (red traces) across time for two
representative trials of different flies performing either a good tracking response for a 100% height bar (left), or not
tracking the bar (right).
Fig. 34 Example representative of good tracking (a) and example representative of no clear tracking (b). The red
signal corresponds to the bar oscillation normalized to the maximum amplitude of the fly’s rotation and the b lack
signal corresponds to the fly’s rotations.
The angular orientation of the fly as function of time is the sum of a sinusoidal signal with the same frequency
as the stimuli and a drift with a much lower frequency that correspond to a walking bias of the fly (Fig. 34 Left).
Such bias can be related to its positioning (easier to the fly to turn to one side than the other) and the inertia of the
ball.
To better observe the walking modulation due to the moving bar, the data was averaged and a high pass filtered
to remove the bias of the fly (Fig 35). Then, the cross covariance between the signal of the bar and the fly’s angular
rotation was calculated. To test the significance of the cross covariance analysis, the non-filtered data was shuffled,
filtered and the cross covariance calculated. This process was repeated 1000 times for each bar size, and for each fly
to obtain the null distribution of the cross covariance coefficients (data not shown). The original cross covariance
coefficient was considered relevant if it was part of the 2 tails of the distribution (<4.6% of chance probability).

44
Fig. 35 Filtered version of the data from Fig. 32. The red line represents the stripe oscillation normalized to the fly’s
rotation and the black trace represents the rotation without the drift. The insets represent the cross covariance values
plotted against the lags for both cases.
The higher the cross covariance, the closer the two signals are, the better the tracking behavior of the fly is.
Thus this parameter can be used to describe the quality of the tracking behavior across sizes and across flies (Fig.
36). The analysis of the mean tracking index of all tested flies indicates that the size of the bar influences tracking
behavior (Fig. 37). The fly follows larger bars better. These results are different from others obtained using a similar
protocol but studying flying and not walking tethered flies32. In flying flies, small objects are actively avoided,
whereas large bars are attractive. In walking, however, although small bars are more difficult to follow, they are not
aversive, i.e., non-negative coefficients or correlation was observed. Together, these results may indicate that the
different behavioral states (flying vs. walking) trigger different visuomotor reflexes, relevant for the particular context
of the fly. Alternatively, and less interesting, the difference between our study and the previous may rely on the
highly different projection systems (LED vs. projector).
Fig. 36 Maximum cross covariance for each bar size for each fly. These results were obtained for the bar oscillating
in front of the animal. The red dots correspond to data that did not passed the chance level threshold.

45
Fig. 37 Mean cross covariance for all the trials above chance level against bar size.
From this experiment it can be concluded that the flies are able to track objects of different sizes in the
developed VR system like they do in free walking conditions.
5.2 Response to rotational closed loop – Edge fixation
5.2.1 Edge Fixation
The previous experiments showed the ability of the fly to perceive small field stimulus. The next sets of
experiments were designed to test the capacity of the fly to control the virtual world in closed loop. The first
experiment was inspired from an old studies that showed that in freely walking conditions, flies are attracted by
edges33. I tested such result for head-fixed flies walking on the ball using the developed VR system.
5.2.2 Method
The stimulus was presented as a half black – half white drum in a rotational closed loop with the fly. In a
rotational closed loop situation, the rotation of the virtual world is controlled by the rotations of the fly, but the
translational movement of the fly does not make any influence in the virtual world.
Trials with 1 minute duration were interleaved with 1 minute long inter trials of plain darkness. 2-3 day old
starved DL flies were used.
5.2.3 Results and discussion
Figure 38 shows a 2D reconstruction of the virtual walking trajectory for two representative trials of two flies,
one fixating the edge (a), and the other not fixating the edge (b):

46
Fig. 38 2D reconstruction of walking trajectories. Flies can exhibit edge fixation (a) or now show any clear fixation
(b).
In order to know what the perceived stimulus was it is needed to analyze the temporal sequence of rotations
performed by the fly (Fig. 39). The blue lines represent the positions of the edge and the green zone represents a 90º
area around the edge. The time series of the rotations shows that for the fixating fly the absolute angle was kept close
to the angle where the edge is located, while for the non-fixating trial the fly passed by all the possible angles.
Fig. 39 Temporal sequence of the absolute heading angle of the fly for the two representative trials of Fig. 36 (black
lines). The blue lines represent the edge position and the green zone represents a 90º area around the edge.
Another way of looking at fixation is by plotting the angular occupancy of the fly using histograms (Fig. 41).
The histogram for the fixation trial is much sharper with a peak in the edge position, while the non-fixation trial is
much broader. In both cases there is a difference between the trial and the inter trial histograms.

47
To analyze the fly overall behavior, I reconstructed and plotted the virtual 2D trajectories within the world (Fig
40). While the non-fixating fly has trajectories all around, the trajectories for the fixating fly are much more
contained and directed towards the edge. The color code represents the trial sequence, being the green the earliest
and the red the latest trials.
Fig. 40 2D trajectories for a fixating fly (a) and for a fly not showing clear fixation (b). The color code represents the
temporal sequence of individual trials, being the green the first trials and red the latest. The circle represents the
virtual drum, with the edge at the position where it appears to the fly. Notice flies that can’t perceive getting closer to
the edge because the protocol runs in rotational closed loop.
Fig. 41 Overall histograms for the angular position of the fly. Both the histograms for the trials (top) and the
histograms for the inter trials (bottom) were plotted for the two representative flies from Fig. 38.
Taken together, this analysis show that flies detect and maintain a straight heading towards edges, similar to
what has been described previously in free-walking flies. However, this experiment is not as reproducible as the
tracking of objects. I calculated the percentage of time that the fly was in a 60º area around the edge position to

48
define fixation behavior. Figure 42 shows the fraction of trials in which that percentage is higher than 50% across
different flies.
Fig. 42 Fraction of trials in which the percentage of time that the fly kept the edge in front of her was higher than
50% across different flies.
The reasons for the lack of robustness of the behavior while compared with what happens in free walking flies
can be related to a sub optimal rotational closed loop gain. The used closed loop gain was the same obtained by
calibration of the treadmill system (Appendix A) that might not be the optimal gain for the fly.
5.3 Explorative behaviors in a 3D world
5.3.1 Full 3D Virtual Reality
So far the flies have shown good responses to small field stimulus (bar tracking) and even demonstrated the
ability to control the rotational closed loop paradigm (edge fixation). The next proof of concept experiment consists
on having the fly in full closed loop (rotational and translational) with a 3D naturalistic world.
Flies are attracted by large prominent objects. A more simple and restrictive adaptation of such a behavior was
also proved in the developed VR system in the open loop tracking and in the fixation experiments. The naturalistic
3D version of this behavior for head fixed insects was never described. In the following experiment I test the
explorative l behavior of a head-fixed Drosophila navigating a 3D virtual world.
5.3.2 Method
A world composed by a drum with random textured wall, a homogeneous floor, and a very high contrast pole
that could be in one of 3 initial positions. The floor was aligned to be at the ball level and the closed loop gains were
the ones resultant from the system’s calibration (Appendix A).
The protocol consisted in a series of 30 trials with 1 minute each. At the beginning of the trial the fly always
started from the same point, heading towards the same direction. The pole could be in one of three positions and it

49
was randomized in which position the pole would appear in the next trial. 3-day old starved DL flies were used in
this experiment.
5.3.3 Results and discussion
The following figure (Fig. 43) shows the 2D trajectories in the virtual world for different trials for different flies.
The first row describes the trajectory of one fly that was attracted by the pole. The second row describes a fly that
did not shown a clear attraction towards the pole. The columns are the different positions of the pole in the virtual
world (center, left and right). Within each plot, the dashed line represents the collision zone and the black circle
represents the position of the virtual pole.
Fig. 43 Top: Initial visual scene presented to the fly before being processed by the projection system. Bottom: 2D
trajectories in the virtual world for different trials. The lines represent different flies; the columns represent different
pole positions. The color code represents trial sequence, being the green the earliest trials and the red the latest trials.
The dashed line represents the virtual collision region between the fly and the pole (See section 5.4). The black dot
represents the pole position.
While the first fly tended to walk towards the object independently of its initial position, the second fly did not
orient towards the pole when it was initially at the right position. These results demonstrate the variability of the
explorative behavior among different individuals. Because the collisions might make the fly to continue trying to get
towards the pole, I calculated the percentage of the trial time that the flies spent around the object.

50
Fig. 44 Percentage of trial time that the fly spent around the object averaged across trials and separated for different
pole positions. Color code represents individual flies.
For the pole positioned in front of the fly the average values are usually higher than 50% than for poles
positioned laterally the value is usually lower but still significant. (Fig. 44 This may indicate that as the fly has an
expanded pole in front of her, she may not have other visual features to use to change heading. In the occupation
analysis, the 2D histogram for each trial for each fly was calculated. All the histograms for trials with the same pole
position were summed and plotted as a heat map and plotted in figure 45.
Fig. 45 Heat maps of the positions of the flies for the 3 different pole positions. The black circle is the pole
position and the dashed line is the collision region (See section 5.4).
The heat maps show that the flies are attracted to the virtual poles in the 3D virtual environment. The higher
occupations were the initial position, close to the object and in the wall. This behavior resembles what happens in
free walking flies, being a proof that a naturalistic behavior can be achieved using the developed virtual reality
system.

51
5.4 Analysis of the collisions in the virtual world
The previous experiment shows the ability of the flies to navigate the virtual 3D world and follow virtual visual
cues in a naturalistic fashion.
In natural situations animals are not able to pass through real objects that occupy physical space in their
environment. The flyVRena system is able to detect interceptions between the Camera and the virtual objects in the
virtual world but at present it does not include any mechanic association for a collision with a virtual object. In order
to give some feedback of collision to the fly, I created a collision rule that sends the virtual Camera to its previous
position and reference when the collision mechanism of the flyVRena detects an interception (only visual feedback
for the collision). The current section investigates the responses of flies to such a collision rule.
5.4.1 Method
The virtual world chosen to study the collisions was a long corridor with stripped long walls and a floor. Flies
start each trial at the center of the corridor and were free to walk during 1 minute. The procedure was repeated for
30 trials. Note that these experiments contain both translational and rotational closed-loop gains, the rotational gain
was reduced to 20% of the calibration’s value in order to reduce the strength of the rotations and improve the
control of the heading in the narrow corridor.
5.4.2 Results and discussion
Fig. 46 Flies can navigate on a 3D virtual corridor (a). The color map from blue to green label individual trials and
the red represent instants where collisions occurred, (b) and (c) are plotted in mm. Top: virtual trajectories without
considering the collision rule.
Bottom: virtual trajectories in the virtual world considering the collision rule explained above.

52
Flies can navigate the 3D corridor (Fig. 46 – Top). When the fly reaches the wall, the collision rule applies and
flies cannot pass through the wall in the virtual environment even though they don’t fell mechanically constrained by
the presence of the virtual wall. From the 2D reconstructed trajectories (direct stream of data from the treadmill
system, Fig. 46 - Bottom) it is visible that flies tend to keep walking with the same orientation even if they collide
with the virtual wall (Fig. 47 – Right), and rarely adjusted their heading to go back to the zone away from the walls.
This fact makes them to be trapped in the wall after the collision occurred (Fig. 47 – Left).
Fig. 47 After the first collision the flies tend to get trapped. Left: box plot of the probability of getting trapped at the
first collision for 5 flies that could walk in the corridor. Right: analysis of the orientation of the fly 0.5s before and
0.5s after the collision. Flies tend not to change the orientation.
Although the simplistic collision rule that was applied had the effect of trapping the flies on the walls after the
first collision instead of keeping them in the corridor, this experiment revealed that the trapping effect arises mostly
because flies did not changed orientation after collision. With such a result one can now design collision rules that
would help the animal re-orient after collision. By making use of the flexibility of the developed FlyVRena, future
experiments will test of different collision rules and introduction of other devices for to associate heat cues to
collisions in order to make the fly able to navigate a closed virtual environment with only visual feedback. If this
prove to be very difficult for the fly, other sensory modalities like temperature (i.e. walls are hot) may facilitate
keeping the fly off the walls . Note that this are the experimental conditions used to maintain free walking flies off
the walls in circular arenas.

53

54
Chapter 6
Conclusions
The principal goal of neuroscience is to understand how neural circuits process information and guide behavior.
One of the main current challenges in studying the neural bases of behavior is to record neural activity while animals
are engaged in natural behaviors with fully defined sensory inputs. Virtual Reality is a very promising technology that
provides an experimental platform where animals can perform almost naturalistic behaviors in virtual environments
with precise control over the sensory stimulation, and with accurate recordings of the animal’s behavior.
The work described in this thesis had the objective to develop and test a VR system, the FlyVRena, for tethered
walking Drosophila.
The advantages and limitations of FlyVRena
The FlyVRena system is composed of a treadmill system for tracking of walking, a new software platform and a
new projection system.
I built and calibrated a high speed treadmill tracking system similar to the one designed previously by the lab
head with Seelig and Lott in Janelia Farm in 2010. The treadmill system communicates the ball’s movement data to
the windows computer via a FTDI interface and read by the VR software.
The new VR software platform has an architecture that allows the user to build any kind of virtual worlds using
an intuitive language; it also includes a GUI to provide a visual interphase to build virtual worlds. The VR platform
implements a Behavior Tree to manage the dynamics of the interaction between the animal and the virtual objects,
and the behavior of the virtual world. By using the Behavior Tree language it is possible to create any type of
experiment protocol. The VR software also does the communication with the treadmill system and integrates the
data to generate closed loop situations. The program reads data from the treadmill system in a thread different from
the one that generates the virtual world. Currently, if the program is in a closed loop situation (where the behavior
data is required to update the virtual world) the maximum frame rate achieved is lower than the desired 360 Hz. The
reason for this decrease in performance is the delay introduced by data sharing between threads. Future work
includes the optimization of the multi-threading environment in order to get to the stable 360Hz refresh rate in
closed loop. In the meanwhile closed loop experiments run at a frame rate of 120Hz, similar to what was used in
other recent works29, 34, and only the open loop experiments can get to a refresh rate of 360Hz.
Drosophila melanogaster visual system has a very high temporal precision and a very large field of view. To
accommodate the two conditions, a projection system able to display images 180º around the animal and at a frame

55
rate of 360Hz was built. The system was based on a very high frame rate projector and on a custom made half
cylindrical screen and optical path that also provides a homogeneous profile of intensities through the full extension
of the cylindrical screen. The field of view of the fly is larger than the stimulated area which could be a problem to
create the immersive experience. The non-stimulated areas of the visual field are covered in homogeneous black so
the animal would not be able to detect any features in those areas. It is still not known what kind of effect the
reduced stimulated arena has on the behavior, but so far none of the described experiments nor other experiments
with full field open loop stimulation (optomotor responses – data not shown) shown biased results that could be
related to this limitation.
In behavior and physiology experiments, a precise knowledge of the stimulation timing and its relation with the
behavior is very important. This control is even more difficult to be achieved when the organism under
experimentation has a very high temporal resolution and very low reaction times35. Further work on the setup will
include the precise measurement of the delays of the system. Since the data streaming is done by a serial interface it
will introduce some delay. Other sources of delay include the multi-threading communication and the image
rendering. It will be a very important step to be able to make higher level experiments in the developed FlyVRena.
Fly on a ball behavior optimization
To have a system that can simulate natural behavior in simulated environments it is necessary to make the
animal behave naturally in the experimental conditions. Flies usually perform very poorly when they have to walk on
spherical treadmills compared to their free walking performance. The first set of experiments were aimed at
characterizing and optimizing conditions for tethered walking. I found that 3-day old starved DL flies were the ones
that performed better on the ball. Using a 9mm ball for the virtual reality was an improvement against the 6mm ball
used in previously published experiments in terms of the approximation to natural free walking. It was observed that
rotational speed in tethered flies approximated the free walking conditions, however, tethered flies forward speed
under-performs free walking translational speed. To further investigate the origin of this problem, I analyzed free
walking head-fixed flies and compare them with free head-free walking flies. Head-fixed flies showed similar under-
performance in terms of walking speed when compared with head free flies. This indicates that the difference seen
between flies on the ball and free flies can partially be explained by the manipulation itself (i.e. head fixation) and not
only by the walking on a ball. In the free walking experiments the flies were tested right after the head fixation
manipulation (the same time it takes from tethering to run the fly on the ball). A future experiment will be to head
fix the flies some days before running the experiment to see if they get used to the head fixation and recover to
normal performance. If this is the case, it would be a good way to obtain better performances on the ball.
Orientation behavior using the FlyVRena
In the open loop tracking experiment it was observed that tracking performance of flies depends on the size of
the object. Flies tend to do better and more consistent tracking of larger objects, despite the fact that small objects
were approximated to the expected size of conspecific moving at a fixed distance from the tethered fly. The result is
also important because it shows that flies can perceive and respond to small-field stimuli in the VR system. In flying
flies, small objects are actively avoided, whereas large bars are attractive. In walking, however, although small bars are
more difficult to follow, they are not aversive, i.e., non-negative coefficients of cross covariance was observed.
Together, these results may indicate that the different behavioral states (flying vs. walking) trigger different

56
visuomotor reflexes, relevant for the particular context of the fly. A test of this hypothesis will require to run this
experiments in closed-loop conditions.
It was also shown that flies fixate edges when confronted with a rotational closed loop situation in the VR system.
This result nicely reproduce those obtained in similar visual worlds but under free walking conditions, suggesting
that flies interact with their virtual world in a similar correspondence to their interaction with simple real worlds.
Furthermore, when confronted with a 3D environment composed by a drum with a floor, a ceiling, textured
walls and a dark pole object, flies tend to approach the pole and spend some time colliding and staying around it
before going to the walls. In addition to being this a novel result, it is also the proof that flies can perceive the 3D
within the VR system and interact with it. In this experiment a collision system was already implemented but the
paradigm was not the best to study its influence on the behavior. The last set of experiments shown in this thesis
work studied such collision mechanism in more detail. These experiments run in virtual corridors show that when a
fly collides with a wall it gets trapped and keeps colliding with it. This occurs mostly because flies don’t change their
heading after the collision occurs. Currently, when a collision is detected, the field of view is set back to the instance
before the collision happens. Future work will include testing other rules, such as longer history dependences, or
slight perturbations to mimic/force the fly to go back to a “wall-free” trajectory. A more realistic collision
mechanism would be to introduce other cues apart from the visual one in order to keep flies away from the walls. A
possible mechanism is to introduce an IR laser beam that would give a gradient of heat to the fly she approaches the
wall (virtual object) in order to keep them away from it.
The described experiments, although being still part of work in progress, resulted in interesting and novel
observations, which show that flies are able to explore and navigate in the FlyVRena worlds described above.
Immediate future work relates to the issues brought up in the previous paragraph, and also to adapt the projection
system to use it under a 2-photon microscope for recordings of neural activity. The power of the developed VR
system provides a unique tool to dissect the neural mechanisms underlying sensory-motor behaviors in a naturalistic
situation.

57

58
References
1. W. R. Sherman and A. B. Craig, Understanding Virtual Reality: Interface, Application, and Design. (San Francisco, CA,
San Francisco, CA, 2002).
2. R. Walser, Proceedings of the National Computer Graphics Association 90 (1991).
3. G. Burdea and P. Coiffet, Presence: Teleoperators and virtual environments 12 (6), 663-664 (2003).
4. P. H. Cosman, P. C. Cregan, C. J. Martin and J. A. Cartmill, ANZ Journal of Surgery 72 (1), 30-34 (2002).
5. E. A. Maguire, N. Burgess, J. G. Donnett, R. S. Frackowiak, C. D. Frith and J. O'Keefe, Science 280 (5365),
921-924 (1998).
6. H. A. van Veen, H. K. Distler, S. J. Braun and H. H. Bülthoff, Future Generation Computer Systems 14 (3),
231-242 (1998).
7. M. T. Schultheis, J. Himelstein and A. A. Rizzo, The Journal of head trauma rehabilitation 17 (5), 378-394
(2002).
8. B. R. Cornwell, L. L. Johnson, T. Holroyd, F. W. Carver and C. Grillon, The Journal of Neuroscience 28 (23),
5983-5990 (2008).
9. C. J. Bohil, B. Alicea and F. A. Biocca, Nature reviews neuroscience 12 (12), 752-762 (2011).
10. R. A. Ruddle, S. J. Payne and D. M. Jones, Journal of Experimental Psychology: Applied 3 (2), 143 (1997).
11. J. M. Wiener and H. A. Mallot, Spatial cognition and computation 3 (4), 331-358 (2003).
12. E. Hori, Y. Nishio, K. Kazui, K. Umeno, E. Tabuchi, K. Sasaki, S. Endo, T. Ono and H. Nishijo,
Hippocampus 15 (8), 991-996 (2005).
13. C. Hölscher, A. Schnee, H. Dahmen, L. Setia and H. Mallot, The Journal of experimental biology 208 (3), 561-
569 (2005).
14. C. D. Harvey, F. Collman, D. A. Dombeck and D. W. Tank, Nature 461 (7266), 941-946 (2009).
15. R. Strauss, S. Schuster and K. G. Götz, Journal of Experimental Biology 200 (9), 1281-1296 (1997).
16. M. B. Ahrens, J. M. Li, M. B. Orger, D. N. Robson, A. F. Schier, F. Engert and R. Portugues, Nature 485
(7399), 471-477 (2012).
17. S. Cermak, Advances in psychology 23, 225-248 (1985).
18. D. A. Dombeck and M. B. Reiser, Current Opinion in Neurobiology 22 (1), 3-10 (2012).
19. T. A. Ofstad, C. S. Zuker and M. B. Reiser, Nature 474 (7350), 204-207 (2011).
20. J. D. Seelig, M. E. Chiappe, G. K. Lott, A. Dutta, J. E. Osborne, M. B. Reiser and V. Jayaraman, Nature
methods 7 (7), 535-540 (2010).
21. B. Hassenstein and W. Reichardt, presented at the Proceedings of the 1st International Congress of Cybernetics
in Namar, 1956 (unpublished).

59
22. K. G. Götz, Kybernetik 4 (6), 199-208 (1968).
23. F.-O. Lehmann and M. H. Dickinson, Journal of Experimental Biology 200 (7), 1133-1143 (1997).
24. A. C. Mason, M. L. Oshinsky and R. R. Hoy, Nature 410 (6829), 686-690 (2001).
25. W. Reichardt and H. Wenking, Naturwissenschaften 56 (8), 424-424 (1969).
26. K. Hausen, Biological Cybernetics 45 (2), 143-156 (1982).
27. H. G. Krapp and R. Hengstenberg, Vision research 37 (2), 225-234 (1997).
28. M. B. Reiser and M. H. Dickinson, Journal of neuroscience methods 167 (2), 127-139 (2008).
29. J. Takalo, A. Piironen, A. Honkanen, M. Lempeä, M. Aikio, T. Tuukkanen and M. Vähäsöyrinki, Scientific
reports 2 (2012).
30. R. Strauss, Current opinion in neurobiology 12 (6), 633-638 (2002).
31. T. Poggio and W. Reichardt, Quarterly reviews of biophysics 9 (3), 377-438 (1976).
32. G. Maimon, A. D. Straw and M. H. Dickinson, Current Biology 18 (6), 464-470 (2008).
33. R. Wehner, Journal of insect physiology 18 (8), 1531-1543 (1972).
34. A. Bahl, G. Ammer, T. Schilling and A. Borst, Nature neuroscience 16 (6), 730-738 (2013).
35. R. Wolf and M. Heisenberg, Journal of Comparative Physiology A 167 (2), 269-283 (1990).
36. M. Silies, D. M. Gohl, Y. E. Fisher, L. Freifeld, D. A. Clark and T. R. Clandinin, Neuron 79 (1), 111-127 (2013).

60
Appendix A
A treadmill system for high resolution
tracking of insect walking
The current appendix is explains the operation of the treadmill tracking system and its installation and
calibration.
A.1 Principle of operation
The treadmill system to track the walking trajectory of a tethered drosophila was designed previously by the lab
head with Seelig and Lott in Janelia Farm in 2010, and adopted by several other laboratories 34, 36.
The principle of operation of the system is based on walking “on the spot” on an air suspended polyurethane
ball. Two motion sensors detect the ball rotations induced by the walking behavior of the animal. From these
rotations, the 2D walking trajectories of the animal can be reconstructed. The sensors are located at 90º angle with
respect to each other, and placed at the particular location were the 3 axis of rotations of the ball can be tracked with
highest redundancy, i.e, at 135º with respect to the heading direction of the animal. Knowing that each sensor detects
motion in the x and y directions, the movement is reconstructed with the following relations:
Where ,
, and
are the motion bytes detected for the x and y direction for each sensor. The minus
sign appears for the fact that the fly movement is the symmetric of the ball’s movement. The angular orientation of
the fly is given by the integration of its rotational velocity:
Where is the angular calibration factor to convert tracking system units to radians and is the initial
orientation. The 2D reconstructed trajectory includes the orientation and translational components of the velocity:
(A.1)
(A.2)

61
Where is the translational calibration factor to convert tracking system units to millimeters, are the
initial coordinates and [ ] is the 2D rotational matrix for an angle [ ]:
In summary, recording the ball rotations induced by the fly walking behavior leads to a direct reconstruction of
the 2D virtual trajectory of the animal.
A.2 Treadmill system mechanics
A.2.1 The ball
The treadmill ball (Fig. 53 Right) is custom-made, manufactured out of polyurethane foam. The ball can be
built with different sizes and weights but it is very important that it is perfectly spherical to minimize the turbulence
generated by the contact with the airflow. The ball has a non-uniform external texture that increases the quality of
the motion sensing.
A.2.2 The ball holder
The ball holder (Fig. 53) is a hollow metallic piece that has a cup shaped top with the size of the ball. The
holder is crossed by an air stream that levitates the ball. The inside of the holder is designed to be a flow regulator:
the pressurized air enters from bellow (high section) and is compressed as it arrives to a thin capillary that eliminates
the turbulences in the flow. After passing the capillary the flow is expanded gradually such that at the exit of it there
is a laminar flow.
(A.3)
(A.4)

62
Fig. 48 Left: Schematic of the ball holder. Right: picture of the ball and ball holder.
A.3 Treadmill system electronics
A.3.1 Sensor board
The sensor chip is extracted from computer mice and soldered in a PCB board designed by Seelig, Chiappe and
Lott et al.
The motion sensors are based on the chip ADNS-6090, from computer mice designed for gaming. The sensor
has a CCD matrix with 30×30 pixels that captures sequentially patterns of IR light and makes the cross correlation
between consecutive images to detect the lateral movement of the field of view, computing the magnitude of the
displacement in the two Cartesian x and y directions.
The sensors have two modes of operation: motion capture (described above, used for movement tracking) and
image capture (direct output of the CCD matrix, used for alignment). The sensor also outputs the quality of the
measurement and the shutter speed.
Each sensor is placed inside a custom designed cage for stability where I attached a set of lenses to be able to
focus the ball’s surface in the active zone of the sensor, allowing more precise measurements.
A.3.2 Microcontroller board
The sensor board connects to a microcontroller board that communicates the data to a computer.
The sensor output pass through a Schmitt trigger so it can be interpreted by the microcontroller. The
microcontroller encapsulates the data from the two sensors and sends it through an FTDI interface to the computer.
Another feature of the FTDI board is that it can output the motion signals as an analog voltage and allow an easy
way to change the operation mode of the system (video ↔ motion).
There are two types of operation modes, the video stream from cameras and the motion data acquisition. The
video stream is basically the video output that comes from the sensors at a 20Hz frame rate. The motion data
acquisition is the 4kHz stream of motion data from both sensors. The data is sent to the computer in 12 byte packs
per sample that includes the motion and status of each camera.

63
Fig. 49 Left: IR motion sensor. Right: Picture of the sensor and microcontroller board after soldering and assembling.
A.4 System alignment and calibration
A.4.1 System alignment with calibration cube
Because we use optical sensors for our behavioral recordings, it is very important that the system is very well
aligned in order to obtain precise measurements. A micro-manipulator is attached to the ball holder. On top of the
ball holder a calibration cube (Fig. 50) is placed.
With the help of the micromanipulator, and a MATLAB application to draw the video stream from each sensor
in image acquisition mode, the ball holder is positioned so that the grid of the calibration cube projects in mirror
symmetry in the two sensors.
.
Fig. 50 Left: Schematic of the calibration cube. Right: view of the calibration cube by the left and right sensors.

64
A.4.2 System Calibration
To obtain a physical interpretation of the sensor signals, it is necessary to calibrate the system to transform
motion data units into more significant units (mm for translation and rad for rotation).
The calibration is performed by comparing the motion measured by the tracking system with the motion
extracted from high-speed videography done with an external camera from the back of the ball. The external camera
is a Basler camera that captures IR images and has the ability of increasing frame rate at expenses of the size of the
field of view (FOV). The FOV of the Basler camera is reduced so it can capture images at 500Hz frame rate, and
centered on the center of the ball with the help of the calibration cube. The ball rotations are simultaneously
recorded with the tracking system and the Basler camera. A custom made MATLAB code was used to get the
relation between the cumulative time series of mean pixel displacement in the x direction for the Basler camera with
that of the motion tracking data from the sensors ( ). The slope of the fit between them gives the relation
between how many pixel displacements correspond to a movement in the sensor in that direction ( ). The same
analysis was done between the y direction of the video mean pixel displacement and the from the tracking
system giving the value of .
The angular calibration factor is then calculated factoring in the ball diameter:
The translational calibration factor is given by:
Fig. 51 Example calibration data.
(A.5)
(A.6)

65
Appendix B
3D Rendering
To have precise control over the visual stimuli displayed to the animal, it is necessary to know the processes
behind its generation. This appendix contains a brief explanation about the general principles behind the generation
of a 3D virtual scene.
B.1 The World transformation The virtual world is composed by a set of mesh models and textures. The mesh models are a set of points36 in a
3D space (model space) that forms polygons in 3D. These polygons approximate the object’s surface, and can have a
texture mapped into them.
Fig. 52 Image of a model of the drum used in the last experiment for full closed loop. The model is approximated
by a set of polygons that are textured with the image on the left.

66
To set the virtual world configuration, the models have to be placed in specific positions in the world’s
coordinate system, which correspond to apply the following transformation to all the model’s points:
Where ( ,
, ) is the point’s position in the virtual world coordinate system, (
, , ,
) is the
position of the center of the model in the world’s coordinate system and ( ,
, ) are the rotations of the
model that give the object’s orientation in the virtual world.
B.2 The View transformation
With all the models set up in the virtual world it is necessary to create a view over the world. The object that is
looking at the world is called a Camera. The Camera includes the perspective and point of view from which the
world is being seen.
To get the point of view, the first transformation is to pass the world coordinates to the camera’s coordinate
system. Given the Camera’s position ( ,
, ) and orientation (
, ,
).
B.3 The Projection transformation
After transposing the virtual world to the Camera’s coordinates, the 3D points must be projected in a 2D view
of the Camera.
When an eye sees a scene, closer objects appear bigger that objects at a distance (x and y are weighted by the
distance z) which is the base of a perspective projection. Considering (ex, ey, ez) the viewer’s position in relation to
the 2D display surface:
The Camera view only sees within a certain field of view (FOV), so the image has to be clipped and everything
outside the has to be FOV discarded.
A FOV is defined by the aspect ratio, the view angle and the far and near planes. The aspect ratio is defined by:
(B.1)
(B.2)
(B.3)
(B.4)

67
Where H is the horizontal view angle and V is the vertical view angle. In normalized coordinates (surface
coordinates rnging from (1, 1) to (−1, −1)) H = 2 arctan (1/ez). Generally only one of the viewing angles and the
aspect ratio are considered to define the FOV. The last elements to build the perspective are the near and far planes
and they are defined as the limits outside which no points are considered to build the perspective.
Another possible projection transformation is the orthographic transformation, which represents the 3D nature
of the object, but does not match what the view of an observer over the scene would be. The orthographic
transformation is defined by:
Fig. 53 Orthographic vs Perspective projection.
In summary, to create a virtual visual scene it is necessary and sufficient to define: 1) the mesh models with
their positions and orientations in the virtual world, 2) the Camera’s (observer) position and orientation, and 3) the
Camera’s view angle, aspect ratio, and the far and near planes.
(B.5)
(B.6)

68
Appendix C
Behavior Tree
C.1 What is a behavior tree?
A behavior can be understood as a set of states and transitions between states. The simplest logic to manage
states and implement a sort of artificial intelligence is a Finite State Machine (FSM). A FSM is just a set of possible
states and transitions between them. Although very simple, a FSM is not scalable and for larger systems it is common
to use a Hierarchical FSM (HFSM). HSFM is basically a FSM where it is allowed to have states within states. HFSM
provides reusable transitions which makes it scalable. The major problem of this management system is that it does
not provide modularity for the states, which means that they are not reusable for different situations without
rewiring.
A Behavior Tree (BT) is another way of managing states that takes a different approach, focusing on increasing
the modularity of the states. In the BT the “states” are called Tasks, and they don’t have transitions. A Task is just an
object that executes and terminates either in success or failure.
The principle of operation of such a managing system is to reduce complex behaviors to simple Tasks. The
Tasks are then organized in trees, and in order to keep their reusability, the tasks don’t contain information over the
next Tasks.
C.2 Principal logic components of a BT
In my implementation, tasks can be of four different types: Actions, Conditions, Decorators or Structural.
Actions are the Tasks that interfere with the state of the program and promote transitions. Conditions are tasks
that check a condition and succeed or fail according with the answer. Conditions do not interfere directly with the
state of the program. Decorators are Tasks that add functionalities to a behavior without the requirement of
knowing it. A Decorator requires a child Task in which it will add the functionality. Tasks of this type are neither a
branch of the tree nor a sub-tree. They are an extension to a sub-tree which creates a more complex behavior.
Within the Structural Tasks there are Selectors and Sequences. A Sequence implements a Sequence of Tasks,
building a more complex behavior out of smaller building blocks. In a Sequence the Tasks have a defined order,
which means that it is possible to create dependencies without the need of specify what the dependency is. The basic
elements that define a Sequence are: If a child Task succeeds, the Sequence continues to the next child. If a child
Task fails the Sequence fails. The Sequence only succeeds if all the children Tasks succeed.

69
The other structural Task is the Selector. The Selector operates as the complementary of the Sequence: if a child
Task succeeds the selector succeeds as well. If a child task fails the Selector will try another child Task.
Combining Selectors, Sequences and custom made Actions, Conditions and Decorators, it is possible to
generate any kind of complex behavior necessary for my program.
C.3 Example: Trial/Inter Trial routine used for the first experiments in the
dark.
Fig. 54 Trial/Inter Trial routine using a Behavior Tree
The following behavior tree executes a simple trial/inter trial routine. The Counter is a decorator that has as a
parameter a number until which to count. If the Counter’s child task returns success then the counter adds one to
the counter value. When the counter value matches its target number, the counter succeeds and the experiment
finish. The counter child is a Selector that has two Sequences as children. If any of the Sequences succeed the
Selector will succeed.
The Conditions at the beginning of each Sequence guarantee that one Sequence starts if the actual state is
“Trial” and the other starts if the state is “Inter Trial”. For the case that the state is “Trial” the first Sequence starts
and a Timer appear. The Timer is a Decorator that receives a time interval and only returns success when the
difference between the moment it is called for the first time and the actual program time is higher than the given
interval. This means that the program will stay in the state “Trial” for a certain time interval.
The next task is an Action that changes the state to “Inter Trial” before the sequence succeeds. In the next
cycle the Sequence that starts if the state is “Inter Trial” is the one activated. That Sequence mimics the one
previously explained except for the fact that the Action sends the program back to “Trial” instead of “Inter Trial”. In
this way the program will oscillate between “Trial” and “Inter Trial” a defined number of times and will stay in each
of these states for a defined time interval.
C.4 Example: Protocol used in the bar tracking in open loop
The protocol starts with a RootNode, which is a Decorator that keeps the BT always running. The RootNode
decorates a Selector that will select between two Sequences. The first Sequence has Condition that will only allow it

70
to be activated if the program is starting. In this case, two Actions are applied, one to set a new block of trials and
another to start a Trial.
The other Sequence will be the one that will stay active for the rest of the experiment. This Sequence starts to
check if the program is in a specific block of trials and if it is the case it starts a RandomSelector.
In logical terms the RandomSelector is the same as a Selector, but instead of having a determined sequence to
select the child Task to run, this type of Selector selects it randomly, given how many times each child should be
called.
Fig. 55 Protocol used for the bar tracking in open loop experiemts
The children of the RandomSelector implement a “Trial” – “Inter Trial” routine as the one previously
explained. Each child of the Random Selector sets a trial with a different type of virtual world using the action
signaled with *.
The simple notation and naturalistic language of a BT provides a powerful tool to manage the dynamic
character of the Virtual Reality software. It can be used to build different experimental protocol (essentially any kind
of protocol) or to create interactions between the fly and the virtual world.