development and testing of compounds containing ground athletic...
TRANSCRIPT

Development and Testing of Compounds Containing Ground
Athletic Shoes

Development and Testing of Compounds Containing Ground Athletic Shoes
FINAL REPORT
Prepared for
Recycling Technical Assistance Partnership (ReTAP) a program of the
THE CLEAN WASHINGTON CENTER, a division of the Pacific Northwest Economic Division
2200 Alaskan Way, Suite 460 Seattle, Washington 98121
March 1997
Prepared by
Carton Environmental Systems 434 17th Avenue East
Seattle, Washington 98112
and
J. L. Merryfield, Inc. Unit-One, P.O. Box 632 Crane, Indiana 47522
This recycled paper is recyclable
Copyright © 1997 by Clean Washington Center
Report No. T-97-1

i
DEVELOPMENT AND TESTING OF COMPOUNDS CONTAINING GROUND ATHLETIC SHOES
FINAL REPORT
TABLE OF CONTENTS
EXECUTIVE SUMMARY.................................................................................................1
1.0 INTRODUCTION ......................................................................................................3
1.1 BACKGROUND..........................................................................................................3 1.2 PROJECT OBJECTIVE................................................................................................4 1.3 REPORT ORGANIZATION........................................................................................4
2.0 PHASE I, RUBBER CHIP DOOR MATS................................................................4
2.1 RUBBER CHIP DOOR-MAT OBJECTIVES...............................................................4 2.2 COMPOUNDING RUBBER CHIP DOOR MATS, MATERIALS AND METHODS...................................................................................5 2.2.1 Rubber Chips -- Processing Method ..............................................................5 2.2.2 Rubber Chip Characteristics...........................................................................6 2.2.3 Basic Rubber Compounding...........................................................................7 2.2.4 Rubber Chip Door-mat Compounding Procedures..........................................9 2.3 PERFORMANCE TEST RESULTS FOR DOOR MATS ..........................................11 2.4 CURING PROPERTIES OF RUBBER CHIP COMPOUNDS ..................................12 2.5 SMALL SCALE FACTORY TRIALS AND RESULTS.............................................12 2.6 ECONOMIC FEASIBILITY OF MANUFACTURING RUBBER CHIP DOOR MATS...................................................................................................14
3.0 PHASE II, RUBBER DUST SHOE SOLES ..........................................................16
3.1 RUBBER DUST SHOE SOLE OBJECTIVES............................................................16 3.2 COMPOUNDING RUBBER DUST SHOE SOLES, MATERIALS AND METHODS.................................................................................17 3.2.1 Rubber Dust Processing Methods.................................................................17 3.2.2 Rubber Dust Characteristics .........................................................................17 3.2.3 Rubber Dust Shoe Sole, Compounding Procedures ......................................18 3.3 PERFORMANCE TEST RESULTS FOR SHOE SOLES .........................................21 3.4 CURING PROPERTIES OF RUBBER DUST COMPOUNDS .................................24 3.5 SMALL SCALE FACTORY TRIALS AND RESULTS.............................................25 3.6 ECONOMIC FEASIBILITY OF MANUFACTURING RUBBER DUST SHOE SOLES .................................................................................................26
4.0 CONCLUSION .........................................................................................................28
5.0 ACKNOWLEDGEMENTS......................................................................................29

ii
APPENDICES
A Akron Rubber Development Laboratory, Inc. Test Results.............................................A
B Smithers Scientific Services, Inc. Abrasion Test Results..................................................B
C Rheometer Reading for Compounds G and H................................................................C
D Calculation of Pound Costs for Compounds G-56, G-80, and H-80 ..............................D
E Rouse Rubber Industries, Inc., Product Certification...................................................... E
F Smithers Scientific Services, Inc. Abrasion Test Results................................................. F
G Rheometer Readings for Compounds A, A-15, A-25, B, and B-15 ...............................G
LIST OF TABLES
Table 1 Formulation Ingredients........................................................................................10
Table 2 Performance Test Results of Rubber Chip Door Mats...........................................11
Table 3 Compound Pound Cost, Specific Gravity, and Material Cost per Mat ...................15
Table 4 Rubber Chip Door-mat Manufacturing Costs........................................................16
Table 5 Formulation Ingredients........................................................................................20
Table 6 Compound Test Results .......................................................................................21
Table 7 Rubber Dust Shoe Sole Compound Rheograph Results.........................................24
Table 8 Batch Weights and Mill Time................................................................................26
Table 9 Material Costs for Rubber Dust Compounds ........................................................27
Table 10 Rubber Dust Shoe Soles Manufacturing Costs ......................................................28
LIST OF FIGURES
Figure 1 Tensile Strength....................................................................................................22
Figure 2 Elongation Percentage ..........................................................................................22
Figure 3 Tear Strength.......................................................................................................23
Figure 4 Durometer ...........................................................................................................23
Figure 5 Abrasion Index....................................................................................................24
1
EXECUTIVE SUMMARY
Washington State residents dispose of approximately 5 million athletic shoes each year. To date there
are very few technologies available to convert the rubber from those shoes into viable products. In
recognition of this problem, the Recycling Technology Assistance Partnership (ReTAP) funded a
project to assess the viability of manufacturing products from post-consumer athletic shoes.
This report summarizes the results of a technology validation project that evaluated the feasibility of
using ground shoe sole rubber to make door mats, and pulverized shoe sole rubber to make shoe soles.
The project consists of two phases. Phase I addresses the development, manufacturing, and economics
of manufacturing door mats with ground shoe soles. Phase II addresses the development,
manufacturing, and economics of manufacturing shoe soles using pulverized shoe soles.
Phase I project results demonstrate that old shoes can be used effectively as a feedstock for
compounded door mats. A home door mat was compounded that contained 80% ground post-
consumer shoe soles and had the abrasion resistance and hardness to stand up to substantial use.
Financial calculations indicate that this mat can be manufactured at a price that would allow it to be
retailed for a competitive $28.00.
Phase II project results demonstrate additional potential for using old athletic shoes as a feedstock for
shoe soles. A shoe sole was compounded that contained 15% pulverized post-consumer shoe soles
and met all of the specifications of two major shoe companies' outsoles. Financial calculations indicate
that a pair of these soles can be manufactured for somewhere between $1.42 and $2.38, allowing it to
be sold to shoe manufacturers for a competitive price.
Project findings also pointed to some problems when using ground shoe soles in the manufacturing of
products. Ground shoe sole material contains small amounts of aluminum (from the eyelets of shoes).
This material cannot be removed through magnetic separation, although it might be possible to remove it
through an air-separation process. While the aluminum caused no problems in the mat factory trial,
many rubber manufacturers steadfastly refuse to use any material containing metal for fear of damaging
expensive equipment. When pulverized down to a nominal particle size of #80 mesh, the aluminum
posed no problems and was not a concern.
In conclusion, it appears technically viable and economically feasible to create new products using
ground and pulverized post-consumer athletic shoes as a feedstock. As a next step, the door mats and
shoe soles fabricated through this project need to be field tested.
2
1.0 INTRODUCTION
This report summarizes the results of a technology assistance project involving the Recycling Technology
Assistance Partnership (ReTAP), Carton Environmental Systems, and J. L. Merryfield, Inc., to test the
feasibility of incorporating ground and pulverized post-consumer shoe soles into new products.
1.1 BACKGROUND
In Washington, approximately 5.5 million athletic shoes are disposed of each year. Nationally, 270
million shoes are thrown away each year. While some efforts have been made to incorporate athletic
shoe sole rubber into playground padding, basketball courts, and running tracks, there is no product on
the market to date that contains post-consumer shoe material.
To help develop a market for post-consumer shoe soles, the Clean Washington Center provided
funding for this project to develop and test two prototype products made from the soles of post-
consumer athletic shoes -- door mats and shoe soles.
HMC Sports, Inc. (HMC Sports ), initiated the project in order to find a use for the shoes collected
from its customers. HMC Sports operates eight athletic shoe stores throughout the Northwest and
gives customers a discount on new shoes when they bring in a pair of used shoes. HMC Sports began
investigating shoe recycling on its own and found that a rotary knife granulator built for processing tires
could be used to turn shoes into approximately a #14-mesh particle size. HMC Sports also found that
air-separating equipment traditionally used to separate the rubber and fabric portions of tires could be
used to separate the soles and uppers of athletic shoes.
Through further work, HMC Sports found that Rouse Rubber of Vicksburg, Mississippi, had
developed a proprietary, ambient temperature, wet-grind technology to pulverize rubber chips into a
nominal #80-mesh particle size.

3
1.2 PROJECT OBJECTIVE
The objective of this project was to determine the feasibility of incorporating rubber chips into door
mats and rubber dust into shoe soles. To meet this objective, rubber chips and rubber dust were
compounded into laboratory samples, formulated into door mats and shoe soles, and factory trials
conducted. Testing was also undertaken to determine the properties of the resulting compounded
products.
1.3 REPORT ORGANIZATION
This report is organized into two main sections. The first addresses the door mats and the second
addresses the shoe soles. Each section reviews the methods used to formulate test results, factory trial
procedures and findings, and estimates of manufacturing costs.
2.0 PHASE I, RUBBER CHIP DOOR MATS
2.1 RUBBER CHIP DOOR-MAT OBJECTIVES
The objective of Phase I was to develop door mats containing pulverized rubber chips that could be
manufactured for a target cost of $7.00. This manufacturing cost would allow the product to come to
market for a wholesale cost of $14.00 and a retail cost of $28.00, making it competitive with other
decorative home door mats.
Performance specifications are not available for traditional decorative home door mats. J. L.
Merryfield, Inc., the rubber expert involved with this project, developed the following specifications for
the doormats:
• abrasion resistance index of 70% per ASTM D 1630 to ensure their ability to withstand use, and
• durometer (hardness) of 70 A per ASTM D 2240 to give them a sturdy, firm feel.

4
The selection of these performance characteristics was somewhat arbitrary. If a softer mat had been
desired, a lower durometer could have been specified.
It should be noted that while laboratory tests can give an indication of how a product will perform its
actual function, they are far from conclusive. A product that performs well in laboratory tests will not
necessarily perform well in the field. Generally, however, if a product fails performance tests, it will also
perform poorly in the field.
Because other rubber professionals might be interested in using rubber chips in a variety of other
applications, the project team conducted tests to measure tensile strength, elongation, specific gravity,
tear strength, and durometer. While of interest, these properties do not significantly affect the
performance of a door mat. Testing was also conducted to learn about the cure time, minimum torque,
maximum torque, and scorch time of the mat formulation.
2.2 COMPOUNDING RUBBER CHIP DOOR MATS, MATERIALS AND METHODS
2.2.1 Rubber Chips -- Processing Method
The rubber chips were made from the athletic shoes HMC Sports collected through its retail shoe
stores. A group of five laborers sorted the shoes as they were loaded for trucking to Rubber
Granulators, Inc. Rubber Granulators ground the shoes with a rotary knife granulator used primarily for
tires. The sorters removed all shoes that contained mercury light switches (the mercury in these
switches is hazardous) and hiking boots containing steel shanks (steel shanks have the potential to
damage grinding equipment).
In granulating the shoes, Rubber Granulators found that by volume, the shoes were easier to grind than
tires because they were not as tough. However, because shoes are less dense than tires, by volume,
they were slower to grind. Ferrous metals were removed using a magnetic drum. Rubber Granulators
charged $0.15 per pound for chipping and air separating the shoes.
5
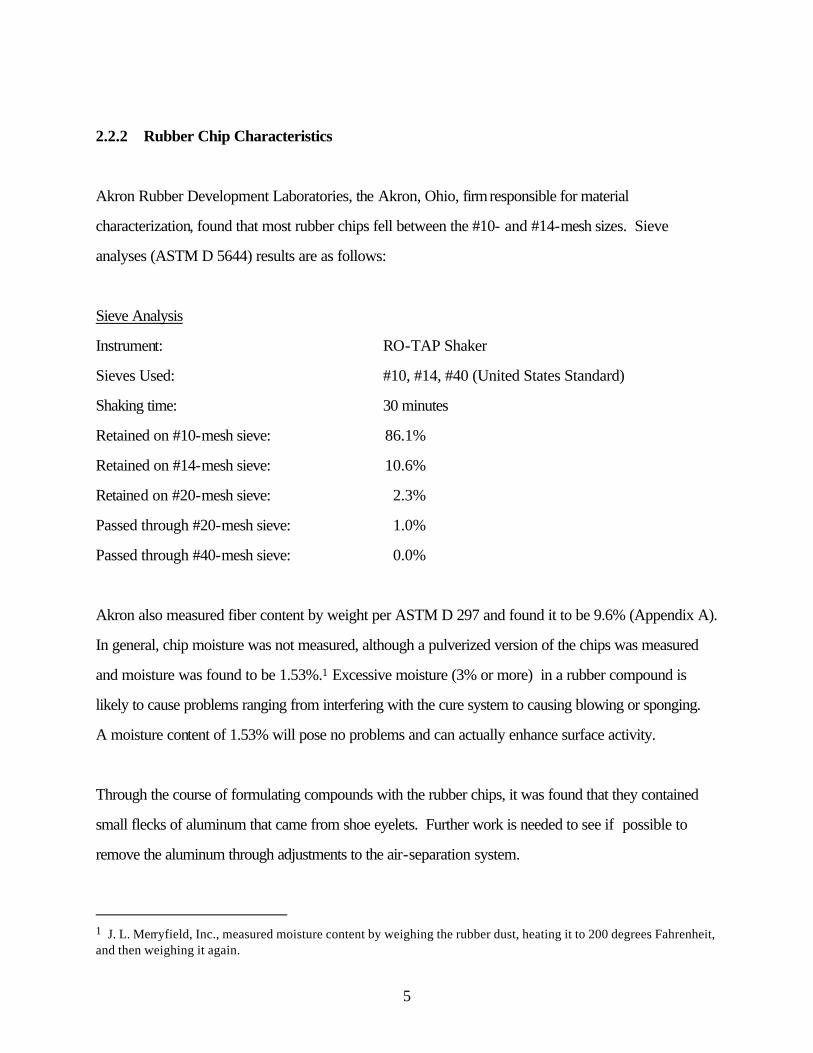
2.2.2 Rubber Chip Characteristics
Akron Rubber Development Laboratories, the Akron, Ohio, firm responsible for material
characterization, found that most rubber chips fell between the #10- and #14-mesh sizes. Sieve
analyses (ASTM D 5644) results are as follows:
Sieve Analysis
Instrument: RO-TAP Shaker
Sieves Used: #10, #14, #40 (United States Standard)
Shaking time: 30 minutes
Retained on #10-mesh sieve: 86.1%
Retained on #14-mesh sieve: 10.6%
Retained on #20-mesh sieve: 2.3%
Passed through #20-mesh sieve: 1.0%
Passed through #40-mesh sieve: 0.0%
Akron also measured fiber content by weight per ASTM D 297 and found it to be 9.6% (Appendix A).
In general, chip moisture was not measured, although a pulverized version of the chips was measured
and moisture was found to be 1.53%.1 Excessive moisture (3% or more) in a rubber compound is
likely to cause problems ranging from interfering with the cure system to causing blowing or sponging.
A moisture content of 1.53% will pose no problems and can actually enhance surface activity.
Through the course of formulating compounds with the rubber chips, it was found that they contained
small flecks of aluminum that came from shoe eyelets. Further work is needed to see if possible to
remove the aluminum through adjustments to the air-separation system.
1 J. L. Merryfield, Inc., measured moisture content by weighing the rubber dust, heating it to 200 degrees Fahrenheit, and then weighing it again.

6
In order to explain how ingredients for the formulations were selected, a brief discussion on the basics
of rubber compounding follows.
2.2.3 Basic Rubber Compounding
In general, the ingredients of a rubber compound may be divided into five groups. This statement is, by
necessity, an oversimplification and is intended as a guide only. Some ingredients in any given
formulation might serve two, or even three purposes. Also, any given ingredient might function
differently in various elastomers. With these caveats in mind, the following represent the standard
ingredients of a rubber compound.
1. Base Elastomer: There are approximately twenty-two commercially available polymers in the
U.S.A. A base polymer, or sometimes a blend of polymers, is chosen based on its cured
characteristics: abrasion resistance, oil resistance, high and low temperature characteristics, etc. Most
always, the over-riding consideration is cost.
2. Fillers and Plasticizers: Most rubber formulations would be useless without some type of filler
incorporated. Fillers can be grouped into three categories: reinforcing, semi-reinforcing, and extenders.
A. Reinforcing fillers include the small particle-sized carbon blacks such as
N110-0, N220, N330 and light-colored reinforcing agents such as Hisil and Cabosil.
B. Semi-reinforcing fillers include black carbon with larger particle sizes such as N762 and N990.
Examples of semi-reinforcing fillers include treated clays and zeolex.
C. Extending fillers are often necessary to meet high-quality specifications such as soft printing rolls
where a low durometer and resistance to the inks solvents are required.

7
Plasticizers: Generally plasticizers are liquids or very soft semi-solids. They must be carefully chosen on
the basis of their compatibility with the elastomer. Those that are incompatible can interfere with the
curing systems, leach out after a period of time, or both. In products that must be bonded, plasticizer
choice often depends upon individual accelerated, long-term testing, or both.
3. Antidegradents or Protective System: Anti-oxidants and anti-ozonants are generally incorporated
from 1.0 to 2.0 parts per 100 parts base elastomer. The chemistry of reactions, whether intended or
unintended, is complex. Choosing a compatible antidegradant that will not "bloom" often requires
individual compound testing.
4. Special Ingredients: Often ingredients are required for a specific purpose. Examples include flame
retardants, coloring agents, and process aides. Ingredients such as PEG 3350 are used to overcome
the effects of light-colored fillers. The types and amounts of ingredients used vary considerably.
5. Curing Systems: First, we must assume that all of the above ingredients have been chosen so as
not to interfere with cross-linking. Second, we will assume a sulfur-based (not dicumyl peroxide nor
radiation) curing.
A. The activators: Generally the combination of zinc oxide and stearic acid work together to
provide suitable conditions for curing to take place.
B. Acceleration Systems: Any combination of a host of generally organic compounds that
dramatically reduce sulfur cross-linking time.
C. Sulfur: The cross-linking agent.

8
2.2.4 Rubber Chip Door-mat Compounding Procedures
A total of five door-mat compounds were developed. Two were controls and contained no rubber
chips. The other three were experimental compounds and contained as much as 80% rubber chips.
This 80% target was arbitrarily chosen at the outset of the project. The compounds developed
included:
• G (a control),
• H (a control), identical to G but containing Vestenamer 8012,
• G-56 -- compound G with rubber chips added to make up 56% of the total mixture,
• G-80 -- compound G with rubber chips added to make up 80% of the total mixture, and
• H-80 -- compound H with rubber chips added to make up 80% of the total mixture.
For this project, the ingredient groupings for compound H included:
1. Base Elastomer: • SBR 1502 • Vestanamer 8012
2. Fillers and Plasticizers: • Hisil 233 • Cyclolube Napthenic Process Oil
3. Antidegradents or Protective system:
• Agerite Stalite S
4. Special Ingredients: • Peg 3350
5. Curing System: • Accelerators (ALTAX), MBTS, (Methyl Tuads) TMTD
• Activators Zinc Oxide, Stearic Acid
• Cross Linking Agent Sulfur
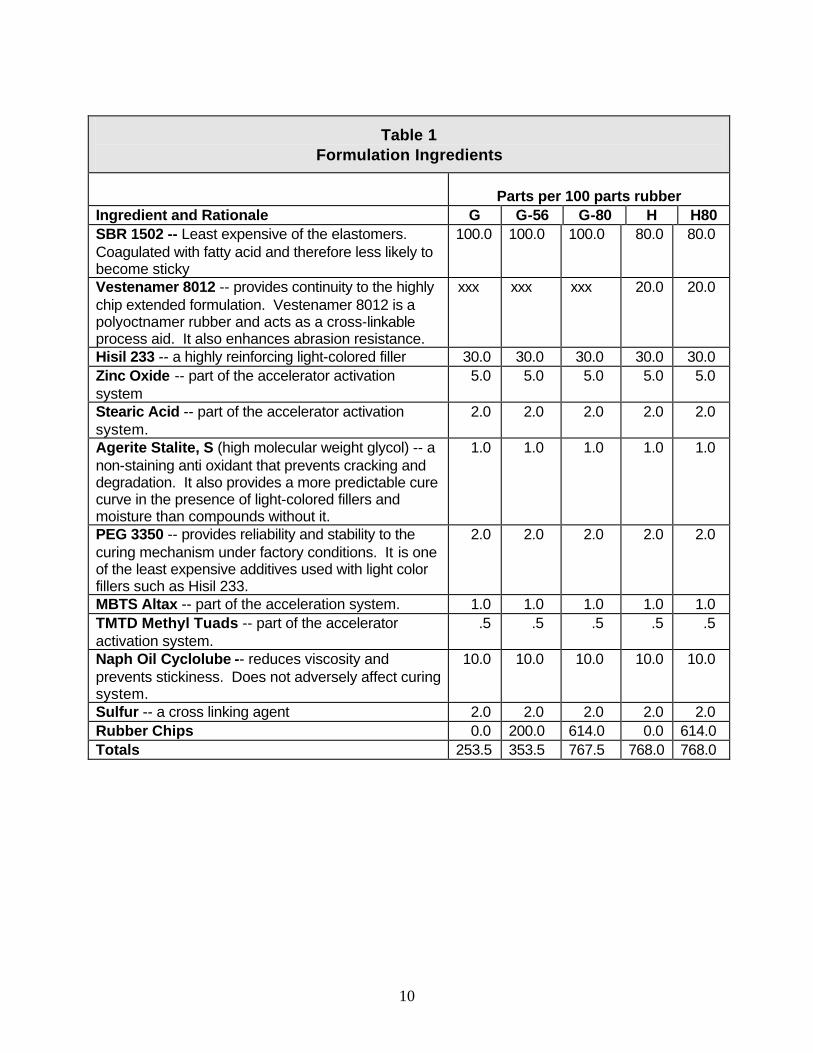
The ingredients of the control formulations and three variations are listed in Table 1. Also listed in Table
1 is the rationale behind content selections.

9
10
Table 1 Formulation Ingredients
Parts per 100 parts rubber Ingredient and Rationale G G-56 G-80 H H80 SBR 1502 -- Least expensive of the elastomers. Coagulated with fatty acid and therefore less likely to become sticky
100.0 100.0 100.0 80.0 80.0
Vestenamer 8012 -- provides continuity to the highly chip extended formulation. Vestenamer 8012 is a polyoctnamer rubber and acts as a cross-linkable process aid. It also enhances abrasion resistance.
xxx xxx xxx 20.0 20.0
Hisil 233 -- a highly reinforcing light-colored filler 30.0 30.0 30.0 30.0 30.0 Zinc Oxide -- part of the accelerator activation system
5.0 5.0 5.0 5.0 5.0
Stearic Acid -- part of the accelerator activation system.
2.0 2.0 2.0 2.0 2.0
Agerite Stalite, S (high molecular weight glycol) -- a non-staining anti oxidant that prevents cracking and degradation. It also provides a more predictable cure curve in the presence of light-colored fillers and moisture than compounds without it.
1.0 1.0 1.0 1.0 1.0
PEG 3350 -- provides reliability and stability to the curing mechanism under factory conditions. It is one of the least expensive additives used with light color fillers such as Hisil 233.
2.0 2.0 2.0 2.0 2.0
MBTS Altax -- part of the acceleration system. 1.0 1.0 1.0 1.0 1.0 TMTD Methyl Tuads -- part of the accelerator activation system.
.5 .5 .5 .5 .5
Naph Oil Cyclolube -- reduces viscosity and prevents stickiness. Does not adversely affect curing system.
10.0 10.0 10.0 10.0 10.0
Sulfur -- a cross linking agent 2.0 2.0 2.0 2.0 2.0 Rubber Chips 0.0 200.0 614.0 0.0 614.0 Totals 253.5 353.5 767.5 768.0 768.0

11
2.3 PERFORMANCE TEST RESULTS FOR RUBBER CHIP DOOR MATS
Tests were conducted2 to measure durometer (ASTM D 2240), tensile strength (ASTM D 412),
elongation percentage (ASTM D 412), density3, abrasion resistance (ASTM D 624), and tear strength
(ASTM D 624). A Rheometer Curve4 was also developed to learn more about the curing of the
compounds.
Results indicated that the experimental compounds containing rubber chips met the durometer and
abrasion resistance goals. Details of tests are listed in Table 2.
Table 2 Performance Test Results of Rubber Chip Door Mats
G, Control H, Control G-56 G-80 H-80
Tensile Strength 735 629 176* 52* 42*
Elongation Percentage 540 410 145* 160* 120*
Density/Specific Gravity 1.10 1.09 1.12 1.15 1.15
Tear Strength 106 100 96* 68* 76*
Durometer 56 60 60-75* 60-75* 60-75*
Abrasion Index5 62.0 63.3 78.5 69.6 94.1
* Results vary widely because of the high load of undispersed chips. For consistent results, one would have to evaluate the matrix holding the chips together rather than the entire compound because the resulting compound is an aggregate rather than a homogeneous compound.
One notable result is the high abrasion index of H-80. This index can be attributed to the addition of
Vestenamer 8012. A frequent goal in developing rubber compounds is to maintain a high abrasion
index while adding large amounts of low-cost filler. This addition provides compounds that are
desirable because they are not easily "worn" and can be produced at a low cost.
2 Test specimens were compounded per ASTM D 3182. A six-inch by six-inch slab approximately 0.12-inch thick of uncured rubber was put into a tensile slab mold at a curing temperature at 600 psi closing pressure. After the optimum time passed, the cured slab was removed. 3Specific gravity was calculated based on the weights of the compound as measured in air and water. 4The Rheometer provides a graph of a rubber compound as it is curing. In addition, by observing the early stages of the graph some indication of the uncured compound’s characteristics can be found. Likewise, by observing the final stages of the graph, a limited amount of information concerning the cured compound’s physical characteristics can be found. 5 See Appendix B for test results.

12
Durometer readings seem to have been slightly increased by rubber chips. This increase is probably
because of the fact that chips have a higher durometer level than the matrices holding them together
(control compounds G and H).
Many of the characteristics for which the compounds were tested (tensile strength, elongation
percentage, tear strength, and durometer) yielded widely ranging results. This wide range is attributable
to the fact that the compounds were aggregates of rubber chips held together by a matrix, not a single
homogeneous mixture. However, despite the wide range of results, there is evidence that the addition of
rubber chips greatly reduced tensile strength and the elongation percentage, and slightly reduced tear
strength.
The tensile strength, elongation percentage, specific gravity, and tear strength properties were not
applicable to door mats, but are presented because they could be of interest to others who are trying to
incorporate recycled athletic shoes into compounds.
2.4 CURING PROPERTIES OF RUBBER CHIP COMPOUNDS
The Rheometer work provided no direct numerical comparisons of viscosity at meaningful levels of
crumb or chip loadings. First, metal contamination in the chip feedstock scored the Rheometer's rotor
when running G-56 and thus stopped further Rheometer work on the experimental compounds.
Second, a Rheometer run was attempted with a compound F, which contained #30-mesh crumb from
an outside source. Unfortunately, the viscosity was so high that the compound would not flow under the
rotor to completely encapsulate it and the test was meaningless. In general, the smaller the mesh size the
higher the apparent viscosity at equal loadings.
A brief discussion of Rheometer curves and the curves for control compounds G and H are listed in
Appendix C.
2.5 SMALL-SCALE FACTORY TRIALS AND RESULTS
To determine the full-scale feasibility of manufacturing mats made from rubber chips, a small-scale
factory run was conducted. The results of this factory run were positive, indicating that it is possible to
make rubber chip mats on a factory scale below the targeted price. The results also indicate that non-
conventional mixing techniques are necessary to mix rubber chips into the rubber matrix.
13
During the factory trials a total of 30 mats were made, ten from each experimental compound. The
controls, G and H, were not included in the trial run because the experimenters were familiar with
producing materials similar to the control.
Mixing the rubber chip formulation was not possible in a conventional manner because at the 75 parts
chip level, the load of chips "broke up" and fouled the base batch. Thus, mixing was done on a two-roll
mill. Once the 75 parts rubber limit was reached, the base compound had to be scooped up and
repeatedly passed through an ever-wider mill's nip while increasing the quantity of chips being added.
Once the necessary amount of chips had been integrated into the mixture, the formulation was massed
together on rough layers between polyethylene sheets until it was molded. During the trial, the mixture
held together better after it had aged a few days at room temperature. Most likely, aging helped the
compound hold together because it allowed the binder base compound to "wet out" or become more
intimately in contact with individual chips.
During the factory trial, blending the chips into the rubber mixture became easier as experience was
gained. The first production batch was with the H-80 compound. Twenty pounds of base stock and
80 pounds of rubber chips were used. Blending the chips into the rubber mixture took 50 minutes. The
G-80 production batch was mixed in the same way except that the batch size was reduced to 17
pounds of base stock and 68 pounds of rubber chips. This smaller batch mixed much more easily and
took 35 minutes. Production batch G-56 contained 38.38 pounds of rubber chips and 50 pounds of
base stock. This 88.38-pound batch mixed well in the conventional manner until the last few chips were
added. This batch mixed in 20 minutes. Virgin compounds do not require that chips be blended into
the base stock.
The mats were cured in a mold 18 inches by 24 inches by 0.25 inches. Several mats were produced by
adjusting parameters such as mold preparation weight, curing temperature, and curing time. All mats
were cured under approximately 640 pounds per square inch hydraulic closure pressure. After initial
trial heats were run, an optimum mold prep weight of six pounds was established. The curing
temperature was 320 degrees Fahrenheit (steam pressure of 75 pounds per square inch). The curing
cycle, "closed mold to closed mold," was 20 minutes. This cycle allowed approximately 16 minutes
cure time and four minutes to remove the cured mat, lubricate the mold with silicone emulsion, load
uncured compound into the cavity and close the mold. When closing the mold , the press was
"bumped" twice. A bump procedure closes the mold from five to ten seconds, then releases the
hydraulic pressure and closes it again. This bump procedure is normally used to reduce incidence of
entrapped air. The procedure also helped to obtain better flow and knitting of the highly crumb-loaded
uncured material.
14
Producing the mats from rubber chips was more difficult than producing mats from virgin material given
the difficulty of mixing the chips into the compound matrices G and H. As noted, the mold fouling
because of the presence of plastics in the chips was also problematic. Some mold fouling is normal
when molding rubber products. Mold cleaning usually takes place after several days of use. However,
molds in which the rubber chip mats were made had to be cleaned after only four to six heats (1 1/3 to
2 hours) because of a film left on the mold. The film also caused some stickiness, resulting in random
peaks on an otherwise smooth surface. The source of this film is most likely from the plastic in the chips
from parts of shoes such as: eyelets, plastic "air display windows," and trim.
There are three ways that the sticking problem can be controlled. The first is to ensure that there is no
thermoplastic material in the recycled feedstock. Such a separation process is very expensive. The
second is to experiment with various mold lubricants and techniques until a combination is found that
prevents premature mold fouling and sticking even if the mixture contained thermoplastics. A third, but
expensive option ($1.00/mat), is to line the molds with mylar sheets. Mylar sheets act as a physical
barrier between the curing and cured rubber and the mold. 2.6 ECONOMIC FEASIBILITY OF MANUFACTURING RUBBER CHIP DOOR MATS
Factory trial findings along with material cost calculations indicate that rubber chip door mats can be
made for below the targeted price of $7.00 per mat. Results also indicate that the additional cost of H-
80 over G-80 is minimal given its superior abrasion resistance. Material costs were calculated by
assessing the individual ingredients' cost, the percentage content of each individual ingredient, and the
specific gravity of each individual ingredient. Individual calculations for pound cost are listed in
Appendix D. Table 3 provides data on pound cost, specific gravity, and pound volume cost.

15
Table 3 Compound Pound Cost, Specific Gravity, and Material Cost per Mat
Compound Pound Cost Specific Gravity Pound-Volume Cost
G $0.79 1.10 $0.87
H $0.91 1.10 $1.01
G-56 $0.41 1.12 $0.46
G-80 $0.25 1.15 $0.29
H-80 $0.28 1.15 $0.32
Costs were calculated for three scenarios ranging from conservative to liberal. A summary of
manufacturing costs for the three scenarios with compound variations appear in Table 4. All costs were
calculated according to the following formulas. Labor costs are included in the Total Production Cost
factor labeled "Press Cost per Hour".
Total Material Cost = (Rubber Mixing Cost per Pound6 + Materials Pound Volume Cost + Freight
Cost per Pound) * Amount of Material Needed per Mat
Total Production Cost = Press Cost per Hour / (Cavities per Mold * Heats per Hour) + (Occasional
Reject and Packaging)
Total Cost per Mat7 = Material Cost + Production Cost
All of the scenarios listed assume the following:
• The pounds of material with a specific gravity of 1.00 required per mat is 4.76,
• Occasional reject and packaging costs an average of $0.25 per mat,
• The press cost per hour is $25.00,
• Three heats can be pressed per hour,
• Compound material pound-volume costs are as follows: G-56, $0.46; G-80, $0.29; and
H-80, $0.32.
6 Rubber mixing cost per pound includes the cost of machinery use and labor. 7 The total cost does not include the cost of the mold.

16
Scenario 1
Rubber is mixed off site for $0.45 per pound
Freight charges for the rubber are $0.20 per pound.
A two-cavity mold.
Scenario 2
Rubber is mixed in-house for $0.36 per pound
Freight charges for the rubber are free (mixed in house)
A four-cavity mold.
Scenario 3
Rubber is mixed off site for $0.45 per pound
Freight charges for the rubber are $0.20 per pound
A four-cavity mold.
Table 4 Rubber Chip Door Mat Manufacturing Costs
G-56 Cost G-80 Cost H-80 Cost Scenario 1 Material $5.28 $4.47 $4.62 Production $4.42 $4.42 $4.42 Total $9.70 $8.89 $9.03 Scenario 2 Material $3.90 $3.09 $3.24 Production $2.33 $2.33 $2.33 Total $6.24 $5.43 $5.57 Scenario 3 Material $5.28 $4.47 $4.62 Production $2.33 $2.33 $2.33 Total $7.62 $6.81 $6.95
3.0 PHASE II, RUBBER DUST SHOE SOLES
3.1 RUBBER DUST SHOE SOLE OBJECTIVES
The objective of this phase was to develop shoe soles containing 15% pulverized rubber chips (Rubber
Dust) that could be manufactured for a target price and meet target performance

17
specifications. The target manufacturing price per pair of soles was set at $2.88. Shoe manufacturers
typically purchase outsoles for $4.04 per pair. To sell soles at this price, they would have to be
manufactured for $2.88 to leave room for a target 40% mark up. Target performance specifications
were based on actual shoe sole specifications provided by two major shoe manufacturers.8 These
performance specifications were as follows:
• Durometer, 70 A per ASTM D-2240
• Tensile Strength, 45-55 kgs/cm minimum per ASTM D 412
• Elongation Percentage, 250-450% minimum per ASTM D 624
• Tear Strength, 25-55 kgs/cm minimum per ASTM D 624
• Abrasion Index, 18-25% per ASTM D 1630
While these performance characteristics were based on actual specifications for outsoles, their selection
was somewhat arbitrary. Specifications vary for shoe outsoles depending on the type of shoe. Some
shoes require greater abrasion resistance, while others require more cushioning, etc. Also, there are
trade-offs for performance characteristics. For example, sometimes a lower abrasion resistance will be
specified to allow for a softer feel or better grip. Also, as noted earlier, a compound that performs well
in laboratory tests, might not necessarily perform well during normal use.
3.2 COMPOUNDING RUBBER DUST SHOE SOLES, MATERIALS AND METHODS
3.2.1 Rubber Dust, Processing Methods
Rouse Rubber, Inc. (Rouse), of Vicksburg, Mississippi, pulverized the rubber chips down to a nominal
#80 mesh using a proprietary wet-grind ambient temperature process. Rouse charged $0.50 per pound
for pulverization.
3.2.2 Rubber Dust Characteristics
Rouse conducted a sieve analysis (ASTM D 5644) on the rubber dust (Appendix E) and found that it
had a nominal mesh size of #80. Results were as follows:
8 Deja Shoe and a company that requested anonomity provided shoe sole specifications.

18
Sieve Analysis: Percent Passing #30 Mesh 0% #40 Mesh 0% #60 Mesh 25% #80 Mesh 25% #100 Mesh 15% PAN 35% Moisture content was measured at 1.53%.9 10
One of the most interesting characteristics of the rubber dust was discovered in the course of drying the
dust to a constant weight to determine moisture content at a temperature of 200 degrees Fahrenheit.
The rubber dust sample turned into a hard, brittle lava-like porous solid. This condition indicated that
some new cross-linking had occurred at a relatively low temperature and pointed out that surface
activity, and thus less degradation of a rubber formulation, can be induced by using rubber dust. This
observation is also confirmed by studying the cured characteristics of the formulations. For example,
compound A-25, which is introduced and contained 25% rubber dust, actually increased in tensile
strength over the base control, which contained no rubber dust.
3.2.3 Rubber Dust Shoe Sole, Compounding Procedures
A total of five shoe sole compounds were developed, two were controls and contained no rubber dust.
The other three were experimental compounds containing as much as 25% rubber dust. The
compounds developed included:
• A (a control),
• B (a control), identical to A but containing a high styrene resin,
• A-15 (formulation A with 15% rubber dust),
• A-25 (formulation A with 25% rubber dust), and
• B-15 (formulation B with 15% rubber dust).
9 J. L. Merryfield, Inc., measured moisture content by weighing the rubber dust, heating it to 200 degrees Fahrenheit, and then weighing it again.
10A moisture content of 1.53% will pose no problems and can actually enhance surface activity.
19
During compounding procedures it was discovered that 25% rubber dust could easily be incorporated
into the formulations. Should further experimentation in this area be conducted, attempts should be
made to find the upper limit to the amount of rubber dust that the formulations can absorb.
The ingredients of the control formulations and three variations appear in Table 5. Also listed in Table 5
are the rationales behind content selections.

20
Table 5 Formulation Ingredients
Ingredient Rationale A A15 A25 B B15 SBR 1502 -- the least expensive of the elastomers. The specific polymer used was specified because it is coagulated with a fatty acid and is therefore less likely to become sticky.
100.0 100.0 100.0 72.91 72.91
1903 48% Hi Styrene/52%SBR -- a pre-fluxed blend of SBR and high styrene resin. Fluxing is high shear mastication above the melting point of the plastic. Pre-fluxed material assures consistent quality and eliminates the need to raise the batch processing temperature.
xxx xxx xxx 52.08 52.08
Hisil 233 -- a precipitated hydrated silica with a very small ultimate particle size of .022 microns. It is highly reinforcing and provides superior tear strength.
50.0 50.0 50.0 50.0 50.0
Zinc Oxide -- part of the accelerator activation system
5.0 5.0 5.0 5.0 5.0
Stearic Acid -- part of the accelerator activation system.
2.0 2.0 2.0 2.0 2.0
Agerite Stalite S -- a non-staining antioxidant that prevents cracking and degradation.
1.0 1.0 1.0 1.0 1.0
PEG 3350 -- provides reliability and stability to the curing mechanism under factory conditions. It is one of the least expensive additives used with light color fillers such as Hisil 233.
2.0 2.0 2.0 2.0 2.0
MBTS Altax -- part of the acceleration system. 1.0 1.0 1.0 1.0 1.0 TMTD Methyl Tuads -- part of the accelerator activation system.
0.5 0.5 0.5 0.5 0.5
Napthenic Oil Cyclolube -- reduces viscosity and prevents stickiness. Does not adversely affect curing system.
25.0 25.0 25.0 25.0 25.0
Sulfur -- a cross linking agent 2.0 2.0 2.0 2.0 2.0 Rubber Dust 0.0 33.26 62.83 0.0 37.67 Totals 288.5 221.76 251.33 215.49 251.16

21
3.3 PERFORMANCE TEST RESULTS FOR RUBBER DUST SHOE SOLES
Performance Test11 results were positive. B-15 met all performance objectives and A-25 met all of the
performance specifications with the exception of durometer. Also, rubber dust actually increased tensile
strength for A experimental compounds and tear strength for both A and B experimental compounds.
Test methods and results are listed in Table 6.
Table 6 Compound Test Results
Test Method
Target A A-15 A-25 B B-15
Tensile Strength kgs/cm minimum
ASTM D 412
55 86 86 98 114 108
Elongation Percentage
ASTM D 624
450% 620% 620% 600% 680% 680%
Density/Specific Gravity
See footnote3
None 1.13 1.14 1.14 1.12 1.13
Tear Strength, kgs/cm
ASTM D 624
25-55 23 23 30 33 34
Durometer ASTM D 2240
70A 62A 64A 63A 76A 73A
Abrasion Index12 ASTM D 1630
18-25% 69.6% 51.0% 43.7% 85.7% 57.5%
Note: It was also noted that none of the compounds left scuff marks when rubbed under extreme hand
pressure on white paper.
Table 6 illustrates that for tensile strength, every compound exceeded the target specifications. As
illustrated in Figure 1, the addition of rubber dust increased tensile strength for compound A-25 and
slightly decreased tensile strength for compound B-15. This difference is probably insignificant and
because of the margin of error in test results.
11Test samples were molded into six-inch by six-inch by approximately 0.075-inch thick test specimens as per ASTM D 3182. At the optimum time, the cured test specimens were removed. 12 See Figure 5 for test results.

22
Figure 1
Tensile Strength
C o m p o u n d s
0
2 0
4 0
6 0
8 0
1 0 0
1 2 0
A A - 1 5 A - 2 5 B B - 1 5
Tensile Strength: the ability of rubber to withstand pulling
Every compound also met the target range for elongation percentage and as illustrated by Figure 2, the
addition of rubber dust did not seem to have a significant effect on elongation percentage.
Figure 2
E longa t i on Percen tage
C o m p o u n d s
5 6 0
5 8 0
6 0 0
6 2 0
6 4 0
6 6 0
6 8 0
A A - 1 5 A - 2 5 B B - 1 5
Elongation Percentage: the ability of rubber to stretch without breaking
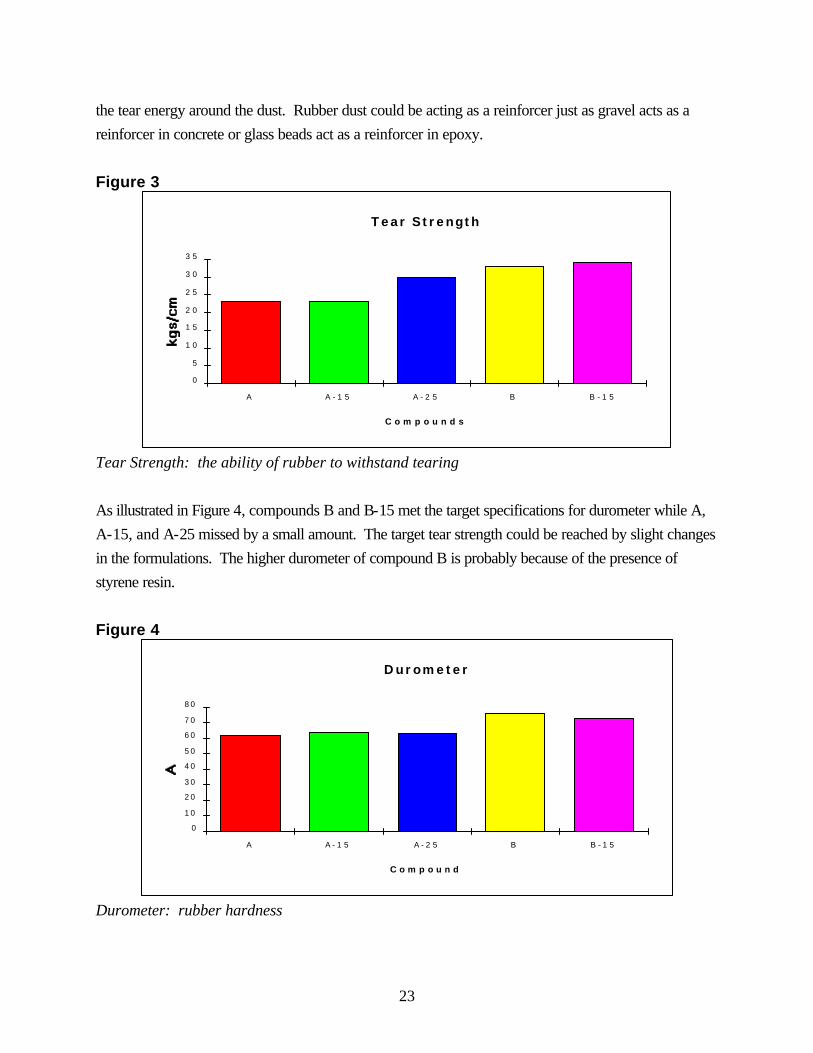
As illustrated in Figure 3, Compounds A and A-15 did not meet the tear strength target, but A-25, B,
and B-15 fell within the target range. Tear strength seems to have been increased for both compounds
A and B by the addition of rubber dust. This difference might be insignificant because of the margin of
error in test results. It could also be that the rubber dust acts as a composite reinforcer and dissipates
23
the tear energy around the dust. Rubber dust could be acting as a reinforcer just as gravel acts as a
reinforcer in concrete or glass beads act as a reinforcer in epoxy.
Figure 3
Tear S t reng th
C o m p o u n d s
0
5
1 0
1 5
2 0
2 5
3 0
3 5
A A - 1 5 A - 2 5 B B - 1 5
Tear Strength: the ability of rubber to withstand tearing
As illustrated in Figure 4, compounds B and B-15 met the target specifications for durometer while A,
A-15, and A-25 missed by a small amount. The target tear strength could be reached by slight changes
in the formulations. The higher durometer of compound B is probably because of the presence of
styrene resin.
Figure 4
D u r o m e t e r
C o m p o u n d
0
10
20
30
40
50
60
70
80
A A - 1 5 A - 2 5 B B - 1 5
Durometer: rubber hardness

24
As illustrated in Figure 5, all compounds far exceeded the abrasion index target specifications. Figure 5
also illustrates that the addition of rubber dust decreased the abrasion index. This decrease is probably
because of the fact that the rubber dust is less abrasion resistant than the base compound.
Figure 5
Abras i on I ndex
C o m p o u n d
0
2 0
4 0
6 0
8 0
1 0 0
A A - 1 5 A - 2 5 B B - 1 5
Abrasion Index: the ability of the rubber to withstand rubbing 3.4 CURING PROPERTIES OF RUBBER DUST COMPOUNDS
Rheograph results provided the following information on the curing of the rubber dust compounds.
Table 7 Rubber Dust Shoe Sole Compound Rheograph Results
A A-15 A-25 B B-15 Scorch Time delta 2 minutes
2.65 2.75 2.60 3.35 3.50
Minimum Torque, ML, units
9.50 10.00 12.00 7.50 8.50
Maximum Torque, MH, units
65.50 54.25 53.50 58.00 47.75
Cure Time (time it takes to reach maximum cure time)
4.28 4.35 4.33 5.80 5.65
Rheometer curves are included in Appendix G.
As indicated by the table, scorch and cure times slightly increased with the addition of rubber dust. This
increase might not be statistically significant. If the increases are statistically significant, they are too
25
small to have an impact on processing costs or efficiencies. Minimum and maximum torque seem to be
unaffected.
3.5 SMALL-SCALE FACTORY TRIALS AND RESULTS
To determine the feasibility of manufacturing shoe soles from rubber dust in a full-scale operation, a
small-scale factory run was conducted. The results of this factory run were positive, indicating that:
• it is possible to manufacture rubber dust shoe soles on a factory scale,
• compounds containing rubber dust take no longer to mold and cure than compounds containing
no rubber dust, and
• Rubber dust can be mixed into rubber compounds using conventional techniques.
During the factory trial, a total of 200 shoe soles were made, forty from each compound. The factory
trial used an 18-inch by 40-inch rubber mill with a friction ratio from 1 to 1.12 and controlled cooling
water.
The first production batch, compound A, contained no rubber dust and was a factory control. Forty
pounds were put onto the mill for warm up and sheeting. The total mill time was 20 minutes.
The second batch, A-15, consisted of 40 pounds of compound A and 7.05 pounds of rubber dust for a
total batch weight of 47.05 pounds. The total mill time was 23 minutes.
The third batch, A-25, consisted of 40 pounds of A and 13.29 pounds of rubber dust for a total batch
weight of 53.29 pounds. The total mill time was 27 minutes.
The fourth production batch was compound B, which contained no rubber dust and was a factory
control. Forty pounds were put onto the mill for warm-up and sheeting. The total mill time was 25
minutes. The added five minutes was because of the high styrene resin that was formulated into
compound B. When rubber formulations containing plastics are cold, as Compound B was during these
factory trials, they tend to take longer to form a smooth matrix on the mill. However, once warmed the
plastic acts as a process aid and might contribute to smooth milling and subsequent forming operations
such as calendering and extruding.
The fifth batch, B-15, consisted of 40 pounds of compound B and 7.05 pounds of rubber dust for a
total batch weight of 47.05 pounds. The total mill time was 27 minutes.

26
Table 8 below summarizes batch weights and mill times for each of the five compounds. Mill
time/pound is also included in the table and is found to stay relatively constant. Compounds B and B-
15 took more time to mix, but this longer time was primarily because of the affect of the cold
temperature on the high styrene as noted above.
Table 8
Batch Weights and Mill Time Compound Batch
Weight (pounds)
Mill Time (minutes)
Mill Time/Batch weight
(minutes/pound)
A 40 20 .50
A-15 47 23 .49
A-25 53 27 .51
B 40 25 .62
B-15 47 27 .57
3.6 ECONOMIC FEASIBILITY OF MANUFACTURING RUBBER DUST SHOE SOLES
Cost calculations indicate that it is possible to manufacture shoe sole pairs for the target price of $2.88
per pair. Depending upon the scenario, calculations indicate that a pair of soles can be manufactured
for between $1.42 and $2.38.
To arrive at this cost estimate, data from the factory runs and material costs were analyzed. Material
costs were calculated by adding ingredient costs together. Material costs for rubber dust compounds
are listed in Table 9.
27
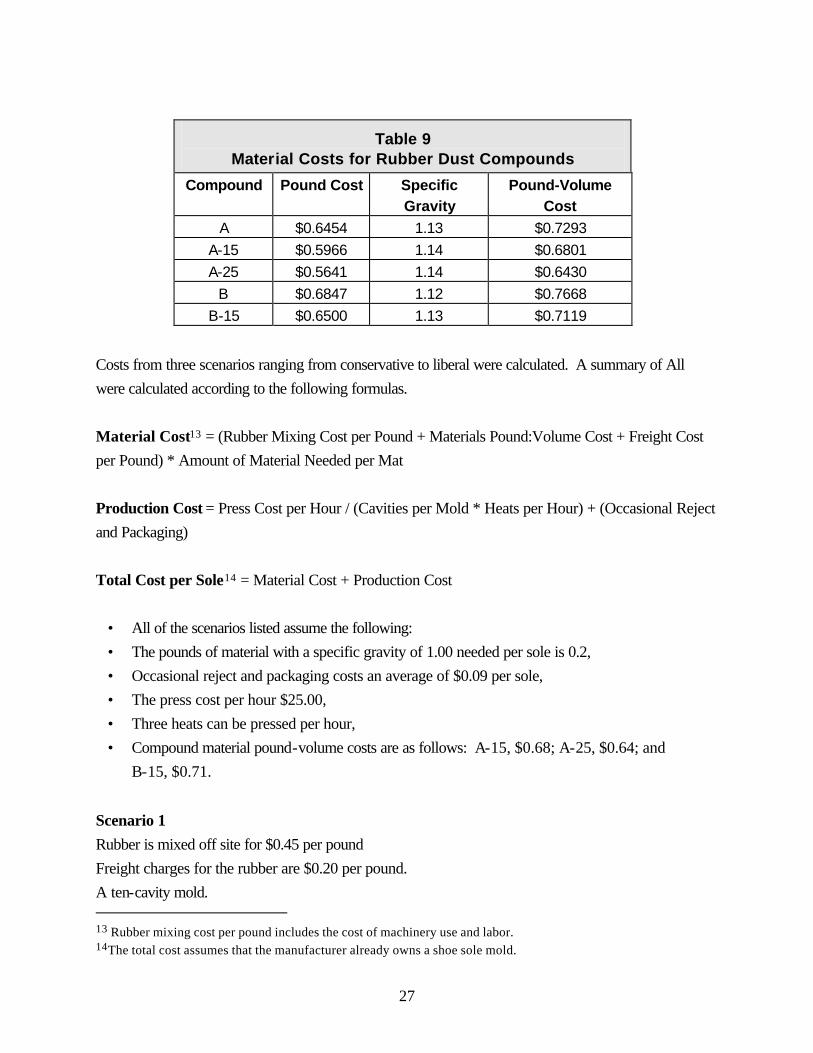
Table 9 Material Costs for Rubber Dust Compounds
Compound Pound Cost Specific Gravity
Pound-Volume Cost
A $0.6454 1.13 $0.7293
A-15 $0.5966 1.14 $0.6801
A-25 $0.5641 1.14 $0.6430
B $0.6847 1.12 $0.7668
B-15 $0.6500 1.13 $0.7119
Costs from three scenarios ranging from conservative to liberal were calculated. A summary of All
were calculated according to the following formulas.
Material Cost13 = (Rubber Mixing Cost per Pound + Materials Pound:Volume Cost + Freight Cost
per Pound) * Amount of Material Needed per Mat
Production Cost = Press Cost per Hour / (Cavities per Mold * Heats per Hour) + (Occasional Reject
and Packaging)
Total Cost per Sole14 = Material Cost + Production Cost
• All of the scenarios listed assume the following:
• The pounds of material with a specific gravity of 1.00 needed per sole is 0.2,
• Occasional reject and packaging costs an average of $0.09 per sole,
• The press cost per hour $25.00,
• Three heats can be pressed per hour,
• Compound material pound-volume costs are as follows: A-15, $0.68; A-25, $0.64; and
B-15, $0.71.
Scenario 1
Rubber is mixed off site for $0.45 per pound
Freight charges for the rubber are $0.20 per pound.
A ten-cavity mold. 13 Rubber mixing cost per pound includes the cost of machinery use and labor. 14The total cost assumes that the manufacturer already owns a shoe sole mold.

28
Scenario 2
Rubber is mixed in-house for $0.36 per pound
Freight charges for the rubber are free (mixed in house)
A ten-cavity mold.
Scenario 3
Rubber is mixed off site for $0.36 per pound
Freight charges for the rubber are free (mixed in house)
A twenty-cavity mold.
Table 10 Rubber Dust Shoe Soles Manufacturing Costs
A-15 Cost A-25 Cost B-15 Cost Scenario 1
Material $0.27 $0.26 $0.26 Production $0.92 $0.92 $0.93
Total $1.19 $1.18 $1.18 Scenario 2
Material 0.21 0.22 0.22 Production 0.92 0.92 0.92
Total 1.13 1.14 1.14 Scenario 3
Material 0.21 0.22 0.22 Production 0.51 0.51 0.51
Total 0.71 0.73 0.73
4.0 CONCLUSION
In conclusion, the overall project results indicate that manufacturing shoe soles and door mats from
post-consumer athletic shoes is both technically and economically feasible. The performance testing and
factory trial for the mats demonstrated that the door mat containing 80% rubber chips met both
performance test requirements of durometer and abrasion resistance, and could be manufactured for
$5.43--well below the target price of $7.00.
The performance testing and factory trial for the soles indicated that a compound containing 15% rubber
dust meets all the specifications set by some shoe manufacturers and could be manufactured for $1.42
to $2.38 a pair, below the target price of $2.88 a pair.
29
While on the whole results were favorable, some findings were disappointing. It was discovered that
rubber chips contain aluminum that cannot be removed by magnets. Unfortunately, very few rubber
manufacturers will work with metal-contaminated material for fear that it will damage their equipment.
Further work needs to be conducted to determine if it is possible to remove the aluminum through an
air-separation process. Rubber chips also contain plastic that tends to stick to molds and causes
random peaks on otherwise smooth surfaces. Additional work is needed to determine the type of mold
release that will prevent this problem.
The project also indicates that a new type of thinking is required in the development of compounds
containing the relatively large rubber chips. The rubber chips should not be thought of as an ingredient
within a homogeneous compound. Rather, they should be thought of as granules in an aggregate held
together by a rubber matrix.
The project also pointed to the favorable potential of rubber dust. Rubber dust mixed very easily into
compounds and actually served to enhance the tensile and tear strength of the shoe sole compounds.
Rubber dust also cross-linked at relatively low temperatures, indicating that its addition has the potential
to reduce the degradation of rubber compounds.
Lastly, the results of this project pave the way for further work in the development of shoe soles and
door mats containing post-consumer athletic shoes. However, because lab and performance tests do
not reliably predict performance in the field, the two products must be field tested prior to
commercialization.
5.0 ACKNOWLEDGMENTS
This Report was funded by the Recycling Technology Assistance Partnership (ReTAP). ReTAP is a
program of the Clean Washington Center, Washington State’s lead agency for the market development
of recycled materials. ReTAP is an affiliate of the national Manufacturing Extension Partnership (MEP),
a program of the U.S. Commerce Department’s National Institute of Standards and Technology. The
MEP is a growing nationwide network of extension services to help smaller U.S. Manufacturers
improve their performance and become more competitive. ReTAP is also sponsored by the U.S.
Environmental Protection Agency and the American Plastics Council.
The following organizations contributed their time, effort, and support during the conduct of this project:
1. Carton Environmental Systems
30
2. J. L. Merryfield, Inc.

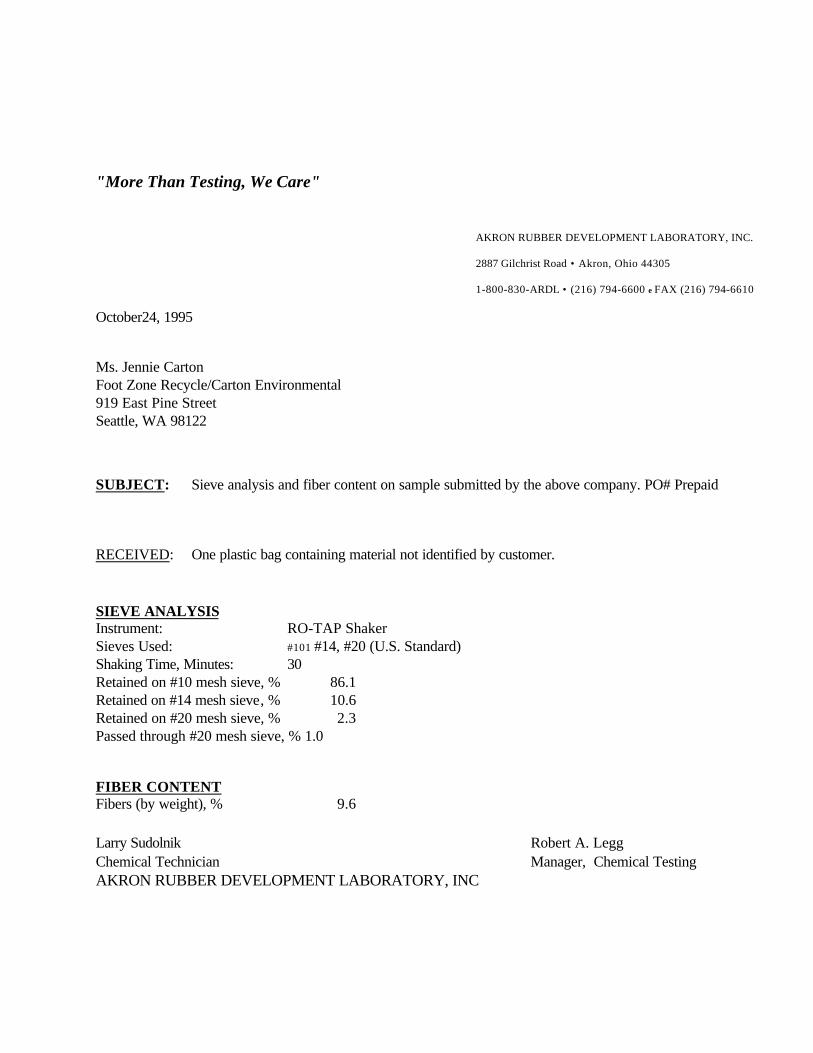
APPENDIX A
Akron Rubber Development Laboratory, Inc. Test Results
"More Than Testing, We Care"
AKRON RUBBER DEVELOPMENT LABORATORY, INC.
2887 Gilchrist Road • Akron, Ohio 44305
1-800-830-ARDL • (216) 794-6600 e FAX (216) 794-6610
October24, 1995 Ms. Jennie Carton Foot Zone Recycle/Carton Environmental 919 East Pine Street Seattle, WA 98122
SUBJECT: Sieve analysis and fiber content on sample submitted by the above company. PO# Prepaid
RECEIVED: One plastic bag containing material not identified by customer.
SIEVE ANALYSIS Instrument: RO-TAP Shaker Sieves Used: #101 #14, #20 (U.S. Standard) Shaking Time, Minutes: 30 Retained on #10 mesh sieve, % 86.1 Retained on #14 mesh sieve, % 10.6 Retained on #20 mesh sieve, % 2.3 Passed through #20 mesh sieve, % 1.0 FIBER CONTENT Fibers (by weight), % 9.6 Larry Sudolnik Robert A. Legg Chemical Technician Manager, Chemical Testing AKRON RUBBER DEVELOPMENT LABORATORY, INC

APPENDIX B
Smithers Scientific Services, Inc. Abrasion Test Results

CUSTOMER: J. L. Menyfield inc. 5127 Duban Avenue Orlando? FL 32812 ATTENTION: J. L. Merryfield Smithers Job #25876
SUBJECT: The above mentioned firm submitted one (I) sample for testing identified as "five samples for abrasion 95-9-A, 95-9 AIS, 95-9-A25, 95~9-B and 95-9-B151'.
TESTUNG: PHYSICAL Analysis' NBS Abrasion, ASTM DI 630
RESULT: NNBA ABRASION: ASTM D1630 Shore A A B C Mean Abrasive Sample Hardness (0,100")(0,100")(0100") (Rev/0,100") Index %
CONTROL(Pre) 63 488 486 496 488 96.8
CONTROL(Post) 63 499 534 522 522 103.6
Control Average: 504 95-9-A 60 321 351 361 351 69.6 95-9-Al5 61 234 262 257 257 51.0 95-9-A25 62 217 228 220 220 43.7 95-9-B 72 432 412 460 432 85.7 95-9-B15 76 290 302 283 290 57.5
This report shall not be reproduced except in full, without the written approval of the laboratory
Every precaution was taken to ensure the accuracy of this report. However. the information is provided subject to the condition that Smithers Scientific Services, Inc., will not be liable for any loss or damage resulting from the use of these data.

APPENDIX C
Rheometer Reading for Compounds G and H

The Rheometer provides a graph of a rubber compound as it is curing. In addition, by observing the early stages of the graph some indication of the uncured compounds characteristic s can be found. Likewise, by observing the final stages of the graph a l~ted amount of information concerning the cured compounds physical characteristics can be found. The rheograph is a torque curve shown over a period of time. The Y axis is torque in pound-inch (pounds force inch) the X axis is usually in minutes. The entire rheograph curve has value. However, to facilitate meaningful technical conversations (especially in a time before faxes) four points were chosen to characterize a rheograph curve. Note that items 1 and 2 are torque values, that is describing the curve in terms of the X axis. Items 3 and 4 are time values describing the curve in terms of the Y axis. There is nothing magical about any of these points, they merely serve to convey the configuration of the cure. Also, Rheometer can be run at any given temperature and any "rise'1
time can be used. 1tDelta-two "is just the most common.

APPENDIX D
Calculation of Pound Costs for Compounds G-56, G-80, and H-80
(Not included in this electronic file but available upon request)

APPENDIX E
Rouse Rubber Industries, Inc., Product Certification
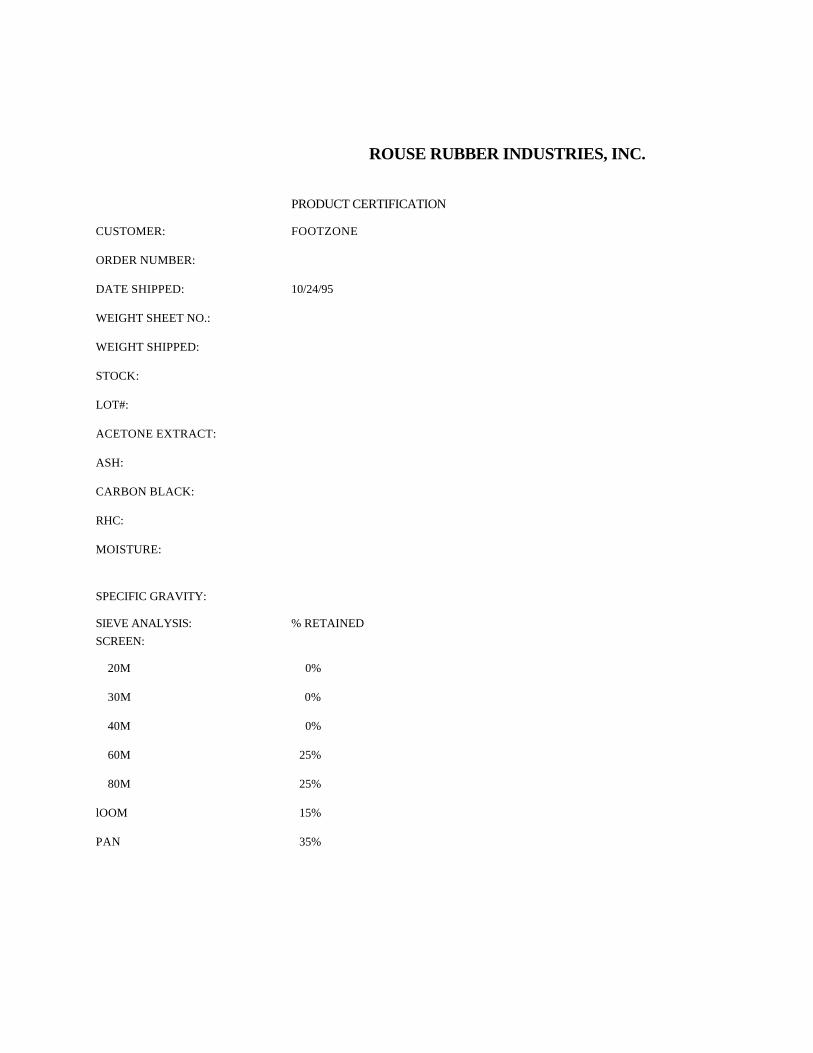
ROUSE RUBBER INDUSTRIES, INC.
PRODUCT CERTIFICATION
CUSTOMER: FOOTZONE
ORDER NUMBER:
DATE SHIPPED: 10/24/95
WEIGHT SHEET NO.:
WEIGHT SHIPPED:
STOCK:
LOT#:
ACETONE EXTRACT:
ASH:
CARBON BLACK:
RHC:
MOISTURE:
SPECIFIC GRAVITY:
SIEVE ANALYSIS: % RETAINED
SCREEN:
20M 0%
30M 0%
40M 0%
60M 25%
80M 25%
lOOM 15%
PAN 35%

APPENDIX F
Smithers Scientific Services, Inc. Abrasion Test Results
(Not included in this electronic file but available upon request)
APPENDIX G
Rheometer Readings for Compounds A, A-15, A-25, B, and B-15
(Not included in this report but available upon request)