development and trial of a water exposure measure of
TRANSCRIPT

International Journal of Aquatie Research and Education, 2013, 7,116-135©2013 Human Kinetics, Inc.
Development and Trial of a Water ExposureMeasure of Estimated Drowning Risk
for Surf Bathers
Damián Morgan and Joan Ozanne-Smith
To better address drowning issues, risk assessment at the group and sample levelswould be enhanced by precise measures of exposure to water. The aim of the studywas to develop and pilot test a method of measuring exposure to water based onestimating immersions for surf bathers. Validated direct observation counts pro-vided peak-bathing period point estimates and a daily bather immersion profilefor an identified sampling frame comprising 20 beaches over 39 summer days.An estimated 10,089 water immersions occurred at the peak-bathing period in thesampling frame. Swimmers comprised 86.0% and surfers with equipment 14.0%of the observed bathing sample, respectively. For swimmers only on patrolledbeaches, 77.1% bathed in the lifesavcr supervised (flag) zones. The study hasimplications for the provision of organized bather supervision and provides afoundation for generation of hypotheses on the nature of drowning risk for selectedsurf bather groups.
Keywords: water exposure; drowning risk; surf beaches; methodology.
Drowning is a eomplex injury problem identified aeross numerous aquatieloeations with an estimated 1.2 million drowning deaths oeeurring world-wideeaeh year (International Life Saving Federation, 2012). Groups eonsidered to be atrelatively high risk of drowning include young children accessing backyard poolsor other artificial water bodies, elderly persons in bathtubs, and adoleseent or adultmales swimming at beaches or other open water locations (Hayashi, Ago, Ago, &Ogata, 2010; Peden et al., 2008; Quan & Cummings, 2003). The International LifeSaving Federation reports that for drowning deaths associated with recreationalactivities, 40% oeeur two meters or less from shore, and 25% occur in water depthbelow one meter.
Assessment of drowning risk for specified high risk groups or categories is oftenbased only on a relatively higher fatal drowning frequency reported for locationsand cireumstances of interest or from resident population-based rates. Needless tosay, drowning risk could be determined more accurately by applying more refined
Damián Morgan is with the School of Business and Economics at Monash University in Churchill,Victoria Australia. Joan Ozanne-Smith is with the Department of Forensic Medicine at Monash Uni-versity in Melbourne, Victoria, Australia.
116

Drowning Risk 117
measures of exposure to water and other possible drowning risk factors (Robertson,2(X)7). Precise exposure measurement will determine, for example, whether drown-ing patterns simply reflect proportional levels of exposure to water. The alternatefinding supports hypotheses associated with an identified group's exposures todrowning risk or protective factors.
Pless and Hagel (2005) acknowledge that exposure to risk is central to anepidemiological injury prevention approach but note that quantifying exposure canbe "often bewilderingly complex" to the point where for drowning, "it is almostimpossible to conceive of a denominator that truly reflects exposure to risk and thatis feasible to measure" (pp. 184—5). Depending on the research question, potentialmeasures and data for specifying drowning risk exposure over a given time-periodinclude the number of water entries (immersions), duration time of water entries,location of water entries (e.g., backyard swimming pool or lifesaver supervised surfbeach), sea and water conditions at the time of water entry, person or other situationfactors, or some combination of these. This choice is important because the exposuremeasure in drowning risk used for analytical epidemiologic study (with adequatevalidity assumed) determines drowning rates, relative drowning risks, or drowningrisk contributions from candidate factors. Any applied measure of water exposurewill nevertheless still be an epidemiologically crude estimate of drowning risk inthe sense that drowning risk contributions from all factors may not be accounted atthe group or individual level. Morgan and Ozanne-Smith (2012, p. 338) providedan example of how a contradictory drowning risk assessment between age groupsmay result depending on the measure used to determine exposure to water. In thisexample, drowning risk for a defined group is shown to be relatively higher than acomparison group when based on immersion frequency and relatively lower whenbased on the duration of immersions.
Exposure to water or other drowning risk factors has been estimated byimprecise methods including self-report of past behavior or proxy measures suchas pool ownership (Mitchell, Williamson, & Olivier, 2010; Morgan, Ozanne-Smith,& Triggs, 2009a; Pearn & Nixon, 1977). Certain drowning problems may lendthemselves to more precise water exposure measurement.
Study RationaleSurf beaches provide a potential location for developing and testing new methodsto measure water exposure. Surf bather drowning is a recognized problem in manycountries with the epidemiology described for some (Morgan, Ozanne-Smith, &Triggs, 2008). Sufficiently-sized surf bather samples may be obtained from beachesnear population centers given the high visitation levels sustained during amenableweather conditions. Bathers are readily observable and the role of factors includ-ing environmental conditions and organized bather supervision may be recordedsimultaneously. Such a measure of exposure to bather supervision may, for example,provide both an assessment of the safety service uptake and a comparison withself-reported survey data (Kellogg's & NewspoU, 2000).
As a supplemental benefit, better understanding of water exposure wouldenhance the value of currently available information associated with surf batherdrownings. Relevant studies include descriptions of bathing duration, site prefer-ences, beach use, risk perceptions, and dangers presented by environmental hazards

118 Morgan and Ozanne-Smith
(Harada, Goto, & Nathanson, 2011; McCool, Moran, Ameratunga, & Robinson,2008; Mercer, 1972; Morgan, Ozanne-Smith, & Triggs, 2009b; Sherker, Williamson,Hatfield, Brander, & Hayen, 2010; White & Hyde, 2010). Sourced mostly from selfreports or observations from ecological studies, reported findings provide usefulknowledge, particularly at the individual bather level. Reliable data shedding lighton surf bathing patterns and estimated drowning risk over time at the large samplelevel would complement current knowledge.
Hence, the research reported here aimed to develop and pilot a suitable methodfor measuring water exposure by direct observation of a surf bathing sample basedon water immersions. To support the methodological development, two objectiveswere assessed: (a) the accuracy of observed counts by comparison with independentcounts and video recorded data, and (b) the accuracy of results based on comparisonwith a relatively less intensive sampling procedure.
MethodSurf bather water exposure data were measured by direct observation and recordedvideo for selected beaches situated in Victoria, Australia. Spatial and temporalsampling frames were determined in consideration of the research aim, data require-ments, physical resources, location, access, and available research funding. Ethicalapproval for the study was granted by the Monash University Standing Committeeon Ethics in Research Involving Humans, project no. 2001/431.
Spatial Sampling FrameShort's (1996) system of Australian beach identification and description provided abasis for the study. The spatial sampling frame comprised 20 spatially consecutivewave-dominated beaches, spanning approximately 23 km of coastline followinga southeast to northwest direction (see Figure 1 ; beach numbers 250-269 underShort's system). All beaches were located within the Mornington Peninsula NationalPark (on the Southeast Australian coastline), approximately 110 km by road fromthe Melbourne (2006 population = 3.7 million) central business district (AustralianBureau of Statistics, 2007). Access, size, environmental features, facilities, services,and amenities varied among the beaches. For example, three beaches had regularlifesaving patrols during the summer. Seventeen beaches were not patrolled bylifesavers during the study. On the three patrolled beaches, the lifesavers on dutyclosely supervised bathers within a narrowly defined zone. Bathers positionedoutside this zone at these patrolled beaches may have been unsupervised. Asexplained below, bathing at patrolled beaches may occur distant from stationedpatrols or outside patrol hours. In the study, data from the three patrolled beachesinclude both supervised and unsupervised bathing areas unless otherwise stated.The three patrolled beaches carried a National Park entrance charge, but also hadtoilets/ change rooms, dedicated car parks, and kiosk. Other beaches had no builtfacilities or services, with access for some limited to dirt walking tracks over 300m. Beach lengths ranged from 50 m to 4000 m.

Drowning Risk 119
Beaches sampling frame
Figure 1 — Spatial sampling frame with respect to Melbourne city (map courtesy of Tour-ism Victoria, reproduced with permission).
Temporal Sampling Frame
The study was conducted during the midsummer school holidays in three timeperiods, from late December to late January (pilot, 2(K) 1-2002; time-period 1,2003-2004; time-period 2, 2004-2005). These summer months were assumed thebusiest for beach bathing due to the generally favorable weather conditions andthe traditional holiday period.
Target Sample and Data Collections
The target sample was defined as beach bathers (i.e., waders, swimmers and surfersusing equipment) meeting the sampling frame parameters. Mornington PeninsulaNational Park visitor records were extrapolated to provide proportions for samplestratification to increase the sampling precision for the study (Zanon, 2002). Basedon these data, 47% of the research sample attended the three patrolled beaches and53% the 17 unpatrolled beaches. With respect to day of the week, 42% visited onweekend days and 58% on week days.
For time periods 1 and 2, two sets of data were collected. Dataset 1 comprisedcounts of surf beach bathers in the water at a time-point within the 3-hour peak-bathing period (defined as 12:30 p.m.-3:30 p.m. established from pilot data).Dataset 2 comprised point counts of bathers in the water at half hour intervals for

120 Morgan and Ozanne-Smith
a single beach over a day (6:00 a.m.-8:00 p.m.) plus night spot checks, for time-period 1 only.
Dataset 1: Bather counts during the peak-bathing period. Data were collectedby two trained research assistants for a planned 39 consecutive days (time-period1) from December 20, 2003 to January 27, 2004 and (time-period 2) for 20nonconsecutive days (over a 39 day period) from December 20, 2004 to January27, 2005. Time-period 2 data were collected for comparison with time-period 1data testing a more restricted and less resource intensive sampling procedure. Topromote data heterogeneity for bather counts within the time-period 2 data, thesampling days were distributed over quartile air temperature ranges, based onaverage forecast maximums (degrees Celsius: below 22; 22-24; 25-28; over 28)and day type (13 week days, 6 weekend days and 1 public holiday) as these factorwere presumed to be influential on beach visitation and ensuing bather levels.
Guidelines for sampling method and design were provided by vertebratemonitoring procedures (Thompson, White, & Gowan, 1998). For simple randomsurveys, sampling without replacement is the preferred option for providing unbi-ased estimates in smaller sample sizes. Because variables presumed to influencebather patterns varied across days (e.g., maximum temperature), each day wasconsidered a discrete event. Therefore, beaches were randomly selected each daywithout replacement (no beach was observed twice or more in one day), but for eachnew sample day, all beaches selected the previous day were replaced for inclusionwithin the random selection.
The accuracy of large sample estimates of bather abundance (persons immersedin water) within the sampling frame at the peak-bathing period was contingent on thepopulation size, sampling size, and sampling procedure. The size of the populationto be sampled was from 780 beach-days (i.e., bather counts for 20 beaches over39 days). The maximum feasible sample size of beaches was set at five randomlysampled from two strata for each survey day (comprising two from three patrolledand three from 17 unpatrolled beaches for time-periods 1 and 2). This number wasbased on available resources, the observation method (detailed below), and therequired travel times between beach observations. An online calculator was usedto determine random sampling order each survey day (Urbaniak & Pious, 2003).
The sampling plan for time-period 1 provided a sample size of 195 beach-days(five beaches over 39 days from a population of 780 beach-days) resulting in a95% confidence level of the estimate being within ±6.1% of the true populationfigure (Custominsight, 2007). Corresponding 95% confidence for the time-period 2sampling plan estimate (100 beach-days—drawn from five beaches over 20 days—from a population of 780 beach-days) was ± 9.2%. These estimates assumed thatno enumeration variance existed (i.e., all bathers in the water at each beach countcan be observed and recorded accurately).
Dataset 2: Bather count profile over a daily period. To record the profile ofvariation in bather numbers over the daily period in the sampling frame, countswere recorded by the first author each half hour at 10 selected beaches from 6:00a.m.-8:00 p.m. The method of observation and recording replicated that usedfor the peak-bathing period counts (see below). A purposive sample of high usebeaches (from pilot) comprised five patrolled and five unpatrolled beaches. Fivecounts were taken on week days and five on weekend days. Four spot checks were

Drowning Risk 121
taken between 9:00 p.m. and 11:00 p.m. on nights conducive to bathing. High-use beaches were counted so that individual bather group patterns would exert arelatively small effect on counts. Table 1 provides a summary of the sample countsand count populations.
Bather Count Procedure
The observation method for counting total numbers of in-water bathers (immer-sions) was developed and tested over 7 days during piloting. Bathers were readilyidentified. Disfinguishing between swimmers and surfers using specialized wave-riding equipment (surfboards or body-boards) was straight forward. Bather sexand age were not readily identified so neither variable was recorded. Weather andwater conditions were recorded onsite.
In Australia, direct and continuous bather supervision at patrolled beaches isrestricted typically to a lifesaver-determined bathing zone identified by the aquaticspace between two flags posted in the san and adjacent to the wa ;r (see Sherker etal., 2010) for a specified daily period (e.g., 10:00 a.m. to 6:00 p.m. in the summerseason). Based on the first author's untested and limited observations, the distancebetween flags may be from 20 m up to around 70 m. Lifesavers, stationed at thiszone, closely supervise bathers in the aquatic area identified between the flags andgive less attention to bathers outside of this area (Surf Life Saving Australia, 2012).In fact, bathers outside lifesaver supervised zones on patrolled beaehes may be over1000 m distant from stationed patrols given the length of some of these beaches.
During the study observations, bathers were noted to congregate between theflags and were readily distinguished from those outside—the latter bather groupwas separated by enforeed buffer zones. Bathers outside lifesaver supervised zoneson patrolled beaches mostly comprised surfers using hard fiberglass boards notallowed in the flag zones for safety reasons. The use of soft body boards may be
Table 1 Date Collection Schedule for Bather Counts at Peak Bathing PeriodFrom a Sampling Frame of 20 Adjacent Beaches Over a 39-Day Period
Patrolled Beaches
% of CountCount Population^
Time Period 1: 2003-2004—Over 39 Days
Planned & Random 78 66.7
Daily Variation Count 5 0.4
Time Period 2: 2004-2005—over 20 days
Planned & Random 40 34.2
Unpatrolled Beaches
Count
117
5
60
% of CountPopulation''
16.1
0.1
9.0
Count
195
10
100
Total
% of CountPopulation'^
25.0
0.1
12.8
Note. Patrolled beaches include both supervised and unsupervised bathing areas.
'Potential peak-bathing period point count was 117 patrolled beach-days.
I" Potential peak-bathing period point count was 663 unpatrolled beach-days.
'Potential peak-bathing period point count was 780 patrolled and unpatrolled beach-days.

122 Morgan and Ozanne-Smith
permitted in the closely supervised area at the discretion of the patrol captain (SurfLife Saving Australia, 2013). The location of bathers with respect to the lifesaversupervised zones (between the flags) was recorded during the counting procedure.
Obtaining accurate bather counts, particularly on high use days, proved difficultfor several reasons: Some nonbathers (e.g., fully clothed persons standing at theshoreline) were immersed sporadically at the water's edge with the surge of passingwaves; swimmers and surfers were hidden periodically behind or under swell andbroken waves; the size of some beaches allowed bathing at far distances from theobserver; one beach (Gunnamatta) was best observed from two discrete points asbathers close to the water's edge at point 2 may have been obscured at point 1 by arocky outcrop. Fortunately, this reef formation observable at both points effectivelysplit the beach and so facilitated discrete bather observations.
To obtain accurate bather immersion counts six procedures were undertaken:
1. The optimal observation point was identified at each beach based on elevationand shadow;
2. High powered wide angle binoculars were used for counting;3. To provide identification of bathers (and exclusion of nonbathers), all persons
observed in the water to a minimum of knee deep (approximately 50 cm foradults) during the count were included to designate constant and intentionalexposure to water. Persons in shallow water below knees were theoretically atrisk for drowning, of course, but were not considered in this study to be partof the bather sample;
4. Observation was conducted over an extended time-period to identify allbathers in wave zones (e.g., observing long enough for the passage of four tosix waves);
5. A second count was conducted immediately (after a maximum two minutebreak if required) following the first count. The average of these two countswas then taken as the observed count, and;
6. For Gunnamatta Beach, this procedure was conducted at two observation pointswith results tallied.
Bather Count Reliability
The reliability of bather immersion counts observed and recorded at the peak-bathing period was assessed by interrater reliability (for time-period 1 ) and accuracyassessment based on a comparison of observed counts with counts from videorecordings (for time-period 2). Interrater reliability was assessed by six comparisonbeach counts duplicating planned counts taken over four days. Duplicated counts didnot coincide in time exactly with planned counts but remained within the specifiedpeak-bathing period. Video footage was recorded directly following the observedcount for each beach. The observer used a hand held digital video camera (8 mm)to pan bathers along the beach. Recordings were loaded as digital files to allowlater counts directly from a computer screen; video data reduction was enhancedby screen freezing to count bathers from still images where required. The videocounts were made independent of any reference to the observed counts.

Drowning Risk 123
Data Analysis
Collected data were entered on spreadsheets for statistical analyses. Bather countinterrater reliability and video count comparisons (dataset 1) were estimatedusing Spearman rank order correlation coefficients (r^), alpha/? < .05, assuming anonnormal distribution (Rosner, 2006). Bather counts taken for the peak-bathingperiod (dataset 1 ; 12:30 p.m.-3:30 p.m.) were used to estimate a total point countof immersions for the sampling frame (20 beaches over 39 consecutive days). Thisprocedure estimated total daily sample-size within each stratum from the average ofobserved counts across surveyed beaches multiplied by the total number of beaches.
Summing the two strata (dataset 1 ; patrolled and unpatroUed beach counts)for the 39 survey days provided the sample-size point estimate at the peak-bathingperiod for the sampling frame in time-period 1 (Thompson et al., 1998, p. 52). Intime-period 2, results summated for 20 survey days were extrapolated to the cor-responding 39-day period. Sample-size estimates were used to calculate averagesincluding bathers per day and per beach. Point estimates for the peak-bathingperiod immersions were calculated for surfers, swimmers, bathers between theflags (lifesaver supervised bathing zones), and beach type (patrolled or unpatroUed).Results for bathers within or outside the lifesaver supervised zones are reportedfor swimmers only (including waders but excluding surfers with soft body-boardsor surfboards).
The resultant daily profile of water immersions (dataset 2; bather counts at 30min intervals from 6:00 a.m. to 8:00 p.m. plus night spot checks) treated batherimmersions as the unit of measurement. The total bathers reported for each halfhour period (average) were calculated by summing bather counts (for each halfhour) across the 10 data collection days.
Results
Bather Count Validation
Interrater reliability counts and corresponding planned counts for dataset 1 arereported in Table 2. The counts distributions recorded for time-period 1 were highlycorrelated (r^ - 0.89, p = .019), although the sample size of 12 observations in totalwas small. Aggregate results for the comparison between direct observation countsand subsequent video counts recorded for time-period 2 are presented in Table 3.Generally, comparison of counts with few bathers proved equivalent. At higherbather levels, the video counts were mostly lower than direct observation counts.Probable reasons include image clarity leading to difficulty in distinguishing exactnumbers of people close by others in the water. A further reason for discrepanciesmay be the time difference between direct observation counts and video countssince people entered or left the water within a few minutes duration and wave swashquickly changed the water level and the subsequent number of bathers. Regardlessof differences, statistical testing confirmed that direct observation counts and videocounts were highly correlated {r^ = 0.99, p < .001).
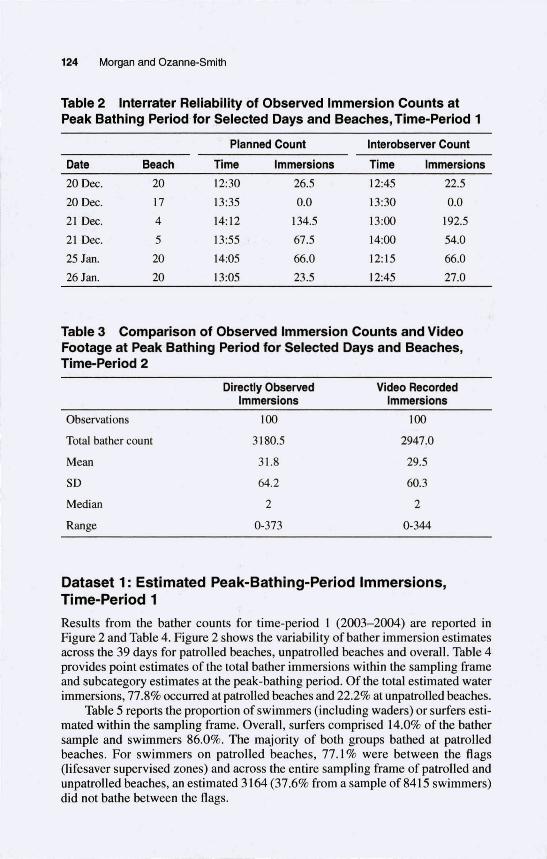
124 Morgan and Ozanne-Smith
Table 2 Interrater Reliability of Observed Immersion Counts atPeak Bathing Period for Selected Days and Beaches, Time-Period 1
Date
20 Dec.
20 Dec.
21 Dec.
21 Dec.
25 Jan.
26 Jan.
Beach
20
17
4
5
20
20
Planned
Time
12:30
13:35
14:12
13:55
14:05
Count
Immersions
26.5
0.0
134.5
67.5
66.0
23..*
Interobserver Count
Time
12:45
13:30
13:00
14:00
12:15
12:4.-1
Immersions
22.5
0.0
192.5
54.0
66.0
27.0
Table 3 Comparison of Observed Immersion Counts and VideoFootage at Peak Bathing Period for Selected Days and Beaches,Time-Period 2
Observations
Total bather count
Mean
SD
Median
Range
Directly ObservedImmersions
100
3180.5
31.8
64.2
2
0-373
Video RecordedImmersions
100
2947.0
29.5
60.3
2
0-344
Dataset 1: Estimated Peak-Bathing-Period Immersions,Time-Period 1
Results from the bather counts for time-period 1 (2003-2004) are reported inFigure 2 and Table 4. Figure 2 shows the variability of bather immersion estimatesacross the 39 days for patrolled beaches, unpatrolled beaches and overall. Table 4provides point estimates of the total bather immersions within the sampling frameand subcategory estimates at the peak-bathing period. Of the total estimated waterimmersions, 11.%% occurred at patrolled beaches and 22.2% at unpatrolled beaches.
Table 5 reports the proportion of swimmers (including waders) or surfers esti-mated within the sampling frame. Overall, surfers comprised 14.0% of the bathersample and swimmers 86.0%. The majority of both groups bathed at patrolledbeaches. For swimmers on patrolled beaches, 11.\% were between the nags(lifesaver supervised zones) and across the entire sampling frame of patrolled andunpatrolled beaches, an estimated 3164(37.6% from a sample of 8415 swimmers)did not bathe between the flags.

1200
lOOO
soo
600
400
200
-»•J+Â+iXl.^
•NotPalrotled•PMfolled
it .1 .1 . JlillxillUUUiSHU 29 2:9i0il IDecember 2005
11 U 13 1< IS 16 17 U 1* 20 21 22 23 J' 15 U 27
January 2004
Figure 2 — Esti mated bather immersions at peak bathing period for patrolled (n = 3), unpa-trolled (n = 17), and overall (n = 20) surf beaches over 39 consecutive days, time-period 1.Note. Patrolled beaches include both supervised and unsupervised bathing areas.
Table 4 Estimated Bather Immersions at Peak Bathing Period Over39 Consecutive Days, Time-Period 1
Total
Total per day
Mean
SD
SE
Median
Range
Per beach for 39 days
Mean
Per beach per day
Mean
Research
Patrolled (n = 3)
7851
201.3
229.1
36.7
140.3
0-1087.5
2617.0
67.1
Frame of 20 Consecutive
Unpatrolled (n = 17) All
2238
57.4
84.4
13.5
22.7
0-337.1
131.7
3.4
Beaches
Beaches (n = 20)
10,089
258.7
278.8
44.6
145.5
0-1115.8
504.5
12.9
Note. Patrolled beaches include both supervised and unsupervised bathing areas.
125

126 Morgan and Ozanne-Smith
Table 5 Estimated Mean Bather Immersions at Peak Bathing Periodby In-Water Activity and Beach Type Over 39 Consecutive Days,Time-Period 1
Bather Immersions Per Beach
Patrolled
Unpatrolled
Total
Average Swimmer Immersions:Patrolled Beaches Only
In-Water Activity
Surfers
349
37
386
In Flags
1750
%90.4
9.6
100
%
77.1
Swimmers
2 268
95
2 363
Outside Flags
518
%
96.0
4.0
100
%
22.9
Note. Patrolled beaches include both supervised and unsupervised bathing areas—in flags refers to theclosely supervised bathing area.
Dataset 1 : Estimated Peak-Bathing Period Immersions,Time-Period 2
Results from data collected in time-period 2 (2004-2005; 20 sampled days selectedover the 39 day sampling period) are presented in Figure 3 and Tables 6 and 7.Although based on relatively limited and purposefully-selected sampling days, thetime-period 2 estimates for peak-period water immersions were similar in patternand proportion to time-period 1 estimates. Total persons estimated for the 39-dayperiod were higher for time-period 2 (overall 11,429 vs. 10,089 bather immer-sions in time-period 1 at the peak-bathing period). It is not clear how much of theobserved differences resulted from sampling error or true differences in bathernumbers. Across the entire sampling frame, 57.4% of swimmers (i.e., excludingsurfers) bathed within the flags based on an estimated sample of 8383 (in time-period 1 this figure was estimated at 62.4%).
Dataset 2: Observed Water Exposure Profile Over a DailyPeriod, Time-Period 1
No bathers were observed at the four night spot counts. Total bather numbersare depicted in Figure 4. The distribution peaked at 1:00 p.m. with 771.0 bathersrecorded. Bather counts followed a steep rise leading to this peak time. Followingthe peak, the fall in bather counts was relatively gradual. The generally concavecurve pattern was marked by three minor peaks: at 8:30 a.m. (63.3), 3:00 p.m.(500.0), and 4:30 p.m. (365.5).

1200
800
400
200
• Not Patrol led• Patrolled
Hole 2$ Dtcemb«
11. Il 1 II» M » U » 14 If 24 2
Decaiilia MW ' 200?
Figure 3 — Estimated bather immersions at peak bathing period for patrolled (n = 3),unpatrolled (n = 17), and overall (n = 20) surf beaches for 20 selected days, time-period 2.Note. Patrolled beaches include both supervised and unsupervised bathing areas.
Table 6 Estimated Bather Immersions at Peak-Bathing Period Over39 Days, Time-Period 2
Bather immersions for 39 days
Total
Total per day
Mean
SD
SE
Median
Range
Per beach for 39 days
Mean
Per beach per day
Mean
Research Frame of 20 Consecutive Beaches
Patrolled(n = 3)
Unpatrolled(n = 17)
(based on sample size of 20 days)
8562
219.5
236.2
52.8
137.6
0-795
2853.8
73.2
2868
73.5
141.3
31.6
17.0
0-578
168.7
4.3
All Beaches(n = 20)
11,429
293.1
345.8
77.3
154.5
0-1195.3
571.4
14.7
Note. Patrolled beaches include both supervised and unsupervised bathing areas.
127

Table 7 Estimated Mean Bather Immersions at Peak Bathing Periodby In-Water Activity and Beach Type Over 39 Days (From a Sampleof 20 days), Time-Period 2
Bather immersions per beach
Patrolled
UnpatroUed
Total
Average swimmer immersions:Patrolled beaches only
Surfers
588
75
663
In Rags
1604
In-Water Activity
%
88.6
11.4100
%
70.8
Swimmers
2266
93
2359
Outside Flags
662
%
96.0
4.0
100
%
29.2
Note. Patrolled beaches include both supervised and unsupervised bathing areas—in flags refers to theclosely supervised bathing area.
Bather immersion
count
800
700
600
500
400
300
200
100 1.,1 Ulli II 1 ílTh.
Figure 4 — Observed water exposure profile over a daily period for 10 beach days, time-period 1.
128

Drowning Risk 129
DiscussionThis study developed and pilot tested a data collection method for obtaining validand generalizable measures of water exposure for a sample of surf bathers. Threekey outcomes support the cogency of the methodological development. Firstly, thereliability and accuracy of observed bather immersions counts were establishedby high and statistically significant correlations between these counts and corre-sponding interrater observation counts and video data counts. Secondly, similaritybetween bather immersion estimates from two discrete summer periods using dif-ferent sampling procedures, to a degree, validated the results. Thirdly, the methodof direct observation provided data from which bather water exposure over dailyperiods and across days could be estimated.
Systematic Bias in Observations
Although high count reliability was supported by the correlations, differencesbetween direct observation and hand-held video recording in high-use batherperiods indicate that exact agreement of the results between the two methods wasnot always obtained. This is not surprising. Thompson et al. (1998) used the term"detectability" for the probability of systematic bias introduced by this form of counterror. In the absence of exact agreement between measures, the extent of bias isuncertain. For such cases, Cochran (1977, p. 14) proposed that bias in the accuracyof the sampling estimate may be considered negligible where average error is lessthan 10% of the sample standard deviation (based on a normal distribution). Asthe mean score difference between direct observation and video recording (Table3) fell within this range, systematic bias from detectability was presumed to haveno significant effect on bather-immersion estimates.
Dataset 1 : Characteristics of Peak-Bathing Period WaterExposure
The distribution of bathers at the peak-bathing period (12:30 p.m.-3:3O p.m.) wascharacterized by a positively-skewed distribution (i.e., majority of counts clusteredaround low values and a long right hand tail (i.e., a few very high bather counts).This pattern is commonly found in count data of events. Such nonnormal (i.e.,skewed) distributions for bather immersions in both survey time-periods suggestthat mean estimates per beach, per day and per beach-day should be interpretedwith caution because the variability in bather immersions was affected by a varietyof variables such as weather, temperature, and day of week.
At the peak-bathing period, over 10,000 bathing episodes were estimatedto have occurred in the sampling frame (20 beaches over 39 days). Across all 20beaches each day, approximately 146 bathers were in the water at the peak-bathingtime, based on the median score for time-period 1 data (Table 4). Comparableresults were found for time-period 2. No drowning deaths were reported withinthe sampling frame (from data reported by Morgan et al., 2(X)8). It is thereforenot possible to estimate the sample's crude drowning risk from the study results,but by implication this rate would fall somewhere below 1 per 10,(XX) immersionsmeasured at the peak-bathing period.

130 Morgan and Ozanne-Smith
Dataset 2: Characteristics of Water Exposure ProfileOver a Daily Period
Over the daily period, the profile of bather numbers at half-hour intervals followeda predictable path. Bather numbers rose sharply after 10:00 a.m. until the 1:00 p.m.apex. The relatively smooth decline in bather numbers after 1:00 p.m. is assumeddue partially to beach visitors normally bathing more than once during their visitbefore afternoon departure (Morgan et al., 2009a). In addition, each count wasinfluenced by the relative number of beach arrivals and departures in the half hourperiod leading to it. Subsequent minor peaks (illustrated in Figure 4) at 8:30 a.m.,3:00 p.m. and 4:30 p.m. are likely to be explained respectively by visitor departuresfollowing a morning bathe and visitor arrivals after lunchtime and later after theworkday, when ultraviolet light is reduced, outweighing beach arrivals and depar-tures for that period immediately preceding the count.
Relationship Between Water Exposure Based on Immersionsand Drowning Risk
As stated earlier, the selection of immersion data to measure water exposure, andhence an estimation of drowning risk, necessarily excludes potential influenceson drowning risk captured by other measures such as bathing duration or distancefrom shore. Although they have definite limits to their precision, peak-bathingperiod immersions data do provide a foundation for developing even more precisedrowning risk estimates compared with those based on resident populations orself-reported data. For example, combining these data (dataset 1 ) with the recordeddaily bather immersion profile (dataset 2) specifies total bather exposure over a dayas a function of peak-bathing period exposure, following the method developed byDeacon and Kolstad (2000). This computation may then be combined with cor-responding bathing duration estimates to determine total drowning risk exposurefor a specified sample. Even so, the findings of this study based on immersionsonly have implications for drowning risk analysis and safety service resourcing.
Implications
For the 20 beaches over 39 days, three patrolled beaches together accounted forover two-thirds of bathers during the peak-bathing period. The findings indicatethe bathing frequency ratio of a patrolled beach to an unpatrolled beach was 17:1in time-period 1 (2003-2004) and 20:1 in time-period 2 (2004-2005). If estimatedvisitation from national park data cited in the method section (Zanon, 2002) isaccurate, then it appears that visitors to patrolled beaches are more likely to bathecompared with those visiting unpatrolled beaches. As noted earlier, patrolled beachbathers may bathe within or outside the lifesaver supervised zones (i.e., betweenthe flags).
Across Australia, unpatrolled beaches comprise 93% of accessible beaches(Morgan, 2003). In the current study, unpatrolled beaches made up 85% of thesample. Assuming this study's results generalize to national differences in bathingpatterns between patrolled and unpatrolled beaches, then approximately 75% ofAustralian surf bathers use a patrolled beach, though not necessarily in a closely

Drowning Risk 131
supervised area. It has been reported that 69% of surf bather drownings occur at apatrolled beach (Morgan, 2011 ). This comparison indicates that the crude drowningrate between patrolled and unpatrolled surf beaches is approximately proportionalto crude water exposure patterns (based on bather immersions), suggesting thatsimilar drowning risk operates at both beach types.
Results from this study demonstrate a significant proportion of patrolledbeach bathers presumably are protected from drowning by bathing in the lifesaversupervised zones. For swimmers only including waders in time-period 1 on allbeaches, the majority (77%) were observed within the lifesaver supervised zones(between the flags) at the peak-bathing period. Comparable results were found forthe time-period 2 data collection. Morgan et al. (2008) reported just one out of 129surf bather drowning deaths over a four-year period in Australia was recorded tohave occurred between the flags. Fenner, Harrison, Williamson, and Williamson's(1995) statistical study of surf lifesaver resuscitations—for the Australian state ofQueensland from 1972 to 1993—demonstrated that the likelihood of successfulresuscitation increased closer to the lifesaver supervised zone. Both studies sup-port the effectiveness of organized supervision as a protective factor to preventsurf drowning
From the study results, it is hypothesized that bathers outside the lifesaversupervised zones at patrolled beaches have a higher crude risk of drowning relativeto both bathers between the nags on patrolled beaches and bathers at unpatrolledbeaches. This hypothesis requires further assessment but if supported then a possibleexplanation may involve differences in perceptual or psychological determinantsof bathing intention and behaviors for bathers in lifesaver supervised zones whencompared with other bather groups at patrolled beaches (Sherker et al., 2010; White& Hyde, 2010). For example, bathers outside lifesaver supervised zones mindfulthat a beach is periodieally patrolled may believe it to be safer even though a patrolis not proximate to the bathing location.
A minority of the bathers (e.g., 14% in period 1 based on totals reported inTable 5) used surf equipment including surfboards or body-boards. This estimationof proportional crude water exposure corresponds approximately with drowningdeath data, where 16% of recreational surf bather fatalities were associated withsurf craft, suggesting that floatation devices (e.g., surfboards) do not offer drowningproteetion (Morgan et al., 2008). Further investigation is required because surferson average may be exposed to higher drowning risk conditions (e.g., larger waves,greater distance from shore) and over longer durations compared with swimmersor waders though this may be compensated by greater aquatic skills and experi-ence in surf.
Safety Service Resourcing at Surf Beaches
The documented substantial spatial and temporal variation in bather numbers makesobvious the difficulties faced by authorities when planning resource requirements fororganized bather supervision. It follows that identification of observable factors thatpredict bather exposure from data comparable to that collected in this study wouldassist management of supervision resources. For example, surf lifesaver outpostsin radio contact with patrolled zones may be positioned at unpatrolled beaches fordays of predicted high bathing. Nevertheless, the spread of patrons across beaches

132 Morgan and Ozanne-Smith
suggests that it is neither practical nor conceivably possible to supervise all bathersusing coastal surf beaches. This finding amplifies the importance of educationalawareness and skill training to make surf bathing safer for unsupervised bathers orto discourage bathers from entering the water outside lifesaver supervised zones.
This study found that approximately two out of every five swimmers did notbathe within a lifesaver supervised zones at the peak-bathing period (time-period1-42.6% and time-period 2-37.6% of the samples). This finding corroborates arandom survey (via telephone) of 1,200 adults by Kellogg's and Newspoll (2000),which found that 61% of Australian beachgoers report always swimming betweenthe flags (lifesaver supervised zones). Lifesaver supervised zones may play animportant role where novice bathers learn necessary surf-related skills in a super-vised environment. This drowning prevention strategy should be promoted as asuitable location for surf skill training and enhancement.
Limitations
The method used to collect dataset 1 was based on random sampling with stratifica-tion to increase precision. It is not possible to determine the accuracy of estimateswithout comparison with census counts (Thompson et al., 1998). Nevertheless,differences in daily point count sampling procedures between strata (three samplesof 17 unpatrolled beaches and two samples of three patrolled beaches per samplingday) lend relatively greater confidence to the accuracy of the patrolled beach batherestimates. The method used to derive a daily profile was based on a limited (dataset2; A = 10) and purposefully-selected sample with associated unknown bias includingthe potential for double counting immersions lasting over 30 min. Moreover, themethod of estimation used here (bathers as the unit of analysis rather than using aratio of bathers per beach-day) gave weight to the bathing profile on high use days.It may not accurately represent a profile of average variation.
A key limitation, associated with generalizability, is the study's narrowly-defined sample. A case may be made for the target sample being representativeof Victorian surf bathers over summer but it is unknown whether this would becomparable to surf bathing samples located elsewhere or for other seasons. It isclear from the study that point exposure to water may be estimated to determine asample's crude drowning risk (e.g., drowning rate per 100,000 bather immersionsat the peak-bathing period) but measuring this behavior at the population level tomatch national drowning incidents (i.e., the population of Australian surf bathersfor a specified time-period) would require significant research effort and resources.
The study assumed estimated drowning risk based on exposure to immersionsfor reasons of practicality and simplicity. That is, all bathers immersed were pre-sumed to carry equal risk regardless of factors such as weather and water condi-tions, equipment, distance from shore, bathing duration, and surf experience. Atthe individual level immersions may not be a true reflection of drowning risk butat the group and sample level this provides a component in the search for a moreprecise measure compared with that currently available. Future studies may accountfor known influences to specify a more precise level of drowning risk faced by surfbathers (Morgan & Ozanne-Smith, 2012).

Drowning Risk 133
ConclusionThis study provides a method to observe and estimate point exposure to waterby recreational bathers. Employing this method across larger research samplingframes will supply more specific information on bathing exposure and estimates ofdrowning risk (by application of comparative or contemporaneous fatal and nonfataldrowning data) and also allow evaluation of supervision resourcing. For high userecreation settings, technologically-sophisticated methods may be required (e.g.,use of high image quality cameras). For example, high resolution surf cameras nowlocated at beaches may provide a tool for measurement of water exposure (samplesurf cam footage can be found at: http://www.coastalwatch.com) with technicaladvances underway (Green et al., 2006).
Acknowledgments
Required national park access was provided by the Department of Sustainability and Envi-ronment Research Permit 10002639. The study was completed as part of the first author'sPhD candidature and data collection was funded by the Monash University AccidentResearch Centre (located within the Monash Injury Research Institute). The authors wishto acknowledge the contribution made by the late Professor Tom Triggs in developing andrefining this study.
ReferencesAustralian Bureau of Statistics. (2007). State and Regional Indicators, Victoria. March
Quarter 2007 (cat. no.: 1367.2). Canberra: ABS.Cochran, W.G. (1977). Sampling Techniques (3rd ed.). New York: Wiley.Custominsight (2007). Survey Random Sample Calculator [webpage]. Retrieved June 26
2007 from http://www.custominsight.coiTi/articles/random-sample-calculator.asp.Deacon, R.T., & Kolstad, CD. (2000). Valuing beach recreation lost in environmental
accidents. Journal of Water Resources Planning and Management, 126(6), 374-381.doi: 10.1061 /(ASCE)0733-9496(2000) 126:6(374)
Fenner, PJ., Harrison, S.L., Williamson, J.A., & Williamson, B.D. (1995). Success of surflifesaving resuscitations in Queensland, 1973-1992. The Medical Journal of Australia,163(\ 1-12), 580-583. PubMed
Green, S., Blumenstein, M., Browne, M., & Tomlinson, R. (2006). The detection of personsin cluttered beach scenes using digital video imagery and neural network-based clas-sification. International Journal of Computational Intelligence and Applications, 6(2),149-160. doi : 10.1142/S1469026806001927
Harada, S.Y., Goto, R.S., & Nathanson, A.T. (2011). Analysis of Lifeguard-recorded data atHanauma Bay, Hawaii. Wilderness & Environmental Medicine, 22(1), 72-76. PubMeddoi:10.1016/j.wem.2010.I0.0I2
Hayashi, T, Ago, K., Ago, M., & Ogata, M. (2010). Bath-related deaths in Kagoshima,the southwest part of Japan. Medicine, Science, and the Law, 50(1), 11-14. PubMeddoi: 10.1258/msl.2009.009002
International Life Saving Federation. (2012). Drowning Facts and Figures [webpage].Retrieved December 7 2012 from http://ilsf.org/drowning/facts.

134 Morgan and Ozanne-Smith
Kellogg's & Newspoll. (2000). National Surf Safety Audit. Sydney: Hausmann Commu-nications.
Mercer, D. ( 1972). Beach usage in the Melbourne region. The Australian Geographer, 12(2),123-139. doi : 10.1080/00049187208702621
McCool, J.P., Moran, K., Ameratunga, S., & Robinson, E. (2008). New Zealand beachgoers'swimming behaviors, swimming abilities, and perception of drowning risk. InternationalJournal of Aquatic Research and Education, /(I). 7-15.
Mitchell, R.J., Williamson, A.M., & Olivier, J. (2010). Estimates of drowning morbidity andmortality adjusted for exposure to risk. Injury Prevention, 16(4), 261-266. PubMeddoi:10.1136/ip.2009.024307
Morgan, D. (2003). Unintentional drowning at Australian surf beaches: Problem definitionand proposed reduction strategies (Working Paper 35/03). Retrieved from http://www.buseco.monash.edu.au/mgt/research/working-papers
Morgan, D. (2011 ). An investigation of factors associated with surf bather drowning: iden-tification, surveillance, risk contribution, and risk analysis (Unpublished PhD thesis).Monash University, Melbourne, Australia.
Morgan, D., & Ozanne-Smith, J. (2012). Surf Bather Drowning Risk and Exposure-RelatedFactors Identified by an Expert Panel. International Journal of Aquatic Research andEducation, 6, 336-349.
Morgan, D., Ozanne-Smith, J., & Triggs, T. (2008). Descriptive epidemiology of drowningdeaths in a surf beach swimmer and surfer population. Injury Prevention, 14, 62-65.PubMed doi: 10.1136/ip.2006.013508
Morgan, D., Ozanne-Smith, J., & Triggs, T. (2009a). Self-reported water and drowning riskexposureatsurf beaches. Australian and New Zealand Journal of Public Health, 33(2),180-188. PubMed doi:10.111 l/j.l753-64O5.20O9.0O367.x
Morgan, D., Ozanne-Smith, J., & Triggs, T. (2009b). Direct observation measurement ofdrowning risk exposure for surf beach bathers. Journal of Science and Medicine inSport, 12(4), 451-462. PubMed doi: 10.1016/j.jsams.2008.04.003
Pearn, J., & Nixon, J. ( 1977). Are swimming pools becoming more dangerous? The MedicalJournal of Australia, 2(21), 702-704. PubMed
Peden, M., Oyegbite, K., Ozanne-Smith, J., Hyder, A.A., & Branche, C. Rahman. A.K.M.F,Rivara, F., & Bartolomeos, K. (Eds.) (2008). World report on child injury prevention.Geneva: World Health Organization /UNICEF.
Pless, I.B., & Hagel, B.E. (2005). Injury prevention: A glossary of terms. Journal of Epidemi-ology and Community Health, 59(3), 182-185. PubMed doi: 10.1136/jech.2OO3.O17715
Quan, L., & Cummings, P. (2003). Characteristics of drowning by different age groups.Injury Prevention, 9(2), 163-168. PubMed doi: 10.1136/ip.9.2.163
Robertson, L.S. (2007). Injury epidemiology: Research and control strategies (3rd ed.). NewYork: Oxford University Press.
Rosner, B. (2006). Fundamentals of biostatistics (6th ed.). Belmont, CA: Thomson.Sherker, S., Williamson, A., Hatfield, J., Brander, R., & Hayen, A. (2010). Beachgoer's
beliefs and behaviours in relation to beach flags and rip currents. Accident Analysisand Prevention, 42(6), 1785-1804. PubMed doi: 10.1016/j.aap.2010.04.020
Short, A.D. (1996). Beaches of the Victorian coast and Port Phillip Bay: A guide to theirnature, characteristics, surf and safety. Sydney: Coastal Studies Unit of the Universityof Sydney.
Surf Life Saving Australia. (2012). Beachsafe [webpage]. Retrieved December 6 2012 fromhttp://sls.com.au/beach-safety.
Surf Life Saving Australia. (2013). 2012-2013 Surf Life Saving Queensland Patrol OperationsManual. Retrieved February 23 2013 from http://www.lifesaving.com.au.
Thompson, W.L., White, G.C., & Gowan, C. (1998). Monitoring vertebrate populations.New York: Academic Press.

Drowning Risk 135
Urbaniak, G.C., & Pious, S. (2003). Research Randomiser [online calculator]. Social Psy-chology Network. Retrieved August 14 2003 from http://www.randomizer.org/.
White, K.M., & Hyde, M.K. (2010). Swimming between the flags: A preliminary explora-tion of the influences on Australians' intentions to swim between the flags at patrolledbeaches. Accident; Analysis and Prevention, 42(6), 1831-1838. PubMed doi: 10.1016/j.aap.2010.05.004
Zanon, D. (2002). Mornington Peninsula National Paric visitor vehicle monitoring project.Melbourne, Australia: Parks Victoria.

Copyright of International Journal of Aquatic Research & Education is the property of Human Kinetics
Publishers, Inc. and its content may not be copied or emailed to multiple sites or posted to a listserv without the
copyright holder's express written permission. However, users may print, download, or email articles for
individual use.