development and use of energy efficiency indicators 12 1 000 2 000 3 000 4 000 5 000 6 000) l) steel...
TRANSCRIPT

© OECD/IEA - 2010
Development and Use of Energy Efficiency Indicators
The IEA indicator approach
International Round Table on Energy Efficiency Metrics and National Energy Efficiency Assessment in Developing
Countries3 June 2010, Washington, DC
Nathalie TrudeauEnergy Analyst, Energy Technology Policy Division

© OECD/IEA - 2010
TOWARDS
A MORE ENERGY
EFFICIENT FUTURE
Applying indicators to
enhance energy
policy
Overview of IEA Indicators Work
Establish a harmonised framework for data collection and analysis
Harmonisation => Comparability
Comparability => Understanding of global trends and drivers
Produce meaningful cross-country analysis to provide guidance to policy-makers on:
Underlying drivers (economic activity & structure, income, prices...)
Trends in energy use and CO2 emissions
Energy efficiency opportunities and progress
Policy effectiveness
© OECD/IEA - 2010
TOWARDS
A MORE ENERGY
EFFICIENT FUTURE
Applying indicators to
enhance energy
policy
The Early Days….
Data for only 11 IEA countries
Long lags in data availability
Minimal country involvement
Low profile in IEA and non-IEA member countries
Little political support

© OECD/IEA - 2010
TOWARDS
A MORE ENERGY
EFFICIENT FUTURE
Applying indicators to
enhance energy
policy
From 2000….Growing interest!
Increase in countries to 14
Still long lags in data availability
Countries more involved, links with ODYSSEE
30 years is IEA best-seller
Growing political interest
© OECD/IEA - 2010
TOWARDS
A MORE ENERGY
EFFICIENT FUTURE
Applying indicators to
enhance energy
policy
Now….Everyone’s a fan
Data for 22 IEA countries, start to include others
Lags in data availability reduced
Significant country involvement and strong co-operation with ODYSSEE
Key IEA activity –many reports
Significant political support at highest levels
© OECD/IEA - 2010
TOWARDS
A MORE ENERGY
EFFICIENT FUTURE
Applying indicators to
enhance energy
policy
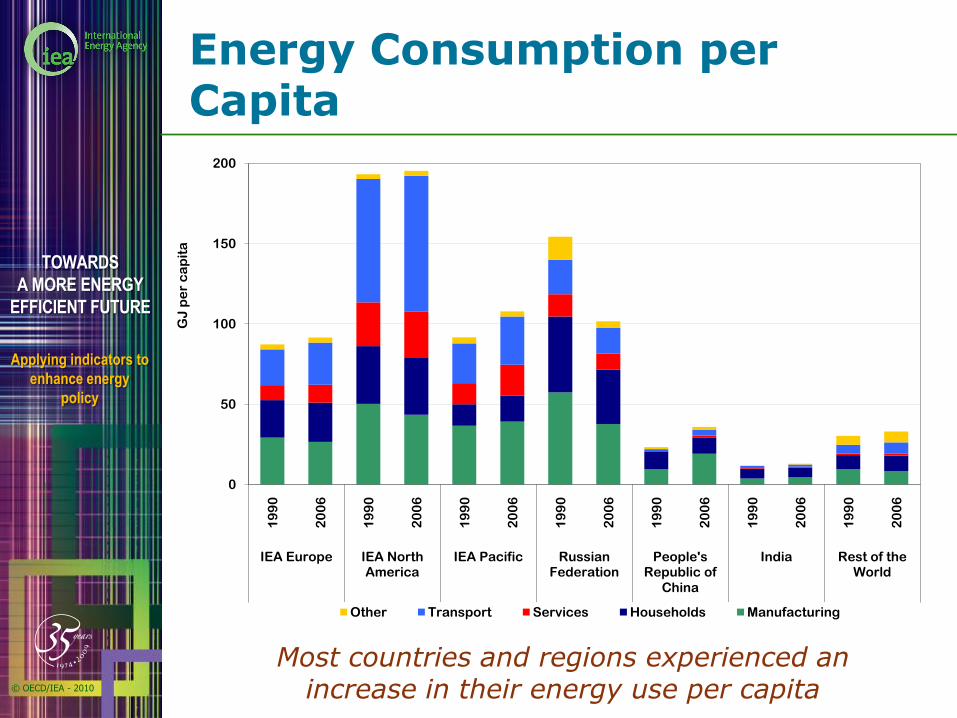
Energy Consumption per Capita
0
50
100
150
200
19
90
20
06
19
90
20
06
19
90
20
06
19
90
20
06
19
90
20
06
19
90
20
06
19
90
20
06
IEA Europe IEA North America
IEA Pacific Russian Federation
People's Republic of
China
India Rest of the World
GJ
pe
r c
ap
ita
Other Transport Services Households Manufacturing
Most countries and regions experienced an increase in their energy use per capita

© OECD/IEA - 2010
TOWARDS
A MORE ENERGY
EFFICIENT FUTURE
Applying indicators to
enhance energy
policy
Energy Consumption per Unit of GDP
30
40
50
60
70
80
90
100
110
120
1990 1994 1998 2002 2006
Ind
ex (
1990=
100)
IEA Europe IEA North America IEA Pacific
Russian Federation People's Republic of China India
Rest of the world
Index for 1990 to 2006
All countries and regions experienced a decrease in their energy use per GDP

© OECD/IEA - 2010
TOWARDS
A MORE ENERGY
EFFICIENT FUTURE
Applying indicators to
enhance energy
policy
Energy Efficiency Indicators?
They are tools, based on detailed statistics of end-use energy consumption and activity, to analyse energy use and efficiency trends
They examine impacts of economic activity and structure, income, prices, policies, etc
They support national policy-making and are used to shape priorities for future action and to monitor progress
They can also be used for estimating CO2 savings, so a key element of environment policy tool

© OECD/IEA - 2010
TOWARDS
A MORE ENERGY
EFFICIENT FUTURE
Applying indicators to
enhance energy
policy
IEA country coverage by sector and by reporting years
0
4
8
12
16
20
24
28
Manufacturing Households Services Passenger transport
Freight transport
Nu
mb
er
of
co
un
trie
s
2004 2007 2008 2009

© OECD/IEA - 2010
TOWARDS
A MORE ENERGY
EFFICIENT FUTURE
Applying indicators to
enhance energy
policy
Highlights energy efficiency and allows progress to be tracked at the country or regional/global level
Electricity
OtherCoal
Natural gas
Oil
Savings 63%
0
20
40
60
80
100
120
140
160
180E
xajo
ule
s
Hypothetical energy use without
energy efficiency improvements
0.0%
0.5%
1.0%
1.5%
2.0%
1973-1990 1990-2006
Av
era
ge a
nn
ual
perc
en
t ch
an
ge
Energy consumption Energy efficiency improvements
Actual energy use
Policy changes in response to the oil price shocks did more to restrain growth in energy consumption than
policies implemented since the 1990s

© OECD/IEA - 2010
TOWARDS
A MORE ENERGY
EFFICIENT FUTURE
Applying indicators to
enhance energy
policy
Explains trends and
differences between countries
Contribution of energy efficiency and structural effects to reductions in
energy use per unit of GDP
-2.5%
-2.0%
-1.5%
-1.0%
-0.5%
0.0%
0.5%
Austr
alia
Austr
ia
Canada
Denm
ark
Fin
land
Fra
nce
Germ
any
Italy
Japan
Neth
erlands
New
Zeala
nd
Norw
ay
Spain
Sw
eden
Sw
itzerlan
d
United K
ingdom
United S
tate
s
IEA
17
Av
era
ge a
nn
ual
perc
en
t ch
an
ge
Energy services per GDP Intensity effect Energy per GDP
About two-third of the decline in energy per GDP can be attributed to improvement in intensity
© OECD/IEA - 2010
TOWARDS
A MORE ENERGY
EFFICIENT FUTURE
Applying indicators to
enhance energy
policy
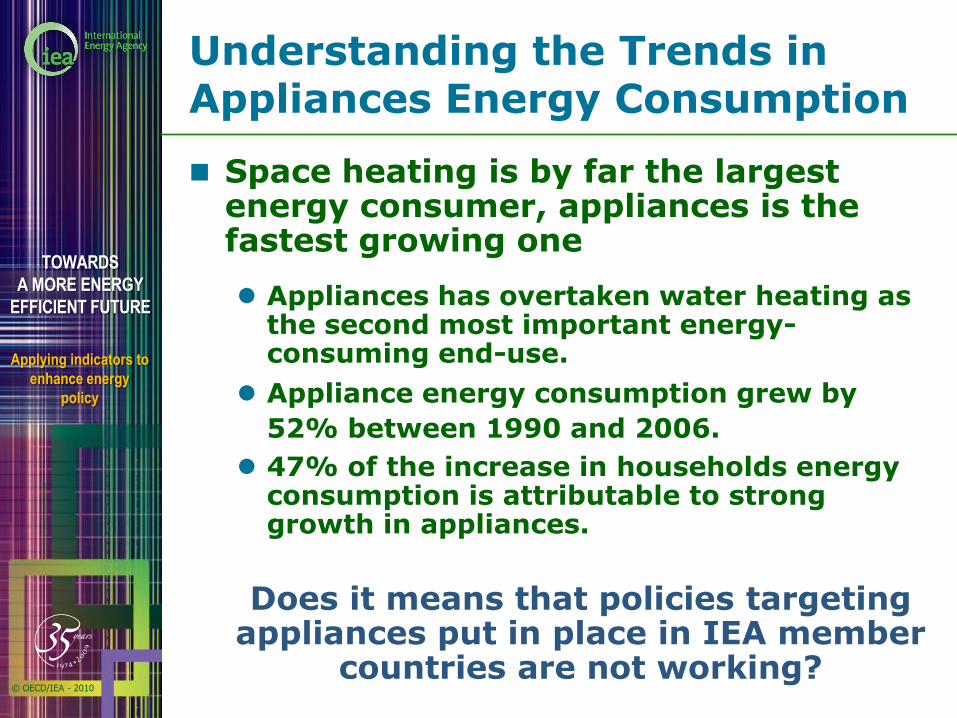
Understanding the Trends in Appliances Energy Consumption
Space heating is by far the largest energy consumer, appliances is the fastest growing one
Appliances has overtaken water heating as the second most important energy-consuming end-use.
Appliance energy consumption grew by
52% between 1990 and 2006.
47% of the increase in households energy consumption is attributable to strong growth in appliances.
Does it means that policies targeting appliances put in place in IEA member
countries are not working?

© OECD/IEA - 2010
TOWARDS
A MORE ENERGY
EFFICIENT FUTURE
Applying indicators to
enhance energy
policy
More detailed information helped understanding major trends in energy consumption
0.0
0.5
1.0
1.5
2.0
2.5
3.0
3.5
4.0
4.5E
xajo
ule
s
Refrigerators & freezers Dishwashers Clothes washers
Televisions Other appliances
Energy consumption
from large appliances
decreased by 11%
The growth in total
appliances energy
consumption was
entirely due to the
increase in small
appliances… but little
detailed information
exists for this category

© OECD/IEA - 2010
TOWARDS
A MORE ENERGY
EFFICIENT FUTURE
Applying indicators to
enhance energy
policy
For large appliances, more information can be obtain by coupling energy consumption data with stock data
0
20
40
60
80
100
120
140
1990 Households effect
Ownership effect
Energy efficiency
effect
2006
Peta
jou
les
Changes in energy consumption between 1990 and
2006 were attributable to…
For dishwashers, the main driver of energy
consumption is the ownership effect…

© OECD/IEA - 2010
TOWARDS
A MORE ENERGY
EFFICIENT FUTURE
Applying indicators to
enhance energy
policy
Identifies potentials for further savings using BAT…
Energy Savings from Introducing Best Available Technology
in the Iron and Steel Sector
4.0
6.1
8.6
5.45.7
6.0
3.73.5
2.02.3
1.3 1.3
2.0
0
2
4
6
8
10
12
1 000
2 000
3 000
4 000
5 000
6 000
Sav
ing
s p
ote
nti
al (G
J/t
ste
el)
En
erg
y s
av
ing
s p
ote
nti
al
(PJ/y
r)
Steel finishing improvements
Efficiency power generation from BF gas
Switch from OHF to BOF
Increased BOF gas recovery
Blast furnace improvements
COG recovery
CDQ (or advanced wet quenching)
Specific savings potential (GJ/t steel)
About half the reduction potential is in China, but intensity improvements potential are higher in Ukraine
© OECD/IEA - 2010
TOWARDS
A MORE ENERGY
EFFICIENT FUTURE
Applying indicators to
enhance energy
policy
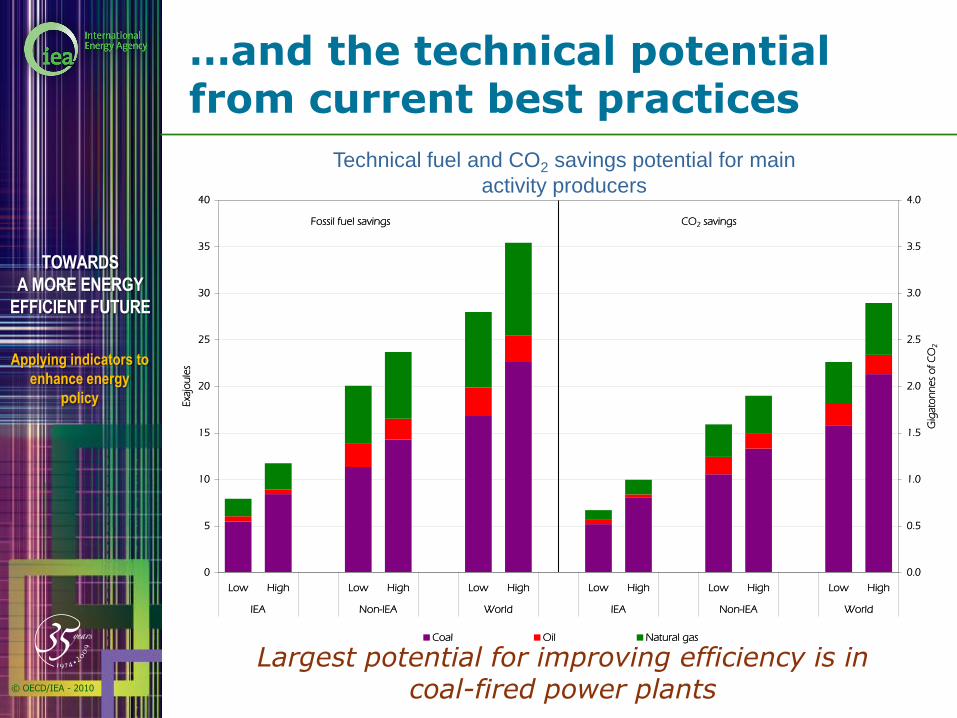
…and the technical potential from current best practices
0
5
10
15
20
25
30
35
40
Low High Low High Low High Low High Low High Low High
IEA Non-IEA World IEA Non-IEA World
Exa
jou
les
0.0
0.5
1.0
1.5
2.0
2.5
3.0
3.5
4.0
Gig
ato
nn
es
of
CO
2
Coal Oil Natural gas
Fossil fuel savings CO2 savings
Technical fuel and CO2 savings potential for main
activity producers
Largest potential for improving efficiency is in coal-fired power plants

© OECD/IEA - 2010
TOWARDS
A MORE ENERGY
EFFICIENT FUTURE
Applying indicators to
enhance energy
policy
Key Conclusions and Policy Messages from Indicators Work
Indicators are a powerful tool for analysing trends in energy use, and calculating potentials for further savings
Results show the important role of energy efficiency in shaping patterns of energy use and CO2 emissions in countries, but gains are often offset by other factors
Large potential for further energy and CO2
savings in many industries and power generation (and other sectors)
Urgent need for governments to enhance framework for monitoring end-use energy consumption and address the gaps in available statistical data

© OECD/IEA - 2010
TOWARDS
A MORE ENERGY
EFFICIENT FUTURE
Applying indicators to
enhance energy
policy
Progress has been achieved through co-operation
Member and non-Member countries
ODYSSEE network
APEC
OLADE
Industrial associations
WBCSD
ISO/IEC
World Bank
United Nations
Asia Pacific Partnership
© OECD/IEA - 2010
TOWARDS
A MORE ENERGY
EFFICIENT FUTURE
Applying indicators to
enhance energy
policy
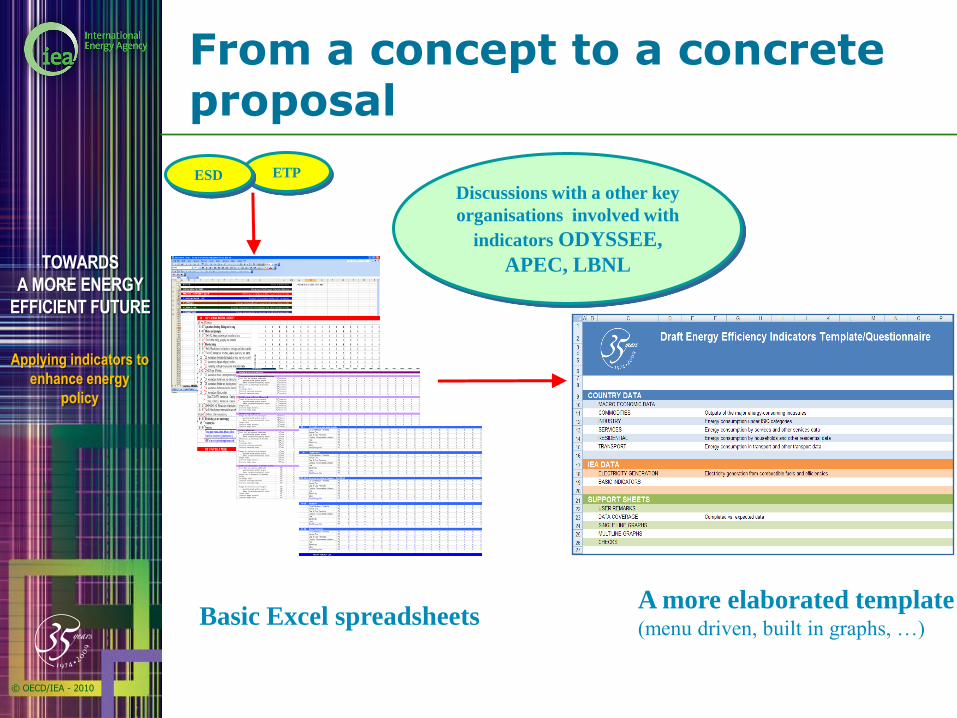
From a concept to a concrete proposal
Basic Excel spreadsheetsA more elaborated template(menu driven, built in graphs, …)
Discussions with a other key
organisations involved with
indicators ODYSSEE,
APEC, LBNL
ETPESD

© OECD/IEA - 2010
TOWARDS
A MORE ENERGY
EFFICIENT FUTURE
Applying indicators to
enhance energy
policy
An electronic manual is under development

© OECD/IEA - 2010
TOWARDS
A MORE ENERGY
EFFICIENT FUTURE
Applying indicators to
enhance energy
policy
Continued Political Support
Support was also expressed by the Ministers at the IEA’s Ministerial meeting in October 2009
Invited the IEA to strengthen its work on energy efficiency and renewable energy statistics and indicators.
Announced they will provide, annually, end-use data and statistics needed for developing energy efficiency indicators based on the template developed by the IEA in concert with international experts.

© OECD/IEA - 2010
TOWARDS
A MORE ENERGY
EFFICIENT FUTURE
Applying indicators to
enhance energy
policy
Future Plans – to be released in 2011-2012
Energy efficiency indicators report (March 2011)
Manual on Statistics for Energy Efficiency Indicators Similar to the IEA Statistics Manual Will provide guidance on what data to
collect Will try to give guidelines and examples
based on real cases on how to collect those data
Will give to the reader or user a “catalogue of methodologies” for collecting the data necessary to build the desired indicator
Manual on Methodologies for Energy Efficiency Indicators Will be a complement of the Energy
Efficiency Indicators Statistics Manual

© OECD/IEA - 2010
TOWARDS
A MORE ENERGY
EFFICIENT FUTURE
Applying indicators to
enhance energy
policy
Future Plans
Improvement of underlying data and information sharing
Formalize the annual data reporting to support indicators
Develop better indicator methodologies
Analyse energy efficiency trends and reduction potentials to support policy-making
Enhance collaboration and outreach

© OECD/IEA - 2010
TOWARDS
A MORE ENERGY
EFFICIENT FUTURE
Applying indicators to
enhance energy
policy
Thank you !