development and validation of a composite endpoint as a ... · development and validation of a...
TRANSCRIPT

Development and validation of a composite endpoint as
a quality indicator in elderly care
Cynthia S. Hofman

The work described in this thesis was funded by the Dutch National Care for the Elderly Programme, coordinated and sponsored by ZonMw, Organization for Health Research and Development, The Netherlands (grant number 60-6190098-302).
Financial support for the publication and distribution of this thesis was kindly provided by the Department of Geriatric Medicine, Radboud university medical center and Vilans, Centre of Expertise on Long-Term Care.
ISBN
978-90-9029698-2
Design/lay-out
Promotie In Zicht, Arnhem, the Netherlands
Ipskamp Printing, Enschede, the Netherlands
2016 Cynthia Sabrina Hofman
All rights reserved. No part of this thesis may be reproduced or transmitted in any form or by any means, electronic or mechanical, including photocopy, recording or otherwise, without prior written permission of copyright owners or the author.
Proefschrift
ter verkrijging van de graad van doctoraan de Radboud Universiteit Nijmegen
op gezag van de Rector Magnificus,volgens besluit van het college van decanen
in het openbaar te verdedigen op dinsdag 31 mei 2016om 12:00 uur precies
door
Cynthia Sabrina Hofmangeboren op 9 juni 1981
te Bergen op Zoom
Development and validation of a composite endpoint as
a quality indicator in elderly care

PromotorProf. dr. M.G.M. Olde Rikkert
CopromotorenDr. R.J.F. MelisDr. A.R.T. Donders
Manuscriptcommissie Prof. dr. G. Westert (voorzitter)Prof. dr. P.L.C.M. van RielProf. dr. A.P. Nieboer (Erasmus Universiteit Rotterdam)

Doctoral Thesis
To obtain the degree of doctorfrom Radboud University Nijmegen
on the authority of the Rector Magnificus,According to the decision of the Council of Deansto be defended in public on Tuesday 31 May 2016
at 12:00 hours
by
Cynthia Sabrina HofmanBorn on June 9, 1981in Bergen op Zoom
Development and validation of a composite endpoint as
a quality indicator in elderly care

SupervisorProf. dr. M.G.M. Olde Rikkert
Co-supervisorsDr. R.J.F. MelisDr. A.R.T. Donders
Doctoral Thesis Committee Prof. G. Westert (chair)Prof. P.L.C.M. van RielProf. A.P. Nieboer (Erasmus University Rotterdam)

Contents
Part 1 Introduction 9
Chapter 1 General introduction and outline 11
Part 2 Development of TOPICS-CEP 23
Chapter 2 Establishing TOPICS-CEP; The health state preferences of older persons and informal caregivers
25
Chapter 3 Adjusting TOPICS-CEP; The influence of rater characteristics on TOPICS-CEP’s preference weights
43
Part 3 Relevance of TOPICS-CEP 59
Chapter 4 Development of a method to compare one self-assessment versus multiple peer-assessments
61
Chapter 5 Comparing self-assessment versus peer-assessments 73
Chapter 6 Comparing health state preferences of older persons and healthcare professionals
81
Part 4 Psychometric properties of TOPICS-CEP 101
Chapter 7 Validation of TOPICS-CEP 103
Part 5 Summary and Discussion 121
Chapter 8 Summary and general discussion 123
Chapter 9 Nederlandse samenvatting | Dutch Summary 149
Part 6 Supplementary 159
Dankwoord | Acknowledgements 161Curriculum Vitae 167Curriculum Vitae in Dutch 170Publications 173


Part 1General introduction


Chapter 1General introduction and outline


13
GENERAL INTRODUCTION AND OUTLINE
11.1 Background
The mean life expectancy of the Dutch population has increased from 71 to 81 years over the past fifty years. The proportion of people aged 65 years or over in the Netherlands has increased from 771 thousand in 1950, representing 8% of the Dutch population, to 3 million (18%) in 2015, and is expected to reach 4.5 million (26%) within the next 20 years.1
The aging population has led to an increase of healthcare delivery, as older patients are more likely to suffer from multiple diseases, take more medications, undergo more procedures, and use more healthcare than younger patients. Over the next few decades the number and diversity of older people with complex healthcare needs will increase even further and will place unprecedented demands on aging services and our entire healthcare system.
To improve care, quality of life, and self-reliance among older persons, the Dutch Ministry of Health, Welfare, and Sport commissioned the National Care for the Elderly Programme.2 This programme funded over 60 research and implementation projects as well as the development of The Older Persons and Informal Caregivers Minimum Data Set (TOPICS-MDS). As part of TOPICS-MDS initiative, a uniform dataset measuring key outcomes in health, wellbeing, and health services utilization was created and administered to all older persons and caregivers participating in these studies.3
In this thesis, we describe research project funded by the National Care for the Elderly Programme, the Older People’s Relevant Outcome of Care Score (OPROCS) project which aimed to develop and validate a preference-weighted composite endpoint (CEP) for TOPICS-MDS (henceforth referred to as TOPICS-CEP) as an indicator for value in healthcare.
1.2 Quality in healthcare
In relation to healthcare there are many definitions of quality used. The Institute of Medicine (IOM) has proposed a definition that largely captures the features of many other definitions and received wide acceptance.
“Quality of care is the degree to which health services for individuals and populations increase the likelihood of desired health outcomes and are consistent with current professional knowledge”.4
14
CHAPTER 1
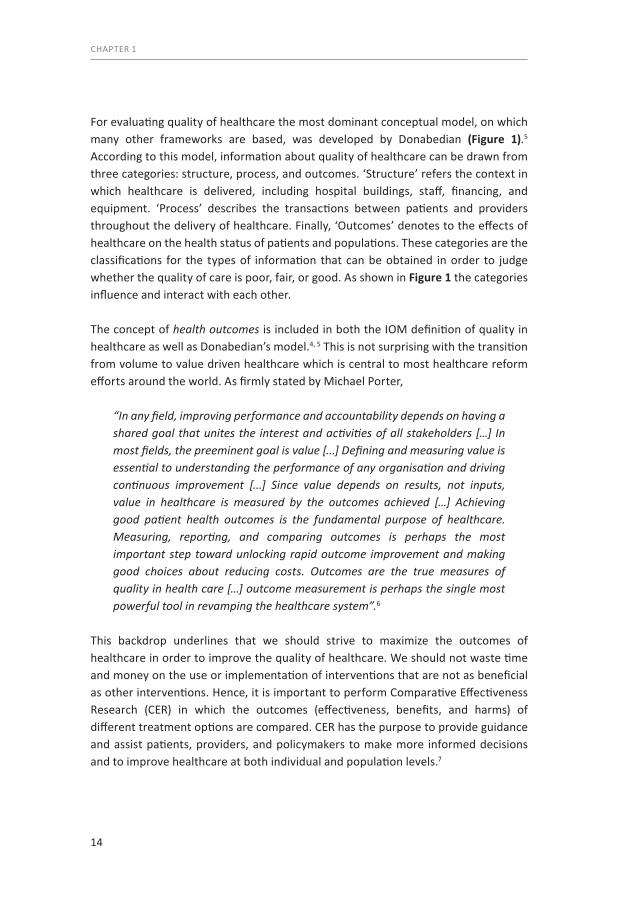
For evaluating quality of healthcare the most dominant conceptual model, on which many other frameworks are based, was developed by Donabedian (Figure 1).5 According to this model, information about quality of healthcare can be drawn from three categories: structure, process, and outcomes. ‘Structure’ refers the context in which healthcare is delivered, including hospital buildings, staff, financing, and equipment. ‘Process’ describes the transactions between patients and providers throughout the delivery of healthcare. Finally, ‘Outcomes’ denotes to the effects of healthcare on the health status of patients and populations. These categories are the classifications for the types of information that can be obtained in order to judge whether the quality of care is poor, fair, or good. As shown in Figure 1 the categories influence and interact with each other.
The concept of health outcomes is included in both the IOM definition of quality in healthcare as well as Donabedian’s model.4, 5 This is not surprising with the transition from volume to value driven healthcare which is central to most healthcare reform efforts around the world. As firmly stated by Michael Porter,
“In any field, improving performance and accountability depends on having a shared goal that unites the interest and activities of all stakeholders […] In most fields, the preeminent goal is value [...] Defining and measuring value is essential to understanding the performance of any organisation and driving continuous improvement [...] Since value depends on results, not inputs, value in healthcare is measured by the outcomes achieved […] Achieving good patient health outcomes is the fundamental purpose of healthcare. Measuring, reporting, and comparing outcomes is perhaps the most important step toward unlocking rapid outcome improvement and making good choices about reducing costs. Outcomes are the true measures of quality in health care […] outcome measurement is perhaps the single most powerful tool in revamping the healthcare system”.6
This backdrop underlines that we should strive to maximize the outcomes of healthcare in order to improve the quality of healthcare. We should not waste time and money on the use or implementation of interventions that are not as beneficial as other interventions. Hence, it is important to perform Comparative Effectiveness Research (CER) in which the outcomes (effectiveness, benefits, and harms) of different treatment options are compared. CER has the purpose to provide guidance and assist patients, providers, and policymakers to make more informed decisions and to improve healthcare at both individual and population levels.7

15
GENERAL INTRODUCTION AND OUTLINE
1
1.3 Measuring Outcomes in Healthcare
Administrative data can be a powerful source to follow patients’ paths through the healthcare system over time. This allows a focus on both costs as well as outcomes, such as death, (re)admissions, complications. Yet, the patient reported outcome measure (PROM) is a truly patient-centred data source. PROMs assess the status of a patient’s health condition which comes directly from the patient without interpretation of the patient’s response by a clinician or anyone else. It builds on the idea that the outcome, as experienced by the patient, is the ‘gold standard’ by which interventions and health services have to be judged. PROMs have been around for decades and are widely used in medical science to determine whether a new treatment is more effective (have better outcomes) than another treatment. Yet, it is only recent that the Bupa hospital group in the UK decided to used PROMs for evaluating the clinical outcomes of their procedures.8 Rather than asking the doctor whether the operation went well, the patients who have undergone the operation were asked if the surgery relieved their pain and restored their previous physical ability.
Figure 1 The Donabedian model of measuring healthcare system performance
Structural elements:
Community, institution, provider, patient
E.g. geographic location of facility, technical facilities
etc
Outcomes:
Death, adverse events, readmission to hospital,
resourse use, patient satisfacton with care, quality of life, ability to function in
daily activities
Process elements:
Treatment process, stages of treatment, appropriateness,
services processE.g. treatment delays (including wait times)
16
CHAPTER 1
Before measuring the outcomes of healthcare delivery, it is important to choose or develop the right instrument or tool (e.g. PROM) for the job. In order to do so, one need to answer the following questions: “Do you want to assess the outcome for a specific condition or for a more general concept?” and “Do you want to assess the outcome of one specific domain or for multiple domains?”.
To assess the outcome for a specific patient group one needs to select or develop a condition-specific instrument. These instruments focus on symptoms and signs that reflect the status of a given medical condition. Generic instruments, on the other hand, are more comprehensive and assess a single aspect or multiple aspects of a general concept, e.g. general wellbeing. In contrast to condition-specific instruments generic instruments can be applied in different types of diseases, interventions, and patients.9
To assess the outcomes on various domains one needs to select or develop a multi-dimensional tool. The advantage of such a tool is that they are designed to capture various aspects (e.g. health, physical functioning, and emotional functioning) of a certain concept (e.g. general wellbeing). As a result, it gives insight into the bigger picture (a more holistic view). However, having collected results of multidimensional scales, it is not an easy task to combine them into a single meaningful aggregated index or composite endpoint, which is necessary to compare the value of various interventions. For example, when one domain is reflected by two items on a 5-point Likert scale, while another domain is reflected by three items on a 4-point Likert scale. Simply adding up the components would not suffice as it cannot be interpreted. Additionally, the first domain could be more relevant to the patient than second domain.
To circumvent these problems preference-weighted composite endpoints/outcomes are established and used. Preference-weighting refers to placing value judgments on health states achieved or avoided by treatment has been suggested also in elderly populations.10 These weights reflect the relative importance of various domains when compared with an anchor, such as perfect health, quality of life, or general wellbeing. The fact that most definitions of quality of care consistently stress the importance of patient-centredness underlines the necessity of using prefer-ence-weights to combine multidimensional items if the aim is to measure the value of care.4 Hence, in order to assess quality of healthcare, the outcome measure used needs to reflect the value of the change accomplished according to the patient.
17
GENERAL INTRODUCTION AND OUTLINE
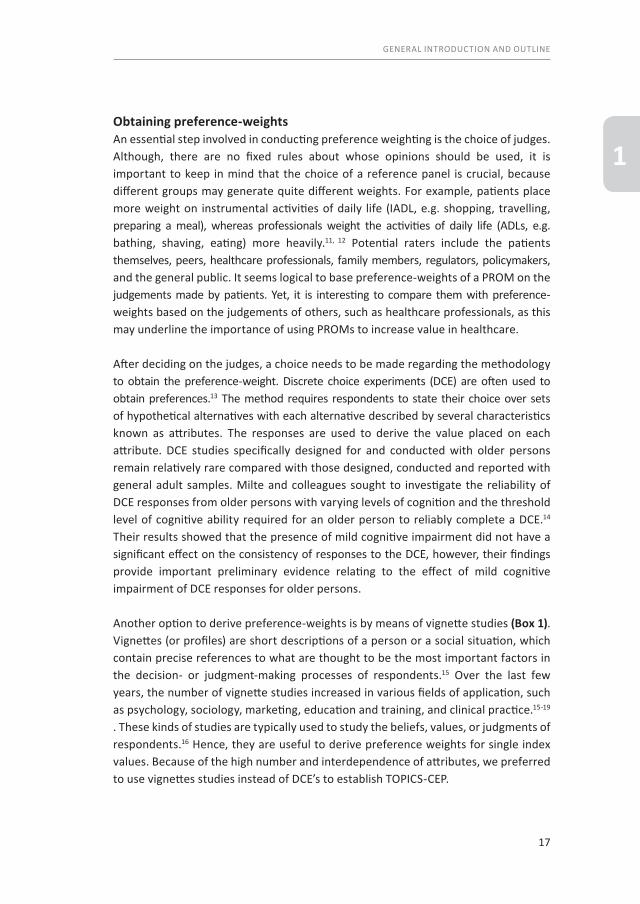
1Obtaining preference-weights An essential step involved in conducting preference weighting is the choice of judges. Although, there are no fixed rules about whose opinions should be used, it is important to keep in mind that the choice of a reference panel is crucial, because different groups may generate quite different weights. For example, patients place more weight on instrumental activities of daily life (IADL, e.g. shopping, travelling, preparing a meal), whereas professionals weight the activities of daily life (ADLs, e.g. bathing, shaving, eating) more heavily.11, 12 Potential raters include the patients themselves, peers, healthcare professionals, family members, regulators, policy makers, and the general public. It seems logical to base preference-weights of a PROM on the judgements made by patients. Yet, it is interesting to compare them with preference- weights based on the judgements of others, such as healthcare professionals, as this may underline the importance of using PROMs to increase value in healthcare.
After deciding on the judges, a choice needs to be made regarding the methodology to obtain the preference-weight. Discrete choice experiments (DCE) are often used to obtain preferences.13 The method requires respondents to state their choice over sets of hypothetical alternatives with each alternative described by several characteristics known as attributes. The responses are used to derive the value placed on each attribute. DCE studies specifically designed for and conducted with older persons remain relatively rare compared with those designed, conducted and reported with general adult samples. Milte and colleagues sought to investigate the reliability of DCE responses from older persons with varying levels of cognition and the threshold level of cognitive ability required for an older person to reliably complete a DCE.14 Their results showed that the presence of mild cognitive impairment did not have a significant effect on the consistency of responses to the DCE, however, their findings provide important preliminary evidence relating to the effect of mild cognitive impairment of DCE responses for older persons.
Another option to derive preference-weights is by means of vignette studies (Box 1). Vignettes (or profiles) are short descriptions of a person or a social situation, which contain precise references to what are thought to be the most important factors in the decision- or judgment-making processes of respondents.15 Over the last few years, the number of vignette studies increased in various fields of application, such as psychology, sociology, marketing, education and training, and clinical practice.15-19 . These kinds of studies are typically used to study the beliefs, values, or judgments of respondents.16 Hence, they are useful to derive preference weights for single index values. Because of the high number and interdependence of attributes, we preferred to use vignettes studies instead of DCE’s to establish TOPICS-CEP.
18
CHAPTER 1
1.4 Aims and thesis outline
In order to fulfil the need for a valid endpoint that combines TOPICS-MDS outcomes from eight domains, we developed and validated TOPICS-CEP. As the primary aim of this project was to develop an endpoint that considers the desirability of health outcomes, we used health valuations made by older persons and informal caregivers to obtain the preference weights for the eight domains (TOPICS-CEP components). Vignette studies were conducted in which older persons, informal caregivers, and healthcare professionals were asked to value described health states. The health valuations made by healthcare professionals were used to explore the relevance of a preference-weighted composite endpoint. As a secondary aim, this project validated TOPICS-CEP.
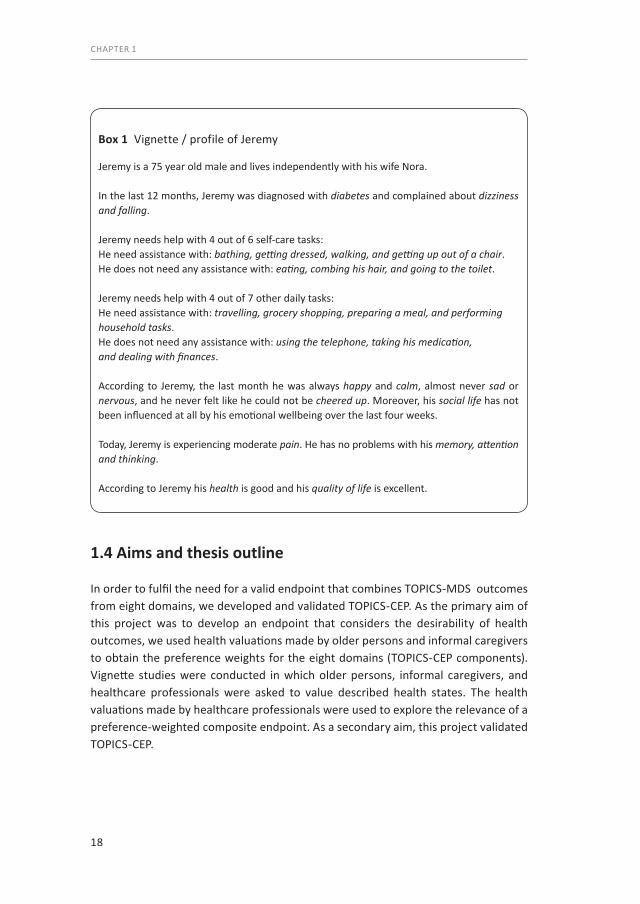
Box 1 Vignette / profile of Jeremy
Jeremy is a 75 year old male and lives independently with his wife Nora.
In the last 12 months, Jeremy was diagnosed with diabetes and complained about dizziness and falling.
Jeremy needs help with 4 out of 6 self-care tasks:He need assistance with: bathing, getting dressed, walking, and getting up out of a chair.He does not need any assistance with: eating, combing his hair, and going to the toilet.
Jeremy needs help with 4 out of 7 other daily tasks:He need assistance with: travelling, grocery shopping, preparing a meal, and performing household tasks.He does not need any assistance with: using the telephone, taking his medication, and dealing with finances.
According to Jeremy, the last month he was always happy and calm, almost never sad or nervous, and he never felt like he could not be cheered up. Moreover, his social life has not been influenced at all by his emotional wellbeing over the last four weeks.
Today, Jeremy is experiencing moderate pain. He has no problems with his memory, attention and thinking.
According to Jeremy his health is good and his quality of life is excellent.

19
GENERAL INTRODUCTION AND OUTLINE
1To establish and validate TOPICS-CEP the following research questions were defined:1. What are the preference weights of TOPICS-CEP components based on the
health valuations made by older persons, informal caregivers, and healthcare professionals, respectively?
2. Are there significant differences when the preference weights of TOPICS-CEP components based on the health valuations made by older persons, informal caregivers, and healthcare professionals are compared?
3. Which characteristics of the raters from the group of older persons and informal caregivers have a significant influence on the preference weights of TOPICS-CEP components?
4. What is the construct validity of TOPICS-CEP? o Are TOPICS-CEP scores related to other often used outcome measures, such
as the EQ-5D utility score? o Can TOPICS-CEP discriminate between groups, e.g. older persons with versus
without dementia?
OutlineThis thesis consists of four sections: the development of TOPICS-CEP, the importance of a preference-weighted composite endpoint, the validation of TOPICS-CEP, and a general discussion.
Chapter 2 and 3 focus on the development of TOPICS-CEP. Chapter 2 presents the results of a vignette study, which was conducted to derive and compare the prefer-ence-weights based on the health state preferences of older persons and informal caregivers. In Chapter 3 the influence of our participants’ gender, age, and self-perceived health on the preference weights are examined.
Chapter 4 introduces an adapted Bland-Altman approach to evaluate possible patterns of discord between two measurement methods with an unequal number of observations per case. Chapter 5 and 6 concentrate on how the perspective of the rater (self-rating versus external rating, and perspective of lay persons versus healthcare professionals) may affect their valuation of the outcome and thus explores the importance of the establishment of TOPICS-CEP. In a letter to the editor Chapter 5 assessments made by older persons themselves are compared with those made by peers. Chapter 6 presents the results of a vignette study which was conducted to compare the preference weights based on the health state preferences of healthcare professionals with those of older persons and informal caregivers.

20
CHAPTER 1
Chapter 7 addresses the psychometric properties of TOPICS-CEP. Convergent validity, known group validity, and generalizability of TOPICS-CEP are examined by evaluating a large heterogeneous sample of older persons aged 65 years and older.
Chapter 8 provides a summary of the main findings of this thesis and discusses the implications of these results.

21
GENERAL INTRODUCTION AND OUTLINE
11.5 References1. CBS. Prognose bevolking kerncijfers, 2012-2060 (in Dutch only) 2014 [cited 2016 22 January]. Available
from: http://statline.cbs.nl/StatWeb/publication/?VW=T&DM=SLNL&PA=81593NED&D1=a&D2=0&D3=0-1,3,8,13,18,23,28,33,38,43,l&HD=130605-0940&HDR=G1,G2&STB=T.
2. BeterOud. The National Care for the Elderly Programme [cited 2016 22 January]. Available from: http://www.beteroud.nl/ouderen/dutch-national-care-programme-for-the-elderly.html.
3. Lutomski JE, Baars MA, Schalk BW, Boter H, Buurman BM, den Elzen WP, et al. The development of the Older Persons and Informal Caregivers Survey Minimum DataSet (TOPICS-MDS): a large-scale data sharing initiative. PloS one. 2013;8(12):e81673. PubMed PMID: 24324716. Pubmed Central PMCID: 3852259.
4. Institute of Medicine (U.S.). Committee on Quality of Health Care in America. Crossing the quality chasm : a new health system for the 21st century. Washington, D.C.: National Academy Press; 2001. xx, 337 p. p.
5. Donabedian A. Evaluating the quality of medical care. The Milbank Memorial Fund quarterly. 1966 Ju-l;44(3):Suppl:166-206. PubMed PMID: 5338568.
6. Porter ME. What is value in health care? The New England journal of medicine. 2010 Dec 23;363(26):2477-81. PubMed PMID: 21142528.
7. Merry AF, Hamblin R. More for less: best patient outcomes in a time of financial restraint. The journal of extra-corporeal technology. 2012 Dec;44(4):178-85. PubMed PMID: 23441557. Pubmed Central PMCID: 4557558.
8. Vallance-Owen AJ. Measuring patient care: PROMs promote health gain and patient involvement. Bmj. 2008 Feb 16;336(7640):344. PubMed PMID: 18276676. Pubmed Central PMCID: 2244731.
9. Patrick DL, Erickson P. Health status and health policy : quality of life in health care evaluation and resource allocation. New York: Oxford University Press; 1993. xxv, 478 p. p.
10. Sackett DL, Torrance GW. The utility of different health states as perceived by the general public. Journal of chronic diseases. 1978;31(11):697-704. PubMed PMID: 730825.
11. Chen Q, Kane RL. Effects of using consumer and expert ratings of an activities of daily living scale on predicting functional outcomes of postacute care. Journal of clinical epidemiology. 2001 Apr;54(4):334-42. PubMed PMID: 11297883.
12. Huber M, van Vliet M, Giezenberg M, Winkens B, Heerkens Y, Dagnelie PC, et al. Towards a ‘patient-cen-tred’ operationalisation of the new dynamic concept of health: a mixed methods study. BMJ open. 2016;6(1):e010091. PubMed PMID: 26758267.
13. Using Discrete Choice Experiments to Value Health and Health Care. Bateman IJ, editor. Dordrecht, The Netherlands: Springer; 2008.
14. Milte R, Ratcliffe J, Chen G, Lancsar E, Miller M, Crotty M. Cognitive overload? An exploration of the potential impact of cognitive functioning in discrete choice experiments with older people in health care. Value in health : the journal of the International Society for Pharmacoeconomics and Outcomes Research. 2014 Jul;17(5):655-9. PubMed PMID: 25128060.
15. Alexander CS, Becker HJ. THe use of vignettes in survey research. Public opinion quarterly. 1978;42(1):92-104.
16. Atzmuller C, Steiner PM. Experimental Vignette Studies in Survey Research. Methodology-Eur. 2010;6(3):128-38.
17. Ludwick R, Zeller RA. The factorial survey: an experimental method to replicate real world problems. Nursing research. 2001 Mar-Apr;50(2):129-33. PubMed PMID: 11302293.
18. Farshad M, Gerber C, Szucs T, Meyer DC. Determining utility values in patients with anterior cruciate ligament tears using clinical scoring systems. BMC health services research. 2011;11:182. PubMed PMID: 21813026. Pubmed Central PMCID: 3160876.
19. Muller-Engelmann M, Krones T, Keller H, Donner-Banzhoff N. Decision making preferences in the medical encounter--a factorial survey design. BMC health services research. 2008;8:260. PubMed PMID: 19091091. Pubmed Central PMCID: 2628895.

Part 2The development of TOPICS-CEP


Published as:Establishing a composite endpoint for measuring the effectiveness of geriatric interventions based on older persons’ and informal caregivers’ preference weights: A vignette study
C.S. Hofman, P. Makai, H. Boter, B.M. Buurman, A.J.M. de Craen, M.G.M. Olde Rikkert, A.R.T. Donders, R.J.F. Melis
BMC Geriat 2014 Apr 18; 14:51. Doi 10.1186/1471-2318-14-51.
Chapter 2Establishing TOPICS-CEP; The health state preferences of older persons and informal caregivers
26
CHAPTER 2
Abstract
BackgroundThe Older Persons and Informal Caregivers Survey Minimal Dataset’s (TOPICS-MDS) questionnaire which measures relevant outcomes for elderly people was successfully incorporated into over 60 research projects of the Dutch National Care for the Elderly Programme. A composite endpoint (CEP) for this instrument would be helpful to compare effectiveness of the various intervention projects. Therefore, our aim is to establish a CEP for the TOPICS-MDS questionnaire, based on the preferences of elderly persons and informal caregivers.
MethodsA vignette study was conducted with 200 persons (124 elderly and 76 informal caregivers) as raters. The vignettes described eight TOPICS-MDS outcomes of older persons (morbidity, functional limitations, emotional wellbeing, pain experience, cognitive functioning, social functioning, self-perceived health and self-perceived quality of life) and the raters assessed the general wellbeing (GWB) of these vignette cases on a numeric rating scale (0-10). Mixed linear regression analyses were used to derive the preference weights of the TOPICS-MDS outcomes (dependent variable: GWB scores; fixed factors: the eight outcomes; unstandardized coefficients: preference weights).
ResultsThe mixed regression model that combined the eight outcomes showed that the weights varied from 0.01 for social functioning to 0.16 for self-perceived health. A model that included “informal caregiver” showed that the interactions between this variable and each of the eight outcomes were not significant (p>0.05).
ConclusionA preference-weighted CEP for TOPICS-MDS questionnaire was established based on the preferences of older persons and informal caregivers. With this CEP optimal comparing the effectiveness of interventions in older persons can be realized.

27
HEALTH STATE PREFERENCES OF OLDER PERSONS
2
2.1 Background
The number of elderly is increasing worldwide, due to increasing life-expectancy.1 Ageing of our populations will have a major impact on the organization and delivery of health care, as healthcare systems have to meet the needs of geriatric patients, while the shortage of healthcare workers is likely to grow.2 To restrain healthcare spending and improve the quality of care it is necessary to measure, report, and compare outcomes in healthcare delivery.3, 4 However, comparing intervention outcomes for elderly is a great challenge because their health states are complex with problems in multiple domains, e.g. morbidities and physical functioning, and interventions often target a broad range of domains.5 A generic measurement instrument with a composite endpoint (CEP) would, therefore, be helpful to compare the effectiveness of different geriatric interventions.
With the increasing proportion of elderly and its impact on the organization and delivery of health care in mind, the Dutch Ministry of Health, Welfare, and Sport commissioned the National Care for the Elderly Programme (NCEP) with the aim to develop a more proactive, integrated healthcare system for older patients. Over 60 scientific projects were conducted under this programme.6 To achieve standardized outcome measurements within the NCEP, The Older Persons and Informal Caregivers Survey Minimal DataSet (TOPICS-MDS) instrument was constructed and integrated into the research protocols.7 TOPICS-MDS was developed by a small working group and includes validated instruments that are frequently used in older populations. Additionally, the instrument’s content and utility was evaluated by an independent multi-disciplinary panel with expertise in gerontology, epidemiology, biostatistics and health services research and a plain language expert was commissioned to revise the instrument for clarity and readability.
Although TOPICS-MDS is used to gather uniform data of the NCEP projects in a National Database (collecting dataset of over 32,000 elderly persons), there is currently no consensus on how to combine and weight the information from multiple outcome domains into a CEP. This means that the effectiveness of the projects can only be evaluated comparing the multiple individual domains separately and not the overall outcome.8 Using a single TOPICS-MDS item or item subset to compare outcomes leads to confusion when competing projects demonstrate different patterns of effect, as the items or domains may not be equally important.9 For example, it is difficult to decide which intervention is more effective if one intervention reduces the number of functional limitations and reduces pain sensation, while another improves social functioning and emotional wellbeing. Hence, for optimal comparison of the NCEP projects’ effectiveness a CEP that accounts for the relative importance of different outcomes is required.
28
CHAPTER 2
In this study, we explore how multidimensional TOPICS-MDS outcomes from the Care receiver questionnaire can be weighted and combined into a CEP. The relative importance of the outcomes are reflected by preference weighting of TOPICS-MDS information compared with an anchor.10 We opted for best and worst general wellbeing (GWB) as the anchor, because improving patients’ GWB is a goal all stakeholders share. Basically, GWB is a concept that covers a broad spectrum of health and it is influenced by various health outcome domains. Since the purpose of healthcare is to meet the needs of patients, our main focus should be on outcomes that matter to the patients.4, 11, 12 However, as relatives of elderly persons often deliver informal care and serve as proxies, e.g. when the elderly person has a low cognitive status, we are interested in the relative importance of the items according to them as well.13 Thus, the aim of this study is to examine the preference weights of elderly persons and informal caregivers and explore whether their preference weights differ.
2.2 Methods
Ethical approvalThe Medical Ethics Committee of the Radboud University Medical Center formally stated that this study was exempt from ethical review (Radboud University Medical Center Ethical Committee review reference number: CMO: 2010/244).
Study design This study has three components that are similar to those described in the valuation study of Brazier, Roberts, and Deverill.14 Firstly, TOPICS-MDS questionnaire for care receivers has been reduced in size and complexity. Secondly, a valuation study was conducted to derive the preference weights for the TOPICS-MDS outcomes. However, in contrast to the study of Brazier et al. we used a numeric rating scale to value the health states.14 Thirdly, the results of the valuation study were used in a model to calculate the composite endpoint for the vignette cases.
Vignette studyIn our valuation study vignettes were being used. Over the last few years, the number of vignette studies increased in various fields of application, such as psychology, sociology, marketing, education and training, and clinical practice.15-19 These kinds of studies are typically used to study the beliefs, values, or judgments of respondents.15 Hence, they are useful to derive preference weights for single index values.14 Vignettes are short descriptions of a person or a social situation which contain precise references to what are thought to be the most important factors in the decision- or judgment-making processes of respondents.16
29
HEALTH STATE PREFERENCES OF OLDER PERSONS
2
ParticipantsA sample of 124 community dwelling elderly aged ≥ 65 years and 76 informal caregivers participated as raters. We used a rather broad definition of informal caregiver: “An informal caregiver provides voluntary and unpaid care on a structural basis to a care recipient with physical, mental or psychological limitations who is most often a relative, friend or neighbour. The provided care involves assisting the care receiver with tasks (s)he would do him-/herself in normal health” derived from the NCEP website.20 In this study only informal caregivers who provided care to a care receiver aged ≥ 65 years were included. The participants were eligible if they mastered the Dutch language sufficiently. This was explored by the trained research assistants during first contact with the participants. When communication in Dutch was possible (asking questions regarding marital status, living arrangements, and family) the participants were included in the study.
The participants were recruited and the data was collected by four academic centres: Radboud University Medical Center, University Medical Centre Groningen, Academic Medical Centre Amsterdam, and Leiden University Medical Centre. These centres were spread over the Netherlands, and cover both urban and more rural parts of the country. To ensure a representative sample the participants were recruited in hospital outpatient clinics, general practitioner (GP) practices, nursing homes, day care facilities, and via the internet (recruitment messages were placed online). Written informed consent was obtained from each participant before the start of the vignette study.
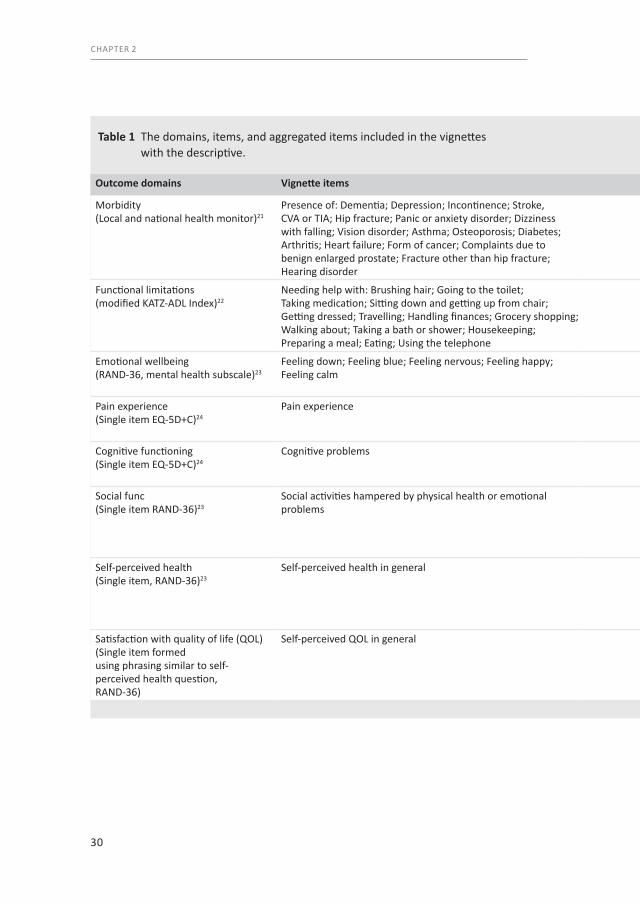
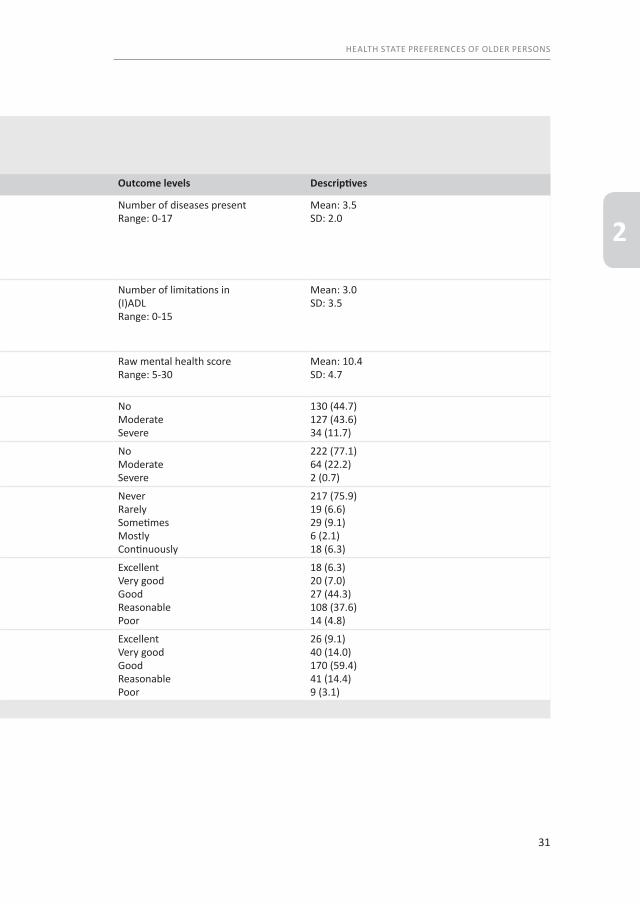
MaterialIn total 292 vignettes were constructed based on data of real persons (cases) derived from TOPICS-MDS National database. As the participants were asked to read the vignettes by themselves we used a large font size (14 points) and double spacing. In general, each vignette included 46 items and described elderly persons covering eight health domains: morbidity, functional limitations, emotional wellbeing, pain experience, cognitive functioning, social functioning, self-perceived health and self-perceived quality of life (QOL) and four demographic characteristics: gender, age, marital status, and living situation. Table 1 gives an overview of the health domains, items per domain, and levels per item which were included in the vignettes and used in the analyses.
By using empirical data only vignettes with plausible health state combinations were constructed. The cases described in the vignettes had a mean age of 81.4 years (SD 5.72) and 58.6% (N=171) was female. The majority of these cases were either married (42.8%, N=125) or their partner was deceased (42.8%, N=125), and 39.7% (N=116) lived independently with someone, e.g. a partner or family member.
30
CHAPTER 2
Table 1 The domains, items, and aggregated items included in the vignettes with the descriptive.
Outcome domains Vignette items Outcome levels Descriptives
Morbidity (Local and national health monitor)21
Presence of: Dementia; Depression; Incontinence; Stroke, CVA or TIA; Hip fracture; Panic or anxiety disorder; Dizziness with falling; Vision disorder; Asthma; Osteoporosis; Diabetes; Arthritis; Heart failure; Form of cancer; Complaints due to benign enlarged prostate; Fracture other than hip fracture; Hearing disorder
Number of diseases presentRange: 0-17
Mean: 3.5SD: 2.0
Functional limitations (modified KATZ-ADL Index)22
Needing help with: Brushing hair; Going to the toilet; Taking medication; Sitting down and getting up from chair; Getting dressed; Travelling; Handling finances; Grocery shopping; Walking about; Taking a bath or shower; Housekeeping; Preparing a meal; Eating; Using the telephone
Number of limitations in (I)ADLRange: 0-15
Mean: 3.0SD: 3.5
Emotional wellbeing (RAND-36, mental health subscale)23
Feeling down; Feeling blue; Feeling nervous; Feeling happy; Feeling calm
Raw mental health scoreRange: 5-30
Mean: 10.4SD: 4.7
Pain experience (Single item EQ-5D+C)24
Pain experience NoModerateSevere
130 (44.7)127 (43.6)34 (11.7)
Cognitive functioning (Single item EQ-5D+C)24
Cognitive problems NoModerateSevere
222 (77.1)64 (22.2)2 (0.7)
Social functioning (Single item RAND-36)23
Social activities hampered by physical health or emotional problems
NeverRarelySometimesMostlyContinuously
217 (75.9)19 (6.6)29 (9.1)6 (2.1)18 (6.3)
Self-perceived health (Single item, RAND-36)23
Self-perceived health in general ExcellentVery goodGoodReasonablePoor
18 (6.3)20 (7.0)27 (44.3)108 (37.6)14 (4.8)
Satisfaction with quality of life (QOL) (Single item formedusing phrasing similar to self-perceived health question,RAND-36)
Self-perceived QOL in general ExcellentVery goodGoodReasonablePoor
26 (9.1)40 (14.0)170 (59.4)41 (14.4)9 (3.1)
31
HEALTH STATE PREFERENCES OF OLDER PERSONS
2
Table 1 The domains, items, and aggregated items included in the vignettes with the descriptive.
Outcome domains Vignette items Outcome levels Descriptives
Morbidity (Local and national health monitor)21
Presence of: Dementia; Depression; Incontinence; Stroke, CVA or TIA; Hip fracture; Panic or anxiety disorder; Dizziness with falling; Vision disorder; Asthma; Osteoporosis; Diabetes; Arthritis; Heart failure; Form of cancer; Complaints due to benign enlarged prostate; Fracture other than hip fracture; Hearing disorder
Number of diseases presentRange: 0-17
Mean: 3.5SD: 2.0
Functional limitations (modified KATZ-ADL Index)22
Needing help with: Brushing hair; Going to the toilet; Taking medication; Sitting down and getting up from chair; Getting dressed; Travelling; Handling finances; Grocery shopping; Walking about; Taking a bath or shower; Housekeeping; Preparing a meal; Eating; Using the telephone
Number of limitations in (I)ADLRange: 0-15
Mean: 3.0SD: 3.5
Emotional wellbeing (RAND-36, mental health subscale)23
Feeling down; Feeling blue; Feeling nervous; Feeling happy; Feeling calm
Raw mental health scoreRange: 5-30
Mean: 10.4SD: 4.7
Pain experience (Single item EQ-5D+C)24
Pain experience NoModerateSevere
130 (44.7)127 (43.6)34 (11.7)
Cognitive functioning (Single item EQ-5D+C)24
Cognitive problems NoModerateSevere
222 (77.1)64 (22.2)2 (0.7)
Social functioning (Single item RAND-36)23
Social activities hampered by physical health or emotional problems
NeverRarelySometimesMostlyContinuously
217 (75.9)19 (6.6)29 (9.1)6 (2.1)18 (6.3)
Self-perceived health (Single item, RAND-36)23
Self-perceived health in general ExcellentVery goodGoodReasonablePoor
18 (6.3)20 (7.0)27 (44.3)108 (37.6)14 (4.8)
Satisfaction with quality of life (QOL) (Single item formedusing phrasing similar to self-perceived health question,RAND-36)
Self-perceived QOL in general ExcellentVery goodGoodReasonablePoor
26 (9.1)40 (14.0)170 (59.4)41 (14.4)9 (3.1)
32
CHAPTER 2
ProcedureThe vignette study was conducted in a familiar environment of the rater, e.g. in their own home or in a community centre in their living area. First, to collect the charac-teristics of the raters, we asked them to fill in the TOPICS-MDS themselves. Then, the vignette experiment started. After reading each vignette, participants were asked “How would you rate the general wellbeing of this person based on what you just read?”. A numeric rating scale was used to assess the general wellbeing of the cases according to the participants. The scale ranged from 0 to 10; with 0 representing the worst and 10 representing the best possible general wellbeing. The participants were allowed to use one decimal, this scale is in line with the Dutch grading system and is therefore well known to every Dutch person. The vignette study began with two trial vignettes. These vignettes were the same for every participant and aimed to (1) help the participant understand the task; (2) determine whether the participant comprehend the Dutch language sufficiently to fulfil the task; and (3) give the participant an idea of the range among the vignettes with regard to how well or how poor the GWB of the cases could be. Comprehension of the Dutch language was sufficient when the participants were able to understand the text of the vignettes without asking for clarification. Understanding the range of the vignettes was achieved through presenting trial vignettes on both extremes of the range. After the two trial vignettes, the participants were asked to give scores to a selection of ten vignettes following the same procedure. The vignettes were randomly selected with Excel, making sure each vignette was not assessed by more than five elderly raters and not by more than three informal caregivers to ensure equal distribution of the vignettes.
In some cases two or more participants filled in the survey simultaneously, e.g. partners (two elderly raters) or pairs (an elderly rater and his or her informal caregiver). These participants were instructed to assess the vignettes independently, meaning they were not allowed to consult each other in any way. The interviewer checked participants’ adherence to this rule.
Statistical analysisStage IMixed linear models were used to study the relationship between the eight outcomes from TOPICS-MDS care receiver questionnaire and raters’ GWB scores (0-10), to obtain the preference weights derived from scores given by the elderly raters and informal caregivers and to correct for clustering within raters (as each participant evaluated several vignettes) a random (participant dependent) intercept was included in the models.
33
HEALTH STATE PREFERENCES OF OLDER PERSONS
2
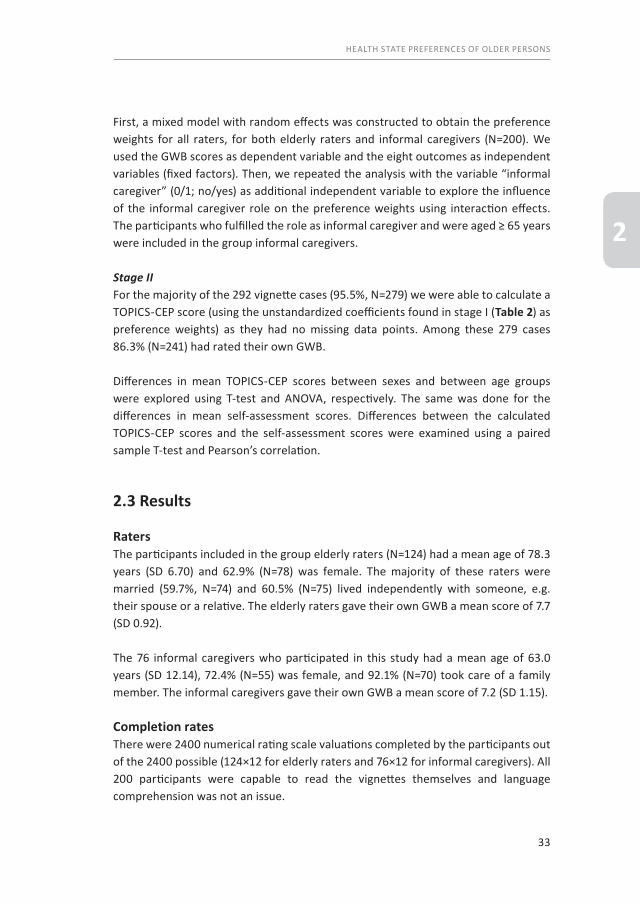
First, a mixed model with random effects was constructed to obtain the preference weights for all raters, for both elderly raters and informal caregivers (N=200). We used the GWB scores as dependent variable and the eight outcomes as independent variables (fixed factors). Then, we repeated the analysis with the variable “informal caregiver” (0/1; no/yes) as additional independent variable to explore the influence of the informal caregiver role on the preference weights using interaction effects. The participants who fulfilled the role as informal caregiver and were aged ≥ 65 years were included in the group informal caregivers.
Stage IIFor the majority of the 292 vignette cases (95.5%, N=279) we were able to calculate a TOPICS-CEP score (using the unstandardized coefficients found in stage I (Table 2) as preference weights) as they had no missing data points. Among these 279 cases 86.3% (N=241) had rated their own GWB.
Differences in mean TOPICS-CEP scores between sexes and between age groups were explored using T-test and ANOVA, respectively. The same was done for the differences in mean self-assessment scores. Differences between the calculated TOPICS-CEP scores and the self-assessment scores were examined using a paired sample T-test and Pearson’s correlation.
2.3 Results
RatersThe participants included in the group elderly raters (N=124) had a mean age of 78.3 years (SD 6.70) and 62.9% (N=78) was female. The majority of these raters were married (59.7%, N=74) and 60.5% (N=75) lived independently with someone, e.g. their spouse or a relative. The elderly raters gave their own GWB a mean score of 7.7 (SD 0.92).
The 76 informal caregivers who participated in this study had a mean age of 63.0 years (SD 12.14), 72.4% (N=55) was female, and 92.1% (N=70) took care of a family member. The informal caregivers gave their own GWB a mean score of 7.2 (SD 1.15).
Completion ratesThere were 2400 numerical rating scale valuations completed by the participants out of the 2400 possible (124×12 for elderly raters and 76×12 for informal caregivers). All 200 participants were capable to read the vignettes themselves and language comprehension was not an issue.
34
CHAPTER 2
Tabl
e 2
Res
ults
of m
ixed
line
ar a
naly
ses w
ith a
s dep
ende
nt v
aria
ble
the
GWB
scor
es g
iven
by
all r
ater
s.
Old
er p
erso
ns a
nd in
form
al c
areg
iver
s (N
=200
)
Uns
tand
ardi
zed
coeffi
cien
tSt
anda
rdize
d
coeffi
cien
tCo
nfide
nce
in
terv
alfo
r B
BBe
taP-
valu
eLo
wer
lim
itU
pper
lim
it
Inte
rcep
t9.
031.
540.
00**
8.84
9.22
Mor
bidi
ties
-0.1
4-0
.10
0.00
**-0
.15
-0.1
2
Func
tiona
l lim
itatio
ns-0
.12
-0.0
90.
00**
-0.1
3-0
.11
Emoti
onal
wel
lbei
ng-0
.04
-0.0
30.
00**
0.13
0.23
Pain
exp
erie
nce
-0.0
4-0
.03
0.17
-0.1
10.
02
Cogn
itive
func
tioni
ng-0
.13
-0.1
00.
00*
-0.2
2-0
.04
Soci
al fu
nctio
ning
-0.0
1-0
.01
0.63
-0.0
40.
02
Self-
perc
eive
d he
alth
-0.1
6-0
.12
0.00
**-0
.20
-0.1
2
Self-
perc
eive
d Q
OL
-0.0
3-0
.02
0.29
-0.0
7-0
.02
Not
e 1:
The
uns
tand
ardi
zed
coeffi
cien
ts e
stim
ate
the
incr
ease
in th
e de
pend
ent v
aria
ble
(gen
eral
wel
lbei
ng sc
ores
) per
uni
t inc
reas
e of
the
conti
nuou
s pre
dict
ors.
Not
e 2:
The
uns
tand
ardi
zed
coeffi
cien
ts a
re th
e pr
efer
ence
wei
ghts
of t
he c
ompo
nent
s inc
lude
d in
the
com
posit
e en
dpoi
nt.
*p <
0.0
5 **
p <
0.00
1.
35
HEALTH STATE PREFERENCES OF OLDER PERSONS
2
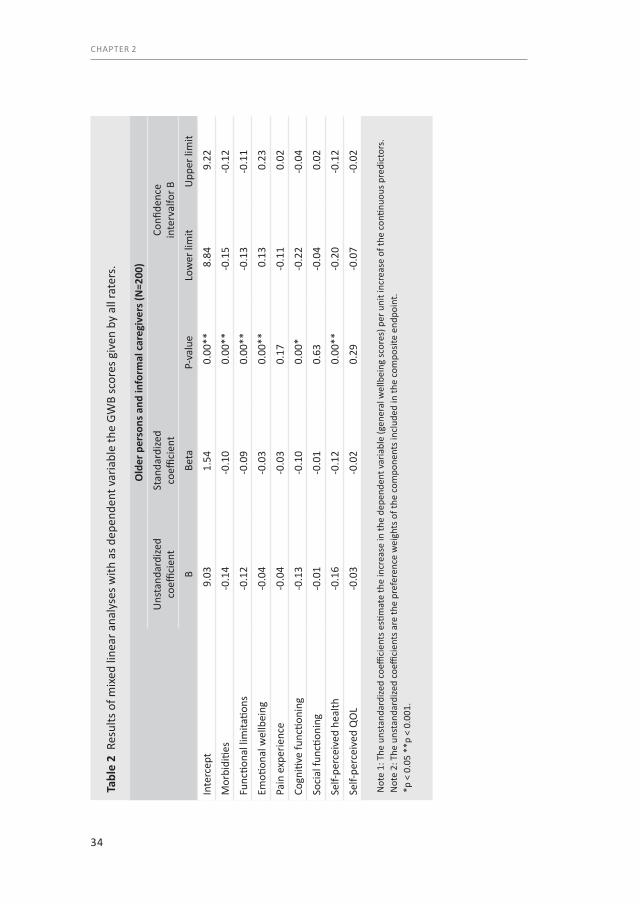
Stage IThe linear mixed regression model that combined the eight outcomes showed that p-value of the outcomes: morbidities, limitations in daily functioning, emotional wellbeing, cognitive functioning, and self-perceived health was smaller than 0.05 (Table 2).
The linear mixed regression model that combined the eight outcome and the additional variable “informal caregiver” showed that the p-value of the outcomes: morbidity, functional limitations, emotional wellbeing, cognitive functioning, and self-perceived health was smaller than 0.05. In addition, the interactions between the “informal caregiver” variable and each of the domains were not significant (p>0.05).
Examining the residuals we found no large departures from normality nor evidence for the presence of outliers. Based on the narrow confidence intervals multicolinear-ity between the outcome domains of the CEP is unlikely.
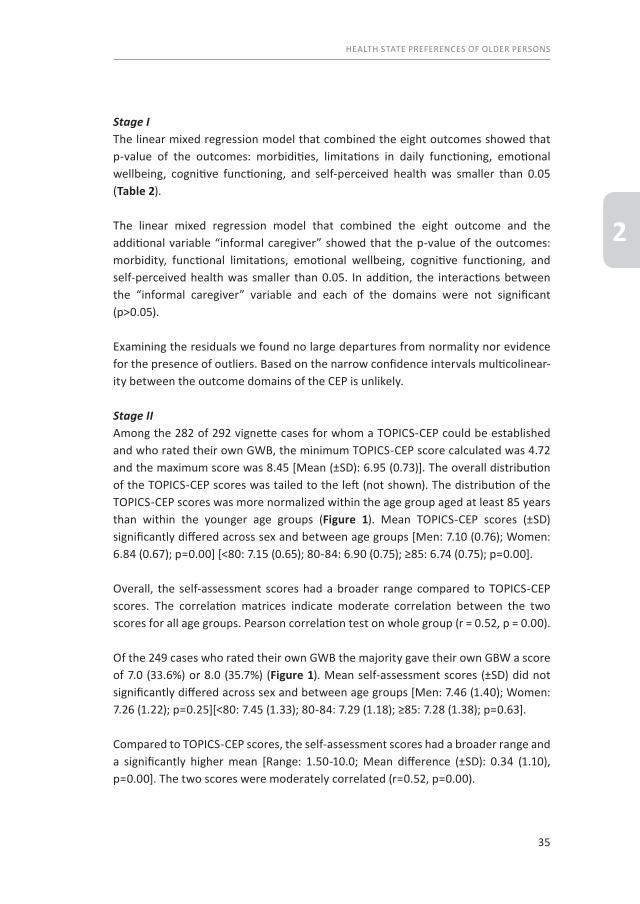
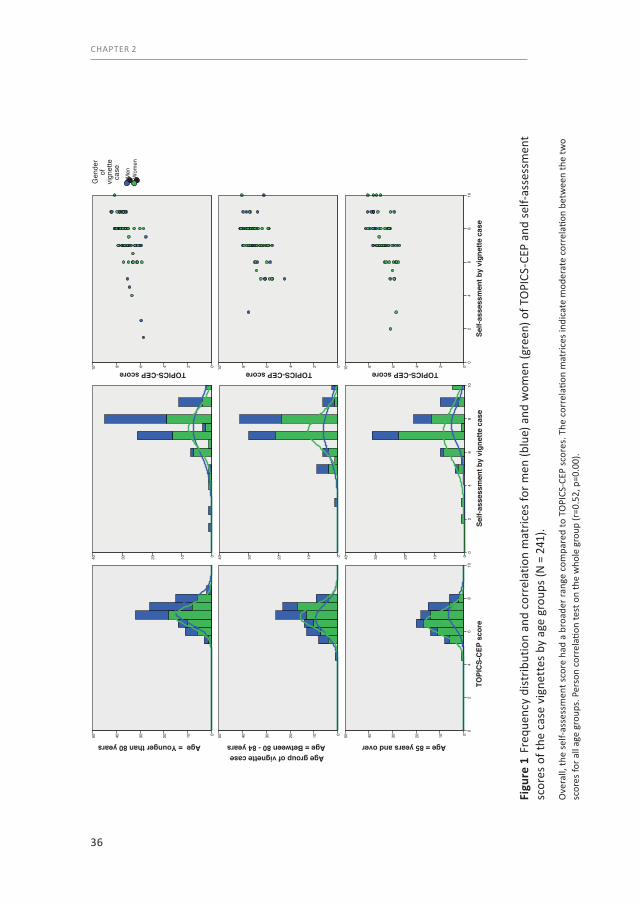
Stage IIAmong the 282 of 292 vignette cases for whom a TOPICS-CEP could be established and who rated their own GWB, the minimum TOPICS-CEP score calculated was 4.72 and the maximum score was 8.45 [Mean (±SD): 6.95 (0.73)]. The overall distribution of the TOPICS-CEP scores was tailed to the left (not shown). The distribution of the TOPICS-CEP scores was more normalized within the age group aged at least 85 years than within the younger age groups (Figure 1). Mean TOPICS-CEP scores (±SD) significantly differed across sex and between age groups [Men: 7.10 (0.76); Women: 6.84 (0.67); p=0.00] [<80: 7.15 (0.65); 80-84: 6.90 (0.75); ≥85: 6.74 (0.75); p=0.00].
Overall, the self-assessment scores had a broader range compared to TOPICS-CEP scores. The correlation matrices indicate moderate correlation between the two scores for all age groups. Pearson correlation test on whole group (r = 0.52, p = 0.00).
Of the 249 cases who rated their own GWB the majority gave their own GBW a score of 7.0 (33.6%) or 8.0 (35.7%) (Figure 1). Mean self-assessment scores (±SD) did not significantly differed across sex and between age groups [Men: 7.46 (1.40); Women: 7.26 (1.22); p=0.25][<80: 7.45 (1.33); 80-84: 7.29 (1.18); ≥85: 7.28 (1.38); p=0.63].
Compared to TOPICS-CEP scores, the self-assessment scores had a broader range and a significantly higher mean [Range: 1.50-10.0; Mean difference (±SD): 0.34 (1.10), p=0.00]. The two scores were moderately correlated (r=0.52, p=0.00).
36
CHAPTER 2
Figu
re 1
Fre
quen
cy d
istr
ibut
ion
and
corr
elat
ion
mat
rices
for m
en (b
lue)
and
wom
en (g
reen
) of T
OPI
CS-C
EP a
nd s
elf-a
sses
smen
t sc
ores
of t
he c
ase
vign
ette
s by
age
gro
ups
(N =
241
).
Ove
rall,
the
self-
asse
ssm
ent s
core
had
a b
road
er ra
nge
com
pare
d to
TO
PICS
-CEP
sco
res.
The
cor
rela
tion
mat
rices
indi
cate
mod
erat
e co
rrel
ation
bet
wee
n th
e tw
o sc
ores
for a
ll ag
e gr
oups
. Per
son
corr
elati
on te
st o
n th
e w
hole
gro
up (r
=0.5
2, p
=0.0
0).
50 40 30 20 10 0 50 40 30 20 10 0
TOPI
CS-
CEP
sco
re10
86
42
0
50 40 30 20 10 0
Age group of vignette caseAge = Younger than 80 years Age = Between 80 - 84 years Age = 85 years and over
40 30 20 10 0 40 30 20 10 0
Self-
asse
ssm
ent b
y vi
gnet
te c
ase
108
64
20
40 30 20 10 0
TOPICS-CEP score10 8 6 4 2 0 TOPICS-CEP score10 8 6 4 2 0
Self-
asse
ssm
ent b
y vi
gnet
te c
ase
108
64
20
TOPICS-CEP score10 8 6 4 2 0
Wom
enM
en
Gen
der
ofvi
gnet
teca
se

37
HEALTH STATE PREFERENCES OF OLDER PERSONS
2
2.4 Discussion
Our primary findings support that a CEP for TOPICS-MDS Care receiver questionnaire can be established based on the preference weights of both elderly persons and informal caregivers, which were derived by means of our vignette study. The narrow confidence intervals of our estimated parameters suggest that there was enough information present in the dataset, hence, that the sample size was large enough. Our secondary analysis indicates that using a CEP that can be calculated based on assessments from patients (e.g. by means of a questionnaire) is related to GWB, yet measures a different concept as the correlation is of medium strength.
In contrast to previous research, elderly persons and informal caregiver (or family members) share the same preferences when it comes to the assessment of a subjective measure such as GWB.25-28 Perhaps, the discrepancy between our findings and findings in other studies can be explained by the fact that in our study there was no personal relationship between the informal caregiver and elderly patient (cases described in the vignettes) that could influence the assessment made, e.g. response shift bias or caregiver burden.26, 29-31 We asked elderly persons and informal caregivers to assess the GWB of neutral cases, while in other studies elderly persons were asked to assess their own GWB and informal caregivers were asked to assess the GWB of their loved ones.
Our results and implications need to be interpreted in light of several limitations. First, the vignettes we used in this study were based on empirical data derived from the TOPICS-MDS National Database, which means that some combinations of the outcome domains were not represented, e.g. a case with dementia, dizziness with falling, hip fracture and fracture other than hip fracture who do not have any functional limitations. However, by using empirical data only vignettes with plausible health state combinations were constructed. Second, the distribution of marital status and living arrangement characteristics over the participants are similar to those over the Dutch population (≥ 65 years).32 However, in our study the elderly raters had a mean age of 78.3 years and 62.9% of the sample was female, while the mean age of the Dutch elderly population is 74.3 years and 56% of this population is female.32 Hence, women and elderly aged 80 years and over are overrepresented in our sample. Previous research has shown individual variation in health state preferences influenced by gender and age.33, 34 Therefore, we will explore the influence of our raters’ characteristics on the TOPICS-CEP’s preference weights in our next study. Third, even though the most important health domains from TOPICS –MDS Care receiver questionnaire were included in the CEP there may be aspects that influence the general wellbeing of elderly that are not included in the questionnaire and the CEP, such as isolation and loneliness.

38
CHAPTER 2
The benefits of using TOPICS-MDS and its’ CEP are that a range of important end - points will be collected and incorporated in a single metric, which can index the overall impact of interventions according to elderly persons and informal caregivers in a standardized way and reduce sample size requirements. Hence, establishing the value of interventions will be easier and more objective. Similar to other composite endpoints, such as the Disease Activity Score in rheumatology, the use of TOPICS-CEP may improve analysis of clinical trials and it may even be applicable to clinical care.35, 36
For future research we suggest to explore the responsiveness of the established CEP and its prognostic value. Also, we advise to compare the preference weights of older persons and informal caregivers derived in this study with those of healthcare providers.
2.5 Conclusions
TOPICS-MDS has been successfully incorporated into all NCEP research projects. Until now, the effectiveness of the projects could only be compared per item, item subset, or comparing multiple endpoints. With the establishment of TOPICS-CEP for the care receiver questionnaire that accounts for the relative importance of different outcomes based on the preferences of elderly persons and informal caregivers, optimal comparison of NCEP project’s effectiveness can be realized. A syntax to calculate the TOPICS-CEP score will be available on the TOPICS-MDS website in the latter half of 2013.7
Besides NCEP projects, other projects in the geriatric field can use the TOPICS-MDS to collect research data and the TOPICS-CEP allowing standardized assessment of patient outcomes reflecting the preferences of elderly persons and informal caregivers.7

39
HEALTH STATE PREFERENCES OF OLDER PERSONS
2
2.6 References1. Humphreys G. The health-care challenges posed by population ageing. Bulletin of the World Health
Organization. 2012 Feb 1;90(2):82-3. PubMed PMID: 22423156. Pubmed Central PMCID: 3302561.2. Rechel B, Doyle Y, Grundy E, McKee M. How can health systems respond to population ageing? : World
Health Organization on behalf of the European Observatory on Health Systems and Policies; 2009 [cited 2014 April 14]. Available from: http://www.euro.who.int/__data/assets/pdf_file/0004/64966/E92560.pdf.
3. Basu A, Philipson TJ. The impact of comparative effectiveness research on health and health care spending. Cambridge, Mass.: National Bureau of Economic Research; 2010.
4. Porter ME. What is value in health care? The New England journal of medicine. 2010 Dec 23;363(26):2477-81. PubMed PMID: 21142528. Epub 2010/12/15. eng.
5. Fried LP, Ferrucci L, Darer J, Williamson JD, Anderson G. Untangling the concepts of disability, frailty, and comorbidity: implications for improved targeting and care. The journals of gerontology Series A, Biological sciences and medical sciences. 2004 Mar;59(3):255-63. PubMed PMID: 15031310. Epub 2004/03/20. eng.
6. Lutomski JE, Baars MA, Schalk BW, Boter H, Buurman BM, den Elzen WP, et al. The Development of the Older Persons and Informal Caregivers Survey Minimum DataSet (TOPICS-MDS): A Large-Scale Data Sharing Initiative. PloS one. 2013;8(12):e81673. PubMed PMID: 24324716. Pubmed Central PMCID: 3852259. Epub 2013/12/11. eng.
7. The Older Persons and Informal Caregiver Survey (TOPICS) for Care receivers - Baseline The Older Persons and Informal Caregivers Survey Minimum DataSet (TOPICS-MDS) [cited 2015 21 October]. Available from: http://topics-mds.eu/wp-content/uploads/2014/03/Baseline-Questionnaire_Participant.pdf.
8. Neuhauser M. How to deal with multiple endpoints in clinical trials. Fundamental & clinical pharmacology. 2006 Dec;20(6):515-23. PubMed PMID: 17109645.
9. Veit CT, Ware JE. Measuring health state and health care outcomes: Issues and recommendations. In: Kane RL, Kane RA, editors. Values and Long Term Care. Lexington, MA: Lexington Books; 1982. p. 233-59.
10. Sackett DL, Torrance GW. The utility of different health states as perceived by the general public. Journal of chronic diseases. 1978;31(11):697-704. PubMed PMID: 730825. Epub 1978/01/01. eng.
11. Gerteis M, Picker/Commonwealth Program for Patient-Centered Care. Through the patient’s eyes: understanding and promoting patient-centered care. 1st ed. San Francisco: Jossey-Bass; 1993. xxvii, 317 p. p.
12. Say RE, Thomson R. The importance of patient preferences in treatment decisions--challenges for doctors. Bmj. 2003 Sep 6;327(7414):542-5. PubMed PMID: 12958116. Pubmed Central PMCID: 192849.
13. Van Houtven CH, Norton EC. Informal care and health care use of older adults. Journal of health economics. 2004 Nov;23(6):1159-80. PubMed PMID: 15556241.
14. Brazier J, Roberts J, Deverill M. The estimation of a preference-based measure of health from the SF-36. Journal of health economics. 2002 Mar;21(2):271-92. PubMed PMID: 11939242. Epub 2002/04/10. eng.
15. Atzmuller C, Steiner PM. Experimental Vignette Studies in Survey Research. Methodology-Eur. 2010;6(3):128-38. PubMed PMID: ISI:000281117100005. English.
16. Alexander CS, Becker HJ. The use of vignettes in survey research. Public opinion quarterly. 1978;42(1):93-104.17. Ludwick R, Zeller RA. The factorial survey: an experimental method to replicate real world problems.
Nursing research. 2001 Mar-Apr;50(2):129-33. PubMed PMID: 11302293.18. Farshad M, Gerber C, Szucs T, Meyer DC. Determining utility values in patients with anterior cruciate
ligament tears using clinical scoring systems. BMC health services research. 2011;11:182. PubMed PMID: 21813026. Pubmed Central PMCID: 3160876. Epub 2011/08/05. eng.
19. Muller-Engelmann M, Krones T, Keller H, Donner-Banzhoff N. Decision making preferences in the medical encounter--a factorial survey design. BMC health services research. 2008;8:260. PubMed PMID: 19091091. Pubmed Central PMCID: 2628895.
20. Definitie mantelzorg (In Dutch only) National Care for the Elderly Programme (NCEP) [cited 2014 January 6]. Available from: http://www.nationaalprogrammaouderenzorg.nl/fileadmin/www.npoz.nl/documenten/toolkits/mantelzorgdefinitie_def.pdf

40
CHAPTER 2
21. Lokale en nationale monitor gezondheid (In Dutch only) Lokale en nationale monitor gezondheid [cited 2013 May 15]. Available from: https://www.monitorgezondheid.nl/gezondheidindicatoren.aspx.
22. Weinberger M, Samsa GP, Schmader K, Greenberg SM, Carr DB, Wildman DS. Comparing proxy and patients’ perceptions of patients’ functional status: results from an outpatient geriatric clinic. Journal of the American Geriatrics Society. 1992 Jun;40(6):585-8. PubMed PMID: 1587975.
23. VanderZee KI, Sanderman R, Heyink JW, de Haes H. Psychometric qualities of the RAND 36-Item Health Survey 1.0: a multidimensional measure of general health status. International journal of behavioral medicine. 1996;3(2):104-22. PubMed PMID: 16250758.
24. Krabbe PF, Stouthard ME, Essink-Bot ML, Bonsel GJ. The effect of adding a cognitive dimension to the EuroQol multiattribute health-status classification system. Journal of clinical epidemiology. 1999 Apr;52(4):293-301. PubMed PMID: 10235169.
25. Gomez-Gallego M, Gomez-Amor J, Gomez-Garcia J. Determinants of quality of life in Alzheimer’s disease: perspective of patients, informal caregivers, and professional caregivers. International psy-chogeriatrics / IPA. 2012 Nov;24(11):1805-15. PubMed PMID: 22697366.
26. Huang HL, Chang MY, Tang JS, Chiu YC, Weng LC. Determinants of the discrepancy in patient- and care-giver-rated quality of life for persons with dementia. J Clin Nurs. 2009 Nov;18(22):3107-18. PubMed PMID: 19207789. Epub 2009/02/12. eng.
27. Crespo M, Bernaldo de Quiros M, Gomez MM, Hornillos C. Quality of life of nursing home residents with dementia: a comparison of perspectives of residents, family, and staff. Gerontologist. 2012 Feb;52(1):56-65. PubMed PMID: 21903614. Epub 2011/09/10. eng.
28. Moyle W, Murfield JE, Griffiths SG, Venturato L. Assessing quality of life of older people with dementia: a comparison of quantitative self-report and proxy accounts. Journal of advanced nursing. 2012 Oct;68(10):2237-46. PubMed PMID: 22211637.
29. Schwartz CE, Sprangers MA. Methodological approaches for assessing response shift in longitudinal health-related quality-of-life research. Social science & medicine. 1999 Jun;48(11):1531-48. PubMed PMID: 10400255.
30. Rapkin BD, Schwartz CE. Toward a theoretical model of quality-of-life appraisal: Implications of findings from studies of response shift. Health and quality of life outcomes. 2004 Mar 15;2:14. PubMed PMID: 15023229. Pubmed Central PMCID: 408464.
31. Neumann PJ, Araki SS, Gutterman EM. The use of proxy respondents in studies of older adults: lessons, challenges, and opportunities. Journal of the American Geriatrics Society. 2000 Dec;48(12):1646-54. PubMed PMID: 11129756.
32. CBS. Bevolking; geslacht, leeftijd en burgerlijke staat (In Dutch only) CBS [cited 2013 31 July]. Available from: http://statline.cbs.nl/StatWeb/selection/?DM=SLNL&PA=7461BEV&VW=T.
33. Dolan P. Effect of age on health state valuations. Journal of health services research & policy. 2000 Jan;5(1):17-21. PubMed PMID: 10787582.
34. Wittenberg E, Halpern E, Divi N, Prosser LA, Araki SS, Weeks JC. The effect of age, race and gender on preference scores for hypothetical health states. Quality of life research : an international journal of quality of life aspects of treatment, care and rehabilitation. 2006 May;15(4):645-53. PubMed PMID: 16688497.
35. van der Heijde DM, van’t Hof MA, van Riel PL, van Leeuwen MA, van Rijswijk MH, van de Putte LB. Validity of single variables and composite indices for measuring disease activity in rheumatoid arthritis. Annals of the rheumatic diseases. 1992 Feb;51(2):177-81. PubMed PMID: 1550400. Pubmed Central PMCID: 1005654.
36. Fuchs HA. The Use of the Disease-Activity Score in the Analysis of Clinical-Trials in Rheumatoid-Arthri-tis. Journal of Rheumatology. 1993 Nov;20(11):1863-6. PubMed PMID: ISI:A1993ML97300010. English.

41
HEALTH STATE PREFERENCES OF OLDER PERSONS
2


Published as:The influence of age on health valuations: the older olds prefer functional independence while the younger olds prefer less morbidity
C.S. Hofman, P. Makai, H. Boter, B.M. Buurman, A.J.M. de Craen, M.G.M. OldeRikkert, A.R.T. Donders, R.J.F. Melis
Clin Interv Aging. 2015 Jul 8;10:1131-9. Doi: 10.2147/CIA.S78698.
Chapter 3Adjusting TOPICS-CEP; The influence of rater characteristics on TOPICS-CEP’s preference weights
44
CHAPTER 3
Abstract
BackgroundTo assess the effectiveness of geriatric interventions, The Older Persons and Informal Caregivers Survey – Composite Endpoint (TOPICS-CEP) has been developed based on health valuations of older persons and informal caregivers. This study explored the influence of the raters’ age on the preference weights of TOPICS-CEP’s components.
MethodsA vignette study was conducted with 200 raters (mean age ± standard deviation: 72.5±11.8 years; 66.5% female). Profiles of older persons were used to obtain the preference weights for all TOPICS-CEP components: morbidity, functional limitations, emotional wellbeing, pain experience, cognitive functioning, social functioning, self- perceived health, and self-perceived quality of life. The raters assessed the general wellbeing of these vignettes on a 0–10 scale. Mixed linear regression analysis with interaction terms was used to explore the effects of raters’ age on the preference weights.
ResultsInteraction effects between age and the TOPICS-CEP components showed that older raters gave significantly (P<0.05) more weight to functional limitations and social functioning and less to morbidities and pain experience, compared to younger raters.
ConclusionResearchers examining effectiveness in elderly care need to consider the discrepancies between health valuations of younger olds and older olds when selecting or establishing outcome measures. In clinical decision making, health care professionals need to be aware of this discrepancy as well. For this reason we highly recommend shared decision making in geriatric care.

45
THE INFLUENCE OF AGE
3
3.1 Introduction
Comparing intervention outcomes for older persons is challenging because their health states are complex, with problems on multiple health domains, and because interventions often target a broad range of these domains.1 However, comparative effectiveness research in geriatric care becomes more straightforward when clinically important outcome parameters are combined into a multidimensional preference- weighted outcome measure. Such a composite endpoint (CEP) can efficiently deal with the issue of multiplicity, eg, if more than one outcome is important for effectiveness evaluation or if an intervention has the potential to improve more than one health domain. By using a preference-weighted multifaceted outcome measure, the relative importance of the various outcomes is taken into account.
A CEP is of particular interest for The Older Persons and Informal Caregivers Survey Minimum Data Set (TOPICS-MDS), a data repository containing data from 41 research projects participating in the Dutch National Care for the Elderly Program.2 To promote comparability between these research studies, a preference-weighted CEP for the TOPICS-MDS for care receivers (referred to as TOPICS-CEP) was established by means of a vignette study and based on the health-state valuations of older persons and informal caregivers.3
Briefly, TOPICS-CEP is a preference-weighted index ranging from 0 (worst possible general wellbeing) to 10 (best possible general wellbeing). It combines 42 data points from TOPICS-MDS covered by eight components: morbidities (a list of 17 predefined conditions used in the Netherlands),4 functional limitations (Katz index of independence),5 emotional wellbeing (mental health subscale of the RAND-36),6 pain experience (pain dimension of the EQ-5D),7 cognitive problems (cognition dimension of the EQ-5D+C),7 social functioning (item 10 from the RAND-36),6 self-perceived health (item 1 from the RAND-36),6 self-perceived quality of life (QOL) (phrasing similar to the self-perceived health item from the RAND-36). The data points included in TOPICS-CEP regard all the variables (or items) from TOPICS-MDS for older persons that carry information relevant for understanding an individual’s outcome. This excludes demographics and health service utilization. Excluding these components was based on the rationale that demographics such as sex and age and health service utilization cannot be influenced by health care delivery. Detailed information about the development of TOPICS-CEP can be found elsewhere.3, 8
Previous research has shown that variation in health-state preferences is influenced by various characteristics such as sex, age, and current health.9-13 This variability means that the value of a particular health status depends on who served as participants

46
CHAPTER 3
when evaluating the various health states. The variability can be explained by, eg, one’s reference point, perspective, and coping strategies. TOPICS-CEP was established based on the health-state preferences of a heterogeneous group of raters. Results from our previous study indicated that the preference weights of older persons and informal caregivers were not significantly different.3
This study aimed: 1) to explore whether the age of our raters systematically influenced the preference weights of TOPICS-CEP components, and 2) to examine how age-based preference weights affected TOPICS-CEP scores. The framework we used can be found in Figure 1.
3.2 Methods
Ethical approvalThe Medical Ethics Committee of the Radboud University Medical Center formally stated that this study was exempt from ethical review (Radboud University Medical Center Ethical Committee review reference number: CMO: 2010/244).
Study designA vignette study was conducted to obtain the preference weights for the eight TOPICS- CEP components: morbidities, functional limitations, emotional wellbeing, pain experience, cognitive problems, social functioning, self-perceived health, and self- perceived QOL. The participants rated the general wellbeing (GWB) of case vignettes, which were short descriptions or profiles of older persons.
ParticipantsTwo hundred persons who mastered the Dutch language sufficiently participated as raters. They were recruited and the data were collected at four academic centers (Radboud University Medical Center, University Medical Centre Groningen, Academic Medical Center, and Leiden University Medical Centre) spread over the Netherlands, covering both urban and more-rural parts of the country. All participants provided written informed consent.
MaterialIn total, 292 different versions of the same basic vignette (same items) were constructed to obtain a wide spectrum of health states. The vignettes were based on data of a sample of cases derived from the TOPICS-MDS national database, which consists of pooled data from various research projects that differ across study design, sampling framework, and inclusion criteria. By using empirical data, only vignettes with

47
THE INFLUENCE OF AGE
3
Figure 1 Study framework.
Note: Framework: combining eight components into one generic composite endpoint (TOPICS-CEP) and the influence of rater characteristics.
Dependent variable
Moderating variables
Independent variables
Morbidities
Functional limitations
Composite endpoint
Appraisal The relevance of each
of the domains
Emotional wellbeing
Pain experience
• Perspective • Coping strategies • Reference point
Cognitive problems
Social functioning
Self-perceived health
Rater characteristics such as age
Self-perceived QOL
48
CHAPTER 3
plausible health states were constructed. In general, each vignette included 46 items covering the eight previously described TOPICS-CEP components.
ProcedureThe vignette study was conducted in an environment familiar to the participant, eg, in their own home or community center, in their living area. To collect information about rater characteristics, participants were first asked to fill in the TOPICS-MDS themselves; the participants who did not provide informal care to anyone filled in the TOPICS-MDS for care receivers and the informal caregivers filled in the TOPICS-MDS for caregivers.14, 15 Then, the participants were asked to assess the GWB of two trial cases (which were the same for every participant) and ten randomly assigned cases on a 0–10 scale (worst to best). The participants were allowed to use one decimal; this scale is in line with the Dutch grading system and was therefore well known to our participants.
Statistical analysesMixed linear regression analysis was used to study the influence of the raters’ age on the TOPICS-CEP preference weights. The model had the following structure: 1) the GWB scores were used as the dependent variable; 2) the eight CEP components were used as independent variables; 3) to correct for clustering within raters, a random (rater dependent) intercept was included; and 4) the factor age was included in the model together with the interaction terms with each of the CEP components (eg, age × morbidities). The parameter estimates (unstandardized coefficients) for the eight components represent the preference weights. We examined how age-based preference weights would affect TOPICS-CEP scores of our vignette cases by means of a paired-sample t-test and a Bland–Altman plot.
3.3 Results
The mean age ± standard deviation (SD) of the 200 raters was 72.5±11.8 years.
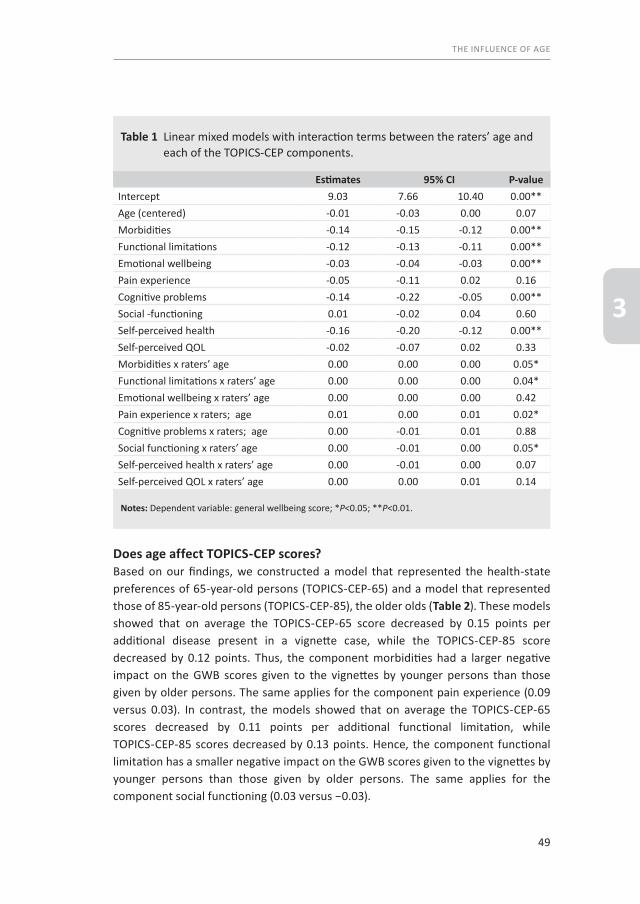
Does age influence TOPICS-CEP’s preference weights?The interaction effects between age and TOPICS-CEP components morbidities, functional limitations, pain experience, social functioning, and self-perceived health, respectively, were found to be significant (P<0.05) (Table 1). On average, the older raters gave significantly (P<0.05) more weight to functional limitations and social functioning and less to morbidities and pain experience, in comparison to younger raters.
49
THE INFLUENCE OF AGE
3
Does age affect TOPICS-CEP scores?Based on our findings, we constructed a model that represented the health-state preferences of 65-year-old persons (TOPICS-CEP-65) and a model that represented those of 85-year-old persons (TOPICS-CEP-85), the older olds (Table 2). These models showed that on average the TOPICS-CEP-65 score decreased by 0.15 points per additional disease present in a vignette case, while the TOPICS-CEP-85 score decreased by 0.12 points. Thus, the component morbidities had a larger negative impact on the GWB scores given to the vignettes by younger persons than those given by older persons. The same applies for the component pain experience (0.09 versus 0.03). In contrast, the models showed that on average the TOPICS-CEP-65 scores decreased by 0.11 points per additional functional limitation, while TOPICS-CEP-85 scores decreased by 0.13 points. Hence, the component functional limitation has a smaller negative impact on the GWB scores given to the vignettes by younger persons than those given by older persons. The same applies for the component social functioning (0.03 versus −0.03).
Table 1 Linear mixed models with interaction terms between the raters’ age and each of the TOPICS-CEP components.
Estimates 95% CI P-valueIntercept 9.03 7.66 10.40 0.00**Age (centered) -0.01 -0.03 0.00 0.07Morbidities -0.14 -0.15 -0.12 0.00**Functional limitations -0.12 -0.13 -0.11 0.00**Emotional wellbeing -0.03 -0.04 -0.03 0.00**Pain experience -0.05 -0.11 0.02 0.16Cognitive problems -0.14 -0.22 -0.05 0.00**Social -functioning 0.01 -0.02 0.04 0.60Self-perceived health -0.16 -0.20 -0.12 0.00**Self-perceived QOL -0.02 -0.07 0.02 0.33Morbidities x raters’ age 0.00 0.00 0.00 0.05*Functional limitations x raters’ age 0.00 0.00 0.00 0.04*Emotional wellbeing x raters’ age 0.00 0.00 0.00 0.42Pain experience x raters; age 0.01 0.00 0.01 0.02*Cognitive problems x raters; age 0.00 -0.01 0.01 0.88Social functioning x raters’ age 0.00 -0.01 0.00 0.05*Self-perceived health x raters’ age 0.00 -0.01 0.00 0.07Self-perceived QOL x raters’ age 0.00 0.00 0.01 0.14
Notes: Dependent variable: general wellbeing score; *P<0.05; **P<0.01.

50
CHAPTER 3
Of the 292 cases described in the vignettes, the majority (96.6%, n=282) had no missing data points for the calculation of TOPICS-CEP scores. The minimum and maximum scores for the TOPICS-CEP-65 were 3.54 and 9.97, respectively, and were 3.36 and 9.90 for the TOPICS-CEP-85. Compared to TOPICS-CEP-65 scores (mean ± SD =7.46±1.17), the TOPICS-CEP-85 scores (mean ± SD =7.57±1.23) had a significantly higher mean (mean difference ± SD =0.11±0.26; P<0.001). The two TOPICS-CEP scores were highly correlated (r=0.98, P<0.001).
The Bland–Altman plot showed consistent variability and there was no trend visible across the graph (Figure 2). The average of TOPICS-CEP-65 and TOPICS-CEP-85 scores ranged from 3.48 to 9.93 (mean ± SD =7.51±1.19), and the difference between the scores ranged from −0.72 to 0.85. The average bias was −0.11±0.26, and the limits of agreements were −0.63 and 0.41.
Table 2 TOPICS-CEP models based on the health state preferences of 65-year-old versus 85-year-old persons.
TOPICS-CEP-65 TOPICS-CEP-85
Intercept 9.14 8.85
Morbidities -0.15 -0.12
Functional limitations -0.11 -0.13
Emotional wellbeing -0.04 -0.13
Pain experience -0.09 0.03
Cognitive problems -0.13 -0.14
Social functioning 0.03 -0.03
Self-perceived health -0.14 -0.20
Self-perceived QOL -0.05 -0.02

51
THE INFLUENCE OF AGE
3
3.4 Discussion
Our findings suggest that the preference weights of TOPICS-CEP components derived in our previous study were influenced by our raters’ age. On average, the older the rat-er 1) the greater the impact of functional limitations and social functioning was on the GWB scores given to the vignette cases; and 2) the smaller the impact of morbidities and pain experience was on the GWB scores given to the vignette cases.
Results of the paired-sample t-test suggest that age does have an effect on health state valuations. On average, TOPICS-CEP scores of the sample cases were higher when the preference weights of the older olds are used compared those used of younger olds.
Figure 2 Bland-Altman plot of TOPICS-CEP scores based on preference weights of 65 versus 85 year olds.
Notes: Bland–Altman plot: difference between CEP scores of the vignette cases based on preferences of 65-year-old versus 85-year-old persons plotted against their average. Bold solid line represents the average difference between methods; dotted lines represent the 95% confidence limits.
Mean of TOPICS-CEP-65 and TOPICS-CEP-85 scores
10,08,06,04,0
Diffe
renc
e be
twee
n TO
PICS
-CEP
-65
and
TOPI
CS-C
EP-8
5 sc
ores
1,0
,5
,0
-,5
-1,0

52
CHAPTER 3
The Bland–Altman plot shows that TOPICS-CEP scores based on the health-state pref-erences of 65-year-old persons are systematically different from those based on the preferences of 85-year-old persons. Even though 95% of the observations were locat-ed between the limits of agreement, it is questionable whether the range of these limits was not too wide. In our opinion, the limits of agreement was relatively big (1.04 points on a 6.61 range); therefore, we proposed to alter the limits of agreement. After alteration, fewer than 95% of the observations were located between the two levels, suggesting low agreement when TOPICS-CEP-65 and TOPICS-CEP-85 scores are compared.
Preferences are known to vary by persons’ own experiences.11-13 This could possibly explain the influence of our raters’ age on the TOPICS-CEP preference weights. It is well known that prevalence of chronic conditions and multimorbidity is higher in old-er age groups and that functional limitation increases with age.16, 17 Hence, the older the rater, the higher the chance this person has experience with having one or more chronic conditions and functional limitations. The discrepancy in preference weights between younger and older persons may be explained by the reference point or framework from which people think. With multimorbidity being the norm rather than the exception for older persons, they may have accepted it as part of the normal aging process and adapted to this deterioration by altering their expectations and norms, adapting to their situation, and adjusting their standards of “good” health according-ly.18 Moreover, older persons who have experienced functional decline may under-stand the full impact of functional limitations even better than those who have not. Functional limitations does not only mean one needs daily support, but it also means loss of independence, autonomy, and dignity in some cases. 19
Benefits and limitations of the studyThe benefit of this study is to give more insight into the influence of raters’ age on individual health domains as well as overall value. However, we need to contextualize the findings in light of some limitations. Even though we have explored the influence of raters’ age, other characteristics may have influenced the TOPICS-CEP preference weights. The influence of age might have been biased by the omission of other variables, such as socioeconomic status and multimorbidity.20 However, because the raters were recruited in both urban and more-rural parts of the Netherlands, and because the number of morbidities within our study sample was equally distributed, we do not expect socioeconomic status and multimorbidity to have influenced our findings. Additionally, we have explored whether observed characteristics such as raters’ role as informal caregiver (previous study) and raters’ sex, self-perceived health state, and self-perceived QOL influenced our results, which was not the case (analyses not shown). Moreover, even though we have established that the

53
THE INFLUENCE OF AGE
3
preference weights of TOPICS-CEP need to be adjusted for the age distribution of the Dutch population aged 65 years and older, further investigations are necessary to assess the reliability, validity, and generalizability of TOPICS-CEP.
Benefits and limitations of TOPICS-CEPThe benefits of using TOPICS-MDS (questionnaire) and TOPICS-CEP (scores) are that a range of important endpoints will be collected and incorporated in a single metric, which can index the overall impact of interventions in a standardized way. Consequently, establishing the value of interventions will be easier and more objective, and investigators do not need to make arbitrary choices when deciding which measure to elect as primary outcome measure. Moreover, TOPICS-CEP establishes a link between various health domains and a measurement of general wellbeing.
The limitations of using TOPICS-CEP are that the scores can be difficult to interpret, as the observed effect of TOPICS-CEP does not necessarily reflect the effects of the single components. Incorrect interpretation may result in overestimation of the effects of an intervention. Therefore, we recommend reporting the effects of an intervention not only on TOPICS-CEP scores but also on the eight components separately. Further, TOPICS-CEP’s content has not yet been mapped to the International Classification of Functioning, Disability, and Health (ICF), which is a classification framework of health and health-related conditions developed by the World Health Organization that aims at providing a unified and standardized language for describing and classifying health domains and health-related states, thus providing a common framework for the development of outcome measures.21 To compare TOPICS-CEP results with results obtained by means of instruments that have been mapped to ICF categories, further investigation is necessary to link TOPICS-CEP components to ICF categories.
3.5 Summary
This current study provides evidence that the relative weights of health domains vary by the age of the raters who assessed the described health states; the older olds preferred functional independence while the younger olds preferred less morbidity. These variations imply that the preference weights that were obtained in our previous study and were used to establish TOPICS-CEP are a result of our random selection of participants. Therefore, we adjusted the preference weights of TOPICS-CEP for the age distribution of the Dutch population aged 65 years and older. These weights can be found in TOPICS-CEP guideline, which is available online.8 To our knowledge, TOPICS-CEP is the first generic composite endpoint in geriatric care based on health valuations of the Dutch older population aged 65 years and older.
54
CHAPTER 3
3.6 Conclusion
Researchers examining the effectiveness of health care interventions in elderly care need to consider the discrepancies between the health-state preferences of younger and older persons when choosing or developing outcome measures. Failure to recognize these discrepancies may lead to incorrect interpretation of the findings and consequently the establishment of inappropriate health care policies. Furthermore, in clinical decision making, health care professionals need to be aware of this discrepancy as well. Therefore, we highly recommend shared decision making in geriatric care

55
THE INFLUENCE OF AGE
3
3.7 References1. Fried LP, Ferrucci L, Darer J, Williamson JD, Anderson G. Untangling the concepts of disability, frailty,
and comorbidity: implications for improved targeting and care. The journals of gerontology Series A, Biological sciences and medical sciences. 2004;59(3):255-63.
2. Lutomski JE, Baars MA, Schalk BW, Boter H, Buurman BM, den Elzen WP, et al. The development of the Older Persons and Informal Caregivers Survey Minimum DataSet (TOPICS-MDS): a large-scale data sharing initiative. PloS one. 2013;8(12):e81673.
3. Hofman CS, Makai P, Boter H, Buurman BM, de Craen AJ, Olde Rikkert MG, et al. Establishing a composite endpoint for measuring the effectiveness of geriatric interventions based on older persons’ and informal caregivers’ preference weights: a vignette study. BMC geriatrics. 2014;14(1):51.
4. Lokale en nationale monitor gezondheid (In Dutch only) Lokale en nationale monitor gezondheid [cited 2013 May 15]. Available from: https://www.monitorgezondheid.nl/gezondheidindicatoren.aspx.
5. Laan W, Zuithoff NP, Drubbel I, Bleijenberg N, Numans ME, de Wit NJ, et al. Validity and reliability of the katz-15 scale to measure unfavorable health outcomes in community-dwelling older people. The journal of nutrition, health & aging. 2014;18(9):848-54.
6. Hays RD, Morales LS. The RAND-36 measure of health-related quality of life. Annals of medicine. 2001;33(5):350-7.
7. Krabbe PF, Stouthard ME, Essink-Bot ML, Bonsel GJ. The effect of adding a cognitive dimension to the EuroQol multiattribute health-status classification system. Journal of clinical epidemiology. 1999;52(4): 293-301.
8. Hofman CS, Melis RJF, Donders ART, Makai P, OldeRikkert MGM. The Older Persons and Informal Caregivers Survey - Composite Endpoint (TOPICS-CEP) Guidelines version 1.1. The Older Persons and Informal Caregivers Survey Minimum DataSet (TOPICS-MDS) [cited 2015 21 october]. Available from: http://topics-mds.eu/wp-content/uploads/2014/03/TOPICS-CEP-Guidelines-Version-1.1.pdf.
9. Dolan P. Effect of age on health state valuations. Journal of health services research & policy. 2000;5(1):17-21.
10. Wittenberg E, Halpern E, Divi N, Prosser LA, Araki SS, Weeks JC. The effect of age, race and gender on preference scores for hypothetical health states. Quality of life research : an international journal of quality of life aspects of treatment, care and rehabilitation. 2006;15(4):645-53.
11. Dolan P, Roberts J. To what extent can we explain time trade-off values from other information about respondents? Social science & medicine. 2002;54(6):919-29.
12. Kind P, Dolan P. The effect of past and present illness experience on the valuations of health states. Medical care. 1995;33(4 Suppl):AS255-63.
13. Wittenberg E, Winer EP, Weeks JC. Patient utilities for advanced cancer: effect of current health on values. Medical care. 2005;43(2):173-81.
14. The Older Persons and Informal Caregiver Survey (TOPICS) for Care receivers - Baseline The Older Persons and Informal Caregivers Survey Minimum DataSet (TOPICS-MDS) [cited 2015 21 October]. Available from: http://topics-mds.eu/wp-content/uploads/2014/03/Baseline-Questionnaire_Participant.pdf.
15. The Older Persons and Informal Caregiver Survey (TOPICS) for Caregivers - Baseline The Older Persons and Informal Caregivers Survey Minimum DataSet (TOPICS-MDS) [cited 2015 21 October]. Available from: http://topics-mds.nl/wordpress/wp-content/uploads/2013/09/Baseline-Questionnaire_Caregiver.pdf.
16. Nationaal Kompas Volksgezondheid. Lichamelijk functioneren: Hoeveel mensen hebben beperkingen? Bilthoven, The Netherlands: Rijksinstituut voor Volksgezondheid en Milieu; 2014 [cited 2014 8 October]. Available from: http://www.nationaalkompas.nl/gezondheid-en-ziekte/functioneren-en-kwaliteit-van- leven/lichamelijk-functioneren/hoeveel-mensen-hebben-beperkingen.
17. Oostrom SHv. Multimorbiditeit en comorbiditeit in de Nederlandse bevolking: gegevens van huisartsen-praktijken 2011. Available from: http://www.nivel.nl/node/2430?database=ChoicePublicat&priref=4061.
18. Loffler C, Kaduszkiewicz H, Stolzenbach CO, Streich W, Fuchs A, van den Bussche H, et al. Coping with multimorbidity in old age--a qualitative study. BMC family practice. 2012;13:45.
19. Woolhead G, Calnan M, Dieppe P, Tadd W. Dignity in older age: what do older people in the United Kingdom think? Age and ageing. 2004;33(2):165-70.
56
CHAPTER 3
20. Fried TR, McGraw S, Agostini JV, Tinetti ME. Views of older persons with multiple morbidities on competing outcomes and clinical decision-making. Journal of the American Geriatrics Society. 2008;56(10):1839-44.
21. World Health Organization. International classification of functioning, disability and health : ICF. Geneva: World Health Organization; 2001. iii, 299 p. p.

57
THE INFLUENCE OF AGE
3


Part 3The relevance of TOPICS-CEP


Published as: Adapted Bland-Altman method was used to compare measurement methods with unequal observations per case
C.S. Hofman, R.J.F. Melis, A.R.T. Donders
J Clin Epidemiol. 2015 Aug;68(8):939-43. Doi:10.1016/j.clinepi.2015.02.015.
Chapter 4Development of a method to compare one self-assessment versus multiple peer-assessments

62
CHAPTER 4
Abstract
ObjectivesTo describe an adjustment of the Bland-Altman approach to evaluate possible patterns of discord between two measurement methods with an unequal number of observations per case.
Study Design and SettingTwo methods of adaptation were compared using self-assessed general wellbeing scores (one individual rater) and scores given by multiple external raters for illustration. Both empirical data derived from the Older Person’s Relevant Outcome of Care Score study and simulated data were used.
Results When the mean of a number of assessments [ ] is compared with a single assessment [Y], the variation [ -Y] (vertical axis) will be correlated with the mean of and Y (horizontal axis) because the means of scores given by a larger group of raters tend to be less extreme than the scores given by individual raters. In contrast, in the absence of discord patterns, the variation [ -Y] will not be correlated with the mean of all observations Xi and Yj made irrespective of who made them as denominator in the Bland-Altman plot. Thus, the second approach should be used for the valuation.
ConclusionThe Bland-Altman approach needs correct adaptations, else artificial biases may occur.
63
ADAPTING THE BLAND-ALTMAN METHOD
4
4.1 Introduction
The Bland-Altman approach is a very often used method for studies that examine the agreement between two methods of the same medical measurement or between two raters. 1-3 Briefly, the Bland-Altman method calculates the mean difference between two methods of measurement (the ‘’bias’’) and 95% limits of agreement as the mean difference [1.96 standard deviation (SD)]. The Bland-Altman plot displays the difference between the measurements by two methods (vertical axis) against their mean (horizontal axis), and limits of agreement can be added. Moreover, a regression line can help to detect a non-consistent systematic bias. The existence of a non-consistent bias indicates that the difference between the methods is relative to the size of the measurement. In contrast, a fixed or consistent bias indicates that the difference between the methods is equal for all sizes of the measurement.
Although agreement is often examined between individual raters, there are situations where agreement is needed between two groups of raters. For example, quality of life (QOL) is a subjective concept and should therefore be captured directly from the patient. However, proxy reporting of QOL is widespread, particularly in pediatric studies where children have been considered to be unreliable respondents 4, 5 and in studies where the respondents have cognitive impairments.6, 7 When the agreement between two groups of raters of unequal sizes is examined, the Bland-Altman method requires adjustment. In this article, we describe how the method should be adapted when the agreement between two measurement methods with an unequal number of observations per case is examined. We shall focus on the possible patterns of discord.
As a part of the Older Persons’ Relevant Outcome of Care Score (OPROCS) project, we aim to investigate the agreement and possible patterns of discord between the general wellbeing (GWB) scores older persons (our cases) gave themselves (N = 1) and the scores they were given by external raters (N ≥ 1), for example, informal caregivers, doctors, nurses.8 If we were to evaluate the agreement and possible patterns of discord between the self- assessment scores of the cases and the GWB score each case was given by one single external rater, the standard Bland-Altman approach could have been used: plotting the difference between the self-assess-ment scores and external GWB scores on the vertical axis vs. the average of both scores on the horizontal axis. Visual inspection and linear regression could then be used to investigate trends and relationships between the horizontal and the vertical axis. Yet, in the OPROCS project, we are primarily interested in the patterns of discord between multiple groups with an unequal number of raters.8 For example, we are interested to compare the self-assessment scores of our cases with the GWB scores
64
CHAPTER 4
given by multiple external raters who are aged 65 years and older. This is the most extreme example of unequally sized groups: one observation vs. multiple observations. The obvious extension of the Bland-Altman method would be to plot the difference between the mean of the scores of the external raters and the self-assessment score (vertical axis) vs. the average of the mean scores of the external raters and the self-assessment score (horizontal axis). However, this will cause misleading results. The plot will suggest an apparent bias, when in fact there is none. This is because the mean of scores given by a larger group of raters tends to be less extreme than the scores given by individual raters. Therefore, the difference between the mean score of the external raters and the self-assessment score should be plotted vs. the mean of all scores independent of the rater. This is somewhat paradoxical because for the bias between the mean score given by external raters and the self- assessment score [ -Y], the single score of the elderly person [Y] has the same weight as the mean scores of all external raters together [ ], whereas for the overall mean of the scores, the self-assessment score has the same weight as the score of each of the external raters [(Ki +Y)/(Ki+1)]; thus, its impact will be negligible when the number of external raters is high.
In this article, we will describe the original Bland-Altman approach and two possible methods of adaptation in detail. Both empirical and simulation data will be used to illustrate these methods.
4.2 Methods
The Bland-Altman method for the comparison of pairs of measurements [X,Y] requires to plot the difference [X - Y] (vertical axis) against the mean [(X + Y)/2] (horizontal axis). From this plot, it is easy to assess the magnitude of disagreement, spot outliers, and see whether there is any trend, for example an increase in variance [X - Y] for high values of the mean [(X + Y)/2]. The method is based on the fact that when there is not a non-consistent systematic bias between X and Y, the correlation between [X - Y] and [(X + Y )/2] is zero and a horizontal regression line will fit the points in the plot 1.
However, when the average of a number of assessments [ ] is compared with a single assessment [Y] or when the average scores of a group of assessors [ ] is compared with the average scores of another group of assessors of a different size [ ], the differences [ - Y] and [ - ] will be correlated with the mean of [ ] and [Y] and the mean of [ ] and [ ], respectively (see Box 1). This can be explained by the fact that the means of scores given by a larger group of persons tend to be less extreme than the scores given by individual persons or smaller groups of persons. In contrast, in
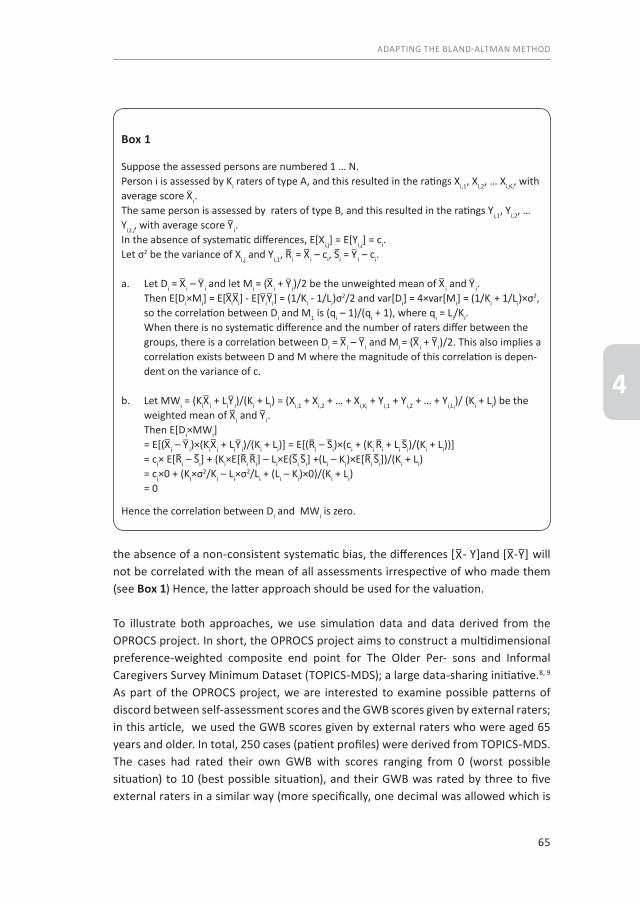
65
ADAPTING THE BLAND-ALTMAN METHOD
4
the absence of a non-consistent systematic bias, the differences [ - Y]and [ - ] will not be correlated with the mean of all assessments irrespective of who made them (see Box 1) Hence, the latter approach should be used for the valuation.
To illustrate both approaches, we use simulation data and data derived from the OPROCS project. In short, the OPROCS project aims to construct a multidimensional preference-weighted composite end point for The Older Per- sons and Informal Caregivers Survey Minimum Dataset (TOPICS-MDS); a large data-sharing initiative.8, 9 As part of the OPROCS project, we are interested to examine possible patterns of discord between self-assessment scores and the GWB scores given by external raters; in this article, we used the GWB scores given by external raters who were aged 65 years and older. In total, 250 cases (patient profiles) were derived from TOPICS-MDS. The cases had rated their own GWB with scores ranging from 0 (worst possible situation) to 10 (best possible situation), and their GWB was rated by three to five external raters in a similar way (more specifically, one decimal was allowed which is
Box 1
Suppose the assessed persons are numbered 1 … N. Person i is assessed by Ki raters of type A, and this resulted in the ratings Xi,1, Xi,2, … Xi,Ki
, with average score i.The same person is assessed by raters of type B, and this resulted in the ratings Yi,1, Yi,2, … Yi,Li
, with average score i.In the absence of systematic differences, E[Xi,j] = E[Yi,j] = ci.Let σ2 be the variance of Xi,j and Yi,1, Ri = i – ci, Si = i – ci.
a. Let Di = i – i and let Mi = ( i + i)/2 be the unweighted mean of i and i. Then E[Di×Mi] = E[ i i] - E[ i i] = (1/Ki - 1/Li)σ
2/2 and var[Di] = 4×var[Mi] = (1/Ki + 1/Li)×σ2, so the correlation between Di and M1 is (qi – 1)/(qi + 1), where qi = Li/Ki. When there is no systematic difference and the number of raters differ between the
groups, there is a correlation between Di = i – i and Mi = ( i + i)/2. This also implies a correlation exists between D and M where the magnitude of this correlation is depen-dent on the variance of c.
b. Let MWi = (Ki i + Li i)/(Ki + Li) = (Xi,1 + Xi,2 + … + Xi,Ki + Yi,1 + Yi,2 + … + Yi,Li
)/ (Ki + Li) be the weighted mean of i and i.
Then E[Di×MWi] = E[( i – i)×(Ki i + Li i)/(Ki + Li)] = E[(Ri – Si)×(ci + (Ki Ri + Li Si)/(Ki + Li))]
= ci× E[Ri – Si] + (Ki×E[Ri Ri] – Li×E(Si Si] +(Li – Ki)×E[Ri Si])/(Ki + Li) = ci×0 + (Ki×σ2/Ki – Li×σ2/Li + (Li – Ki)×0)/(Ki + Li) = 0
Hence the correlation between Di and MWi is zero.

66
CHAPTER 4
in line with the Dutch grading system). Thus, we had 250 self-assessment scores and 1,000 scores given by external raters.
For the simulation, we followed the situation described previously. We first generated 250 true scores uniformly from 4.5 to 7.5. The self-assessment scores were generated by adding a normally distributed error score (mean = 0; SD = 1.5) to the true scores. Next four external rater scores were generating by repeating this same process four times using a normal distribution for the error terms with equal mean and SD as for the self-assessment scores. Thus, self-assessment scores and external rater scores are comparable with respect to expected value and error variance (reliability). Finally, we present adapted Bland and Altman plots where we leave out the limits of agreement as the focus of this article is on biases. For the purpose of assessing non-consistent structural bias, we added a regression line to the plot. We present a traditional Bland and Altman plot based on the self-assessment scores and the average of the scores of the external rates and a Bland and Altman plot based on the suggestions made previously (ie, we use the average of all five scores for the x-axis).
4.3 Results
First, we present the results of the simulation study. Figure 1A shows the adapted Bland-Altman plot of the difference between the mean of the GWB scores given by external raters and the self-assessment scores of the cases (vertical axis) vs. the average of the mean scores by external raters and the self-assessment scores (horizontal axis) [thus (mean external scores + self-assessment score)/2]. The correlation between the mean differences and the uncorrected average of the means is 0.40; the slope of the regression line is 0.50 (P≤.001). Figure 1B shows the adapted Bland- Altman plot of the difference between the mean of the GWB scores given by external raters and the self-assessment scores of the cases (vertical axis) vs. the overall mean of the assessments irrespective of who made them (horizontal axis) [thus (mean external scores x number of external raters + self-assessment score)/(number of external raters + 1)]. The correlation between the mean differences and the corrected average of the means is 0.02, and the slope of the regression line is 0.02 (P = 0.78).
Next, we present the results from the OPROCS project. A selection of the GWB scores and corresponding means can be found in Table 1. The correlation between the mean differences and the uncorrected average of the means is 0.40; the slope of the regression line is 0.52 (P < .001; Figure 2A). The correlation between the mean differences and the corrected average of the means is 0.08, and the slope of the regression line is 0.03 (P = 0.68; Figure 2B).
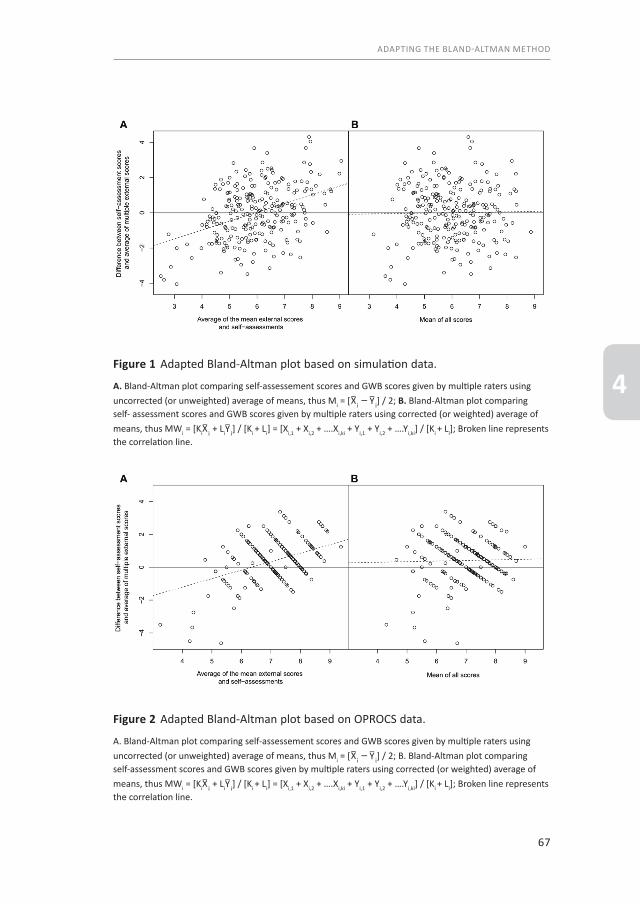
67
ADAPTING THE BLAND-ALTMAN METHOD
4Figure 1 Adapted Bland-Altman plot based on simulation data.
A. Bland-Altman plot comparing self-assessement scores and GWB scores given by multiple raters using uncorrected (or unweighted) average of means, thus Mi = [ i – i] / 2; B. Bland-Altman plot comparing self- assessment scores and GWB scores given by multiple raters using corrected (or weighted) average of means, thus MWi = [Ki i + Li i] / [Ki + Li] = [Xi,1 + Xi,2 + ….Xi,ki + Yi,1 + Yi,2 + ….Yi,ki] / [Ki + Li]; Broken line represents the correlation line.
Figure 2 Adapted Bland-Altman plot based on OPROCS data.
A. Bland-Altman plot comparing self-assessement scores and GWB scores given by multiple raters using uncorrected (or unweighted) average of means, thus Mi = [ i – i] / 2; B. Bland-Altman plot comparing self-assessment scores and GWB scores given by multiple raters using corrected (or weighted) average of means, thus MWi = [Ki i + Li i] / [Ki + Li] = [Xi,1 + Xi,2 + ….Xi,ki + Yi,1 + Yi,2 + ….Yi,ki] / [Ki + Li]; Broken line represents the correlation line.
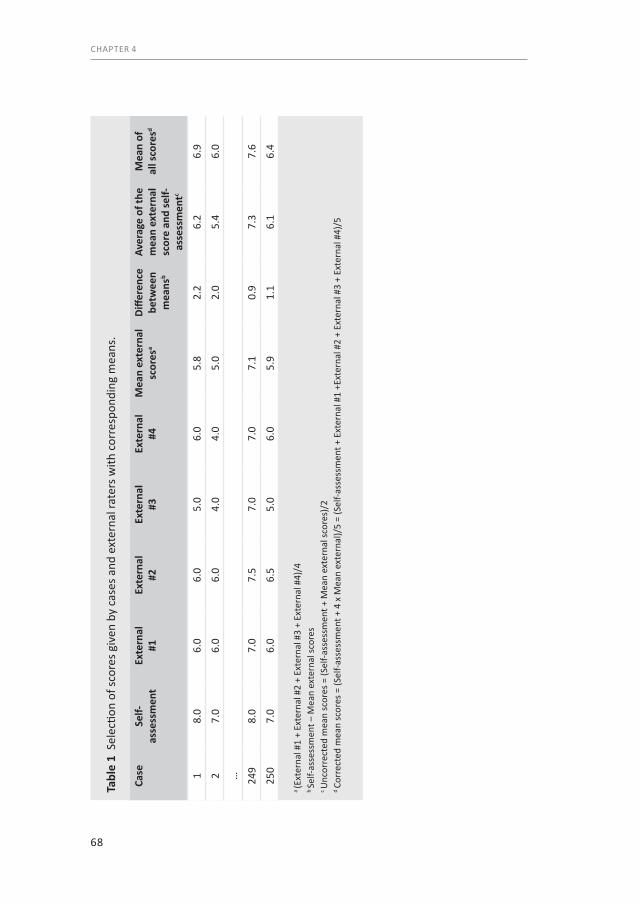
68
CHAPTER 4
Tabl
e 1
Sel
ectio
n of
scor
es g
iven
by
case
s and
ext
erna
l rat
ers w
ith c
orre
spon
ding
mea
ns.
Case
Self-
asse
ssm
ent
Exte
rnal
#1
Exte
rnal
#2
Exte
rnal
#3
Exte
rnal
#4
Mea
n ex
tern
al
scor
esa
Diffe
renc
e be
twee
n m
eans
b
Aver
age
of th
e m
ean
exte
rnal
sc
ore
and
self-
asse
ssm
entc
Mea
n of
al
l sco
resd
18.
06.
06.
05.
06.
05.
82.
26.
26.
9
27.
06.
06.
04.
04.
05.
02.
05.
46.
0
… 249
8.0
7.0
7.5
7.0
7.0
7.1
0.9
7.3
7.6
250
7.0
6.0
6.5
5.0
6.0
5.9
1.1
6.1
6.4
a (E
xter
nal #
1 +
Exte
rnal
#2
+ Ex
tern
al #
3 +
Exte
rnal
#4)
/4b Se
lf-as
sess
men
t – M
ean
exte
rnal
scor
esc U
ncor
rect
ed m
ean
scor
es =
(Sel
f-ass
essm
ent +
Mea
n ex
tern
al sc
ores
)/2
d Co
rrec
ted
mea
n sc
ores
= (S
elf-a
sses
smen
t + 4
x M
ean
exte
rnal
)/5
= (S
elf-a
sses
smen
t + E
xter
nal #
1 +E
xter
nal #
2 +
Exte
rnal
#3
+ Ex
tern
al #
4)/5

69
ADAPTING THE BLAND-ALTMAN METHOD
4
Hence, although Figures 1A and 2A suggest there is a non-consistent systematic bias between the scores given by external raters and cases themselves (the trend line has a nonzero slope), Figures 1B and 2B suggest there is no non-consistent bias. The diagonal streaks in the plot for the OPROCS data were caused by the fact that the raters tend to give integers and half integers only although the use of one decimal was encouraged.
4.4 Discussion
Assessment methods should not be compared by plotting of [X - Y] vs. [Y].1, 10, 11 Therefore, the Bland-Altman approach is often use to compare measurement methods. In this article, we have described an adaptation of the Bland-Altman approach to the situation in which possible patterns of discord between two measurement methods with an unequal number of observations per case are explored. Similar to Bland and Altman, we assumed that the data were approximately normally distributed, but for skewed data, a logarithmic transformation may be considered.2, 12, 13
70
CHAPTER 4
4.5 References1. Altman DG, Bland JM. Measurement in Medicine - the Analysis of Method Comparison Studies.
Statistician. 1983;32(3):307-17. PubMed PMID: ISI:A1983RP04600005. English.2. Bland JM, Altman DG. Statistical methods for assessing agreement between two methods of clinical
measurement. Lancet. 1986;1(8476):307-10. PubMed PMID: 2868172. English.3. Ryan TP, Woodall WH. The most-cited statistical papers. J Appl Stat. 2005 Jul;32(5):461-74. PubMed
PMID: ISI:000230456200002. English.4. Barbosa TS, Gaviao MB. Oral health-related quality of life in children: part III. Is there agreement between
parents in rating their children’s oral health-related quality of life? A systematic review. International journal of dental hygiene. 2008 May;6(2):108-13. PubMed PMID: 18412722. Epub 2008/04/17. eng.
5. Upton P, Lawford J, Eiser C. Parent-child agreement across child health-related quality of life instruments: a review of the literature. Quality of life research : an international journal of quality of life aspects of treatment, care and rehabilitation. 2008 Aug;17(6):895-913. PubMed PMID: 18521721. Epub 2008/ 06/04. eng.
6. Bullinger M, Azouvi P, Brooks N, Basso A, Christensen AL, Gobiet W, et al. Quality of life in patients with traumatic brain injury-basic issues, assessment and recommendations. Restorative neurology and neuroscience. 2002;20(3-4):111-24. PubMed PMID: 12454360. Epub 2002/11/28. eng.
7. Shearer J, Green C, Ritchie CW, Zajicek JP. Health State Values for Use in the Economic Evaluation of Treatments for Alzheimer’s Disease. Drugs & aging. 2012;29(1):31-43. PubMed PMID: ISI:000300385800004. English.
8. Hofman CS, Makai P, Boter H, Buurman BM, de Craen AJ, Olde Rikkert MG, et al. Establishing a composite endpoint for measuring the effectiveness of geriatric interventions based on older persons’ and informal caregivers’ preference weights: a vignette study. BMC geriatrics. 2014;14(1):51. PubMed PMID: 24742136. Pubmed Central PMCID: 4021341. Epub 2014/04/20. eng.
9. Lutomski JE, Baars MA, Schalk BW, Boter H, Buurman BM, den Elzen WP, et al. The development of the Older Persons and Informal Caregivers Survey Minimum DataSet (TOPICS-MDS): a large-scale data sharing initiative. PloS one. 2013;8(12):e81673. PubMed PMID: 24324716. Pubmed Central PMCID: 3852259. Epub 2013/12/11. eng.
10. Bland JM, Altman DG. A Note on the Use of the Intraclass Correlation-Coefficient in the Evaluation of Agreement between 2 Methods of Measurement. Comput Biol Med. 1990;20(5):337-40. PubMed PMID: ISI:A1990EG10500005. English.
11. Bland JM, Altman DG. Comparing Methods of Measurement - Why Plotting Difference against Standard Method Is Misleading. Lancet. 1995 Oct 21;346(8982):1085-7. PubMed PMID: ISI:A1995TA69700017. English.
12. Bland JM, Altman DG. Measuring agreement in method comparison studies. Stat Methods Med Res. 1999 Jun;8(2):135-60. PubMed PMID: ISI:000083700100004. English.
13. Euser AM, le Cessiec S, Finken MJJ, Wit JM, Dekker FW. Reliability studies can be designed more efficiently by using variance components estimates from different sources. Journal of clinical epidemiology. 2007 Oct;60(10):1010-4. PubMed PMID: ISI:000249956500004. English.

71
ADAPTING THE BLAND-ALTMAN METHOD
4

In press as: Examining consistency between self-assessed QOL and peer ratings in older people.
C.S, Hofman, J.E. Lutomski, M.G.M. Olde Rikkert, R.J.F. Melis, A.R.T Donders
Journal of the American Geriatrics Society
Chapter 5Comparing self-assessment versus peer-assessments

75
COMPARING SELF-ASSESSMENT VERSUS PEER-ASSESSMENTS
5
To the Editor:The concepts ‘quality of life’ and, more specifically, ‘health-related quality of life’ (HRQOL) refer to the physical, psychological, and social domains of health.1 These domains can be measured in two dimensions: objective assessment and more subjective perceptions of health status.2 Although the objective assessment of a person’s functioning on a number of health domains is important in defining a patient’s degree of health, the patient’s subjective perceptions translate that objective assessment into the actual QOL experienced. These valuations of specific health-related outcomes are called health utilities.3
To answer the question ‘What is the effect of the intervention on patients’ day-to-day QOL?’ one can ask them to simply rate their perceived QOL. However, such subjective assessment of HRQOL not only depends on the effect of the intervention, but also on other (health related) events. Moreover, subjective assessments are subject to artefacts such as response shift effects. Response shift gives patients the ability to cope with limitations and disability, which greatly affect a person’s perception of health and satisfaction with life.
Even though self-rated QOL provides useful global assessments of perceived QOL in individuals , peers may provide complementary information on the utility of health states that is of great interest to fully understand the value of a certain health outcomes. We investigated the systematic differences between these two perspectives on how QOL is perceived by older persons themselves and how their QOL is rated by peers.
5.1 Methods
Data were derived from the OPROCS Study.4 In total, 292 vignette cases were constructed based on data derived from The Older Persons and Informal Caregivers Survey Minimum Dataset.5 The cases described in the vignettes rated their own situation on a scale from zero to ten (worst to best possible situation) to one decimal place, which is in line with the Dutch grading system. In a similar manner, a panel of older adults serving as external raters (N=124) were asked to rate the situation of 10 randomly assigned cases. Consequently, each vignette case had one self-rated score and three to five scores given by external raters (peers).
An adapted Bland-Altman plot was derived to evaluate levels of agreement between self- and peer-ratings as well as identify patterns of discrepancy.6 For the purpose of this study, we decided a priory that a threshold of ± 0.50 (on a scale of 0-10) would be

76
CHAPTER 5
applied for the discrepancy between self- and peer-rated scores. Significant differences in mean self-rated and peer-rated scores were determined using a t-test (SPSS version 20.0; SPSS IBM, New York, USA).
5.2 Results
The self- and peer-rated scores ranged from 1.5 to 10 and from 2.0 to 10 respectively. The differences between self- and mean peer-rated scores for the same vignette ranged from -4.6 to 3.4. The mean of self- and peer-rated scores ranged from 4.3 to 9.0. Of the 1,240 peer ratings, 24.6% (n=305) were identical to self-rated scores. Figure 1 shows the adapted Bland-Altman plot of the difference between the mean of the peer-ratings and the self-rated scores of the cases versus the combined overall mean of self-rated and peer-rated scores. There was no trend visible. Vignette scores (standard deviations) were significantly different between self- and peer-ratings [self: 7.4 (±1.3), peer: 6.9 (±0.9), p<.001]. The upper and lower levels of agreement were -1.9 and 2.9 respectively, which exceeded our predefined threshold of ± 0.50 for relevant differences. In 196 (67%) vignettes the difference exceeded the threshold.
5.3 Discussion
Given the wide levels of agreement between the self- and peer-rated scores (± 2.4), our findings suggest that these scores are not interchangeable, but rather self- and peer-rated assessments are complementary to each other. As the first gives insight into how patients experience their QOL at a given time, while the second gives insight into how the population to which the patient belongs would assess the QOL on average.
As it is impossible to continuously ask peers to evaluate a patient’s QOL we established an outcome measure based on health valuations made by Dutch older persons aged 65 years and over.4 The measure is multifaceted and combines outcomes collected by The Older Persons and Informal Caregivers Survey – Minimum DataSet (TOPICS-MDS).5
The assessment of longitudinal change in HRQOL is a key component of many clinical and research evaluations. Peer-ratings may provide useful complementary insight into perceived QOL to understand the utility of health states relevant for older persons. Yet, it is necessary to tests systematic differences between self- and peer-as-sessment within various patient groups.

77
COMPARING SELF-ASSESSMENT VERSUS PEER-ASSESSMENTS
5Figure 1
Adapted Bland-Altman plot of the difference between the mean of the proxy ratings and the self-assessed ratings of the cases (vertical axis) versus the overall mean of both sets of ratings (horizontal axis). Red bold solid line represents the average difference between self-rated and proxy-rated scores; red bold dotted lines represent the 95% levels of agreement. Black solid line represents the zero bias line; black dotted lines represent the predefined a threshold of ± 0.50.
Means of both self-rated and proxy-rated scores per case9,008,007,006,005,004,00
Diffe
renc
es b
etw
een
self-
rate
d sc
ore
and
aver
age
of
prox
y-ra
ted
scor
es p
er c
ase
5,0
4,0
3,0
2,0
1,0
,0
-1,0
-2,0
-3,0
-4,0
-5,0
78
CHAPTER 5
5.4 References1. Patrick DL, Bush JW, Chen MM. Toward an operational definition of health. Journal of health and social
behavior. 1973 Mar;14(1):6-23. PubMed PMID: 4708414.2. Bergner M. Quality of life, health status, and clinical research. Medical care. 1989 Mar;27(3 Suppl):S148-
56. PubMed PMID: 2646487.3. Whitehead SJ, Ali S. Health outcomes in economic evaluation: the QALY and utilities. British medical
bulletin. 2010;96:5-21. PubMed PMID: 21037243.4. Hofman CS, Makai P, Boter H, Buurman BM, de Craen AJ, Olde Rikkert MG, et al. Establishing a
composite endpoint for measuring the effectiveness of geriatric interventions based on older persons’ and informal caregivers’ preference weights: a vignette study. BMC geriatrics. 2014;14:51. PubMed PMID: 24742136. Pubmed Central PMCID: 4021341.
5. Lutomski JE, Baars MA, Schalk BW, Boter H, Buurman BM, den Elzen WP, et al. The development of the Older Persons and Informal Caregivers Survey Minimum DataSet (TOPICS-MDS): a large-scale data sharing initiative. PloS one. 2013;8(12):e81673. PubMed PMID: 24324716. Pubmed Central PMCID: 3852259.
6. Hofman CS, Melis RJ, Donders AR. Adapted Bland-Altman method was used to compare measurement methods with unequal observations per case. Journal of clinical epidemiology. 2015 Aug;68(8):939-43. PubMed PMID: 25895962.

79
COMPARING SELF-ASSESSMENT VERSUS PEER-ASSESSMENTS
5

Published as:Comparing the health state preferences of older persons, informal caregivers and healthcare professionals: A vignette study
C.S. Hofman, P. Makai, J.W. Blom, H. Boter,B.M. Buurman, M.G.M. Olde Rikkert, A.R.T. Donders, R.J.F. Melis
PloS One. 2015 Mar 4; 10(3). Doi: 10.1371/journal.pone.0119197.
Chapter 6Comparing health state preferences of older persons and healthcare professionals
82
CHAPTER 6
Abstract
BackgroundThe Older Persons and Informal Caregivers Survey Minimum Dataset (TOPICS-MDS) collects uniform information from research projects funded under the Dutch National Care for the Elderly Programme. To compare the effectiveness of these projects a preference-weighted outcome measure that combined multidimensional TOPICS-MDS outcomes into a composite endpoint (TOPICS-CEP) was developed based on the health state preferences of older persons and informal caregivers.
ObjectivesTo derive preference weights for TOPICS-CEP’s components based on health state preferences of healthcare professionals and to investigate whether these weights differ between disciplines and differ from those of older persons and informal caregivers.
Materials and MethodsVignette studies were conducted. Participants assessed the general wellbeing of older persons described in vignettes on a scale (0-10). Mixed linear analyses were used to obtain and compare the preference weights of the eight TOPICS-CEP components: morbidities, functional limitations, emotional wellbeing, pain experience, cognitive problems, social functioning, self-perceived health, and self-perceived quality of life (QOL).
ResultsOverall, 330 healthcare professionals, 124 older persons and 76 informal caregivers participated. The preference weights were not significantly different between disciplines. However, the professionals’ preference weights differed significantly from those of older persons and informal caregivers. Morbidities and functional limitations were given more weight by older persons and informal caregivers than by healthcare professionals [difference between preference weights: 0.12 and 0.07] while the opposite was true for pain experience, social functioning, and self-perceived QOL [difference between preference weights: 0.13, 0.15 and 0.26].
ConclusionIt is important to recognize the discrepancies between the health state preferences of various stakeholders to (1) correctly interpret results when studying the effectiveness of interventions in elderly care and (2) establish appropriate healthcare policies. Furthermore, we should strive to include older persons in our decision making process through a shared decision making approach.
83
OLDER PERSONS VERSUS HEALTHCARE PROFESSIONALS
6
6.1 Background
The population is aging across the world. This demographic shift will lead to extra- ordinary demands on our healthcare system.1 With the limited financial resources and insufficient number of healthcare professionals, evaluating the effectiveness of healthcare interventions has become an integral part of health policy and decision- making.2 However, it is a great challenge to evaluate interventions for elderly because their health states are complex and interventions often target more than one domain.3
An expert panel of The American Geriatrics Society formulated guiding principles on how clinicians should approach the care of older adults with multi-morbidity. Several steps were defined including “Consider patient preferences” and “Is relevant evidence available regarding important outcomes?”. These principles are also crucial for researchers evaluating the effectiveness of intervention in older adults.4 Hence, a generic measurement instrument with a composite endpoint (CEP) that is preference based and includes important outcomes would be helpful to compare outcomes across groups, thereupon, to establish and compare the effectiveness of different geriatric interventions.5,6
The Dutch National Care for the Elderly Programme (NCEP) was established in 2008 to promote proactive, integrated healthcare for older persons with complex healthcare needs.7 Within the NCEP The Older Persons and Informal Caregivers Survey Minimum DataSet (TOPICS-MDS) was developed to collect uniform information from all research project funded under this Programme. A detailed description of TOPICS-MDS has been presented elsewhere.8 Briefly, TOPICS-MDS is a collection of four validated instruments which was designed to collect essential information on the physical and mental wellbeing of older persons and informal caregivers in the Netherlands.9,10 The survey was administered in multiple research settings to elicit uniform outcome data in the aim of creating a national data repository on older persons’ health. Over 60 NCEP research projects have already incorporated TOPICS-MDS in their research protocol and evaluated more than 32,000 participating elderly using the survey.8
To compare the effectiveness of these projects a preference-weighted outcome measure that combined multidimensional TOPICS-MDS outcomes into a composite endpoint (TOPICS-CEP) was developed based on the health state preferences of older persons and informal caregivers.11 The benefit of using TOPICS-CEP is that the overall value of interventions can be calculated in a standardized manner which makes the evaluation process easier and more objective.

84
CHAPTER 6
Briefly, TOPICS-CEP is a preference-weighted index ranging from 0 (worst possible general wellbeing) to 10 (best possible general wellbeing). It combines 42 data points from TOPICS-MDS covered by eight components, such as functional limitations (Katz index of independence)12 and emotional wellbeing (mental health subscale of the RAND-36).13 The components vary in both scale range and preference weight. Raw TOPICS-CEP scores are transformed into indexed scores. More detailed information about the development of TOPICS-CEP and its scoring procedure can be found elsewhere.11,14
The various stakeholders in geriatrics share a mutual goal which is to improve a person’s health and wellbeing. However, studies have shown significant differences between the perspectives of older persons and their healthcare professionals.15,16 Consequently, we expected that the preference weights of the TOPICS-CEP’s components would differ between those of older persons and their healthcare professionals, which could potentially lead to treatment decisions by professionals that are at odds with patient preferences and to incorrect interpretation of findings in effectiveness studies. For that reason, we explored the TOPICS-CEP components’ weights based on the health state preferences of healthcare professionals in this current study and compared them with the weights based on the health state preferences of older persons and informal caregivers found in our previous study.
In short, the primary objectives of this study were: (1) to examine the association of preference weights with the healthcare professionals’ characteristics; (2) to examine the difference between healthcare professionals’ preference weights and those of older persons and informal caregivers; and (3) to explore the influence of the cases’ gender and age on the distribution of the composite scores.
6.2 Materials and Methods
Ethical approvalThe Medical Ethics Committee of the Radboud University Medical Center formally stated that this study was exempt from ethical review (Radboud University Medical Center Ethical Committee review reference number: CMO: 2010/244). Written informed consent was obtained from the older persons and informal caregivers who participated in our previous study.
85
OLDER PERSONS VERSUS HEALTHCARE PROFESSIONALS
6
Study design Vignette studies were conducted to obtain the preference weights for the eight TOPICS-CEP components: morbidities (list of 17 pre-defined conditions)17, functional limitations (Katz index of independence)12, emotional wellbeing (mental health subscale of the RAND-36)13, pain experience (pain dimension of the EQ-5D)18, cognitive problems (cognition dimension of the EQ-5D+C)18, social functioning (item 10 from the RAND-36)13, self-perceived health (item 1 from the RAND-36)13, self-perceive QOL (phrasing similar to self-perceived health item from the RAND-36).13 The participants rated the general wellbeing (GWB) of case vignettes, which were short descriptions or profiles of older persons (further called: cases).
ParticipantsFirst vignette study: Older persons and informal caregiversIn the first vignette study, 124 community dwelling older persons and 76 informal caregivers participated as raters. They were recruited and their data was collected by four academic centres: Radboud University Medical Center, University Medical Centre Groningen, Academic Medical Centre, and Leiden University Medical Centre. A full report and more detailed information can be found elsewhere.11 Second vignette study: Healthcare professionalsThe 330 healthcare professionals who rated the cases in the second vignette study were recruited during two national geriatric conferences in February 2012 and October 2012, via websites of various professional associations, and via the website of NCEP. The professionals worked as physicians, nurses, welfare staff or allied health professional across the Netherlands, covering both urban and more rural parts of the country.
MaterialsThe vignettes were based on data of a sample of cases derived from TOPICS-MDS data repository, which consists of pooled data from various research projects which differ across study design, sampling framework, and inclusion criteria. In general, each vignette included 46 items covering the eight previously described TOPICS-CEP components: morbidities, functional limitations, emotional wellbeing, pain experience, cognitive problems, social functioning, self-perceived health, and self-perceive QOL. The information included in the vignettes regards all the variables (or items) from TOPICS-MDS for older persons which carry information relevant for understanding an individual’s outcome. This excludes demographics and health service utilization. Excluding these components was based on the rationale that demographics such as gender and age and health service utilization cannot be influenced by healthcare delivery.

86
CHAPTER 6
By using empirical data, vignettes with plausible health state combinations were constructed. We made sure that the complete ranges of outcomes for the different health domains were covered. All raters evaluated a limited number of cases and we assured that all cases were rated by a sufficiently large number of raters. Since it was to be expected that some of the disciplines would consist of lower numbers of participants, we used a smaller set of cases in this present study. To guarantee that each discipline evaluated the complete range of the outcomes we chose a new set of cases for this study.
First vignette study: Older persons and informal caregiversThe cases (N=292) of whom the GWB were assessed by older persons and informal caregivers had a mean age (±SD) of 81.4 (5.72) years and 58.6% (N=171) was female. The majority of these cases were either married (42.8%, N=125) or their partner was deceased (42.8%, N=125), and 39.7% (N=116) lived independently with someone, e.g. a partner or family member.
Second vignette study: Healthcare professionalsThe cases (N=161) of whom the GWB were assessed by healthcare professionals had a mean age (±SD) of 82.4 (6.5) years and 67.7% (N=109) was female. The majority of these cases were either married (28.0%, N=45) or their partner was deceased (57.1%, N=92), and 43.5% (N=70) lived in either a nursing home or a residential care facility.
An overview of the health domains, items per domain, and levels per item which were included in the vignettes and used in the statistical analyses can be found in Table 1.
ProcedureAfter reading each vignette, raters were asked to give a score ranging from zero to ten representing how bad or good, in their opinion, the GWB of the described case was.
First vignette study: Older persons and informal caregiversThe vignette study within the group of older persons and informal caregivers was conducted on paper. After two trial cases, which were the same for every participant within the study, the raters were asked to give scores to a random selection of ten cases. More information about the exact procedure can be found elsewhere.11
Second vignette study: Healthcare professionalsThe healthcare professionals had the opportunity to evaluate the cases on paper or online via the website of QuestionPro (online survey software to create, publish, and

87
OLDER PERSONS VERSUS HEALTHCARE PROFESSIONALS
6
distribute online surveys); both the hardcopy and the online survey had the same format and the participants had to follow the same procedure. After a trial case, which was the same for every participant, the raters were asked to give scores to a random selection of five cases. In addition, we asked them to answer a couple of questions regarding: age, gender, occupation, number of years in this occupation, and number of patients/clients aged ≥ 65 years per week.
Statistical analysisThe statistical procedures for both vignette studies were comparable. The analyses to derive the preference weights for TOPICS-CEP’s components based on the health state preferences of older persons and informal caregivers can be found elsewhere.11 To derive the weights for the components based on the health state preferences of the healthcare professionals five mixed linear regression models were constructed. Each model had the following structure: (1) The GWB scores were used as dependent variable; (2) The eight CEP components were used as independent variables (predictors): morbidities, functional limitations, emotional wellbeing, pain experience, cognitive functioning, social functioning, self-perceived health, and self-perceived QOL; and (3) To correct for clustering within raters a random (rater dependent) intercept was included. Furthermore, we included in each model one of the following five factors: profession (physician, nurse, welfare staff, and allied health professional), physicians’ discipline (general practitioner, nursing home physician, internist, geriatrician), years of experience, number of patients aged ≥65 years per week, or rater group (healthcare professional / older person or Informal caregiver) together with the interaction between the included factor and each of the CEP components. The parameter estimates for the eight domains represent the preference weights.
Subsequently, for the cases used in both vignette studies, we described the distribution of TOPICS-CEP scores (based on the preference weights of older persons and informal caregivers) across cases’ gender and age groups and compared them with the distribution of such a composite score when one would base it on healthcare professionals’ preferences (further referred to as: HP’s CEP). A paired sample T-test was used to examine the difference between TOPICS-CEP and the HP’s CEP. In addition, to explore the level of agreement between the two composite outcome measures a Bland-Altman plot was used.

88
CHAPTER 6
Table 1 The domains, items, and aggregated items included in the vignettes with the descriptive.
Outcome domains Vignette items Outcome levels DescriptivesVignettes study: older persons
and informal caregivers
DescriptivesVignette study: Healthcare
professionals
Morbidity (Local and national health monitor)21
Presence of: Dementia; Depression; Incontinence; Stroke, CVA or TIA; Hip fracture; Panic or anxiety disorder; Dizziness with falling; Vision disorder; Asthma; Osteoporosis; Diabetes; Arthritis; Heart failure; Form of cancer; Complaints due to benign enlarged prostate; Fracture other than hip fracture; Hearing disorder
Number of diseases presentRange: 0-17
Mean: 3.5SD: 2.0
Mean: 3.3SD: 2.3
Functional limitations (modified KATZ-ADL Index)22
Needing help with: Brushing hair; Going to the toilet; Taking medication; Sitting down and getting up from chair; Getting dressed; Travelling; Handling finances; Grocery shopping; Walking about; Taking a bath or shower; Housekeeping; Preparing a meal; Eating; Using the telephone
Number of limitations in (I)ADLRange: 0-15
Mean: 3.0SD: 3.5
Mean: 4.4SD: 4.2
Emotional wellbeing (RAND-36, mental health subscale)23
Feeling down; Feeling blue; Feeling nervous; Feeling happy; Feeling calm
Raw mental health scoreRange: 5-30
Mean: 10.4SD: 4.7
Mean: 9.8SD: 4.4
Pain experience (Single item EQ-5D+C)24
Pain experience NoModerateSevere
130 (44.7)127 (43.6)
34 (11.7)(N=291)
50 (39.4)60 (47.2)17 (13.4)(N=127)
Cognitive functioning (Single item EQ-5D+C)24
Cognitive problems NoModerateSevere
222 (77.1)64 (22.2)
2 (0.7)(N=288)
74 (58.6)37 (29.1)16 (12.6)(N=127)
Social functioning (Single item RAND-36)23
Social activities hampered by physical health or emotional problems
NeverRarelySometimesMostlyContinuously
217 (75.9)19 (6.6)29 (9.1)
6 (2.1)18 (6.3)(N=289)
90 (52.6)25 (14.6)22(12.9)14 (8.2)
20 (11.7)(N=171)
Self-perceived health (Single item, RAND-36)23
Self-perceived health in general ExcellentVery goodGoodReasonablePoor
18 (6.3)20 (7.0)
127 (44.3)108 (37.6)
14 (4.8)(N=287)
7 (4.0)9 (5.2)
66 (38.2)73 (42.2)18 (10.4)(N=173)
Satisfaction with quality of life (QOL) (Single item formedusing phrasing similar to self-perceived health question,RAND-36
Self-perceived QOL in general ExcellentVery goodGoodReasonablePoor
26 (9.1)40 (14.0)
170 (59.4)41 (14.4)
9 (3.1)(N=286)
5 (2.9)17 (9.8)
94 (54.0)54 (31.0)
4 (2.3)(N=174)

89
OLDER PERSONS VERSUS HEALTHCARE PROFESSIONALS
6
Table 1 The domains, items, and aggregated items included in the vignettes with the descriptive.
Outcome domains Vignette items Outcome levels DescriptivesVignettes study: older persons
and informal caregivers
DescriptivesVignette study: Healthcare
professionals
Morbidity (Local and national health monitor)21
Presence of: Dementia; Depression; Incontinence; Stroke, CVA or TIA; Hip fracture; Panic or anxiety disorder; Dizziness with falling; Vision disorder; Asthma; Osteoporosis; Diabetes; Arthritis; Heart failure; Form of cancer; Complaints due to benign enlarged prostate; Fracture other than hip fracture; Hearing disorder
Number of diseases presentRange: 0-17
Mean: 3.5SD: 2.0
Mean: 3.3SD: 2.3
Functional limitations (modified KATZ-ADL Index)22
Needing help with: Brushing hair; Going to the toilet; Taking medication; Sitting down and getting up from chair; Getting dressed; Travelling; Handling finances; Grocery shopping; Walking about; Taking a bath or shower; Housekeeping; Preparing a meal; Eating; Using the telephone
Number of limitations in (I)ADLRange: 0-15
Mean: 3.0SD: 3.5
Mean: 4.4SD: 4.2
Emotional wellbeing (RAND-36, mental health subscale)23
Feeling down; Feeling blue; Feeling nervous; Feeling happy; Feeling calm
Raw mental health scoreRange: 5-30
Mean: 10.4SD: 4.7
Mean: 9.8SD: 4.4
Pain experience (Single item EQ-5D+C)24
Pain experience NoModerateSevere
130 (44.7)127 (43.6)
34 (11.7)(N=291)
50 (39.4)60 (47.2)17 (13.4)(N=127)
Cognitive functioning (Single item EQ-5D+C)24
Cognitive problems NoModerateSevere
222 (77.1)64 (22.2)
2 (0.7)(N=288)
74 (58.6)37 (29.1)16 (12.6)(N=127)
Social functioning (Single item RAND-36)23
Social activities hampered by physical health or emotional problems
NeverRarelySometimesMostlyContinuously
217 (75.9)19 (6.6)29 (9.1)
6 (2.1)18 (6.3)(N=289)
90 (52.6)25 (14.6)22(12.9)14 (8.2)
20 (11.7)(N=171)
Self-perceived health (Single item, RAND-36)23
Self-perceived health in general ExcellentVery goodGoodReasonablePoor
18 (6.3)20 (7.0)
127 (44.3)108 (37.6)
14 (4.8)(N=287)
7 (4.0)9 (5.2)
66 (38.2)73 (42.2)18 (10.4)(N=173)
Satisfaction with quality of life (QOL) (Single item formedusing phrasing similar to self-perceived health question,RAND-36
Self-perceived QOL in general ExcellentVery goodGoodReasonablePoor
26 (9.1)40 (14.0)
170 (59.4)41 (14.4)
9 (3.1)(N=286)
5 (2.9)17 (9.8)
94 (54.0)54 (31.0)
4 (2.3)(N=174)
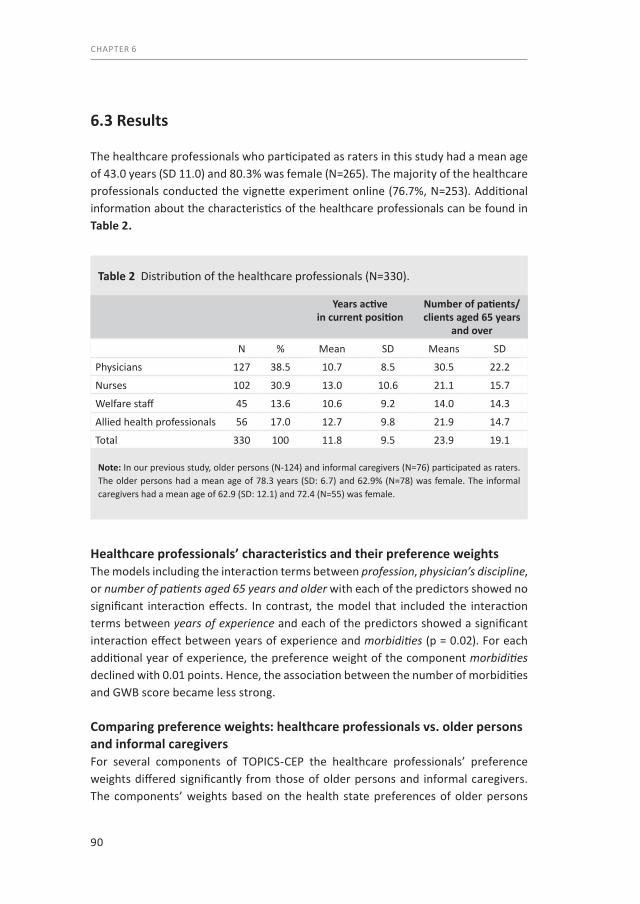
90
CHAPTER 6
6.3 Results
The healthcare professionals who participated as raters in this study had a mean age of 43.0 years (SD 11.0) and 80.3% was female (N=265). The majority of the healthcare professionals conducted the vignette experiment online (76.7%, N=253). Additional information about the characteristics of the healthcare professionals can be found in Table 2.
Healthcare professionals’ characteristics and their preference weightsThe models including the interaction terms between profession, physician’s discipline, or number of patients aged 65 years and older with each of the predictors showed no significant interaction effects. In contrast, the model that included the interaction terms between years of experience and each of the predictors showed a significant interaction effect between years of experience and morbidities (p = 0.02). For each additional year of experience, the preference weight of the component morbidities declined with 0.01 points. Hence, the association between the number of morbidities and GWB score became less strong.
Comparing preference weights: healthcare professionals vs. older persons and informal caregiversFor several components of TOPICS-CEP the healthcare professionals’ preference weights differed significantly from those of older persons and informal caregivers. The components’ weights based on the health state preferences of older persons
Table 2 Distribution of the healthcare professionals (N=330).
Years active in current position
Number of patients/ clients aged 65 years
and over
N % Mean SD Means SD
Physicians 127 38.5 10.7 8.5 30.5 22.2
Nurses 102 30.9 13.0 10.6 21.1 15.7
Welfare staff 45 13.6 10.6 9.2 14.0 14.3
Allied health professionals 56 17.0 12.7 9.8 21.9 14.7
Total 330 100 11.8 9.5 23.9 19.1
Note: In our previous study, older persons (N-124) and informal caregivers (N=76) participated as raters. The older persons had a mean age of 78.3 years (SD: 6.7) and 62.9% (N=78) was female. The informal caregivers had a mean age of 62.9 (SD: 12.1) and 72.4 (N=55) was female.
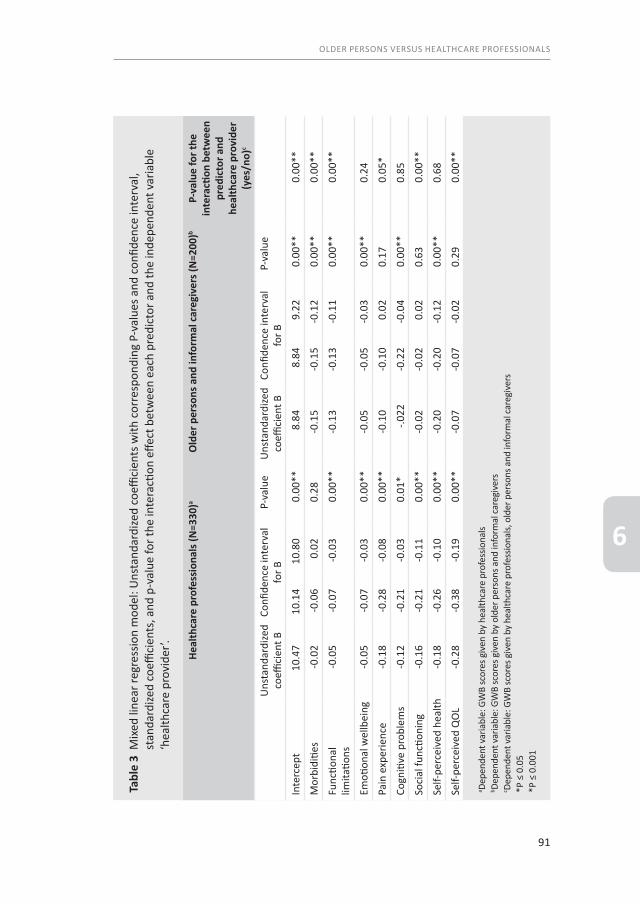
91
OLDER PERSONS VERSUS HEALTHCARE PROFESSIONALS
6
Tabl
e 3
Mix
ed li
near
regr
essio
n m
odel
: Uns
tand
ardi
zed
coeffi
cien
ts w
ith c
orre
spon
ding
P-v
alue
s and
con
fiden
ce in
terv
al,
stan
dard
ized
coeffi
cien
ts, a
nd p
-val
ue fo
r the
inte
racti
on e
ffect
bet
wee
n ea
ch p
redi
ctor
and
the
inde
pend
ent v
aria
ble
‘hea
lthca
re p
rovi
der’.
Heal
thca
re p
rofe
ssio
nals
(N=3
30)a
Old
er p
erso
ns a
nd in
form
al c
areg
iver
s (N
=200
)bP-
valu
e fo
r the
in
tera
ction
bet
wee
n pr
edic
tor a
nd
heal
thca
re p
rovi
der
(yes
/no)
c
Uns
tand
ardi
zed
coeffi
cien
t BCo
nfide
nce
inte
rval
for B
P-va
lue
Uns
tand
ardi
zed
coeffi
cien
t BCo
nfide
nce
inte
rval
for B
P-va
lue
Inte
rcep
t10
.47
10.1
410
.80
0.00
**8.
848.
849.
220.
00**
0.00
**
Mor
bidi
ties
-0.0
2-0
.06
0.02
0.28
-0.1
5-0
.15
-0.1
20.
00**
0.00
**
Func
tiona
l lim
itatio
ns-0
.05
-0.0
7-0
.03
0.00
**-0
.13
-0.1
3-0
.11
0.00
**0.
00**
Emoti
onal
wel
lbei
ng-0
.05
-0.0
7-0
.03
0.00
**-0
.05
-0.0
5-0
.03
0.00
**0.
24
Pain
exp
erie
nce
-0.1
8-0
.28
-0.0
80.
00**
-0.1
0-0
.10
0.02
0.17
0.05
*
Cogn
itive
pro
blem
s-0
.12
-0.2
1-0
.03
0.01
*-.0
22-0
.22
-0.0
40.
00**
0.85
Soci
al fu
nctio
ning
-0.1
6-0
.21
-0.1
10.
00**
-0.0
2-0
.02
0.02
0.63
0.00
**
Self-
perc
eive
d he
alth
-0.1
8-0
.26
-0.1
00.
00**
-0.2
0-0
.20
-0.1
20.
00**
0.68
Self-
perc
eive
d Q
OL
-0.2
8-0
.38
-0.1
90.
00**
-0.0
7-0
.07
-0.0
20.
290.
00**
a Depe
nden
t var
iabl
e: G
WB
scor
es g
iven
by
heal
thca
re p
rofe
ssio
nals
b Depe
nden
t var
iabl
e: G
WB
scor
es g
iven
by
olde
r per
sons
and
info
rmal
care
give
rsc De
pend
ent v
aria
ble:
GW
B sc
ores
giv
en b
y he
alth
care
pro
fess
iona
ls, o
lder
per
sons
and
info
rmal
care
give
rs*P
≤ 0
.05
*P ≤
0.0
01

92
CHAPTER 6
and informal caregivers versus those based on the preferences of healthcare professionals can be found in Table 3.
Significant interaction effects were found between the factor healthcare professional and the outcome domains: morbidities, functional limitations, pain experience, social functioning, and self-perceived QOL (p<0.05). The estimated differences of these preference weights were: -0.12, -0.07, 0.14, 0.15 and 0.26, respectively. These estimates weights indicated that morbidities and functional limitations were given more weight by older persons and informal caregivers than by healthcare professionals, whereas the opposite was true for pain experience, social functioning, and self-perceived QOL.
The components morbidities and functional limitations had stronger associations with GWB scores given by older persons than with scores given by healthcare professionals: for every morbidity present the GWB score based on the preference weights of older persons and informal caregivers declined with 0.14 points, whereas the GWB score based on the preference weights of healthcare professionals declined with 0.02 points. These numbers were 0.12 versus 0.05 for every functional limitation, respectively. On the other hand, the components pain experience, social functioning, and self-perceived QOL had stronger associations with GWB scores given by healthcare professionals than with scores given by older persons and informal caregivers: when pain increased one point on the Likert scale (no pain, moderate pain, severe pain) the GWB score based on the preference weights of older persons and informal caregivers declined with 0.04 point, whereas the GWB score based on the preference weights of healthcare professionals declined with 0.18 points. These numbers were 0.01 versus 0.16 for social functioning, and 0.02 versus 0.28 for self-perceived QOL, respectively.
Distribution of the CEP’sOf the 453 cases described in the vignettes from both vignette studies, the majority (84.7%) had no missing data points for the calculation of TOPICS-CEP scores or HP’s CEP. Consequently, both composite outcome measures were calculated for 384 cases.
The overall distribution for both measures were tailed to the left (not shown), though became more normalized when stratified by age (Figure 1). Mean scores (±SD) significantly differed across gender and age groups for both HP’s CEP [(Men: 7.695 (0.80); Women: 7.43 (0.76); p=0.001) (<80: 7.67 (0.79); 80-84: 7.50 (0.78); ≥85: 7.42 (0.76); p=0.039)] and TOPICS-CEP [(Men: 7.01 (0.82); Women: 6.73 (0.786; p=0.001) (<80: 7.02 (0.75); 80-84: 6.83 (0.79); ≥85: 6.64 (0.80); p=0.001)].
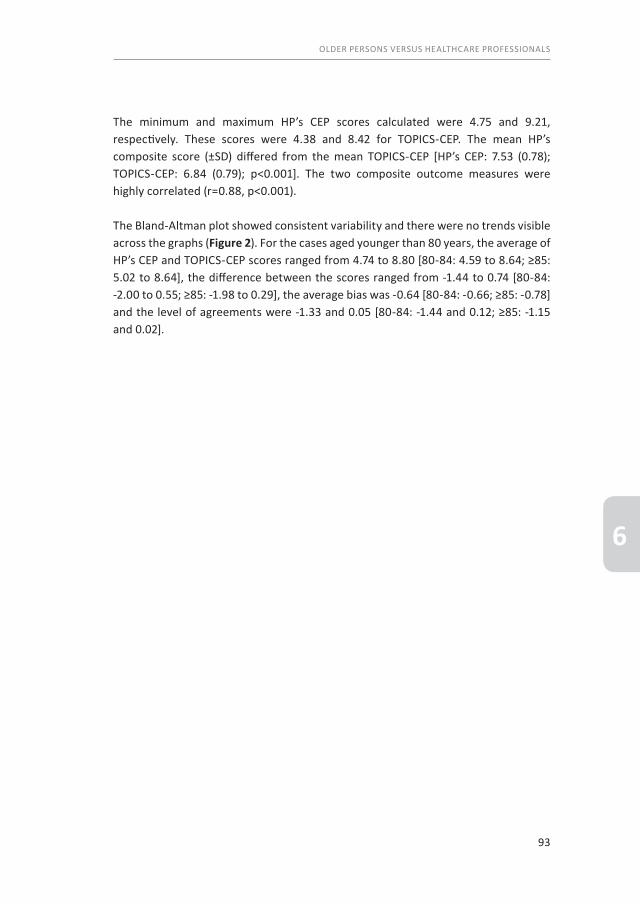
93
OLDER PERSONS VERSUS HEALTHCARE PROFESSIONALS
6
The minimum and maximum HP’s CEP scores calculated were 4.75 and 9.21, respectively. These scores were 4.38 and 8.42 for TOPICS-CEP. The mean HP’s composite score (±SD) differed from the mean TOPICS-CEP [HP’s CEP: 7.53 (0.78); TOPICS-CEP: 6.84 (0.79); p<0.001]. The two composite outcome measures were highly correlated (r=0.88, p<0.001).
The Bland-Altman plot showed consistent variability and there were no trends visible across the graphs (Figure 2). For the cases aged younger than 80 years, the average of HP’s CEP and TOPICS-CEP scores ranged from 4.74 to 8.80 [80-84: 4.59 to 8.64; ≥85: 5.02 to 8.64], the difference between the scores ranged from -1.44 to 0.74 [80-84: -2.00 to 0.55; ≥85: -1.98 to 0.29], the average bias was -0.64 [80-84: -0.66; ≥85: -0.78] and the level of agreements were -1.33 and 0.05 [80-84: -1.44 and 0.12; ≥85: -1.15 and 0.02].
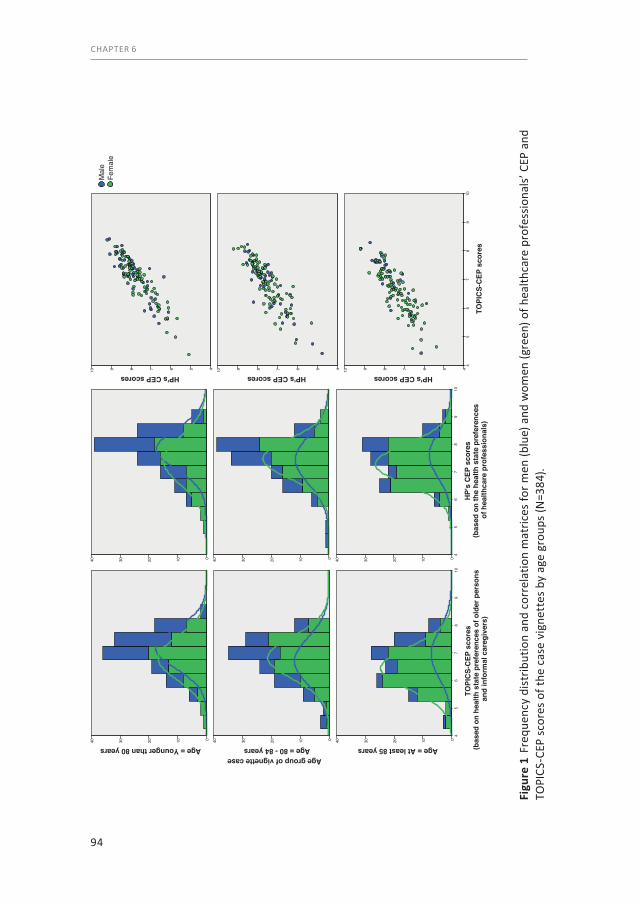
94
CHAPTER 6
Figu
re 1
Fre
quen
cy d
istr
ibut
ion
and
corr
elat
ion
mat
rices
for m
en (b
lue)
and
wom
en (g
reen
) of h
ealth
care
pro
fess
iona
ls’ C
EP a
nd
TOPI
CS-C
EP s
core
s of
the
case
vig
nett
es b
y ag
e gr
oups
(N=3
84).
40 30 20 10 0 40 30 20 10 0
TOPI
CS-
CEP
sco
res
(bas
ed o
n he
alth
sta
te p
refe
renc
es o
f old
er p
erso
ns a
nd in
form
al c
areg
iver
s)
109
87
65
4
40 30 20 10 0
Age group of vignette caseAge = Younger than 80 years Age = 80 - 84 years Age = At least 85 years
40 30 20 10 0 40 30 20 10 0
HP'
s C
EP s
core
s (b
ased
on
the
heal
th s
tate
pre
fere
nces
of
hea
lthca
re p
rofe
ssio
nals
)
109
87
65
4
40 30 20 10 0
HP's CEP scores10 9 8 7 6 5 4
HP's CEP scores10 9 8 7 6 5 4
TOPI
CS-
CEP
sco
res
109
87
65
4
HP's CEP scores10 9 8 7 6 5 4
Fem
ale
Mal
e

95
OLDER PERSONS VERSUS HEALTHCARE PROFESSIONALS
6
6.4 Discussion
Our primary findings indicate that the weights of TOPICS-CEP’s components based on the health state preferences of healthcare professionals differed significantly from those based on the preferences of older persons and informal caregivers. These findings are in line with other studies exploring the discrepancies between older persons and healthcare professionals concerning health state preferences.15,16
Our results indicate that the presence of morbidities and functional limitations in the vignette cases have a greater impact on the GWB scores given by older persons and informal caregivers than on the scores given by healthcare professionals. However, the presence of increased levels of pain experience, hampering of social functioning, and an decrease of self-perceived QoL status have a greater impact on the GWB scores given by healthcare professionals than on the scores given by older persons and informal caregivers. Furthermore, our results suggest that healthcare professionals’ number of years of experience influence the preference weight of morbidities. The higher the numbers of years of experience the lower the negative impact of the number of morbidities on GWB scores. To explore whether a change of 0.005 point per additional year is clinically relevant further research needs to be conducted.
Finally, our results show that the mean differences between HP’s CEP and TOPICS-CEP scores were not close to zero for any of the age groups, which indicates that the two composite outcome measures are systematically producing different results. Yet, to understand whether these systematic differences are clinically relevant further research needs to be conducted. Moreover, in the Bland-Altman plot there were no trends visible in any of the age groups.
Our results and implications need to be interpreted in light of several limitations. First, the vignettes used in the two studies were not the same. This means that the GWB of a vignette case was never assessed by both an older person or informal caregiver and a healthcare professional. However, all vignettes were based on empirical data derived from the TOPICS-MDS National Database and the cases were all plausible health state combinations. Consequently, none of the raters had to assess impossible health state combinations, e.g. a case that has eight morbidities and experiences severe pain, but does not have any functional limitations. With this in mind, we do not expect that the use of a different set of vignettes influenced our findings.
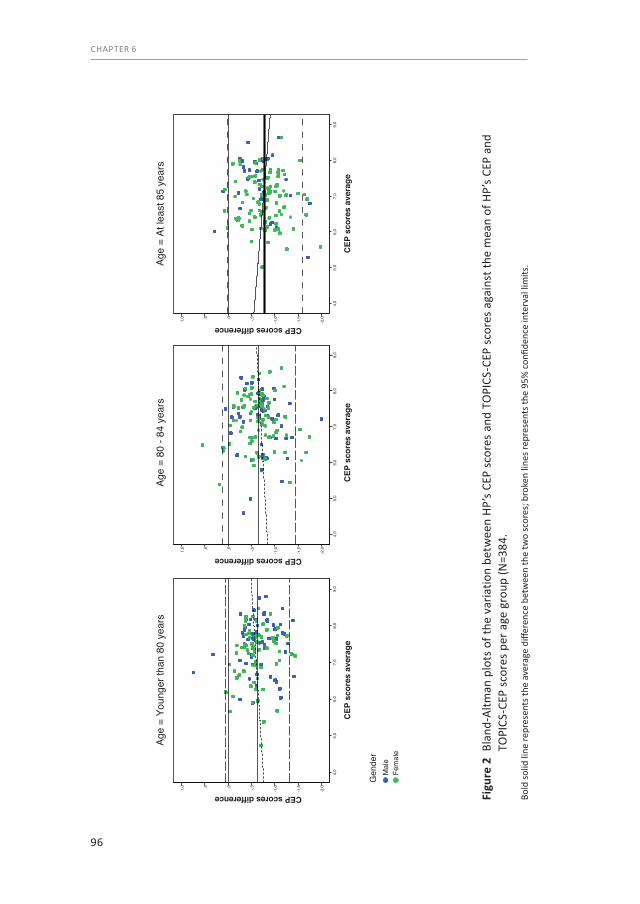
96
CHAPTER 6
Figu
re 2
Bla
nd-A
ltman
plo
ts o
f the
var
iatio
n be
twee
n HP
’s CE
P sc
ores
and
TO
PICS
-CEP
sco
res
agai
nst t
he m
ean
of H
P’s
CEP
and
TOPI
CS-C
EP s
core
s pe
r age
gro
up (N
=384
.
Bold
solid
line
repr
esen
ts th
e av
erag
e di
ffere
nce
betw
een
the
two
scor
es; b
roke
n lin
es re
pres
ents
the
95%
con
fiden
ce in
terv
al li
mits
.
CEP
sco
res
aver
age
Age
= Yo
unge
r tha
n 80
yea
rsAg
e =
80 -
84 y
ears
Age
= At
leas
t 85
year
s
9,0
8,0
7,0
6,0
5,0
4,0
CEP scores difference
1,0 ,5 ,0 -,5 -1
,0
-1,5
-2,0
Fem
ale
Mal
eG
ende
r
CEP
sco
res
aver
age
9,0
8,0
7,0
6,0
5,0
4,0
CEP scores difference
1,0 ,5 ,0 -,5 -1
,0
-1,5
-2,0
CEP
sco
res
aver
age
9,0
8,0
7,0
6,0
5,0
4,0
CEP scores difference
1,0 ,5 ,0 -,5 -1
,0
-1,5
-2,0
97
OLDER PERSONS VERSUS HEALTHCARE PROFESSIONALS
6
Second, we compared the components’ preference weights between the various professions and explored the influence of work experience on these weights. However, we have not studied the influence of personal characteristics of the professionals, such as gender and age, on the preference weights. This was a well-considered decision as the aim of our study was to establish a CEP based on the preference weights of a random sample of healthcare professionals.
6.5 Conclusion
If more than one outcome is important for effectiveness evaluation or if an intervention has the potential to improve more than one health domain, a CEP can efficiently deal with the issue of multiplicity, e.g. in elderly care. By using a prefer-ence-weighted multifaceted outcome measure, such as TOPICS-CEP, the relative importance of the various outcomes is taken into account. At the macro level, TOPICS-CEP which is based on older persons’ health state preferences may be considered as a general patient reported outcome measure to be used for evaluating healthcare interventions for (frail) older subjects.
When examining the effectiveness of healthcare interventions in elderly care need to consider the discrepancies between the health state preferences of older persons and healthcare professionals. Failure to recognize these discrepancies may lead to incorrect interpretation of the findings and the establishment of inappropriate healthcare policies. Furthermore, healthcare professionals need to keep in mind that their own health state preferences may not be the same as those of their older patients. This provides a good argument for shared decision making in healthcare.
98
CHAPTER 6
6.6 References1. Humphreys G. The health-care challenges posed by population ageing. Bulletin of the World Health
Organization. 2012;90(2):82-3.2. Programs UoME. Geriatrics: Access to Care and Allocating Scare Resources [cited 2013 16 August].
Available from: http://www.miami.edu/index.php/ethics/projects/geriatrics_and_ethics/access_to_care_ and_allocating_scare_resources/.
3. Fried LP, Ferrucci L, Darer J, Williamson JD, Anderson G. Untangling the concepts of disability, frailty, and comorbidity: implications for improved targeting and care. The journals of gerontology Series A, Biological sciences and medical sciences. 2004;59(3):255-63.
4. Guiding principles for the care of older adults with multimorbidity: an approach for clinicians: American Geriatrics Society Expert Panel on the Care of Older Adults with Multimorbidity. Journal of the American Geriatrics Society. 2012;60(10):E1-E25.
5. Patrick DL, Deyo RA. Generic and disease-specific measures in assessing health status and quality of life. Medical care. 1989;27(3 Suppl):S217-32.
6. Erickson P, Kendall EA, Anderson JP, Kaplan RM. Using Composite Health-Status Measures to Assess the Nations Health. Medical care. 1989;27(3):S66-S76.
7. English résumé National Care for the Elderly Programme text National Care for the Elderly Programme (NCEP) [cited 2013 March 27]. Available from: http://www.nationaalprogrammaouderenzorg.nl/fileadmin/ www.npoz.nl/documenten/programmateksten/English_resume_programme_text.pdf.
8. Lutomski JE, Baars MA, Schalk BW, Boter H, Buurman BM, den Elzen WP, et al. The development of the Older Persons and Informal Caregivers Survey Minimum DataSet (TOPICS-MDS): a large-scale data sharing initiative. PloS one. 2013;8(12):e81673.
9. The Older Persons and Informal Caregiver Survey (TOPICS) for Care receivers - Baseline The Older Persons and Informal Caregivers Survey Minimum DataSet (TOPICS-MDS) [cited 2015 21 October]. Available from: http://topics-mds.eu/wp-content/uploads/2014/03/Baseline-Questionnaire_Participant.pdf.
10. The Older Persons and Informal Caregiver Survey (TOPICS) for Caregivers - Baseline The Older Persons and Informal Caregivers Survey Minimum DataSet (TOPICS-MDS) [cited 2015 21 October]. Available from: http://topics-mds.nl/wordpress/wp-content/uploads/2013/09/Baseline-Questionnaire_Caregiver.pdf.
11. Hofman CS, Makai P, Boter H, Buurman BM, de Craen AJ, Olde Rikkert MG, et al. Establishing a composite endpoint for measuring the effectiveness of geriatric interventions based on older persons’ and informal caregivers’ preference weights: a vignette study. BMC geriatrics. 2014;14(1):51.
12. Weinberger M, Samsa GP, Schmader K, Greenberg SM, Carr DB, Wildman DS. Comparing proxy and patients’ perceptions of patients’ functional status: results from an outpatient geriatric clinic. Journal of the American Geriatrics Society. 1992;40(6):585-8.
13. VanderZee KI, Sanderman R, Heyink JW, de Haes H. Psychometric qualities of the RAND 36-Item Health Survey 1.0: a multidimensional measure of general health status. International journal of behavioral medicine. 1996;3(2):104-22.
14. Hofman CS, Melis RJF, Donders ART, Makai P, OldeRikkert MGM. The Older Persons and Informal Caregivers Survey - Composite Endpoint (TOPICS-CEP) Guidelines version 1.1. The Older Persons and Informal Caregivers Survey Minimum DataSet (TOPICS-MDS) [cited 2015 21 october]. Available from: http://topics-mds.eu/wp-content/uploads/2014/03/TOPICS-CEP-Guidelines-Version-1.1.pdf.
15. Crespo M, Bernaldo de Quiros M, Gomez MM, Hornillos C. Quality of life of nursing home residents with dementia: a comparison of perspectives of residents, family, and staff. Gerontologist. 2012;52(1):56-65.
16. Gomez-Gallego M, Gomez-Amor J, Gomez-Garcia J. Determinants of quality of life in Alzheimer’s disease: perspective of patients, informal caregivers, and professional caregivers. International psychogeriatrics / IPA. 2012;24(11):1805-15.
17. Lokale en nationale monitor gezondheid (In Dutch only) Lokale en nationale monitor gezondheid [cited 2013 May 15]. Available from: https://www.monitorgezondheid.nl/gezondheidindicatoren.aspx.
18. Krabbe PF, Stouthard ME, Essink-Bot ML, Bonsel GJ. The effect of adding a cognitive dimension to the EuroQol multiattribute health-status classification system. Journal of clinical epidemiology. 1999;52(4): 293-301.

99
OLDER PERSONS VERSUS HEALTHCARE PROFESSIONALS
6


Part 4The psychometric propertiesof TOPICS-CEP

In press as:Examining the Construct and Known-group Validity of a Composite Endpoint for The Older Persons and Informal Caregivers Survey Minimum Data Set (TOPICS-MDS); A Large-Scale Data Sharing Initiative
C.S. Hofman, J.E. Lutomski, H. Boter, B.M. Buurman, A.J.M. de Craen, A.R.T. Donders, M.G.M. Olde Rikkert, P. Makai, R.J.F. Melis
Membership of TOPICS-MDS research consortium is provided in the Acknowledgments.
Plos One
Chapter 7Validation of TOPICS-CEP

104
CHAPTER 7
Abstract
BackgroundPreference-weighted multi-faceted endpoints have the potential to facilitate comparative effectiveness research that incorporates patient preferences. The Older Persons and Informal Caregivers Survey – Composite endpoint (TOPICS-CEP) is potentially a valuable outcome measure for evaluating interventions in geriatric care as it combines multiple outcomes relevant to older persons in a single metric. The objective of this study was to validate TOPICS-CEP across different study settings (general population, primary care and hospital).
MethodsData were extracted from TOPICS Minimum Dataset (MDS), a pooled public-access national database with information on older persons throughout the Netherlands. Data of 17,603 older persons were used. Meta-correlations were performed between TOPICS-CEP indexed scores, EuroQol5-D utility scores and Cantril’s ladder life satisfaction scores. Mixed linear regression analyses were performed to compare TOPICS-CEP indexed scores between known groups, e.g. persons with versus without depression.
Results In the complete sample and when stratified by study setting TOPICS-CEP and Cantril’s ladder were moderately correlated, whereas TOPICS-CEP and EQ-5D were highly correlated. Higher mean TOPICS-CEP scores were found in persons who were: married, lived independently and had an education at university level. Moreover, higher mean TOPICS-CEP scores were found in persons without dementia, depression, and dizziness with falls, respectively. Similar results were found when stratified by subgroup.
ConclusionThis study supports that TOPICS-CEP is a robust measure which can be used in broad settings to identify the effect of intervention or of prevention in elderly care.

105
VALIDATION OF TOPICS-CEP
7
7.1 Introduction
Aging of the population has a major impact on the organization and delivery of healthcare. The shift from acute to chronic illnesses and the expected shortage of healthcare workers will be of particular importance.1 To ensure high quality care for older persons, the evaluation and monitoring of three aspects of health care delivery need to be regularly evaluated: structure, process, and outcomes.2 However, comparing outcomes in older persons is challenging. Firstly, the health states of older persons are complex, as older individuals often present different combinations of chronic multi-morbidity and functional limitations.3 Secondly, interventions often influence a broad range of health domains both directly and indirectly. For example, occupational therapy aims to enable people who have physical restrictions to achieve greater independence. By engaging in meaningful social activities, health and psychological wellbeing are also indirectly and positively influenced.4 Thus, occupational therapy can improve both physical and mental wellbeing. The two obstacles can be circumvented if the important outcome parameters are collected and combined into a preference- weighted composite endpoint (CEP).5, 6
In 2008, the Dutch Care for the Elderly Programme was commissioned by the Ministry of Health, Welfare and Sport with the guiding principles of improving care, quality of life, and self-management among older persons. As part of this Programme, The Older Persons and Informal Caregivers Survey Minimum Data Set (TOPICS-MDS) was developed to uniform collection of outcome measures.7 To promote comparability between research studies, a preference-weighted CEP was established for TOPICS-MDS based on the health state valuations of older persons and informal caregivers. This CEP (referred to as TOPICS-CEP) was designed as a multi-faceted outcome measure applying weights derived from older persons’ priorities for different outcomes to assist in the evaluation of interventions in older persons.8
TOPICS-CEP has been previously developed using a vignette study in which 200 persons participated. Profiles of older persons (vignettes) were used to obtain the preference weights for TOPICS-CEP’s components.8 The aim of this current study was to determine TOPICS-CEP’s convergent and known-groups validity in large hetero -geneous samples of older persons aged 65 years and older and across general population, primary care and hospital setting.
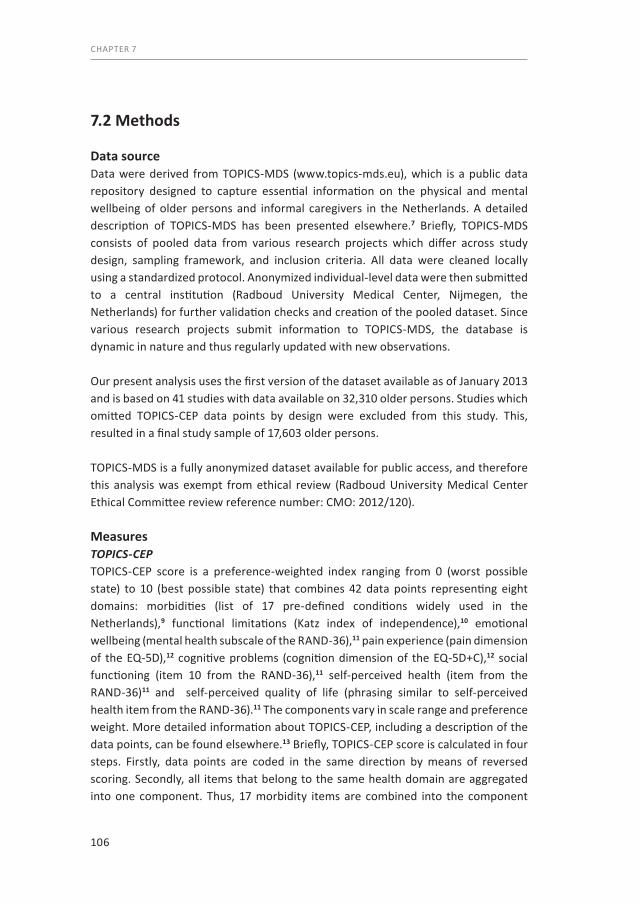
106
CHAPTER 7
7.2 Methods
Data sourceData were derived from TOPICS-MDS (www.topics-mds.eu), which is a public data repository designed to capture essential information on the physical and mental wellbeing of older persons and informal caregivers in the Netherlands. A detailed description of TOPICS-MDS has been presented elsewhere.7 Briefly, TOPICS-MDS consists of pooled data from various research projects which differ across study design, sampling framework, and inclusion criteria. All data were cleaned locally using a standardized protocol. Anonymized individual-level data were then submitted to a central institution (Radboud University Medical Center, Nijmegen, the Netherlands) for further validation checks and creation of the pooled dataset. Since various research projects submit information to TOPICS-MDS, the database is dynamic in nature and thus regularly updated with new observations.
Our present analysis uses the first version of the dataset available as of January 2013 and is based on 41 studies with data available on 32,310 older persons. Studies which omitted TOPICS-CEP data points by design were excluded from this study. This, resulted in a final study sample of 17,603 older persons.
TOPICS-MDS is a fully anonymized dataset available for public access, and therefore this analysis was exempt from ethical review (Radboud University Medical Center Ethical Committee review reference number: CMO: 2012/120).
Measures TOPICS-CEPTOPICS-CEP score is a preference-weighted index ranging from 0 (worst possible state) to 10 (best possible state) that combines 42 data points representing eight domains: morbidities (list of 17 pre-defined conditions widely used in the Netherlands),9 functional limitations (Katz index of independence),10 emotional wellbeing (mental health subscale of the RAND-36),11 pain experience (pain dimension of the EQ-5D),12 cognitive problems (cognition dimension of the EQ-5D+C),12 social functioning (item 10 from the RAND-36),11 self-perceived health (item from the RAND-36)11 and self-perceived quality of life (phrasing similar to self-perceived health item from the RAND-36).11 The components vary in scale range and preference weight. More detailed information about TOPICS-CEP, including a description of the data points, can be found elsewhere.13 Briefly, TOPICS-CEP score is calculated in four steps. Firstly, data points are coded in the same direction by means of reversed scoring. Secondly, all items that belong to the same health domain are aggregated into one component. Thus, 17 morbidity items are combined into the component
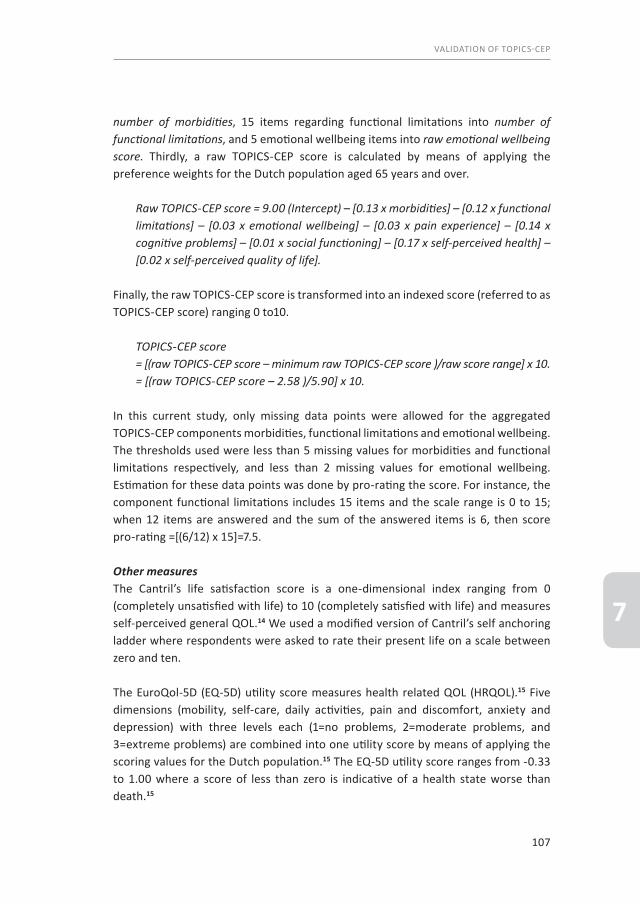
107
VALIDATION OF TOPICS-CEP
7
number of morbidities, 15 items regarding functional limitations into number of functional limitations, and 5 emotional wellbeing items into raw emotional wellbeing score. Thirdly, a raw TOPICS-CEP score is calculated by means of applying the preference weights for the Dutch population aged 65 years and over.
Raw TOPICS-CEP score = 9.00 (Intercept) – [0.13 x morbidities] – [0.12 x functional limitations] – [0.03 x emotional wellbeing] – [0.03 x pain experience] – [0.14 x cognitive problems] – [0.01 x social functioning] – [0.17 x self-perceived health] – [0.02 x self-perceived quality of life].
Finally, the raw TOPICS-CEP score is transformed into an indexed score (referred to as TOPICS-CEP score) ranging 0 to10.
TOPICS-CEP score= [(raw TOPICS-CEP score – minimum raw TOPICS-CEP score )/raw score range] x 10.= [(raw TOPICS-CEP score – 2.58 )/5.90] x 10.
In this current study, only missing data points were allowed for the aggregated TOPICS-CEP components morbidities, functional limitations and emotional wellbeing. The thresholds used were less than 5 missing values for morbidities and functional limitations respectively, and less than 2 missing values for emotional wellbeing. Estimation for these data points was done by pro-rating the score. For instance, the component functional limitations includes 15 items and the scale range is 0 to 15; when 12 items are answered and the sum of the answered items is 6, then score pro-rating =[(6/12) x 15]=7.5.
Other measuresThe Cantril’s life satisfaction score is a one-dimensional index ranging from 0 (completely unsatisfied with life) to 10 (completely satisfied with life) and measures self-perceived general QOL.14 We used a modified version of Cantril’s self anchoring ladder where respondents were asked to rate their present life on a scale between zero and ten.
The EuroQol-5D (EQ-5D) utility score measures health related QOL (HRQOL).15 Five dimensions (mobility, self-care, daily activities, pain and discomfort, anxiety and depression) with three levels each (1=no problems, 2=moderate problems, and 3=extreme problems) are combined into one utility score by means of applying the scoring values for the Dutch population.15 The EQ-5D utility score ranges from -0.33 to 1.00 where a score of less than zero is indicative of a health state worse than death.15
108
CHAPTER 7
Socio-demographic characteristics included in our analyses were marital status, living arrangements, and education level. Included clinical data points were dementia, depression, and dizziness with falls.
Convergent validityConvergent validity refers to how closely a measure is related to other measure of the same construct. We examined convergent validity of TOPICS-CEP score with the Cantril’s life satisfaction score and the EQ-5D utility score respectively, 14, 15 Convergent validity is determined by the correlation between the outcome measures.
HypothesesWe anticipated a moderate positive correlation between TOPICS-CEP score and the Cantril’s life satisfaction score, because TOPICS-CEP intends to measure a broader concept than self-perceived general QOL. In contrast, we expected a strong positive correlation between TOPICS-CEP score and the EQ-5D utility score as both measures combines multiple outcomes, however they do have a different score range [TOPICS- CEP: 0-10 versus EQ-5D: -0.33 – 1.0]. Known-group validityAfter examining the convergent validity, we examined whether groups with different marital status, living arrangements, education levels and the presence or absence of the chronic conditions dementia, depression, and dizziness with falls could be distinguished based on their TOPICS-CEP scores. Thus, we assessed whether baseline TOPICS-CEP scores were significantly different between groups.
HypothesesWe expected higher scores in persons who are married or cohabiting compared to widowers and in those who live with others (e.g. partner or children) compared to those who live alone because long lasting relationships positively influences (mental) health status.16 Similarly, we expected to find higher scores in older persons living independently compared to those living in an institutionalized facility. This is largely due to institutionalized older persons often require more assistance with daily activities and thus may fear their loss of independence, control and dignity.17 Furthermore, we anticipated to find lower scores in subgroups of persons with dementia, depression, or dizziness with falls than in persons without these conditions. Such conditions have wide-reaching effects and would likely negatively impact other domains included in TOPICS-CEP.18-20

109
VALIDATION OF TOPICS-CEP
7
GeneralizabilityTo examine whether the validation results for TOPICS-CEP are generalizable across different settings, we performed additional analyses using the complete study sample as well as stratified across three major study settings: older persons in primary care setting, general older population, and hospitalized older persons.
AnalysesFeasibility was assessed by calculating the number of missing values for TOPICS-CEP. Floor and ceiling effects were assessed by reporting the proportion of respondents with minimum and maximum TOPICS-CEP scores, respectively. A floor or ceiling effect of 15% was considered the maximum acceptable.21
Since TOPICS-MDS is a pooled dataset, we applied meta-analytical techniques to account for clustering within individual research projects. Pearson’s correlations were used to examine convergent validity between TOPICS-CEP, Cantril’s life satisfaction scale, and EQ-5D utility score within each study. To calculate the pooled correlation coefficients random effects meta-correlations were performed.22 Correlations below 0.3 were referred to as weak, between 0.3 and 0.5 as moderate, and above 0.5 as strong.23
Known group validity was examined by determining significant differences in mean TOPICS-CEP index scores. Mixed linear regression analyses were used to compare the scores between groups and to examine whether differences between groups were still present when adjusted for age and gender. To account for clustering within individual research projects the models included random intercepts for project. The models were constructed based on a priori expectations. Differences between parameter estimates smaller than 15% were considered to be acceptable. Analyses were performed using SPSS version 20.0 (SPSS IBM, New York, USA) and the Meta package in R (Foundation for statistical computing, Vienna, Austria).22
7.3 Results
Sample characteristicsData from 17,603 older persons from 28 projects were included in this study. The majority of the study sample were women (N= 10,817, 61.5%) and the mean (±SD) age was 79 (7) years. Overall, the sample consisted of 7,849 (44.9%) subjects living independently with others, 8,187 (46.7%) were married or cohabiting, and 7,965 (46.7%) had a secondary education level. The conditions dementia, depression, and dizziness with falls were present in; 962 (5.6%), 1,558 (9.1%), and 2,495 (14.6%) subjects of the study sample respectively. The socio-demographic distribution within
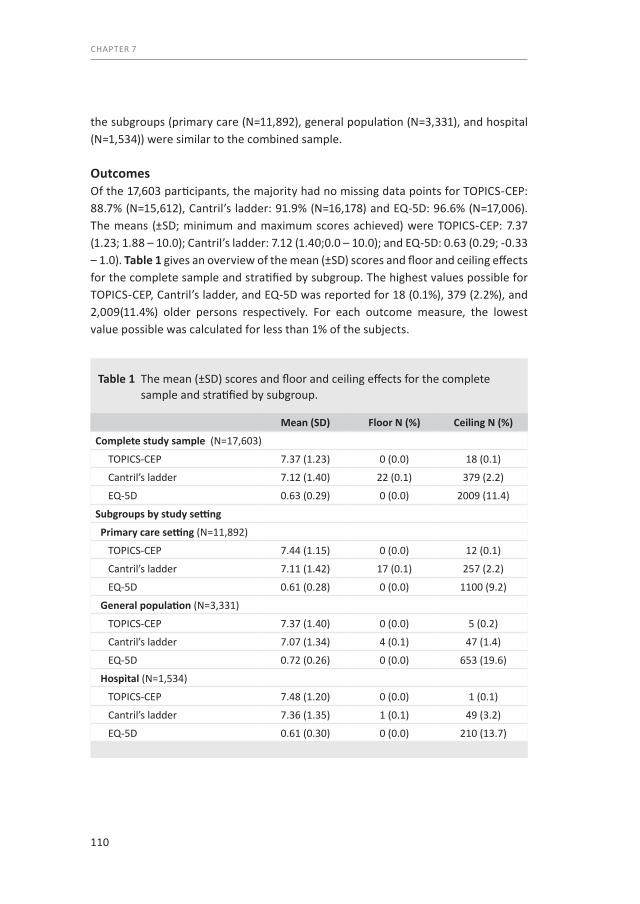
110
CHAPTER 7
the subgroups (primary care (N=11,892), general population (N=3,331), and hospital (N=1,534)) were similar to the combined sample. OutcomesOf the 17,603 participants, the majority had no missing data points for TOPICS-CEP: 88.7% (N=15,612), Cantril’s ladder: 91.9% (N=16,178) and EQ-5D: 96.6% (N=17,006). The means (±SD; minimum and maximum scores achieved) were TOPICS-CEP: 7.37 (1.23; 1.88 – 10.0); Cantril’s ladder: 7.12 (1.40;0.0 – 10.0); and EQ-5D: 0.63 (0.29; -0.33 – 1.0). Table 1 gives an overview of the mean (±SD) scores and floor and ceiling effects for the complete sample and stratified by subgroup. The highest values possible for TOPICS-CEP, Cantril’s ladder, and EQ-5D was reported for 18 (0.1%), 379 (2.2%), and 2,009(11.4%) older persons respectively. For each outcome measure, the lowest value possible was calculated for less than 1% of the subjects.
Table 1 The mean (±SD) scores and floor and ceiling effects for the complete sample and stratified by subgroup.
Mean (SD) Floor N (%) Ceiling N (%)
Complete study sample (N=17,603)
TOPICS-CEP 7.37 (1.23) 0 (0.0) 18 (0.1)
Cantril’s ladder 7.12 (1.40) 22 (0.1) 379 (2.2)
EQ-5D 0.63 (0.29) 0 (0.0) 2009 (11.4)
Subgroups by study setting
Primary care setting (N=11,892)
TOPICS-CEP 7.44 (1.15) 0 (0.0) 12 (0.1)
Cantril’s ladder 7.11 (1.42) 17 (0.1) 257 (2.2)
EQ-5D 0.61 (0.28) 0 (0.0) 1100 (9.2)
General population (N=3,331)
TOPICS-CEP 7.37 (1.40) 0 (0.0) 5 (0.2)
Cantril’s ladder 7.07 (1.34) 4 (0.1) 47 (1.4)
EQ-5D 0.72 (0.26) 0 (0.0) 653 (19.6)
Hospital (N=1,534)
TOPICS-CEP 7.48 (1.20) 0 (0.0) 1 (0.1)
Cantril’s ladder 7.36 (1.35) 1 (0.1) 49 (3.2)
EQ-5D 0.61 (0.30) 0 (0.0) 210 (13.7)

111
VALIDATION OF TOPICS-CEP
7
When stratified by subgroup the mean (±SD) scores showed similar patterns. For each outcome measure the lowest value possible was achieved by less than 1% of the older persons whereas the highest possible value for EQ-5D was calculated for 19.6% (N=653) and 13.7% (N=210) of the older persons sampled from the general population and hospital respectively.
Convergent validityTable 2 gives an overview of the meta-correlation coefficients and the 95% CI. Expectedly, TOPICS-CEP and Cantril’s ladder were moderately correlated in the overall sample and subgroups Complete sample: r=0.43; Primary care: r=0.41; General population: r=0.50; Hospital: r=0.43. In comparison, TOPICS-CEP and the EQ-5D were highly correlated [Complete sample: r=0.63; Primary care: r=0.60; General population: r=0.71; Hospital: r=0.57].
Known group validityTable 3 illustrates the association between TOPICS-CEP scores and sample character-istics. In line with our expectations, higher mean TOPICS-CEP scores were found in older adults who were married, lived independently and had a higher education level, respectively. Moreover, the mean TOPICS-CEP scores were higher in the persons
Table 2 Meta-correlation coefficients and the 95% CI of the outcome measures TOPICS-CEP, Cantril’s ladder, and EQ-5D utility score for the complete study sample and stratified by subgroup.
TOPICS-CEP Cantril’s ladderr 95% CI r 95% CI
Complete study sample (N=17,603) Cantril’s ladder 0.43 [(0.39) - (0.48)] EQ-5D 0.63 [(0.58) - (0.67)] 0.34 [(0.28) - (0.40)]Subgroups by study setting Primary care (N=11,892) Cantril’s ladder 0.41 [(0.33) - (0.48)] EQ-5D 0.60 [(0.52) - (0.67)] 0.31 [(0.21) - (0.41)] General population (N=2,221) Cantril’s ladder 0.53 [(0.51) - (0.56)] EQ-5D 0.71 [(0.68) - (0.74)] 0.43 [(0.35) - (0.50) Hospital (N=1,534) Cantril’s ladder 0.43 [(0.35) - (0.51)] EQ-5D 0.57 [(0.51) - (0.62)] 0.29 [(0.25) - (0.34)]

112
CHAPTER 7
Table 3 The associations between TOPICS-CEP scores and sample characteristics for the complete study sample and stratified by subgroup.
Complete sample Subgroups by study setting
Adjusted for gender and age Primary care General population Hospital
Estimates 95% CI Estimates 95% CI Estimates 95% CI Estimates 95% CI Estimates 95% CI
Age
78 year old1 7.27 [(7.05) - (7.49)] 7.29 [(6.99) - (7.57)] 7.50 [(6.95) - (9.04)] 7.08 [(5.66) - (8.5)]
Per additional year 0.03 [(0.02) - (0.04)] 0.04 [(0.04) - (0.04)] 0.06 [(0.05) - (0.07)] 0.04 [(0.03) - (0.05)]
Gender
Male1 7.56 [(7.32) - (7.8)] 7.51 [(7.21) - (7.82)] 7.99 [(7.45) - (8.53)] 7.47 [(6.08) - (8.86)]
Female -0.39 [(-0.43) - (-0.36)] -0.34 [(-0.38) - (-0.3)] -0.48 [(-0.58) - (-0.38)] -0.55 [(-0.67) - (-0.43)]
Marital status
Married / Cohabiting1 7.50 [(7.26) - (7.74)] 7.19 [(6.97) - (7.42)] 7.45 [(7.14) - (7.76)] 7.96 [(7.43) - (8.48)] 7.42 [(6.15) - (8.7)]
Partner deceased -0.37 [(-0.41) - (-0.34)] -0.08 [(-0.13) - (-0.04)] -0.29 [(-0.33) - (-0.24)] -0.62 [(-0.73) - (-0.52)] -0.53 [(-0.66) - (-0.4)]
Other -0.22 [(-0.28) - (-0.16)] -0.12 [(-0.18) - (-0.06)] -0.17 [(-0.24) - (-0.1)] -0.34 [(-0.51) - (-0.19)] -0.40 [(-0.59) - (-0.2)]
Living arrangements
Independent alone1 7.37 [(7.14) - (7.59)] 7.27 [(7.05) - (7.49)] 7.32 [(7.01) - (7.64)] 7.75 [(7.32) - (8.17)] 7.01 [(5.63) - (8.4)]
Independent with others 0.19 [(0.16) - (0.23)] 0.01 [(-0.03) - (0.05)] 0.16 [(0.12) - (0.2)] 0.21 [(0.1) - (0.32)] 0.40 [(0.28) - (0.52)]
Dependent -1.01 [(-1.08) - (-0.95)] -0.86 [(-0.94) - (-0.82)] -0.78 [(-0.87) - (-0.7)] -1.32 [(-1.44) - (-1.19)] -1.03 [(-1.29) - (-0.78)]
Education level
Primary school1 7.13 [(6.88) - (7.37)] 7.02 [(6.8) - (7.25)] 7.15 [(6.84) - (7.46)] 7.32 [(6.79) - (7.88)] 6.94 [(5.59) - (8.3)]
Secondary school 0.27 [(0.23) - (0.31)] 0.17 [(0.13) - (0.21)] 0.23 [(0.18) - (0.27)] 0.45 [(0.34) - (0.55)] 0.29 [(0.15) - (0.43)]
University 0.44 [(0.39) - (0.5)] 0.30 [(0.24) - (0.35)] 0.38 [(0.32) - (0.45)] 0.76 [(0.61) - (0.92)] 0.43 [(0.26) - (0.61)]
Dementia
No1 7.43 [(7.1) - (7.77)] 7.23 [(6.93) - (7.54)] 7.42 [(7) - (7.83)] 7.88 [(7.2) - (8.56)] 7.18 [(5.46) - (8.89)]
Yes -1.13 [(-1.21) - (-1.04)] -1.04 [(-1.13) - (-0.95)] -0.86 [(-0.96) - (-0.75)] -1.62 [(-1.8) - (-1.44)] -1.75 [(-2.41) - (-1.08)]
Depression
No1 7.42 [(7.15) - (7.71)] 7.25 [(6.99) - (7.51)] 7.44 [(7.09) - (7.78)] 7.78 [(7.11) - (8.47)] 7.25 [(5.8) - (8.69)]
Yes -1.16 [(-1.21) - (-1.1)] -1.16 [(-1.22) - (-1.11)] -1.11 [(-1.18) - (-1.05)] -1.44 [(-1.61) - (-1.27)] -1.28 [(-1.51) - (-1.06)]
Dizziness with Falls
No1 7.49 [(7.2) - (7.75)] 7.29 [(7.04) - (7.54)] 7.47 [(7.13) - (7.81)] 7.85 [(7.22) - (8.49)] 7.33 [(5.84) - (8.82)]
Yes -1.07 [(-1.11) - (-1.01)] -1.01 [(-1.05) - (-0.96)] -1.05 [(-1.1) - (-0.99)] -1.18 [(-1.32) - (-1.05)] -1.15 [(-1.31) - (-0.99)]
1Reference, for example: Mean TOPICS-CEP Male = 7.56, Female = 7.17

113
VALIDATION OF TOPICS-CEP
7
Table 3 The associations between TOPICS-CEP scores and sample characteristics for the complete study sample and stratified by subgroup.
Complete sample Subgroups by study setting
Adjusted for gender and age Primary care General population Hospital
Estimates 95% CI Estimates 95% CI Estimates 95% CI Estimates 95% CI Estimates 95% CI
Age
78 year old1 7.27 [(7.05) - (7.49)] 7.29 [(6.99) - (7.57)] 7.50 [(6.95) - (9.04)] 7.08 [(5.66) - (8.5)]
Per additional year 0.03 [(0.02) - (0.04)] 0.04 [(0.04) - (0.04)] 0.06 [(0.05) - (0.07)] 0.04 [(0.03) - (0.05)]
Gender
Male1 7.56 [(7.32) - (7.8)] 7.51 [(7.21) - (7.82)] 7.99 [(7.45) - (8.53)] 7.47 [(6.08) - (8.86)]
Female -0.39 [(-0.43) - (-0.36)] -0.34 [(-0.38) - (-0.3)] -0.48 [(-0.58) - (-0.38)] -0.55 [(-0.67) - (-0.43)]
Marital status
Married / Cohabiting1 7.50 [(7.26) - (7.74)] 7.19 [(6.97) - (7.42)] 7.45 [(7.14) - (7.76)] 7.96 [(7.43) - (8.48)] 7.42 [(6.15) - (8.7)]
Partner deceased -0.37 [(-0.41) - (-0.34)] -0.08 [(-0.13) - (-0.04)] -0.29 [(-0.33) - (-0.24)] -0.62 [(-0.73) - (-0.52)] -0.53 [(-0.66) - (-0.4)]
Other -0.22 [(-0.28) - (-0.16)] -0.12 [(-0.18) - (-0.06)] -0.17 [(-0.24) - (-0.1)] -0.34 [(-0.51) - (-0.19)] -0.40 [(-0.59) - (-0.2)]
Living arrangements
Independent alone1 7.37 [(7.14) - (7.59)] 7.27 [(7.05) - (7.49)] 7.32 [(7.01) - (7.64)] 7.75 [(7.32) - (8.17)] 7.01 [(5.63) - (8.4)]
Independent with others 0.19 [(0.16) - (0.23)] 0.01 [(-0.03) - (0.05)] 0.16 [(0.12) - (0.2)] 0.21 [(0.1) - (0.32)] 0.40 [(0.28) - (0.52)]
Dependent -1.01 [(-1.08) - (-0.95)] -0.86 [(-0.94) - (-0.82)] -0.78 [(-0.87) - (-0.7)] -1.32 [(-1.44) - (-1.19)] -1.03 [(-1.29) - (-0.78)]
Education level
Primary school1 7.13 [(6.88) - (7.37)] 7.02 [(6.8) - (7.25)] 7.15 [(6.84) - (7.46)] 7.32 [(6.79) - (7.88)] 6.94 [(5.59) - (8.3)]
Secondary school 0.27 [(0.23) - (0.31)] 0.17 [(0.13) - (0.21)] 0.23 [(0.18) - (0.27)] 0.45 [(0.34) - (0.55)] 0.29 [(0.15) - (0.43)]
University 0.44 [(0.39) - (0.5)] 0.30 [(0.24) - (0.35)] 0.38 [(0.32) - (0.45)] 0.76 [(0.61) - (0.92)] 0.43 [(0.26) - (0.61)]
Dementia
No1 7.43 [(7.1) - (7.77)] 7.23 [(6.93) - (7.54)] 7.42 [(7) - (7.83)] 7.88 [(7.2) - (8.56)] 7.18 [(5.46) - (8.89)]
Yes -1.13 [(-1.21) - (-1.04)] -1.04 [(-1.13) - (-0.95)] -0.86 [(-0.96) - (-0.75)] -1.62 [(-1.8) - (-1.44)] -1.75 [(-2.41) - (-1.08)]
Depression
No1 7.42 [(7.15) - (7.71)] 7.25 [(6.99) - (7.51)] 7.44 [(7.09) - (7.78)] 7.78 [(7.11) - (8.47)] 7.25 [(5.8) - (8.69)]
Yes -1.16 [(-1.21) - (-1.1)] -1.16 [(-1.22) - (-1.11)] -1.11 [(-1.18) - (-1.05)] -1.44 [(-1.61) - (-1.27)] -1.28 [(-1.51) - (-1.06)]
Dizziness with Falls
No1 7.49 [(7.2) - (7.75)] 7.29 [(7.04) - (7.54)] 7.47 [(7.13) - (7.81)] 7.85 [(7.22) - (8.49)] 7.33 [(5.84) - (8.82)]
Yes -1.07 [(-1.11) - (-1.01)] -1.01 [(-1.05) - (-0.96)] -1.05 [(-1.1) - (-0.99)] -1.18 [(-1.32) - (-1.05)] -1.15 [(-1.31) - (-0.99)]
1Reference, for example: Mean TOPICS-CEP Male = 7.56, Female = 7.17
114
CHAPTER 7
without dementia, depression and dizziness with falls, respectively. Further, Table 3 illustrates the relationships between TOPICS-CEP scores and sample characteristics adjusted for gender and age. The parameter estimates of marital status and education level remained significant (P-values < 0.05) after adjustments; however, these exceeded the 15% threshold of change. Thus, for example the average difference between TOPICS-CEP scores of persons who were married or cohabiting versus those who had a deceased partner was still significantly different,
however the difference between the scores decreased from 0.37 to 0.08. Furthermore, the parameter estimate of living independently with others was no longer significant after adjustment for gender and age. Without adjustment, the average difference TOPICS-CEP scores of persons living independently alone versus living independently with others were 0.19 points and with the adjustment the difference was 0.01 point. When stratified by subgroup similar results were found (data not shown).
7.4 Discussion
The purpose of this study was to determine convergent and known group validity of TOPICS-CEP in a large and heterogeneous sample of persons aged 65 years and older. Preference-weighted composite endpoints such as TOPICS-CEP have the potential to facilitate comparative effectiveness research, thus it is important to establish the validity of these kinds of endpoints prior to their use in the population of interest.
In this current study, TOPICS-CEP was able to accurately represent the heterogeneous composition of the overall study population. TOPICS-CEP scores obtained covered most of the entire current score range of the index and there were no floor or ceiling effects found in the total sample nor in the subsample taken from general population, primary care or hospital settings. This is important for its performance as an outcome measure. At the same time, the EQ-5D utility scores showed considerably larger ceiling effects in the general population sample. The most plausible reason why this specific subgroup exhibited this effect would be that the persons from the general population sample were less frail compared to those from the primary care and hospital sample.
Our correlation analyses revealed significant associations between TOPICS-CEP score versus Cantril’s ladder and EQ-5D utility score. The stronger correlation between TOPICS-CEP and EQ-5D indicates that the TOPICS-CEP measures important aspects of health. As expected, the correlation between TOPICS-CEP and Cantril’s ladder was

115
VALIDATION OF TOPICS-CEP
7
moderate because the two outcomes measure different concepts. Moreover, our findings supported our hypothesis that there would be a strong correlation between TOPICS-CEP components and the EQ-5D dimensions.
TOPICS-CEP scores adhered expected patterns across marital status, living arrangements, and education level. Additionally, TOPICS-CEP was able to distinguish subjects who had dementia, depression, and dizziness with falls even when adjusted for age and gender. These findings further support the overall validity of the tool.
Our results indicate that there were no floor or ceiling effects for TOPICS-CEP in the different settings. However, similar to other studies we found a ceiling effect for the EQ-5D utility score as the percentage of persons with the highest possible EQ-5D utility score of 1.00 exceeded the 15% threshold. These ceiling effects may be due to a small range of responses (3 levels per item).24, 25
There are several limitations to consider. Even though a large heterogeneous sample was used to validate TOPICS-CEP, institutionalized older persons were underrepre-sented in our sample. Secondly, additional research is required to examine other important properties of TOPICS-CEP, such as minimal clinically important difference and the sensitivity to detect change. For these reasons, longitudinal validation would be beneficial.
In conclusion, preference-weighted multi-faceted endpoints have the potential to facilitate comparative effectiveness research that incorporates patient preferences. This study supports that TOPICS-CEP is a good option for researchers who need an outcome measure to assess important outcomes for older persons even when it is across a range of differently functioning subpopulations. TOPICS-CEP is a robust measure which can be used in broad settings to identify the effect of intervention or of prevention in elderly care. It deserves further spread as the various outcome domains included in the measure are of great importance to the older population.

116
CHAPTER 7
AcknowledgementsThe authors thank TOPICS-MDS Consortium members.
TOPICS-MDS Consortium: Project Group N Bleijenberg (Julius Center for Health Sciences and Primary Care, UMC Utrecht, Netherlands); JW Blom (Dept. of Public Health and Primary Care, Leiden University Medical Center, Leiden, Netherlands); GIJM Kempen (CAPHRI School for Public Health and Primary Care, Dept. of Health Services Research, Maastricht University, Netherlands); PFM Krabbe (Dept. of Epidemiology, University of Groningen, University Medical Center Groningen, Netherlands); RJF Melis (Radboud Institute for Health Sciences, Dept. of Geriatric Medicine, Radboud University Medical Center, Nijmegen, Netherlands); EP Moll van Charante (Dept. of General Practice, Academic Medical Center, Amsterdam, Netherlands); M Muntinga (Dept. of General Practice and Elderly Care Medicine/EMGO+ Institute for Health and Care Research, VU University Medical Center, Amsterdam, Netherlands); EW Steyerberg (Dept. of Public Health, Erasmus MC University Medical Center, Rotterdam, Netherlands).
Steering Committee BM Buurman (Dept. of Internal Medicine and Geriatrics, Academic Medical Center, Amsterdam, Netherlands); J Gussekloo (Dept. of Public Health and Primary Care, Leiden University Medical Center, Leiden, Netherlands); HE van der Horst (Dept. of General Practice and Elderly Care Medicine/EMGO+ Institute for Health and Care Research, VU University Medical Centre Amsterdam, Netherlands); MGM Olde Rikkert (Donders Institute for Brain, Cognition and Behaviour, Dept. of Geriatric Medicine, Radboud University Medical Center, Nijmegen, Netherlands); SEJA de Rooij (University Center for Geriatric Medicine, University Medical Centre Groningen, Netherlands); JMGA Schols (Dept. of Family Medicine and Dept. of Health Services Research, CAPHRI School for Public Health and Primary Care, Maastricht University, Maastricht, Netherlands); MJ Schuurmans (Dept. of Rehabilitation, Nursing Science & Sports, University Medical Center Utrecht, Netherlands); DA Smilde (Stichting GENERO, Rotterdam, Netherlands).
Working group D van den Brink (Radboud Institute for Health Sciences, Dept. of Geriatric Medicine, Radboud University Medical Center, Nijmegen, Netherlands); JE Lutomski (Radboud Institute for Health Sciences, Dept. of Geriatric Medicine, Radboud University Medical Center, Nijmegen, Netherlands); L Qin (Radboud Institute for Health Sciences, Dept. of Geriatric Medicine, Radboud University Medical Center, Nijmegen, Netherlands).
117
VALIDATION OF TOPICS-CEP
7
7.5 References1. Kovner CT, Mezey M, Harrington C. Who cares for older adults? Workforce implications of an aging
society. Health affairs. 2002 Sep-Oct;21(5):78-89. PubMed PMID: 12224911. Epub 2002/09/13. eng.2. Donabedian A. Evaluating the quality of medical care. The Milbank Memorial Fund quarterly. 1966 Ju-
l;44(3):Suppl:166-206. PubMed PMID: 5338568.3. Fried LP, Ferrucci L, Darer J, Williamson JD, Anderson G. Untangling the concepts of disability, frailty,
and comorbidity: implications for improved targeting and care. The journals of gerontology Series A, Biological sciences and medical sciences. 2004 Mar;59(3):255-63. PubMed PMID: 15031310. Epub 2004/03/20. eng.
4. Park NS. The relationship of social engagement to psychological well-being of older adults in assisted living facilities. Journal of Applied Gerontology. 2009 Aug;28(4):461-81. PubMed PMID: 2009-11040-004. English.
5. Erickson P, Kendall EA, Anderson JP, Kaplan RM. Using Composite Health-Status Measures to Assess the Nations Health. Medical care. 1989 Mar;27(3):S66-S76. PubMed PMID: ISI:A1989T837200006. English.
6. Patrick DL, Deyo RA. Generic and disease-specific measures in assessing health status and quality of life. Medical care. 1989 Mar;27(3 Suppl):S217-32. PubMed PMID: 2646490.
7. Lutomski JE, Baars MA, Schalk BW, Boter H, Buurman BM, den Elzen WP, et al. The Development of the Older Persons and Informal Caregivers Survey Minimum DataSet (TOPICS-MDS): A Large-Scale Data Sharing Initiative. PloS one. 2013;8(12):e81673. PubMed PMID: 24324716. Pubmed Central PMCID: 3852259. Epub 2013/12/11. eng.
8. Hofman CS, Makai P, Boter H, Buurman BM, de Craen AJ, Olde Rikkert MG, et al. Establishing a composite endpoint for measuring the effectiveness of geriatric interventions based on older persons’ and informal caregivers’ preference weights: a vignette study. BMC geriatrics. 2014;14(1):51. PubMed PMID: 24742136. Pubmed Central PMCID: 4021341. Epub 2014/04/20. eng.
9. Lokale en nationale monitor gezondheid (In Dutch only) Lokale en nationale monitor gezondheid [cited 2013 May 15]. Available from: https://www.monitorgezondheid.nl/gezondheidindicatoren.aspx.
10. Weinberger M, Samsa GP, Schmader K, Greenberg SM, Carr DB, Wildman DS. Comparing proxy and patients’ perceptions of patients’ functional status: results from an outpatient geriatric clinic. Journal of the American Geriatrics Society. 1992 Jun;40(6):585-8. PubMed PMID: 1587975.
11. VanderZee KI, Sanderman R, Heyink JW, de Haes H. Psychometric qualities of the RAND 36-Item Health Survey 1.0: a multidimensional measure of general health status. International journal of behavioral medicine. 1996;3(2):104-22. PubMed PMID: 16250758.
12. Krabbe PF, Stouthard ME, Essink-Bot ML, Bonsel GJ. The effect of adding a cognitive dimension to the EuroQol multiattribute health-status classification system. Journal of clinical epidemiology. 1999 Apr;52(4):293-301. PubMed PMID: 10235169.
13. Hofman CS, Melis RJF, Donders ART, Makai P, OldeRikkert MGM. The Older Persons and Informal Caregivers Survey - Composite Endpoint (TOPICS-CEP) Guidelines, First version The Older Persons and Informal Caregivers Survey Minimum DataSet (TOPICS-MDS) [cited 2014 1 April]. Available from: http://topics-mds.eu.
14. Cantril H. The pattern of human concerns. New Brunswick, N.J.: Rutgers University Press; 1965.15. Szende A, Oppe M, Devlin NJ. EQ-5D value sets : inventory, comparative review and user guide.
Dordrecht ; [London]: Springer; 2007.16. Baumeister RF, Leary MR. The need to belong: desire for interpersonal attachments as a fundamental
human motivation. Psychological bulletin. 1995 May;117(3):497-529. PubMed PMID: 7777651. Epub 1995/05/01. eng.
17. Woolhead G, Calnan M, Dieppe P, Tadd W. Dignity in older age: what do older people in the United Kingdom think? Age and ageing. 2004 Mar;33(2):165-70. PubMed PMID: 14960433.
18. Crooks VC, Lubben J, Petitti DB, Little D, Chiu V. Social network, cognitive function, and dementia incidence among elderly women. American journal of public health. 2008 Jul;98(7):1221-7. PubMed PMID: 18511731. Pubmed Central PMCID: 2424087. Epub 2008/05/31. eng.

118
CHAPTER 7
19. Faes MC, Reelick MF, Joosten-Weyn Banningh LW, Gier M, Esselink RA, Olde Rikkert MG. Qualitative study on the impact of falling in frail older persons and family caregivers: foundations for an intervention to prevent falls. Aging & mental health. 2010 Sep;14(7):834-42. PubMed PMID: 20635232. Epub 2010/07/17. eng.
20. Malhotra R, Chei CL, Ostbye T, Chan A, Matchar DB. Older person behavioral and psychological symptoms (BPS) and functional limitations mediate the association between older person cognitive impairment and depressive symptoms in the caregiver. Archives of gerontology and geriatrics. 2014 Mar-Apr;58(2):269-77. PubMed PMID: 24211024. Epub 2013/11/12. eng.
21. Terwee CB, Bot SD, de Boer MR, van der Windt DA, Knol DL, Dekker J, et al. Quality criteria were proposed for measurement properties of health status questionnaires. Journal of clinical epidemiology. 2007 Jan;60(1):34-42. PubMed PMID: 17161752. Epub 2006/12/13. eng.
22. Schwarzer G. Meta: Meta-Analysis with R: R package version 1.6-0; 2010 [cited 2014 March 6th]. Available from: http://CRAN.R-project.org/package=meta.
23. Cohen J. Set Correlation and Contingency-Tables. Appl Psych Meas. 1988 Dec;12(4):425-34. PubMed PMID: WOS:A1988T351300010. English.
24. Brazier J, Roberts J, Tsuchiya A, Busschbach J. A comparison of the EQ-5D and SF-6D across seven patient groups. Health economics. 2004 Sep;13(9):873-84. PubMed PMID: 15362179. Epub 2004/09/14. eng.
25. Janssen MF, Pickard AS, Golicki D, Gudex C, Niewada M, Scalone L, et al. Measurement properties of the EQ-5D-5L compared to the EQ-5D-3L across eight patient groups: a multi-country study. Quality of life research : an international journal of quality of life aspects of treatment, care and rehabilitation. 2013 Sep;22(7):1717-27. PubMed PMID: 23184421. Pubmed Central PMCID: 3764313. Epub 2012/11/28. eng.

119
VALIDATION OF TOPICS-CEP
7


Part 5Summary and Discussion


Chapter 8Summary and general discussion


125
SUMMARY AND GENERAL DISCUSSION
8
With the increasing proportion of elderly and its impact on the organization and delivery of healthcare, the Dutch Ministry of Health, Welfare, and Sport commissioned the National Care for the Elderly Programme (NCEP) with the aim to develop a more proactive, integrated healthcare system for older patients. This programme funded over 60 research and implementation projects as well as the development of The Older Persons and Informal Caregivers Minimum Data Set (TOPICS-MDS). As part of the TOPICS-MDS initiative, a uniform dataset measuring key outcomes in health, wellbeing, and health services utilization was created and administered to all older persons and caregivers participating in these studies.1
Despite the collection of standardized outcome measures in TOPICS-MDS, there remained the inherent need to create a composite endpoint (CEP) to facilitate the objective evaluation of interventions. Thus, the general aim of this thesis was to develop and validate a CEP for TOPICS-MDS to measure HR-QOL in older persons. This CEP, henceforth referred to as TOPICS-CEP, integrates 42 TOPICS-MDS items from eight domains (chronic conditions, functional limitations, emotional wellbeing, pain experience, cognitive functioning, social functioning, self-perceived health and self-perceived QOL) into a single preference-weighed outcome measure based on the health state preferences of older persons and informal caregivers.
This chapter summarizes the main findings of each study (described in Chapters 2 to 4) and reflects on methodological issues. Furthermore, implications for future research and clinical practice are provided. With the strengths and limitations of the different studies being discussed in the preceding chapters, this chapter focuses on general considerations.
8.1 Summary of the main findings
This thesis describes the development and validation of TOPICS-CEP. Since person- centred care is becoming increasingly important in modern medicine, Part 2 focuses on the health state preferences of older persons as well as their informal caregivers, who often serve as proxies. After establishing preference weights for TOPICS-CEP, the relevance of these preference-weights for the valuation of health outcomes was examined in Part 3 by comparing health state preferences of older persons, informal caregivers and healthcare professionals. Lastly, TOPICS-CEP’s psychometric properties were studied in Part 4 to validate TOPICS-CEP for HR-QOL.
126
CHAPTER 8
In Chapter 1, the rationale for the development of TOPICS-CEP are described. Briefly, an aging population has led to an increased strain on healthcare services. Nowadays, outcomes are considered to be a necessity in determining the quality of healthcare. Comparative effectiveness research in elderly care is challenging, because the health states of older persons are complex and interventions often influence a broad range of domains. To circumvent these obstacles, TOPICS-CEP a preference-weighted multifaceted CEP, was established.
Part 2 describes the development of TOPICS-CEP. Ageing of our population has a major impact on the organisation and delivery of healthcare. Healthcare systems have to meet the needs of geriatric patients while the shortage of healthcare workers is likely to grow resulting in an increase in the number of informal caregivers. Informal caregivers often serve as proxies which means they are appointed to make healthcare decisions on behalf of the older person in case he or she is incapable of making his or her wishes known, e.g. when the patient has a low cognitive status. Therefore, the preference weights for the eight TOPICS-CEP domains were obtained based on the health state preferences of both older persons and informal caregivers. A vignette study was used to retrieve the weights and the results are described in Chapter 2. A sample of 124 community dwelling elderly aged 65 years and older and 76 informal caregivers participated. When the preference weights given by older persons were compared with those given by informal caregivers no significant differences were found. Consequently, TOPICS-CEP was established based on the health state preferences of both groups.
Previous research has shown that variation in health state preferences is influenced by various characteristics such as sex, age, and current health.2-6 This variability can further be explained by personal perspective and coping strategies. TOPICS-CEP was established based on the health state preferences of a heterogeneous group of raters. Therefore, we studied whether the characteristics of our raters systematically influenced the preference weights of TOPICS-CEP’s components and how this may affect TOPICS-CEP scores. Chapter 3 describes the results of this study. Our findings suggest that the preference weights of TOPICS-CEP’s components (described in Chapter 2a) were influenced by our raters’ age. Moreover, when we used weights based on the preferences of 65 year olds and those based on 85 year olds to evaluate the situation of a sample of cases results show low agreement between the two outcome measures. Consequently, since the age distribution of our study sample differed from the age distribution of the Dutch population aged 65 years and over, the preference weights of TOPICS-CEP had to be adjusted. With these adjustments, TOPICS-CEP may, on average, better reflect the health state valuation of the older Dutch population.

127
SUMMARY AND GENERAL DISCUSSION
8
Part 3 provides evidence to support the relevance of a preference-weighted CEP based on patients’ health valuations, such as TOPICS-CEP. There were several reasons to establish TOPICS-CEP which combines objective outcomes and subjective preferences into one multifaceted outcome measure. Even though simply assessing the value of healthcare by asking patients to rate their own situation on a scale from 0 to 10 is common, the approach may result in a different valuation of a certain health state than utility measures based on external raters. This, as self-assessments are prone to adaptation and response shift. Such phenomena may result in over- or under estimation of the magnitude of the change in health status. Secondly, relying solely on objective measures, such as physicians’ reports of chronic conditions or functional limitations omits relevant factors, primarily the patient’s preferences.
Instead of using self-ratings in our vignette study, we used the ratings of multiple peers to obtain the preference weights for TOPICS-CEP components. The Bland-Altman plot, the most preferred method to investigate agreement, was originally designed to evaluate the agreement of two measurement methods with two single ratings per case. Yet, as we want to be able to compare one self-assessed rating versus three to five peer ratings per case, an adapted Bland-Altman plot was derived. The adjustment of the Bland-Altman approach to evaluate possible patterns of discord between two measurement methods with an unequal number of observations per case is described in Chapter 4.
Self-rated QOL provides useful global assessments of perceived QOL, however, peers may provide complementary information that are of great interest. Chapter 5 describes the study in which we investigated the agreement between self-rated versus peer-rated scores. As expected, the findings suggest that self-rated and peer-rated scores are not interchangeable. However, in our opinion self- and peer-rated assessments are complementary to each other. As the first gives insight into how patients experience their QOL at a given time, while the second gives insight into how the population to which the patient belongs would assess the QOL on average. With TOPICS-CEP established, based on the health valuations made by peers, we have the ability to translate objective assessments into perceived QOL to evaluate the effect of interventions on average.
Even though various stakeholders in geriatrics share a mutual goal which is to improve a person’s health and wellbeing, studies have shown significant differences between the perspectives of older persons and their healthcare professionals.7, 8 Such disparities can lead to treatment decisions by professionals that are at odds with patient preferences and biased interpretations in effectiveness studies. Consequently, we expected that the preference weights of the TOPICS-CEP’s components would differ between those of older persons and their healthcare

128
CHAPTER 8
professionals. For that reason, we explored the TOPICS-CEP components’ weights based on the health state preferences of healthcare professionals and compared them with the weights based on the health state preferences of older persons and informal caregivers obtained in our previous study (Chapter 2). The results of this study are described in Chapter 6. Additional to the sample of 124 community dwelling elderly aged 65 years and older and 76 informal caregivers who participated in our previous study, data were obtained from 330 healthcare professionals (physicians, nurses, welfare staff and allied healthcare professionals). Comparing the preference weights of the older persons and informal caregivers versus those of healthcare professionals showed significant differences, underscoring why outcomes that are based on patients’ preferences are critical. Morbidities and functional limitations were given more weight by older persons and informal caregivers than by healthcare professionals, while the opposite was true for pain experience, social functioning, and self-perceived QOL. Hence, we concluded that it is important to recognize the discrepancies between the health state preferences of various stakeholders to: (1) correctly interpret results when studying the effectiveness of interventions in elderly care; and (2) establish appropriate healthcare policies.
Preference-weighted CEP, such as TOPICS-CEP, have the potential to facilitate comparative effectiveness research. It is important to establish the validity of these kinds of endpoints prior to their use in the population of interest. Therefore, we examined TOPICS-CEP’s construct validity in large heterogeneous samples of older persons aged 65 years and older. Chapter 7 describes the results of this study which aimed to: (1) study how closely TOPICS-CEP scores were related with Cantril’s life satisfaction scores and EQ-5D utility scores; (2) assess whether TOPICS-CEP scores were significantly different between groups known to differ in HR-QOL; and (3) examine whether the validation results for TOPICS-CEP were generalizable across different settings (general population, primary care and hospital). Data from 17,603 older persons obtained from TOPICS-MDS national dataset were included in this study. Firstly, our meta-analyses revealed significant associations: a strong positive correlation between TOPICS-CEP and EQ-5D (i.e. a HR-QOL measure) and only a moderate positive correlation between TOPICS-CEP and Cantril’s ladder (i.e. an overall QOL measure). Secondly, based on multivariable mixed models, we found that TOPICS-CEP scores adhered expected patterns across known-groups. Finally, our results indicate that there were no floor or ceiling effects for TOPICS-CEP in the different settings whilst a ceiling effect was found for the EQ5-D utility score in the general population. The TOPICS-CEP behaved in accordance with a priori hypotheses, thus supporting construct and known-group validity. Hence, TOPICS-CEP is a robust generic measure which can be used in broad settings to establish health outcomes in elderly care.

129
SUMMARY AND GENERAL DISCUSSION
8
8.2 General discussion
In today’s healthcare environment, it is increasingly important to be able to quantify the amount of change (ultimately: the added value) associated with a given intervention. The aim of this thesis was to develop and validate TOPICS-CEP; a prefer-ence-weighted multifaceted outcome measure.
In this section, the relevance of quality indicators and the possible role of TOPICS-CEP are considered. We discuss the practical, theoretical and empirical challenges and opportunities we encountered while carrying out the research project reported in this thesis. The benefits and limitations of TOPICS-CEP are discussed. Finally, implications and recommendations are made for future research and clinical practice. From TOPICS-MDS with single outcomes towards a Composite EndPointTOPICS-MDS was created to record relevant outcomesThe current healthcare model emerged from the need to treat acute or singular chronic conditions in younger populations. Consequently, with our aging society, healthcare professionals are now working with a quality of care paradigm and therefore in an healthcare environment that is incompatible with the needs of older persons with increasingly complex health states. Their symptoms often reflect an interaction between multiple chronic conditions and functional limitations which influence the QOL. For these persons, the incoherent treatment and monitoring of single conditions without taking into account general wellbeing does not promote healthy aging, not even when the single diseases are fully taken care of in line with the leading guidelines and quality indicators in the specific fields.9 Instead, such a narrow focus neglects additional gains in physical, mental, and social health that are often found when a more integrated approach to healthcare is taken.
Because of this lack of appropriate outcome measures TOPICS-MDS was created. It was designed not only to record relevant morbidity outcomes, but also to provide insight into physical, mental, and social wellbeing of older persons and their caregivers. In brief, for older persons, information is collected on demographics, morbidity, QOL, functional limitations, mental health, social functioning and health service utilisation. For informal caregivers, information is collected on demographics, hours of informal care and QOL.1
The importance of TOPICS-CEP Outcomes collected by means of TOPICS-MDS can be analysed separately (e.g. per item or item subset). However, using a single TOPICS-MDS item or item subset to compare outcomes has the disadvantage that it may lead to confusion when

130
CHAPTER 8
competing interventions demonstrate different patterns of effect.10 Additionally, researchers and healthcare professionals have the tendency to evaluate merely the outcome they are directly accountable for, which makes it even more difficult to compare the effects of competing interventions. Therefore, TOPICS-CEP was developed to facilitate comparative effectiveness research and provide users of TOPICS-MDS, for older persons, with the option of a preference-weighted measure which combines the outcomes of eight domains.
To our knowledge, there is no other preference-weighted quality indicator available specifically designed to assess and compare the outcomes of interventions in elderly care prior to the development of TOPICS-CEP. Previous studies have used generic instruments such as the Medical Outcomes Study 36-item Short-Form survey (MOS SF-36), the Patient-Reported Outcomes Measurement Information System 29-item general health form (PROMIS-29), and the EuroQol-5 Dimensions (EQ-5D) to assess the effect of interventions on health outcomes. However, these are generic health status measurement scales, which all use a number of items that are not appropriate for older subjects (e.g. work performance), while specific elements most relevant for older persons are not addressed at all (e.g. cognitive decline and loss of autonomy).
Moreover, there is no consensus on how to combine the (subscales of the) SF-36 items into one CEP. Hence, SF-36 consists of eight scaled scores for the following outcome domains: vitality, physical functioning, bodily pain, general health perceptions, physical role functioning, emotional role functioning, social role functioning, and mental health. The scores are the sum of all items within each of the domains transformed into a score ranging from 0 to 100. This method is based on the assumption that all items within a domain are equally relevant. This is in contrast to the new paradigm of health proposed by Machteld Huber et al. and her empirical work supporting this.11 In their quest toward operationalising the new concept of health which is “the ability to adapt and self-manage, in the face of social, psychical, and emotional challenges” the importance of the following six health dimensions were explored: bodily functions, mental functions and perception, spiritual / existential dimension, QOL, social and societal participation, and daily functioning as viewed by various stakeholders. Their results suggest that the dimensions are not considered to be equally important by any of the stakeholder groups. Thus, a CEP needs to be preference-weighted based on the health state preferences of the specific target group for whom the instrument is developed.
PROMIS-29 consists of seven raw scores and T-scores for the outcomes: physical functioning, anxiety, depression, fatigue, sleep disturbance, satisfaction with social role, and pain interference plus a single pain intensity rating. With the standardized

131
SUMMARY AND GENERAL DISCUSSION
8
T-score statements can be made with regard to the score of an individual in comparison to the mean of a certain population whose norm scores are available. However, similar to the SF-36 no statements can be made regarding the overall change (effect of an intervention on all domains) as valued by the Dutch older population aged 65 years and older.
EQ-5D consists of five dimensions: mobility, self-care, daily activities, pain and discomfort, anxiety and depression. Each dimension has three levels: no problems, moderate problems, extreme problems. Data are combined into one utility score by means of applying the scoring values for the Dutch population. However, a limitation of the EQ-5D utility score is the ceiling effect reported in various studies including our own validation study. The most plausible reason why in our study the ceiling effect was present in the subgroup general population is that the persons from this sample were less frail compared to those from the primary care and hospital sample. Similar drawbacks are met in using the EQ-5D+C, which is the EQ-5D with the addition of one cognition item. Weighting of the EQ-5D items is done by translating the health states into utilities, which is a distinct method of weighting. Often these weights are based on a population that is different from the targeted population, which also is a limitation of this measure.
Based on these limitations of other generic tools and the results found in our validation study, TOPICS-CEP may be of great value for quality improvement in the elderly care. By using preference-weighted outcome measures the desirability of health outcomes are considered. These kind of measures are distinct from health status instruments, because they characterize how health outcomes are valued as a whole based on the values of relevant respondents. TOPICS-CEP reflects on average the value of interventions according to the Dutch population aged 65 years and older. By reporting these values, quality may be well monitored and quality improvement driven.
Determining perceived importance of the outcomesThere are methodological challenges in deriving valuations of older participants due to reduced cognitive capacity and the multifaceted nature of geriatric care. To obtain the preference weights for TOPICS-CEP we considered two often used methods: vignette studies and discrete choice experiments (DCE’s). In vignette studies respondents are asked to value descriptions of situations (scenarios, e.g. health states) of persons (profiles, cases) to obtain the value placed on each component (item), included in the vignette. In DCE’s respondents are asked to state their choice over sets of hypothetical alternatives to derive the value placed on each component (item) included in the alternatives.

132
CHAPTER 8
At the beginning of our project, we explored the feasibility of the two different methods in a small pilot (not described in this thesis). All six participants were able to understand both tasks. When they were asked which method they preferred they all chose the vignettes. A DCE was regarded as more difficult task to complete since they could not always easily discern a preferable health state. In contrast, rating a single health status, described in a vignette, was perceived as an easy task to complete. This is in line with the literature which has found that DCE’s with too many items (attributes) negatively affect the practical feasibility by imposing a significant cognitive burden on respondents.
Further, in the design of a DCE hypothetical alternatives are generated and combined to create choice sets. For example, 10 items with each two levels leads to 2^10 = 1024 alternatives. In our study we had 46 items (covering 8 domains) with the number of levels ranging from 2 to 18. Thus, there would be too many alternatives to combine and choose from to perform a DCE. Besides this practical limitation, we found in the literature that the inclusion of too many attributes with conceptual overlap between two or more attributes further affects the statistical quality of a DCE. This would prevent the accurate estimation of the main effect (the direct independent effect) of a single attribute on the dependent variable due to interaction effects.
In light of these marked disadvantages, the use of vignettes was the preferable alternative to deriving preference weights for TOPICS-CEP. This method allowed for the inclusion of a relatively large number of items without comprising statistical integrity. By using empirical data, derived from TOPICS-MDS National Database, vignettes with plausible health states (based on real older persons) were constructed. Moreover, none of the participants had any problems with the execution of the assignment, which was to rate the general wellbeing a random sample of older persons who were described in vignettes.
However, the vignette approach does have one important disadvantage. Throughout the literature concerns are raised that vignettes do not accurately reflect ‘real world’ phenomena, and that this artificiality affects the validity of results and conclusions of these studies. Although respondents are asked to imagine themselves in certain hypothetical situation, they are reporting about someone else. Respondents who are actually in the described situation may respond quite differently. Therefore, we have explored the influence of our raters’ characteristics on health state preferences. Our findings suggested that the preference weights of TOPICS-CEP components were influenced by our raters’ age but not by other characteristics, such as functional limitations or chronic conditions (only the first was reported in our publication). Thus, in our opinion, when vignettes are used appropriately they can be a flexible,

133
SUMMARY AND GENERAL DISCUSSION
8
practical, and powerful tool for studying how various factors influence judgments and decisions. This conclusion has not changed since the start of this study, which warrants further use in future research. Motivations to use TOPICS-CEPGeneral wellbeing or HR-QOL include various domains such as chronic conditions, functional limitations, and emotional wellbeing. When a researcher wishes to measure the effect of an intervention on improving patients health states, TOPICS-CEP can be used as it combines items or composites into one single measure and it takes into account the perceived importance of the various domains according to older persons and informal caregivers.
Using TOPICS-CEP to measure, report, and compare outcomes in health services also confers several key advantages. First, it can drive improvement in healthcare by giving providers a simple tool to benchmark performance measures for individual patients (to be combined in the plan-do-check-act cycle of quality improvement). Thus, by measuring TOPICS-CEP score over time, providers are able to make adjustments in the care they provide, share their successes, and explore for causes when progress is lacking or stays behind. Second, by making performance transparent (e.g. publicly reporting TOPICS-CEP scores), patients have the opportunity to be well informed. Well informed patients are better able to assess quality of healthcare for themselves (e.g. by means of using TOPICS-CEP as a PROM), and may use this information to make choices, ask questions, and advocate for good healthcare. Third, assessing outcomes enables the shift in payment systems for healthcare from volume to value based healthcare reimbursement. Increasingly, worldwide private and public payers use outcomes such as patient reported outcomes (PROs) as preconditions for payment and targets for bonuses.
Besides these theoretical motivations for the use of TOPICS-CEP there are several practical motivations. Similar to other often used continuous composite endpoints producing a single score, such as the Disease Activity Score with 28-Joint Counts (DAS28), TOPICS-CEP has the advantage over the interpretation of individual components as it provides a meaningful estimate of HR-QOL with interpretation of multiple data points simultaneously and with a more responsiveness to change than single items.12 Additionally, continuous CEP’s are less affected to selection bias related to the reporting of a single measurement and they are preferable for statistical analysis in studies. Combining single items or components into a single score increases the event rate, which can be translated into a reduction in the minimum number of patients required for the clinical trial. If larger effect sizes are of interest, then a trial using TOPICS-CEP can gauge the effect of an intervention on
134
CHAPTER 8
HR-QOL using a smaller sample size compared to single items (only when everything else remains equal).
A well-designed clinical trial that prospectively embeds a CEP into its primary analysis plan is empowered to measure smaller effects, while using single endpoints could miss these effects due to the narrow focus. Assessments of single endpoints reveals that the isolated interpretation of a single component or health domain can be misleading. For example, consider the vignette / profile of Jeremy introduced in Chapter 1 [Box 1]. Jeremy was experiencing moderate pain, had no problems with his memory, attention and thinking, and was capable to handle his own finances without any assistance. If a researcher is interested in the effect of pain medication on the single outcome domain pain experience and Jeremy were to report, after six weeks, that he does not experience any pain, but does have moderate problems with his memory, attention and thinking, and is no longer capable to handle his own finances, the intervention would be labelled as successful. This, as the focus would only be on the fact that Jeremy is no longer experiencing any pain. However, if the researcher were to use TOPICS-CEP for a more holistic approach, the intervention would not be labelled as successful: TOPICS-CEP score before the intervention was 7.3, and after the intervention 6.7. Furthermore, if we use the case of Jeremy and calculate a composite score based on the health state preferences of healthcare professionals the intervention would be labelled as neutral: Composite score before and after the intervention was 8.2. This example underlines the importance of using generic preference-weighted outcomes to assess the effects of interventions on health states.
8.3 Limitations of TOPICS-CEP
Compromise between completeness and practical feasibilityBefore measuring quality of health care, it is important to choose the right tools for the job. Each measurement tool assesses performance from a specific angle, e.g. focussing on process, structure or outcome. Moreover, a tool may have been developed for a specific group of patients (e.g. the Hip disability and Osteoarthritis Outcome score is a condition-specific tool) or it may have been developed for a generic group (e.g. EuroQol-5D is a generic tool). Hence, when selecting or developing a tool the included items are of great importance.
TOPICS-MDS was developed as part of a National initiative to create a minimum data set on older persons’ health outcomes.1 Key domains and items for the standardized questionnaire were outlined by a working group; the instrument’s content and utility

135
SUMMARY AND GENERAL DISCUSSION
8evaluated by an independent multidisciplinary panel with expertise in gerontology, epidemiology, biostatistics and health services research. Despite this rigorous approach, some may question the exclusion of certain items, such as an indicator for loneliness. Yet, as described by Lutomski et al. (2013) the use of a minimal dataset is by definition a compromise between maximum desired completeness and practical feasibility.1 Given this limitation, it is not the intention to suggest that TOPICS-MDS
Box 1 Vignette / profile of Jeremy
Baseline:Jeremy is a 75 year old male and lives independently with his wife Nora.
In the last 12 months, Jeremy was diagnosed with diabetes and complained about dizziness and falling.
Jeremy needs help with 4 out of 6 self-care tasks:He need assistance with: bathing, getting dressed, walking, and getting up out of a chair.He does not need any assistance with: eating, combing his hair, and going to the toilet.
Jeremy needs help with 4 out of 7 other daily tasks:He need assistance with: travelling, grocery shopping, preparing a meal, and performing household tasks.He does not need any assistance with: using the telephone, taking his medication, and deal-ing with finances.
According to Jeremy, the last month he was always happy and calm, almost never sad or nervous, and he never felt like he could not be cheered up. Moreover, his social life has not been influenced at all by his emotional wellbeing over the last four weeks.
Today, Jeremy is experiencing moderate pain. He has no problems with his memory, atten-tion and thinking.
According to Jeremy his health is good and his quality of life is excellent.
Reported change during Follow-up:Jeremy is no longer experiencing any pain. However, he has moderate problems with his memory, attention and thinking, and is no longer capable to handle his own finances.
TOPICS-CEP score:
Baseline = 7.3Follow-up = 6.7
Score based on health state preferences of healthcare professionals:Baseline = 8.2Follow-up = 8.2
136
CHAPTER 8
should take the place of all pre-existing outcomes or descriptive instruments. TOPICS-MDS was designed to be used as either a primary or complementary survey. Its primary focus was to ensure that critical core outcomes are uniformly collected. This flexible design feature can, in turn, be viewed as a major strength of the survey.13
Further, results from our meta-analyses support that TOPICS-CEP is a good option for researchers who need an outcome measure to assess important outcomes for older persons, even when it is across a range of differently functioning subpopulations. This means that TOPICS-MDS includes sufficient items to identify the effect of intervention or prevention on desirable health outcomes in elderly care.
Relevance of the components cannot be comparedTo establish TOPICS-CEP we conducted two vignette studies to obtain the preference weights for the eight TOPICS-CEP components based on health valuations made by older person and informal caregivers. Additionally, we obtained the preference weights for TOPICS-CEP components based on heath valuations made by healthcare professionals to explore the relevance of patient-focused CEPs. Unfortunately, with the preference weights obtained we cannot make any comparisons between the components, thus we cannot make statements regarding which domain was considered most relevant by the older persons, informal caregivers, and healthcare professionals, respectively. However, this also was not the purpose of this project, which was to develop a multifaceted endpoint that combines TOPICS-MDS outcomes and considers the desirability of health outcomes.
The eight TOPICS-CEP components have different number of levels, e.g. self-perceived QOL has a five-level response option ranging ‘poor’ to ‘excellent’ and cognitive problems has a three-level response option ranging from ‘no problems’ to ‘severe problems’. Because of this variety and the interdependence of the components the preference weights of the eight TOPICS-CEP components cannot be compared, e.g. even though the component self-perceived QOL has a preference weight of 0.02 and the component cognitive problems has a preference weight of 0.14 this does not imply that the older persons and informal caregivers find cognitive problems seven times more important than self-perceived health. Hence, such direct comparisons cannot be drawn.
However, the preference weights can be used to calculate TOPICS-CEP scores and a composite score based on health state preferences of healthcare professionals. When we calculated these two scores for 384 cases and compared them, we found mean differences that were not close to zero. Thus, the two outcomes were systematically producing different results, which suggests that on average health
137
SUMMARY AND GENERAL DISCUSSION
8
valuations made by older persons and informal caregivers differ from those made by healthcare professionals. These disparities found support the importance of pa-tient-focused outcomes such as TOPICS-CEP.
Research versus clinical practiceThe use of a CEP can simplify and streamline the general evaluation of new interventions. However, in clinical practice it is important to recognize that two individuals with identical self-assessed health status as measured by a generic instrument, such as TOPICS-MDS, may value their general wellbeing or HR-QOL differently. This can be explained by the fact that valuations are influenced by personality traits, e.g. neuroticism are correlated with lower valuation of one’s general wellbeing, while extraversion, conscientiousness, agreeableness, and openness to experience are correlated with higher valuation of one’s general wellbeing.14
Moreover, the two different valuations could be explained by a phenomenon called response shift. Response shift is defined as an adaptation to changing health and refers to a change in the meaning of QOL over time.15 It is beneficial for patients as it can help them in adapting to a new situation. There are three forms of response shift: (1) a change in someone’s internal standards (e.g. recalibration); (2) a change in the importance attributed to health domains (i.e. change in values or reprioritization); and (3) a change in the definition of the concept of QOL (i.e. reconceptualization). Consider two persons with equal personality traits and the exact same health status. However, one of the individuals was born disabled and uses a wheelchair all of his life, while the other just had an accident a week ago and uses a wheelchair ever since. Based on our coping strategies it very likely that, even though both individuals are disabled, the first person is more content with his HR-QOL than the second person as this has been his situation this whole life, while the second person needs to adjust to this new situation. With the concept of response shift in mind, we established TOPICS-CEP based on the health valuations made by older persons who rated the health states of their peers.
Thus, when TOPICS-MDS instrument for older persons is used in clinical practice it is of great importance to ask the individual patients which outcomes (health domains) they find relevant. Yet, TOPICS-CEP is a valuable outcome for comparative effectiveness research, as more general statements can be made regarding the change of TOPICS-CEP scores which on average reflect added value according to the Dutch population aged 65 years and over.

138
CHAPTER 8
8.4 Future directions of TOPICS-MDS and TOPICS-CEP
Future role: PROMs in clinical practiceTOPICS-MDS contains core outcomes which validly measure health and wellbeing of older persons in the Netherlands.1 TOPICS-CEP combines these relevant outcomes into a multifaceted outcome measure and reflects health valuations according to Dutch persons aged 65 years and older. Ideally, TOPICS-MDS and its corresponding CEP will continue to grow, promote standardized data collection, and stimulate comparing the effectiveness of interventions in both academics as well as clinical practice. The first initial steps have been made, as stated by Jennifer Lutomski,
“The Dutch Society for Clinical Geriatrics (NVKG) has recently adopted TOPICS-MDS to monitor patient wellbeing. Thus, TOPICS-MDS will have the dual purpose of collecting pertinent research data as well as assisting clinical evaluation by providing the patient’s perspective on quality of care. The embracement of TOPICS-MDS by the Dutch Society for Clinical Geriatrics reflects the growing international interest in using Patient Reported Outcome Measures (PROMs) to measure quality of care”.13
In contrast to the typical way in defining successful treatments by clinician-oriented measures, e.g. the presence or absence of disease, PROMs are rooted in the perspective of the patient. A PROM is an instrument, scale, or single-item measure used to assess the concept Patient Reported Outcome (PRO) as perceived by the patient, obtained by directly asking the patient to self-report. The insight PROMs add into patients’ QOL cannot be readily extracted from electronic patient records. Thus, investigating how TOPICS-MDS and TOPICS-CEP preform as a PROMs is highly relevant for the healthcare sector.
The outcomes for patients can be improved by the use of PROMs as clinical tools. PROMs are promoted to support and enhance collaborative models of patient-clini-cian interaction and shared decision making. Moreover, they help ensure that patients voices are heard, which is much needed as our findings indicate that older persons and healthcare professionals value health states differently.16, 17 Shared decision making and PROMs go well together as in both patients are considered to be active participants. To promote greater clinician engagement and willingness to use PROMs in clinical practice it is important that clinicians are introduced to the tools through the prism of collaborative working and shared decision making, rather than as tools that are primarily used for audit or assessing performance.
139
SUMMARY AND GENERAL DISCUSSION
8
Priorities for future research and development During the validation of TOPICS-CEP we found a clear disparity between the valuations and health state preferences of older persons and healthcare professionals. These findings emphasise the necessity of outcome measures that are based on patients’ wishes, values and preferences. To build on this previous work, additional research to examine the responsiveness (does the instrument detect changes over time that matter to patients) of TOPICS-MDS as a PROM is currently underway in cooperation with ZonMw (The Dutch Organisation for Health Research and Development). The responsiveness of TOPICS-CEP as a composite PROM has not yet been explored. However, with the individual TOPICS-CEP components (e.g. EQ-5D utility score and KATZ index) often being used in trials to indicate the effect of interventions, we expect TOPICS-CEP to be responsive enough to reflect change over time.
Health insurers and various healthcare facilities have made it clear that they are interested in TOPICS-CEP. They want to use TOPICS-CEP scores to interpret and compare the effectiveness of clinical interventions and assess care management. Since 2006, the Dutch healthcare system has changed towards a demand-driven system of managed competition to contain costs and improve efficiency and quality of care. A precondition for managed competition is the freedom for insurers to contract and negotiate. Hence, since the introduction of the Health Insurance Act, insurers are free to decide where and by whom the benefits in the basic package are provided. This selective contracting is based on clear quality criteria. Consequently, both health insurers and healthcare providers are more interested in measuring, reporting and comparing quality of healthcare. Yet, there is insufficient data available to measure key outcomes in health and wellbeing to effectively compare the quality of care provided.
At the moment, uniform information is usually drawn from various sources, including existing clinical and administrative records and patients’ own assessments through Consumer Quality Index (CQ-index) surveys. With the growing demand for pa-tient-centred care and for the transparency and accountability of health services, client surveys such as the CQ-index are increasingly mandatory. The CQ-index is a National standard to measure healthcare quality from the perspective of patients and is based on the Consumer Assessment of Healthcare Providers and Systems (CAHPS)18 from the US and the Dutch Quality Of care Through the patient’s Eyes (QUOTE)19 instruments. It measures what patients find important in healthcare, what their actual experiences are, and how they rate the overall quality of care. CQ-index surveys can be used for the purpose of public reporting, quality assurance and governance, however, one great disadvantage of the surveys are their lengthiness.
140
CHAPTER 8
Insurers and health organisations who want to use TOPICS-CEP have some concerns regarding the feasibility of TOPICS-CEP. To motivate the use of TOPICS-CEP in clinical practice, further research needs to be done to examine whether TOPICS-CEP can be calculated with fewer TOPICS-MDS items without reducing the reliability and validity of TOPICS-CEP. In addition to item reduction, TOPICS-MDS can be made even more user friendly by designing it as an online tool that can calculate TOPICS-CEP at the press of a button. Finally, as stated before two individuals with identical self-assessed health status as reported by TOPICS-MDS may value their general wellbeing differently whilst their TOPICS-CEP scores are the same. Hence, the tool should not only be used as a measurement instrument, but also to facilitate patient-clinician interaction and to promote patient-centred care and shared decision making; understanding what the wishes, values, and preferences are of the patient who is sitting in front of you.
Other recommendationsIn this section we would like to elaborate on the importance of person-centred care and give our recommendations. Person-centred (or patient-centred) care is one of the overarching goals of health advocacy and it is defined as “Providing care that is respectful of and responsive to individual patient preferences, needs and values, and ensuring that patient values guide all clinical decisions”.20
To establish person-centred care, an integrated approach is necessary. A white paper published by Vilans (Centre of Expertise on Long-Term Care) describes the House of Person-Centred Care (Huis van Persoonsgerichte zorg),21 which is based on the “Co-creating health” approach and “House of Care” model from the UK.22, 23
Components of this framework are similar to the “Chronic Care Model” and “Guided Care model”, but differ because the components are structured in the shape of a house to emphasise the importance and balance needed between all components. Also, the “The House of Person-Centred Care” is meant for all people with long term care needs, and is not limited to people with chronic diseases. The model can act as a checklist (highlighting what needs to be in place), a metaphor (emphasising that person-centred care is complex and that all the components need to be in place to make it a success), and a flexible framework (guiding each healthcare professional to build a stable house designed round the needs of individual patients).
The House of Person-Centred care consists of five building blocks.21 To make this house stable the building blocks need to be secured. The left wall consists of well- informed patients and informal caregivers. The right wall are coaching healthcare professionals. The roof are organisations that facilitate and stimulate person-centred care. The foundation are context and healthcare procurement. In the heart of the

141
SUMMARY AND GENERAL DISCUSSION
8
house healthcare professionals and patients establish person-centred care by jointly (1) setting the agenda, (2) defining goals and planning action, and (3) evaluating and adjusting the actions when necessary during follow-up. TOPICS-CEP could fulfil its role as a PROM in the heart of the house by evaluating the actions (interventions).
Vilans, being an independent non-commercial knowledge institute in health care, might support further spread of TOPIC-CEP. Vilans operates at the interface between policy, science, and practice and helps professionals to improve care for the chronically ill, frail older people, and people with disabilities. Determining where improvements need to be made (agenda setting), which improvements need to be made (defining goals), how to achieve them (action planning and adjusting after follow-up) is done in partnership with managers, patients / clients / citizens, and policymakers in the heart of the house of care. To embed the person-centred approach, we strive to include one or more representatives of the target population within the organisation and within the projects Vilans facilitates.
Ideally, TOPICS-MDS and TOPICS-CEP are used to promote the person-centred care approach. For example, take the case of Jeremy [Box 1]. Before the consultation the
Figure 1 House of Person-Centred Care
142
CHAPTER 8
doctor emails TOPICS-MDS, for older persons, or a selection of TOPICS-MDS items that are included in TOPICS-CEP to Jeremy (‘agenda setting’). Jeremy fills in the survey and the doctor receives a notification. During the consultation Jeremy’s health outcomes are discussed and the doctor asks “Jeremy, what do you need? What are your wishes?” (‘coaching healthcare professionals’). Perhaps Jeremy says he just want to live without any pain or he could ask the doctor for advise on how he can become more independent again (‘defining goals’). After listening to Jeremy’s desires the doctor informs Jeremy about different possibilities with their effects and side effects (‘well informed patients’). “I can give you pain medication to reduce the pain and make you more mobile, however, one of the possible side effects is memory loss. Another option is occupational therapy to enable you to participate in activities of everyday life, however, not every health insurer covers these costs”. After having discussed various options with their benefits and harms Jeremy and the doctor make a joint decision about the treatment (‘action planning’). Finally, after a set time, Jeremy fills in the survey again. During the next consultation the doctor and Jeremy discuss the results and adjust the treatment if necessary (‘follow-up’). Additionally, TOPICS-CEP scores before and after the treatment can be used for research purposes to monitor the average value of the intervention according to the older Dutch population.
Advice for patientsTo successfully implement person-centred healthcare systems certain barriers need to be brought down. Creating person-centred healthcare systems requires a change in roles, behaviours and mind sets from healthcare professionals and patients.24 Historically, in many cultures the doctor-patient relationship was one of paternalism. In this relationship the doctor genuinely wants the best for the patients, but believes that the patient often needs to be firmly guided through the decision making process as they do not always know what is best for them. Nowadays “doctor knows best” is no longer reliable for predicting the best outcome for patients, thus it can no longer serve for planning the future. However, some people still cannot let go of the idea that “doctor knows best”. Perhaps this is driven by patients’ lack of knowledge, skills, and confidence to effectively manage their own health and care. Consequently, person-centred care should support individuals to self-manage, offer personalised care planning and enable people to share in decision making. Thus, the limited time patients spend with their healthcare professional should be used to coach and enable patients to become knowledgeable, confident managers of their own health and support them to make informed decisions and successfully manage their own health and care.
143
SUMMARY AND GENERAL DISCUSSION
8
Moreover, patients should be supported to stop acting as passive recipients and start acting as active participants or partners. Patients can be trained, guided, and encouraged to tell their healthcare professional what their wishes, desires, values and goals are when it comes to their health, wellbeing and QOL. Additionally, they can be coached to ask questions and offer alternative suggestions when it comes to treatments. As such professionals can help transforming their collaboration with patients by mutual communication and coaching on shared goal setting, shared decision making, and shared outcome measurements (i.e. TOPICS-CEP). By shifting in this direction patients may become better informed; knowing more alternatives and gain improved understanding of their proposed treatments’ advantages and disadvantages.
Advice for healthcare professionalsThe beliefs, attitudes, and behaviours ingrained in healthcare professionals could interfere with their ability to provide effective, person-centred care.24 Healthcare professionals may think they already use a truly person-centred approach, because there is a lack of a clear shared understanding about what effective person-centred care looks like. Moreover, some healthcare professionals may not realise the value of involving patients in co-creating health. By considering patients as partner rather than passive recipients, healthcare professionals gain insight in the motivations and challenges that each individual patient faces in selecting an intervention or adopting healthy behaviours; not just the biomedical challenges, but the psychological and social challenges as well. This is in line with the growing interest in shared decision making. Additionally, this fundamental shift in healthcare delivery emphasise the transition from focusing on improving clinical outcomes to QOL, from providing specialist treatment to generic support, and from a system that reacts to people’s ill health to one that focuses proactively on enabling people to live as healthy as possible. Therefore, we recommend to involve patients when providing training courses for healthcare professionals. In person-centred care medical knowledge (knowing which interventions are optional) and patients‘ experiences (understanding what these interventions mean in real life) are equally important. By giving patients the role of co-trainers they can bring in their own personal experiences, which may lead to eye openers.
Advice for managersHealthcare professionals could fear that a person-centred approach would lengthen the time of consultations and they don’t get enough time from their managers which is a legitimate concern. However, Robert Kaplan and Derek Haas state in their article “How not to cut healthcare costs” that one of five counterproductive mistakes that

144
CHAPTER 8
healthcare providers often make is trying to reduce costs by pressuring healthcare professionals to maximize the number of patients they see and minimize the time they spend with each patient.25 Many examples can be found in the literature with regard to how doctors treating chronic conditions could offer better advice and achieve better treatment compliance if they had more time to spend with their patients.26 The costs of this extra time would be compensated through fewer future complications, e.g. in emergency rooms and intensive care units. Thus, managers need to be aware that spending extra time with the patient is a good investment to insure delivering higher value care; better outcomes for lower costs.
Advice for researchersA more active role for patients is not only relevant for co-creating health, but also for setting priorities for health service research. The James Lind Alliance is a non-profit making initiative which brings together patients, informal caregivers, and healthcare professionals in Priority setting Partnerships to identify and prioritise the effects of treatments that they agree upon are most relevant. The aim of this alliance is to help ensure that those who fund health service research are aware of what matters to both patients and clinicians. As stated in The James Lind Alliance guidebook,
“Focusing research where it will be most useful requires finding out what patients and clinicians want to know from research, and which of their requests for research are most important and urgent. Patients and clinicians have ideas about which new technologies they would like to be fully tested, which current treatments warrant further testing, and which criteria they would use to judge success or failure”.27
As TOPICS-CEP is a preference-weighted outcome to evaluate HR-QOL, it could be used as a criteria to judge success or failure of a treatment.
Furthermore, research by INVOLVE (Public INVOLVEment in NHS, public health and social care research) found that involving patients in clinical research is of great value as it ensures acceptability of trails, and participants feel them to be ethical, well- designed and have relevant outcome measures.28 It also found that public involvement was reported to help increase recruitment to all types of research. Hence, it is of great importance to involve patients and healthcare professionals when setting the agenda for health service research.

145
SUMMARY AND GENERAL DISCUSSION
8
8.5 Final remarks
Complex healthcare needs are common among older persons, who more and more emphasise the importance of individually tailored support. Consequently, healthcare professionals should always strive to see the person behind the patient and offer person-centred care meaning that clinical decisions are guided by patient’s wishes and values. Moreover, in health services research outcome measures need to take patient preferences into account. Following the work presented in this thesis, TOPICS-CEP can serve as a reliable and valid preference-weighted outcome measure, which is based on the health state preferences of older persons. This is necessary, as we provided evidence that the health state preferences of older persons and healthcare professionals are not the same. I hope this thesis presents sufficient valid data to warrant further spread of TOPICS-CEP as a relevant quality outcome indicator for healthcare in older persons. Put in more general terms, and , finalising this thesis, I would like to stress the importance of good communication between clinicians, patients, and informal caregivers with regard to clinical decision making and strong patient involvement when setting the agenda and developing quality indicators for health services research.
146
CHAPTER 8
8.6 References1. Lutomski JE, Baars MA, Schalk BW, Boter H, Buurman BM, den Elzen WP, et al. The development of the
Older Persons and Informal Caregivers Survey Minimum DataSet (TOPICS-MDS): a large-scale data sharing initiative. PloS one. 2013;8(12):e81673. PubMed PMID: 24324716. Pubmed Central PMCID: 3852259.
2. Dolan P. Effect of age on health state valuations. Journal of health services research & policy. 2000 Jan;5(1):17-21. PubMed PMID: 10787582.
3. Dolan P, Roberts J. To what extent can we explain time trade-off values from other information about respondents? Social science & medicine. 2002 Mar;54(6):919-29. PubMed PMID: 11996025.
4. Wittenberg E, Halpern E, Divi N, Prosser LA, Araki SS, Weeks JC. The effect of age, race and gender on preference scores for hypothetical health states. Quality of life research : an international journal of quality of life aspects of treatment, care and rehabilitation. 2006 May;15(4):645-53. PubMed PMID: 16688497.
5. Wittenberg E, Winer EP, Weeks JC. Patient utilities for advanced cancer: effect of current health on values. Medical care. 2005 Feb;43(2):173-81. PubMed PMID: 15655431.
6. Kind P, Dolan P. The effect of past and present illness experience on the valuations of health states. Medical care. 1995 Apr;33(4 Suppl):AS255-63. PubMed PMID: 7723454.
7. Crespo M, Bernaldo de Quiros M, Gomez MM, Hornillos C. Quality of life of nursing home residents with dementia: a comparison of perspectives of residents, family, and staff. The Gerontologist. 2012 Feb;52(1):56-65. PubMed PMID: 21903614.
8. Gomez-Gallego M, Gomez-Amor J, Gomez-Garcia J. Determinants of quality of life in Alzheimer’s disease: perspective of patients, informal caregivers, and professional caregivers. International psycho-geriatrics / IPA. 2012 Nov;24(11):1805-15. PubMed PMID: 22697366.
9. Boyd CM, Darer J, Boult C, Fried LP, Boult L, Wu AW. Clinical practice guidelines and quality of care for older patients with multiple comorbid diseases: implications for pay for performance. Jama. 2005 Aug 10;294(6):716-24. PubMed PMID: 16091574.
10. Veit CT, Ware JE. Measuring health state and health care outcomes: Issues and recommendations. In: Kane RL, Kane RA, editors. Values and Long Term Care. Lexington, MA: Lexington Books; 1982. p. 233-59.
11. Huber M, van Vliet M, Giezenberg M, Winkens B, Heerkens Y, Dagnelie PC, et al. Towards a ‘patient-cen-tred’ operationalisation of the new dynamic concept of health: a mixed methods study. BMJ open. 2016;6(1):e010091. PubMed PMID: 26758267. Pubmed Central PMCID: 4716212.
12. Anderson JK, Zimmerman L, Caplan L, Michaud K. Measures of rheumatoid arthritis disease activity: Patient (PtGA) and Provider (PrGA) Global Assessment of Disease Activity, Disease Activity Score (DAS) and Disease Activity Score with 28-Joint Counts (DAS28), Simplified Disease Activity Index (SDAI), Clinical Disease Activity Index (CDAI), Patient Activity Score (PAS) and Patient Activity Score-II (PASII), Routine Assessment of Patient Index Data (RAPID), Rheumatoid Arthritis Disease Activity Index (RADAI) and Rheumatoid Arthritis Disease Activity Index-5 (RADAI-5), Chronic Arthritis Systemic Index (CASI), Patient-Based Disease Activity Score With ESR (PDAS1) and Patient-Based Disease Activity Score without ESR (PDAS2), and Mean Overall Index for Rheumatoid Arthritis (MOI-RA). Arthritis care & research. 2011 Nov;63 Suppl 11:S14-36. PubMed PMID: 22588741.
13. Lutomski JE. The Facts behind the Figures: The Validation of The Older Persons and Informal Caregivers Minimum Data Set [Doctoral thesis]. Nijmegen: Radboud university medical center; 2016.
14. Steel P, Schmidt J, Shultz J. Refining the relationship between personality and subjective well-being. Psychological bulletin. 2008 Jan;134(1):138-61. PubMed PMID: 18193998.
15. Rapkin BD, Schwartz CE. Toward a theoretical model of quality-of-life appraisal: Implications of findings from studies of response shift. Health and quality of life outcomes. 2004 Mar 15;2:14. PubMed PMID: 15023229. Pubmed Central PMCID: 408464.
16. Greenhalgh J. The applications of PROs in clinical practice: what are they, do they work, and why? Quality of life research : an international journal of quality of life aspects of treatment, care and rehabilitation. 2009 Feb;18(1):115-23. PubMed PMID: 19105048.
147
SUMMARY AND GENERAL DISCUSSION
8
17. Marshall S, Haywood K, Fitzpatrick R. Impact of patient-reported outcome measures on routine practice: a structured review. Journal of evaluation in clinical practice. 2006 Oct;12(5):559-68. PubMed PMID: 16987118.
18. Hargraves JL, Hays RD, Cleary PD. Psychometric properties of the Consumer Assessment of Health Plans Study (CAHPS) 2.0 adult core survey. Health services research. 2003 Dec;38(6 Pt 1):1509-27. PubMed PMID: 14727785. Pubmed Central PMCID: 1360961.
19. Sixma HJ, Kerssens JJ, Campen CV, Peters L. Quality of care from the patients’ perspective: from theoretical concept to a new measuring instrument. Health expectations : an international journal of public participation in health care and health policy. 1998 Nov;1(2):82-95. PubMed PMID: 11281863.
20. Institute of Medicine (U.S.). Committee on Quality of Health Care in America. Crossing the quality chasm : a new health system for the 21st century. Washington, D.C.: National Academy Press; 2001. xx, 337 p. p.
21. Boshuizen D, Engels E, Versleijen M, Vlek H, Rebel M, Driessen S. Hoe maak je een succes van persoons-gerichte zorg? [In Dutch only]2014 3 February 2016; 2016(3 February). Available from: http://www.kennispleinchronischezorg.nl/docs/KCZ/Whitepaper_Persoonsgerichte_zorg_Vilans2014.pdf.
22. Co-creating Health: The Health Foundation; [cited 2016 3 February]. Available from: http://www.health.org.uk/programmes/co-creating-health.
23. Enhancing the quality of life for people living with long term conditions – The House of Care: NHS England; [cited 2016 3 February]. Available from: https://www.england.nhs.uk/house-of-care/.
24. Foundation H. Person-centred care made simple2014 3 February 2016. Available from: http://www.health.org.uk/sites/default/files/PersonCentredCareMadeSimple.pdf.
25. Kaplan RS, Haas DA. How not to cut health care costs: Harvard business review; 2014. Available from: https://hbr.org/2014/11/how-not-to-cut-health-care-costs.
26. Haas DA, Krosner YC, Mukerji N, Kaplan RS. Delivering higher value care means spending more time with patients: Harvard business review; 2014. Available from: https://hbr.org/2014/12/delivering-high-er-value-care-means-spending-more-time-with-patients.
27. The James Lind Alliance Guidebook [cited 2016 3 February]. Available from: http://www.jlaguidebook.org/jla-guidebook.asp?val=68.
28. Staley K. Exploring impact: Public involvement in NHS, public health and social care research. 2009.


Chapter 9Nederlandse samenvatting | Dutch Summary

151
NEDERLANDSE SAMENVATTING | DUTCH SUMMARY
9
Nederlandse samenvatting
In 2008 is het Nationaal Programma Ouderenzorg (NPO) in opdracht van het Ministerie van Volksgezondheid, Welzijn en Sport gestart. Het NPO verbetert de zorg voor ouderen met complexe hulpvragen. Talrijke organisaties slaan daarvoor landelijk en regionaal de handen ineen. Het doel is een samenhangend zorgaanbod dat beter is afgestemd op de individuele behoeften van ouderen. Voor ouderen leidt deze kwaliteitsslag tot meer zelfredzaamheid, meer functiebehoud, minder terug hoeven vallen op de zorg en minder kans op zorg en behandelingen die onnodig belastend zijn. Binnen het NPO zijn meer dan 125 vernieuwende projecten uitgevoerd. Ook is ‘The Older Persons and Informal Caregivers Survey – Minimum DataSet’ (TOPICS-MDS) ontwikkeld. TOPICS-MDS bestaat uit vragenlijsten voor de oudere zorgvrager en mantel- zorger en een database waarin verzamelde gegevens zijn samengevoegd. De TOPICS-MDS vragenlijsten zijn in alle projecten die door het NPO gefinancierd worden ingezet om effecten van de studies te kunnen meten. De vragenlijsten zijn aan de start van het NPO samengesteld door experts uit de regionale netwerken ouderenzorg, Met hen zijn afspraken gemaakt over de te gebruiken uitkomstmaten in de projecten. Dit resulteerde in vragenlijsten die bestaan uit gangbare gevalideerde instrumenten die lichamelijke, psychische en sociale gezondheid en welzijn meten bij ouderen en mantelzorgers. De data die vervolgens zijn verzameld binnen alle NPO projecten, zijn centraal bijeengebracht in de TOPICS-MDS database. Daarmee is een unieke bron met waardevolle gegevens over gezondheid en welzijn van een groot aantal kwetsbare ouderen en mantelzorgers verspreid over Nederland ontstaan. Deze database bevat momenteel gegevens van meer dan 43.000 ouderen en 9.000 mantelzorgers van circa 60 verschillende projecten. Baseline gegevens van de projecten zijn op dit moment verzameld in de database en ook is van een aantal projecten follow-up data aanwezig in de database.
Dit proefschrift beschrijft de ontwikkeling en validering van een samengestelde uitkomstmaat (in het Engels: Composite Endpoint (CEP)) voor de TOPICS-MDS vragen- lijst voor zorgontvangers. Deze uitkomstmaat TOPICS-CEP genoemd, kan dienen als kwaliteitsindicator in de ouderenzorg. Hieronder worden de belangrijkste bevindingen kort samengevat.
Deel 1 geeft een algemene inleiding. De wereldpopulatie is aan het vergrijzen. Hierdoor komt er grote druk te staan op de zorg. Vanwege beperkte middelen, zowel financieel als personeel, is het belangrijk om de meerwaarde (ofwel het effect) van interventies voor de vast te kunnen stellen. Het is echter niet eenvoudig om in de
152
CHAPTER 9
ouderenzorg te bepalen welke interventies de grootste meerwaarde hebben. Dit komt doordat de gezondheidstoestanden van ouderen vaak complex zijn. Daarnaast hebben interventies vaak invloed op meerdere levensdomeinen tegelijkertijd. Een samengestelde uitkomstmaat die rekening houdt met de onderlinge relevantie van de uitkomstdomeinen (concepten waaruit de samengestelde uitkomstmaat bestaat) kan een mogelijke oplossing zijn voor dit probleem. Het belang van kwaliteitsindica-toren in het algemeen en van samengestelde uitkomstmaten in het bijzonder wordt beschreven in hoofdstuk 1.
Deel 2 beschrijft de ontwikkeling van TOPICS-CEP welke werd gebaseerd op de voorkeuren van ouderen en mantelzorgers. In toenemende mate verwacht de overheid een grotere verantwoordelijkheid van de burgers als het gaat om zorg en ondersteuning voor elkaar. Door de vergrijzing en het tekort aan personeel in de zorg zien we steeds vaker dat familieleden de rol van mantelzorger krijgen toebedeeld. In sommige gevallen, bijvoorbeeld wanneer een oudere lijdt aan cognitieve stoornissen, treden naasten op als proxies, d.w.z. dat meningen, opvattingen en ervaringen van personen uit de omgeving van de patiënt worden gebruikt als vervanging van die van de patiënt. Dit was voor ons een belangrijke reden om te onderzoeken of ouderen en mantelzorgers de verschillende gezondheidsdomeinen: chronische aandoeningen, functionele beperkingen, emotioneel welbevinden, pijnervaring, cognitieve problemen, sociaal functioneren, zelf ervaren gezondheid en zelf ervaren kwaliteiten van leven (acht componenten verkregen uit de TOPICS-MDS vragenlijst) op dezelfde manier wegen wanneer het gaat om het beoordelen van het algemeen welbevinden van een persoon. Door gebruik te maken van vignetten, wat korte omschrijvingen zijn van personen, hebben wij de gewichten voor de verschillende componenten berekend en vergeleken. De gewichten, ook wel preferentiegewichten genoemd, reflecteren hoe belangrijk de ouderen en mantelzorgers de verschillende domeinen vinden. De resultaten van deze vignettenstudie worden in hoofdstuk 2 beschreven. In totaal werkten 124 ouderen en 76 mantelzorgers mee aan deze studie. Wanneer we de gewichten van deze twee groepen vergeleken, bleek dat er geen verschillen waren. Om deze reden hebben wij TOPICS-CEP ontwikkeld, een gewogen samengestelde uitkomstmaat, gebaseerd op de voorkeuren van zowel ouderen als mantelzorgers.
Verschillende studies hebben laten zien dat eigenschappen van personen invloed hebben op hoe zij oordelen vellen over bijvoorbeeld kwaliteit van leven en ervaren gezondheid. Daarom hebben wij, op basis van gegevens die wij in de eerste vignet-tenstudie hebben verzameld, onderzocht of en op welke manier de eigenschappen van onze deelnemers invloed hebben gehad op de preferentiegewichten die zijn opgenomen in TOPICS-CEP. De resultaten van deze studie worden in Hoofdstuk 3 beschreven. We hebben in deze studie onderzocht of het geslacht, de leeftijd en zelf

153
NEDERLANDSE SAMENVATTING | DUTCH SUMMARY
9
ervaren gezondheid van onze deelnemers van invloed zijn geweest op de preferen-tiegewichten van de acht componenten waaruit TOPICS-CEP bestaat. Hierbij hebben we gecontroleerd voor de invloed van het al dan niet mantelzorger zijn. De rol als mantelzorger blijkt echter geen invloed te hebben gehad op onze bevindingen. Onze resultaten laten verder zien dat de leeftijd en ervaren gezondheid van onze deelnemers van invloed zijn geweest op de preferentiegewichten van TOPICS-CEP. Echter verdwijnt de invloed van ervaren gezondheid wanneer er wordt gecorrigeerd voor leeftijd. Hieruit kunnen we opmaken dat de leeftijdssamenstelling van onze deelnemers invloed heeft gehad op de preferentiegewichten van de TOPICS-CEP. Deze bevinding heeft ertoe geleidt dat we in de richtlijnen voor het gebruik van TOPICS-CEP (www.topics-mds.eu) duidelijk hebben aangeven op welke steekproef de preferentiegewichten gebaseerd zijn. Daarnaast hebben we, gebaseerd op de leeftijdsverdeling van ouderen (65-plussers) in Nederland, de gewichten aangepast zodat deze de preferenties van de Nederlandse populatie van 65 jaar en ouder reflecteert.
Deel 3 beschrijft de relevantie van TOPICS-CEP. Het vaststellen van lange termijn veranderingen in het algemeen welbevinden of kwaliteit van leven is een belangrijk onderdeel van klinisch onderzoek en evaluaties. Vaak wordt er aan patiënten of cliënten zelf gevraagd wat zij van hun algemeen welbevinden of kwaliteit van leven vinden, bijvoorbeeld door er een rapportcijfer aan te geven. Hoewel dit een relevante vraag is en nuttige informatie kan opleveren, is de beoordeling niet alleen afhankelijk van het effect van de interventie maar ook van bijvoorbeeld ”adaptatie”. Adaptatie is een natuurlijk proces waarbij men leert omgaan met tegenslagen. Doordat een persoon bijvoorbeeld beperkingen in het dagelijks leven heeft geaccepteerd, zal hij/zij zijn/haar algemeen welbevinden geen lager rapportcijfer geven vanwege functionele beperkingen. Daarnaast zijn mensen geneigd om hun eigen leven te vergelijken met anderen die het nog slechter hebben, dit wordt ‘framing’ genoemd. Door gebruik te maken van een samengestelde uitkomstmaat wordt het mogelijk om een subjectief concept zoals algemeen welbevinden op een objectieve manier te benaderen maar hierbij nog wel rekening te houden met wat ouderen over het algemeen relevant vinden.
Hoofdstuk 5 beschrijft de studie waarbij wij hebben onderzocht in welke mate de beoordeling door externe ouderen (participanten uit onze eerste vignettenstudie) overeenkomen met de rapportcijfers die de casus omschreven in de vignet zichzelf had gegeven. Normaliter is de Bland-Altman methode de meest gekozen methode om de mate van overeenstemming (‘level of agreement’) tussen twee beoordelaars te onderzoeken. Deze methode krijgt de voorkeur boven een scatterplot of correlatietest, omdat deze laatste twee geen rekening houden met systematische
154
CHAPTER 9
verschillen. De Bland-Altman methode is echter in zijn huidige vorm niet te gebruiken om de overeenstemming tussen onze individuele interne beoordelaars (de casus) en onze groep externe beoordelaars te bestuderen. Hoofdstuk 4 beschrijft op welke manier de Bland-Altman methode moet worden aangepast, zodat deze wel kan worden gebruikt om de mate van overeenstemming tussen twee groepen van ongelijke grootte te bepalen; dus ook wanneer de ene groep bestaat uit één beoordelaar, terwijl de ander groep bestaat uit 2 of meer beoordelaars. Gebruik makend van de aangepaste Bland-Altman methode laat de plot in hoofdstuk 5 zien dat er systematische verschillen bestaan tussen de beoordelingen van externe beoordelaars en de zelf gegeven rapportcijfers (interne beoordeling door de casus). Deze consistente bias en de richting daarvan komt overeen met wat wij hadden verwacht hadden vanwege o.a. adaptatie en framing. Concreet betekent dit dat interne en externe beoordelingen niet identiek zijn en daardoor niet verwisselbaar zijn. Zij zijn echter wel complementair en we adviseren dan ook om beiden te gebruiken. Het zelf oordeel geeft inzicht in hoe een patiënt of cliënt diens eigen kwaliteit van leven beoordeelt op een bepaald moment, terwijl de externe beoordelingen inzicht geven in hoe de populatie waartoe de patiënt of cliënt behoort de kwaliteit van leven over het algemeen zou beoordelen.
Omdat zorgverleners vaak zelf een inschatting maken of een bepaalde interventie nut heeft gehad wilden wij onderzoeken of zij gezondheidstoestanden op dezelfde manier evalueren als ouderen en mantelzorgers. Met andere woorden: we hebben gekeken of de gewichten van de TOPICS-CEP componenten gebaseerd op de preferenties van ouderen en mantelzorgers overeenkwamen met de gewichten gebaseerd op de preferenties van zorgverleners. Om dit te onderzoeken hebben we een tweede vignettenstudie uitgevoerd waarbij 330 zorgverleners het algeheel welbevinden van ouderen omschreven in vignetten een rapportcijfer hebben gegeven. De resultaten van deze vignettenstudie worden in hoofdstuk 6 beschreven. In totaal hebben 127 artsen, 102 verpleegkundigen, 45 welzijnsmedewerkers en 56 paramedici deelgenomen aan deze studie. De resultaten laten zien dat de gevonden gewichten van de componenten welke zijn gebaseerd op de preferenties van de zorgverleners niet werden beïnvloed door de samenstelling van de steekproef met betrekking tot de discipline waartoe zij behoorden. Het aantal jaar werkervaring binnen de huidige functie heeft echter wel invloed gehad op de preferentiegewich-ten. Hoe langer men werkzaam is (in de ouderenzorg), des te minder waarde men hecht aan het aantal chronische aandoeningen. Nadat wij hadden vastgesteld dat de samenstelling van de groep verder geen invloed heeft gehad op de gewichten van de componenten, hebben we de gewichten welke gebaseerd zijn op de preferenties van ouderen en mantelzorgers vergeleken met de gewichten die gebaseerd zijn op de preferenties van de zorgverleners. Hieruit blijkt dat ouderen en mantelzorgers meer

155
NEDERLANDSE SAMENVATTING | DUTCH SUMMARY
9
waarde hechten aan chronische aandoeningen en functionele beperkingen in vergelijking met zorgverleners, terwijl het omgekeerde geldt voor de componenten pijnervaring, sociaal functioneren en ervaren kwaliteit van leven.
Samengestelde uitkomstmaten hebben de potentie om vergelijkend onderzoek naar de effecten van interventies te vergemakkelijken. Het is echter van belang om de validiteit van dergelijke uitkomstmaten te evalueren; meten we wat we willen meten? Hoofdstuk 7 beschrijft de TOPICS-CEP validatiestudie. In deze studie werd gebruik gemaakt van 17.603 datasets uit de Nationale database van de TOPICS-MDS. In januari 2014 hadden 41 projecten hun data afgestaan aan de TOPICS-MDS voor het vullen van een Nationale database, waarvan wij er 30 hebben geïncludeerd in deze studie. De convergente validiteit van de TOPICS-CEP werd bepaald door de TOPICS-CEP scores van de 17.603 casus te vergelijken met andere uitkomstmaten die gerelateerd zijn aan algemeen welbevinden, zoals Cantril’s ladder (kwaliteit van leven) en EuroQol-5D (gezondheid gerelateerde kwaliteit van leven); ofwel hoe hangen deze uitkomstmaten samen? Daarnaast hebben wij de TOPICS-CEP scores van ouderen met dementie vergeleken met de scores van ouderen zonder dementie om de known group validiteit te onderzoeken; ofwel kan m.b.v. TOPICS-CEP scores de twee groepen worden onderscheiden? Hetzelfde hebben we gedaan voor de groepen: depressief versus niet depressief, vallen versus niet vallen, zelfstandig wonend versus niet zelfstandig wonend, getrouwd versus weduwe(naar). Tenslotte hebben we ook onderzocht of TOPICS-CEP generaliseerbaar is; ofwel kan TOPICS-CEP voor verschillende groepen kan worden gebruikt om het algeheel welbevinden te evalueren? De resultaten laten zien dat er een matige samenhang bestaat tussen TOPICS-CEP en Cantril’s ladder en een sterkere samenhang tussen TOPICS-CEP en EuroQol-5D. In tegenstelling tot de EuroQol-5D scores laten de TOPICS-CEP scores geen plafond effect zien. De TOPICS-CEP scores tussen de verschillende groepen zijn significant verschillend in de richting zoals we deze hadden verwacht; ouderen met dementie krijgen een lagere TOPICS-CEP score in vergelijking met ouderen zonder dementie. Onze resultaten suggereren dat TOPICS-CEP een geschikte uitkomstmaat is voor verschillende ouderen populaties.
Laatste opmerkingenComplexe zorgvragen komen vaak voor bij ouderen. Idealiter vraagt dit om individueel afgestemde ondersteuning. Hiervoor is het van belang dat zorgverleners de persoon achter de patiënt zien, zodat zij persoonsgerichte zorg kunnen bieden. Dit betekent dat zij de wensen en behoeften van de patiënt leidend laten zijn bij het kiezen van een interventie. Daarnaast dient in onderzoek naar de meerwaarde van aangeboden zorg uitkomstmaten te worden gebruikt die rekening houden met de wensen en behoeften (voorkeuren) van patiënten.

156
CHAPTER 9
Naar aanleiding van de studies omschreven in dit proefschrift stellen we dat TOPICS-CEP kan dienen als een betrouwbaar en valide uitkomstmaat die rekening houdt met de voorkeuren van ouderen. Dat dit nodig is blijkt uit onze resultaten die laten zien dat wanneer de beoordelingen van gezondheidstoestanden worden vergeleken tussen ouderen en zorgverleners de twee groepen andere voorkeuren hebben. Hierover is een infographic gepubliceerd in de telegraaf van 6 juni 2015.
Tenslotte eindigen we dit proefschrift met het benadrukken van het belang van goede communicatie tussen clinici, patiënten en mantelzorgers met betrekking tot het nemen van klinische beslissingen. Wij adviseren zorgverleners en onderzoekers om patiënten en/of cliënten te betrekken bij het vaststellen van de agenda (waar moet over worden nagedacht) en bij de ontwikkeling van kwaliteitsindicatoren in de zorg. Het is belangrijk om de persoon achter de patiënt te zien en te blijven zien!

157
NEDERLANDSE SAMENVATTING | DUTCH SUMMARY
9


Extras,
Additional,
Supplementary,
More,Plus...
Part 6Supplementary

Dankwoord | Acknowledgements

163
DANKWOORD | ACKNOWLEDGEMENTS
Dankwoord (Acknowledgements)
“Het leed wat promoveren heet”, maar dankzij verschillende mensen heb ik de eindstreep nu dan toch gehaald.
Allereerst wil ik alle ouderen, mantelzorgers en zorgverleners bedanken die hebben deelgenomen aan dit onderzoek. Zonder jullie was dit proefschrift er niet geweest en had er geen TOPICS-CEP bestaan. Hartelijk dank voor jullie inzet.
Natuurlijk wil ik mijn promotor, voormalig promotor en copromotoren bedanken. Marcel, jouw feedback op mijn stukken was altijd beknopt en helder, dus dat ga ik nu ook zijn. Bedankt voor jouw snelle reacties op mijn mails (zelfs tot laat in de avond) en voor het open staan voor mijn soms wat “vreemde” (animal assisted therapy) ideeën. George, helaas heb ik de eindstreep zonder jou moeten bereiken maar wat een mooie sprint hebben wij aan het begin gemaakt. Het was erg fijn om met je samen te werken en ik vond het dan ook verschrikkelijk toen ik hoorde dat je ermee ging stoppen. Rogier, jouw taak was om George op te volgen binnen ons team en dat heb je echt super gedaan. We hebben waardevolle overleggen gepleegd en mede dankzij jouw heldere uitleg over de statistiek heb ik zelf alle analyses kunnen uitvoeren, mijn dank daarvoor. René, last but not least. Waar moet ik beginnen? Bedankt voor het feit dat jij (en George) mij de kans hebt gegeven om zelfstandig onderzoek te doen; bedankt voor de feedback op al mijn stukken; bedankt voor jouw gezelschap in de trein naar Groningen, Leiden, Amsterdam en Utrecht; en bedankt dat je het met mij hebt uitgehouden.
Daarnaast gaat mijn dank uit naar de leden van de manuscriptcommissie: Prof. dr. Gert Westert, Prof. dr. Piet van Riel en Prof. dr. Anna Nieboer. Hartelijk dank voor jullie bereidheid om in de commissie plaats te nemen en dit proefschrift te beoordelen.
Verder wil ik ook het OPROCS-project team bedanken. Bianca Buurman, Han Boter en Ton de Craen fijn dat jullie onderdeel wilden zijn van ons team. Bedankt voor jullie inzet en commentaar op de papers. Peter, voor jou geldt dat je het team pas in een later stadium kwam versterken. Je hebt mij door de soms wat moeilijke dagen gesleept en geholpen wanneer dit nodig was. Je weet niet half hoe waardevol je bent geweest. Thanks!
De data had ik niet kunnen verzamelen zonder de hulp van Lieke Rijnen, Mieke Luten, Frank Schalkwijk, Marga de Fretes, Loes Kramer, Maureen van den Boom-Kalker en Michelle Langeveld-Kolman. Jullie allen heel erg bedankt.
164
DANKWOORD | ACKNOWLEDGEMENTS
En dan hebben we natuurlijk ook nog Wim Lemmens! Wim, bedankt voor je technische ondersteuning bij het ontwikkelen van de vignetten, maar in het bijzonder bedankt dat ik zomaar 10 minuten bij je kon binnenvallen voor de gezellig familie praatjes.
Het secretariaat wil ik bedanken. Lieve Gemma, Nora, Maja en Hanna, fijn dat jullie ruimtes voor de afdelingslunches wilden reserveren (ook al konden jullie zelf niet altijd aanschuiven). En bedankt voor het uitzoeken van allerlei dingetjes die weer verkeerd gingen of onduidelijk waren, met name binnen MijnTijd en MijnOntwikkeling en tijdens de implementatie van Werkplek 2.0. Ook na mijn vertrek op de afdeling kon ik altijd met vragen bij jullie terecht. Super!
Collega-onderzoekers bedankt voor de gezellige pauzes. In de afgelopen vier en een half jaar hebben veel mensen de afdeling verlaten en ook weer bezet, daarom ga ik er niet aan beginnen om jullie allemaal bij naam te noemen. Maar een aantal van jullie hebben toch een belangrijke rol gespeeld in de afgelopen jaren. Allereerst mijn kamergenoten waarmee ik goede en minder goede tijden mee heb mogen delen: Sarah, Petra, Marieke, Joep, Jaap, Gerrita en Kim. Bedankt dat jullie er waren. Van Kempen, jou wil ik nog even apart noemen. Wat had ik een geluk met jou als kamergenoot voor drie lange, maar geweldige jaren. En wat fijn dat René en Gerda ervoor hebben gezorgd dat wij (met onze autistische trekken) ook op de derde verdieping een kamer mochten blijven delen. Bedankt voor het aanhoren van mijn gezeur (van tijd tot tijd) en voor je nuchtere kijk op dingen!
Daarnaast wil ik ook in het bijzonder twee TOPICS-MDS mensjes bedanken: Lia en Jenn. Girls thanks for your positive outlook on life and your enthusiasm when it comes to research. I used to be a bit uncertain about my own competence, but you were there to make me believe and achieve. I have always been aware of my own weaknesses and now I am also aware of my own strengths! Thank you both and cool beans :)
Wat is een mens zonder vrienden? Daarom wil ik ook hen bedanken voor de steun en afleiding wanneer dit nodig was. Lieve Liza, Nieky en Linda, we zien elkaar veel minder dan jaren terug, maar ik blijf ons contact bijzonder en waardevol vinden. Ongeacht hoe lang we elkaar niet hebben gesproken, wanneer we elkaar weer zien is het direct als vanouds. Bedankt dat jullie zijn wie jullie zijn! Don’t ever change!
En nu komt het zware werk, nu mag ik mijn familie bedanken. Lieve Pama (mijn ouders), waar moet ik beginnen? Wat zijn jullie heerlijke mensen en wat hebben jullie mij goed opgevoed Hoewel ik eerst dacht dat vriendelijkheid en respect voor
165
DANKWOORD | ACKNOWLEDGEMENTS
anderen (voor ouderen) normaal was, ben ik er achter genomen dat het iets is wat ik van huis uit heb meegekregen. Het is niet iets wat je kunt “faken”. Doen alsof is niet voldoende, je moet daadwerkelijk de respect hebben voor anderen om ze het gevoel te kunnen geven dat ze gerespecteerd en gehoord worden; dus bedankt voor jullie goede opvoeding. En wat heb ik een mazzel gehad dat ik altijd heb mogen doen wat ik zelf wilde, ook al kostte het meer tijd dan gepland. Ik weet dat jullie trots op me zijn, ook al weten jullie nooit precies wat ik aan het doen ben of heb gedaan. Ik houd van jullie en bedankt dat jullie nog altijd en voor altijd achter mij staan.
Lieve Ingrid en Jan, wat fijn dat toen ik Guido leerde kennen ik er gelijk een lieve familie bij kreeg. De vakanties die mij weerhielden van gek worden en wellicht de handdoek in de ring te gooien waren niet mogelijk zonder jullie. Dankzij jullie hoefde ik geen zorgen te maken om Bilbo; ik wist en weet nog steeds dat hij bij jullie in goede handen is. Bedankt voor jullie goede zorgen. En in jullie oprechte interesse in wat ik doe.
Wen en Il, zelfs op afstand hebben jullie een goede invloed op mij. Gewoon door mail contact, vakanties in Oostenrijk en bezoekjes aan jullie in Zwitserland geeft mij energie. Heerlijk! Bedankt! En tja, de jongens… Joshua en Ayden, jullie hebben van mij een trotste en vrolijke Tante Sin gemaakt. Ongeacht mijn humeur een foto of filmpje van jullie via de Whats App tovert altijd weer een glimlach op mijn gezicht. Gracias!
Tot slot mijn eigen Meneer (Guido) onbegrijpelijk hoe jij het met me hebt uitgehouden. Mijn humeurige avonden, druk bezette agenda en luie weekenden, moeten niet altijd even makkelijk voor jou zijn geweest. Bedankt voor jouw geduld, voor jouw goede zorgen voor mij, Bilbo en tot vorig jaar ook voor Pluto én voor de heerlijke zomervakanties. Zonder jou had ik nooit de wereld ontdekt en had ik deze eindstreep nooit gehaald!
Veel liefs,Sin


Curriculum Vitae


169
CURRICULUM VITAE
Curriculum Vitae
Cynthia Hofman was born in Bergen op Zoom (the Netherlands)on June 9th 1981. In 1998 she graduated from higher general secondary education and in 2000 from pre-university education, Mollerlyceum in Bergen op Zoom. She subsequently received a Bachelor’s degree in Psychology and a Master’s degree in Neuro- en Rehabilitation psychology at the Radboud University Nijmegen. In 2008 she worked at the Psychiatry department of the Radboud university medical center for her research internship, where PhD candidate Martine Hoogman introduced her with conducting scientific research. Cynthia wrote her Master thesis “Behaviour regulation in adults with ADHD: Attention, mental flexibility, and response inhibition” under the supervision of Paul Eling. After her internship and while writing her thesis she worked as a student-assistant at ParkinsonNet, a National project that was launched by the Neurology department of Radboud university medical center. After her graduation in 2010 she was offered a PhD position at the department of Geriatric medicine and the department for Health Evidence at the Radboud university medical center. She worked under the supervision of Marcel Olde Rikkert, René Melis, and Rogier Donders. Finally, her research resulted in this thesis. During her PhD project, Cynthia was a board member of the National Association “De Zonnebloem”. In addition, she was temporarily the webmaster of “De Zonnebloem” website (region De Liemers) and chair of the workgroup “New media”. Since July 2014 she works at Vilans (centre of expertise on long-term care) as an consultant and researcher. Her primary focus is on Frail elderly and dementia, Patient centred care, and Shared Decision Making.

170
CURRICULUM VITAE IN DUTCH
Curriculum Vitae in Dutch
Cynthia Hofman werd op 9 juni 1981 geboren in Bergen op Zoom. In 1998 behaalde zij haar HAVO diploma en in 2000 haar VWO diploma aan het Mollerlyceum te Bergen op Zoom. Vervolgens begon ze in 2000 aan de bacheloropleiding Psychologie aan de Radboud Universiteit Nijmegen, gevolgd door de masteropleiding Neuro- en Revalidatie psychologie. Voor haar wetenschappelijke stage werkte ze in 2008 op de afdeling Psychiatrie van het Radboud universitair medisch centrum. Onder leiding van promovenda Martine Hoogman maakte ze kennis met het uitvoeren van weten-schappelijk onderzoek en onder begeleiding van Paul Eling schreef ze haar Master-scriptie “Gedragsregulatie in volwassenen met ADHD: Aandacht, mentale flexibiliteit en responsinhibitie”. Na haar stage en tijdens het schrijven van haar scriptie werkte ze als student-assistent bij het ParkinsonNet op de afdeling Neurologie van het Radboudumc. Na haar afstuderen in 2010 werd ze in de gelegenheid gesteld te gaan werken als onderzoeker in opleiding op de afdelingen Geriatrie en Health Evidence van het Radboudumc. Ze werkte onder leiding van Marcel Olde Rikkert, René Melis en Rogier Donders aan haar onderzoek wat uiteindelijke leidde tot de publicatie van dit proefschrift. Tijdens haar promotietraject werd ze benoemd tot Bestuurslid Activiteiten van Nationale Vereniging “De Zonnebloem” Regio De Liemers. Naast deze functie vervulde ze ook tijdelijk de functie van webbeheerder van de website van “De Zonnebloem - Regio De Liemers” en was zij voorzitter van de werkgroep “Nieuwe media”. Sinds juli 2014 werkt ze als adviseur en onderzoeker bij Vilans (Kenniscentrum langdurige zorg) op de thema’s Kwetsbare ouderen en dementie, Persoonsgerichte zorg en Gezamenlijke besluitvorming.

171
CURRICULUM VITAE IN DUTCH


Publications

175
PUBLICATIONS
Publications
Journal articles (this thesis)
Hofman CS, Makai P, Boter H, Buurman BM, de Craen AJM, Olde Rikkert MGM, Donders ART, Melis RJF. Establishing a composite endpoint for measuring the effectiveness of geriatric interventions based on older persons’ and informal caregivers’ preference weights: a vignette study. BMC Geriat 2014 Apr 18; 14:51. Doi 10.1186/1471-2318-14-51.
Hofman CS, Makai P, Boter H, Buurman BM, de Craen AJM, Olde Rikkert MGM, Donders ART, Melis RJF. The influence of age on health valuations: the older olds prefer functional independence while the younger olds prefer less morbidity. Clin Interv Aging. 2015 Jul 8;10:1131-9. Doi: 10.2147/CIA.S78698.
Hofman CS, Lutomski JE, Olde Rikkert MGM, Melis RJF, Donders ART. Letter to the editor: Examining consistency between self-assessed and peer ratings in older people. Journal of the American Geriatrics Society. [In press] Hofman CS, Makai P, Blom JW, Boter H, Buurman BM, Olde Rikkert MGM, Donders ART, Melis RJF. Comparing the health state preferences of older persons, informal caregivers and healthcare professionals: a vignette study. PloS One. 2015 Mar 4; 10(3). Doi: 10.1371/journal.pone.0119197.
Hofman CS, Lutomski JE, Boter H, Buurman BM, de Craen AJM, Donders ART, Olde Rikkert MGM, Makai P, Melis RJF. Examining the Construct and Known-group Validity of a Composite Endpoint for The Older Persons and Informal Caregivers Survey Minimum Data Set (TOPICS-MDS); A Large-Scale Data Sharing Initiative. PlosOne. [In press]
Hofman CS, Melis RJF, Donders ART. Adapted Bland-Alman method was used to compare measurement methods with unequal observations per case. J Clin Epidemiol. 2015 Aug;68(8):939-43. Doi:10.1016/j.clinepi.2015.02.015.

176
PUBLICATIONS
Other publications Book chapters
Hofman CS. (2015) Het wijkteam en het geriatrisch netwerk. In: van Maurik-Brandon S, Ten Dam, VH en Dautzenberg PLJ (red). Protocollaire ouderenzorg. Nederlandse Huisartsen Genootschap. p. 63-73.
Guldemond F, Hogerwaard W, Hofman CS. (2015) Kwaliteit. In: van Maurik-Brandon S, Ten Dam, VH en Dautzenberg PLJ (red). Protocollaire ouderenzorg. Nederlandse Huisartsen Genootschap. p. 79-92.
Hofman CS. (2015) Ouderen met beperkte gezondheidsvaardigheden. In: van Maurik-Brandon S, Ten Dam, VH en Dautzenberg PLJ (red). Protocollaire ouderenzorg. Nederlandse Huisartsen Genootschap. p. 169-78.
Hofman CS. (2015) Mantelzorgondersteuning en ouderenmishandeling. In: van Maurik-Brandon S, Ten Dam, VH en Dautzenberg PLJ (red). Protocollaire ouderenzorg. Nederlandse Huisartsen Genootschap. p. 179-88.

177
PUBLICATIONS

Ouderen bepalen zelf de meerwaarde van hun zorg
Beschrijving Hofman deed onderzoek naar de zorgvoorkeur van ouderen en mantelzorgers. In het onderzoek werd een samengestelde uitkomstmaat ontwikkeld, die rekening houdt met wat ouderen en mantelzorgers belangrijk vinden voor het algeheel welbevinden. De relevantie van zo’n uitkomstmaat blijkt onder andere uit het verschillende belang dat ouderen, hun mantelzorgers en de zorgverleners (artsen, verpleegkundigen en paramedici) toekennen aan relevante uitkomstdomeinen voor de zorg. Hofman stelt dan ook, dat ouderen en zorgverleners verschillende opvattingen hebben over welke levensdomeinen het belangrijkst (meest relevant) zijn. Zo hechten ouderen meer waarde aan zelfstandig functioneren dan zorgverleners, terwijl zorgverleners pijnreductie belangrijker vinden dan de ouderen zelf. Hofman adviseert om ouderen zelf de meerwaarde van de ouderenzorg te laten bepalen. Daarnaast pleit ze voor gesprekken tussen ouderen, mantelzorgers en zorgverleners voor het stellen van doelen en het samen beslissen over het te volgen zorgpad.
Biografie Cynthia Hofman (9 juni 1981) begon in 2000 aan de bacheloropleiding psychologie aan de Radboud Universiteit, gevolgd door de masteropleiding Neuro- en Revalidatie-psychologie. Voor haar wetenschappelijke stage werkte ze in 2008 op de afdeling Psychiatrie van het Radboudumc. Na haar afstuderen in 2010 deed ze als onderzoeker in opleiding promotieonderzoek op de afdelingen Geriatrie en Health Evidence binnen het onderzoeksinstituut Radboud Institute for Health Sciences (RIHS) van het Radboudumc. Sinds juli 2014 werkt ze als adviseur en onderzoeker bij Vilans (Kenniscentrum langdurige zorg).