development and validation of uv …€¦ · · 2015-04-17diclofenac sodium in tablet dosage form...
TRANSCRIPT

Available Online through
www.ijpbs.com (or) www.ijpbsonline.com IJPBS |Volume 3| Issue 4 |OCT-DEC|2013|42-48
Research Article
Pharmaceutical Sciences
International Journal of Pharmacy and Biological Sciences (e-ISSN: 2230-7605)
Mary Mathew*et al Int J Pharm Bio Sci www.ijpbs.com or www.ijpbsonline.com
Pag
e42
DEVELOPMENT AND VALIDATION OF UV SPECTROPHOTOMETRIC METHODS
FOR SIMULTANEOUS ESTIMATION OF TOLPERISONE HYDROCHLORIDE AND
DICLOFENAC SODIUM IN TABLET DOSAGE FORM
Amita S Ashokan1,* Mary Mathew1, Shajahan Puthusseri1
1College of Pharmaceutical Sciences, Government Medical College, Trivandrum, Kerala-695011
*Corresponding Author Email: [email protected]
ABSTRACT This present study reports the simultaneous quantification of Tolperisone hydrochloride and Diclofenac sodium in
the bulk drug and tablet dosage form employing simultaneous equation and absorbance ratio method. This
method allows determination of Tolperisone hydrochloride and Diclofenac sodium at their λmax 254 nm and 282
nm respectively and at the iso-absorptive wavelength of 238 nm in methanol. Tolperisone at λmax of 254 nm obeyed
Beer’s Law in the concentration range 4-12 μg/ml and Diclofenac sodium at λmax of 282 nm obeyed Beer’s Law in
the concentration range 8-16 μg/ml. The accuracy and reliability of the method was assessed by linearity,
precision (intra-day % RSD and inter-day % RSD of Tolperisone hydrochloride and Diclofenac sodium) and
specificity in accordance with ICH guidelines.
KEY WORDS Absorbance ratio, Diclofenac sodium, Simultaneous estimation, Tolperisone hydrochloride, Validation.
INTRODUCTION
Tolperisone hydrochloride (TOL), N-(2-[2-
[(dimethylamino) methyl] thiazol-4-yl) methylthio]
ethyl)-N-methyl-2-nitroethene-1, 1-diamine is a
centrally acting muscle relaxant, widely used as
spasmolytic. Diclofenac sodium (DIC), 2-[(2, 6-
dichlorophenyl) amino] phenyl acetic acid
monosodium salt is an NSAID act by inhibiting Cyclo-
oxygenase[Cox] and suppressing the synthesis of
prostaglandin F2.
Literature review reveals that only few methods are
available for simultaneous estimation of Tolperisone
hydrochloride and Diclofenac sodium in two
component dosage forms.
MATERIALS AND METHODS
Materials:
Tolperisone hydrochloride and Diclofenac sodium
were obtained from Themis Medicare Limited,
Gujarat and Wockhardt Pharmaceuticals Ltd,
Aurangabad. The combined dosage form was
purchased from local market (Tolperisone tablet 150
mg, marketed by Merck limited Mumbai, Methanol
HPLC grade was obtained from SD Fine-chemicals Ltd
Mumbai).
Instrumentation
Jasco V 560 Double Beam UV-VIS Spectrophotometer
with spectral band width 2.0 nm wavelength,
accuracy 0.5 nm and quartz cells of 1cm pathlength
were used for all spectral and absorbance
measurements. Class A Volumetric glasswares were
used.
Available Online through
www.ijpbs.com (or) www.ijpbsonline.com IJPBS |Volume 3| Issue 4 |OCT-DEC|2013|42-48
International Journal of Pharmacy and Biological Sciences (e-ISSN: 2230-7605)
Mary Mathew*et al Int J Pharm Bio Sci www.ijpbs.com or www.ijpbsonline.com
Pag
e43
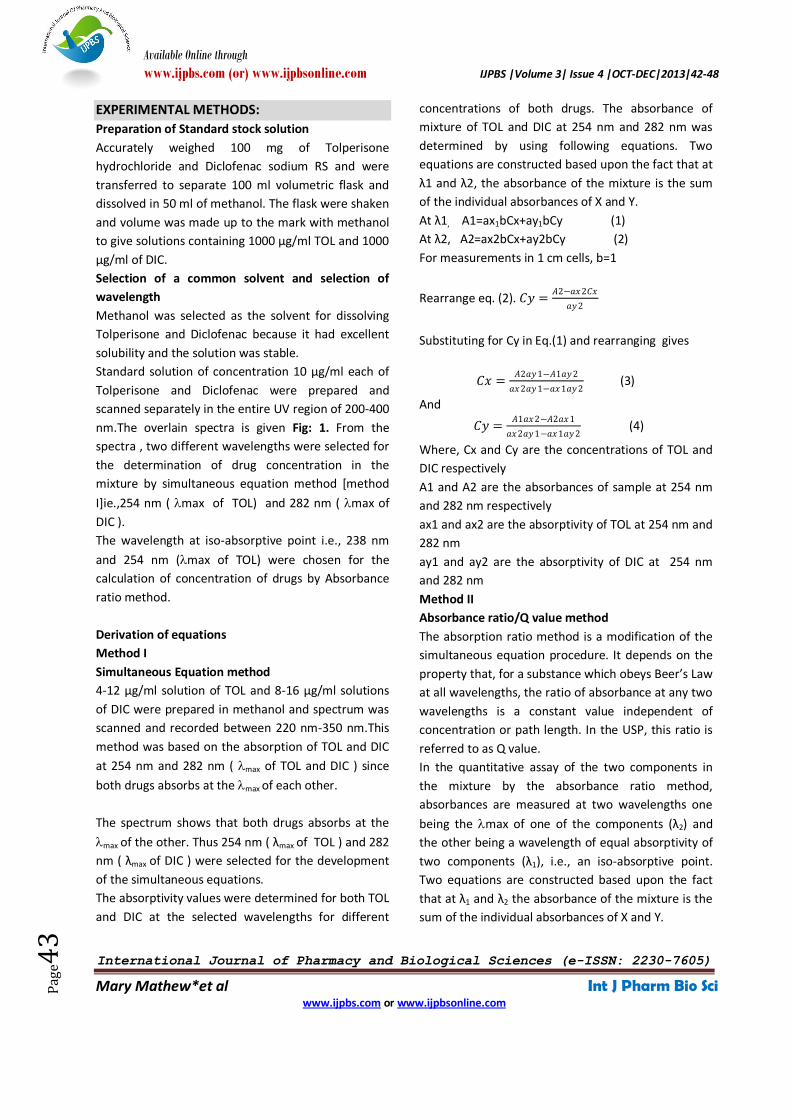
EXPERIMENTAL METHODS:
Preparation of Standard stock solution
Accurately weighed 100 mg of Tolperisone
hydrochloride and Diclofenac sodium RS and were
transferred to separate 100 ml volumetric flask and
dissolved in 50 ml of methanol. The flask were shaken
and volume was made up to the mark with methanol
to give solutions containing 1000 µg/ml TOL and 1000
µg/ml of DIC.
Selection of a common solvent and selection of
wavelength
Methanol was selected as the solvent for dissolving
Tolperisone and Diclofenac because it had excellent
solubility and the solution was stable.
Standard solution of concentration 10 µg/ml each of
Tolperisone and Diclofenac were prepared and
scanned separately in the entire UV region of 200-400
nm.The overlain spectra is given Fig: 1. From the
spectra , two different wavelengths were selected for
the determination of drug concentration in the
mixture by simultaneous equation method [method
I]ie.,254 nm ( max of TOL) and 282 nm ( max of
DIC ).
The wavelength at iso-absorptive point i.e., 238 nm
and 254 nm (max of TOL) were chosen for the
calculation of concentration of drugs by Absorbance
ratio method.
Derivation of equations
Method I
Simultaneous Equation method
4-12 µg/ml solution of TOL and 8-16 µg/ml solutions
of DIC were prepared in methanol and spectrum was
scanned and recorded between 220 nm-350 nm.This
method was based on the absorption of TOL and DIC
at 254 nm and 282 nm ( max of TOL and DIC ) since
both drugs absorbs at the max of each other.
The spectrum shows that both drugs absorbs at the
max of the other. Thus 254 nm ( λmax of TOL ) and 282
nm ( λmax of DIC ) were selected for the development
of the simultaneous equations.
The absorptivity values were determined for both TOL
and DIC at the selected wavelengths for different
concentrations of both drugs. The absorbance of
mixture of TOL and DIC at 254 nm and 282 nm was
determined by using following equations. Two
equations are constructed based upon the fact that at
λ1 and λ2, the absorbance of the mixture is the sum
of the individual absorbances of X and Y.
At λ1, A1=ax1bCx+ay1bCy (1)
At λ2, A2=ax2bCx+ay2bCy (2)
For measurements in 1 cm cells, b=1
Rearrange eq. (2). 𝐶𝑦 =𝐴2−𝑎𝑥2𝐶𝑥
𝑎𝑦2
Substituting for Cy in Eq.(1) and rearranging gives
𝐶𝑥 =𝐴2𝑎𝑦1−𝐴1𝑎𝑦2
𝑎𝑥2𝑎𝑦1−𝑎𝑥1𝑎𝑦2 (3)
And
𝐶𝑦 =𝐴1𝑎𝑥2−𝐴2𝑎𝑥1
𝑎𝑥2𝑎𝑦1−𝑎𝑥1𝑎𝑦2 (4)
Where, Cx and Cy are the concentrations of TOL and
DIC respectively
A1 and A2 are the absorbances of sample at 254 nm
and 282 nm respectively
ax1 and ax2 are the absorptivity of TOL at 254 nm and
282 nm
ay1 and ay2 are the absorptivity of DIC at 254 nm
and 282 nm
Method II
Absorbance ratio/Q value method
The absorption ratio method is a modification of the
simultaneous equation procedure. It depends on the
property that, for a substance which obeys Beer’s Law
at all wavelengths, the ratio of absorbance at any two
wavelengths is a constant value independent of
concentration or path length. In the USP, this ratio is
referred to as Q value.
In the quantitative assay of the two components in
the mixture by the absorbance ratio method,
absorbances are measured at two wavelengths one
being the max of one of the components (λ2) and
the other being a wavelength of equal absorptivity of
two components (λ1), i.e., an iso-absorptive point.
Two equations are constructed based upon the fact
that at λ1 and λ2 the absorbance of the mixture is the
sum of the individual absorbances of X and Y.

Available Online through
www.ijpbs.com (or) www.ijpbsonline.com IJPBS |Volume 3| Issue 4 |OCT-DEC|2013|42-48
International Journal of Pharmacy and Biological Sciences (e-ISSN: 2230-7605)
Mary Mathew*et al Int J Pharm Bio Sci www.ijpbs.com or www.ijpbsonline.com
Pag
e44
Overlay spectra of TOL and DIC was studied and two
wavelengths were selected for absorption
calculations, 254 nm ( λmax of TOL ) and 238 nm ( iso-
absorptive point ).The absorptivity coefficient of each
drug at both the wavelengths were determined. The
concentration of both the drugs in mixture and in
tablet formulation were determined by substituting
the absorbances and absorptivity coefficients in the
equation,
𝐶𝑥 =𝑄𝑚−𝑄𝑦
𝑄𝑥−𝑄𝑦×
𝐴1
𝑎𝑥1 , 𝐶𝑦 =
𝑄𝑚−𝑄𝑥
𝑄𝑦−𝑄𝑥×
𝐴1
𝑎𝑦1
Where,
Qm=Absorbance of sample at 254 nm/Absosorbance
of the sample at 238 nm
Qx= Absorptivity of TOL at 254 nm/Absorptivity of
TOL at 238 nm
Qy=Absorptivity of DIC at 254 nm/Absorptivity of DIC
at 238 nm
A1=Absorbance of sample at 238 nm (iso-absorptive
point)
ax1=Absorptivity of TOL at 238 nm
ay1=Absorptivity of DIC at 238 nm
Analysis of the tablet formulation
Twenty tablets of marketed formulation of TOLPIDOL
D marketed by Merck Limited Mumbai containing 150
mg of TOL and 50 mg DIC were accurately weighed
and powdered.
Transferred an accurately weighed portion of the
mixed tablet content equivalent to 150 mg of TOL and
50 mg of DIC into 50 ml volumetric flask. Volume was
made to 50 ml with methanol and shaken for 15
minutes and then sonicated for 5 minutes and filtered
through the Whatman filter paper No.41.Necessary
dilutions of the filtrate were made with methanol to
get final concentration 5 µg/ml and 15 µg/ml of DIC
and TOL respectively.
The absorbances of the solutions were measured at
254 nm and 282 nm for method I and 238 nm and 254
nm for method II. The values obtained were
substituted in the respective formula of method I and
II to obtain concentration of TOL and DIC. Results are
shown in Table 5.
Method Validation
The proposed methods were validated in terms of
linearity, accuracy, precision, and specificity, limit of
detection and quantitation (LOD and LOQ) and
robustness.
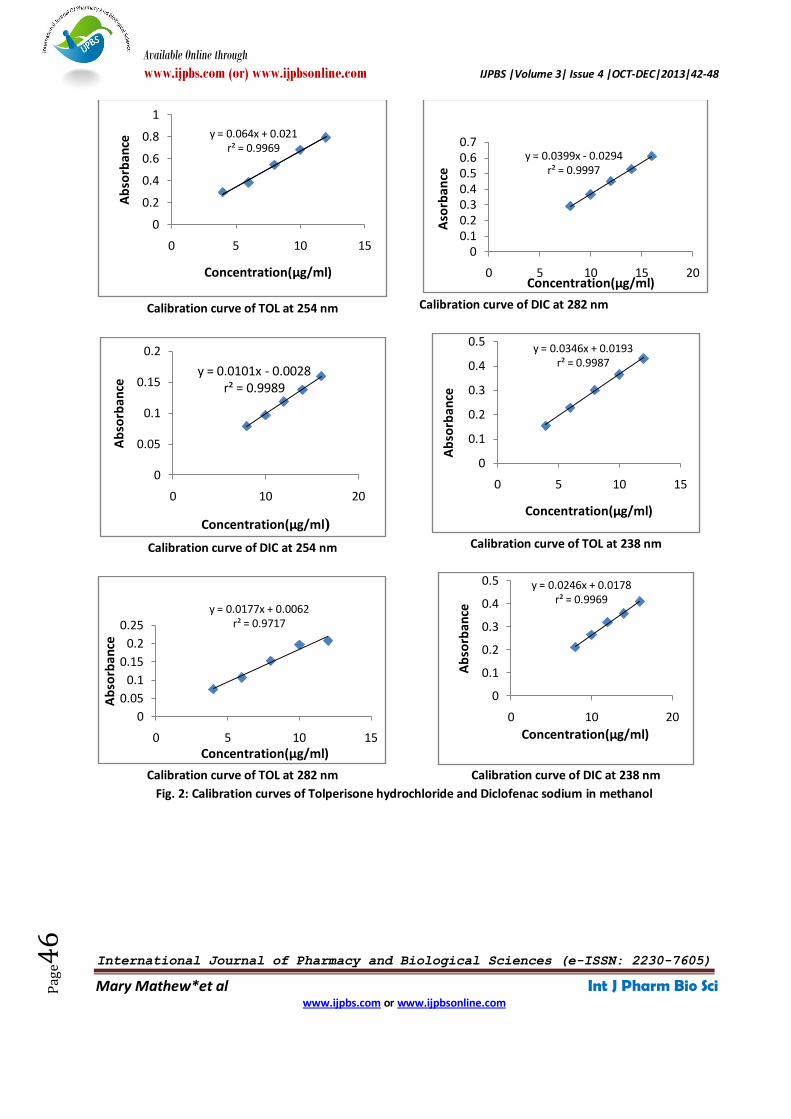
Linearity
Appropriate volume of aliquot from TOL and DIC
standard solution was transferred to volumetric flask
of 10 ml capacity. Volume was adjusted to the mark
with methanol to give solutions containing 4-12 μg/ml
and 8-16 μg/ml of TOL and DIC respectively. The
absorbance of these solutions were measured at 254
nm, 282 nm and 238 nm (n=6), Calibration curves
were obtained by plotting absorbance against
concentration.Fig:2.The r2 value of > 0.995 was
observed for both the methods. The statistical data
are shown in Table 1 and 2.
Accuracy
Accuracy of the methods developed was confirmed by
recovery studies as per ICH guidelines by standard
addition method. Known amounts of standard
solutions of TOL and DIC were added at 80,100 and
120 % level to pre quantified sample solution of TOL
and DIC. Each concentration was analysed three times
and average recoveries measured. The results of
accuracy study are shown in Table 3.
Precision
Variation of results within the same day (Intraday)
and between days (Interday) were analysed. The
intraday precision was determined by analyzing six
different samples of TOL solution (15 μg/ml) and DIC
(5 μg/ml), obtained by dilution from stock solutions
for three times a day.
Interday precision was determined for three days at
the same time interval as in intraday. The % RSD value
of < 2 % suggests that the developed methods are
precise. The results are reported in Table 4.
Specificity
Commonly used excipients (starch, microcrystalline
cellulose and magnesium stearate) were spiked into a
known quantity of drugs and then absorbance was
measured and calculations done to determine the
quantity of the drugs.

Available Online through
www.ijpbs.com (or) www.ijpbsonline.com IJPBS |Volume 3| Issue 4 |OCT-DEC|2013|42-48
International Journal of Pharmacy and Biological Sciences (e-ISSN: 2230-7605)
Mary Mathew*et al Int J Pharm Bio Sci www.ijpbs.com or www.ijpbsonline.com
Pag
e45
Limit of Detection (LOD) and Limit of Quantitation
(LOQ)
LOD and LOQ were determined using mathematical
equations.
LOD=3.3 x σ/S and LOQ= 10 x σ/S
Where, σ = Standard deviation of the response
S = Slope of the calibration curve
The results are reported in Table 1 for method I and
Table 2 for method II.
Robustness
The robustness of both the methods was checked by
performing the analysis with change in the typical
analytical conditions like stability of analytical
solution and results were found to be satisfactory.
CONCLUSION
The proposed UV Spectrophotometric methods for
simultaneous estimation of TOL and DIC are accurate
and precise. The proposed methods are simple, rapid
and cost effective. The developed methods could be
successfully applied for simultaneous estimation of
TOL and DIC from their marketed formulations and
for routine quality control of these drugs.
Fig. 1: UV absorption overlain spectrum of Tolperisone hydrochloride and Diclofenac sodium in Methanol
Available Online through
www.ijpbs.com (or) www.ijpbsonline.com IJPBS |Volume 3| Issue 4 |OCT-DEC|2013|42-48
International Journal of Pharmacy and Biological Sciences (e-ISSN: 2230-7605)
Mary Mathew*et al Int J Pharm Bio Sci www.ijpbs.com or www.ijpbsonline.com
Pag
e46
Calibration curve of TOL at 254 nm
Calibration curve of DIC at 254 nm
Calibration curve of TOL at 282 nm
Calibration curve of DIC at 282 nm
Calibration curve of TOL at 238 nm
Calibration curve of DIC at 238 nm
Fig. 2: Calibration curves of Tolperisone hydrochloride and Diclofenac sodium in methanol
y = 0.064x + 0.021r² = 0.9969
0
0.2
0.4
0.6
0.8
1
0 5 10 15
Ab
sorb
ance
Concentration(μg/ml)
y = 0.0101x - 0.0028r² = 0.9989
0
0.05
0.1
0.15
0.2
0 10 20
Ab
sorb
ance
Concentration(µg/ml)
y = 0.0177x + 0.0062r² = 0.9717
0
0.05
0.1
0.15
0.2
0.25
0 5 10 15
Ab
sorb
ance
Concentration(µg/ml)
y = 0.0399x - 0.0294r² = 0.9997
00.10.20.30.40.50.60.7
0 5 10 15 20
Aso
rban
ce
Concentration(µg/ml)
y = 0.0346x + 0.0193r² = 0.9987
0
0.1
0.2
0.3
0.4
0.5
0 5 10 15
Ab
sorb
ance
Concentration(µg/ml)
y = 0.0246x + 0.0178r² = 0.9969
0
0.1
0.2
0.3
0.4
0.5
0 10 20
Ab
sorb
ance
Concentration(µg/ml)

Available Online through
www.ijpbs.com (or) www.ijpbsonline.com IJPBS |Volume 3| Issue 4 |OCT-DEC|2013|42-48
International Journal of Pharmacy and Biological Sciences (e-ISSN: 2230-7605)
Mary Mathew*et al Int J Pharm Bio Sci www.ijpbs.com or www.ijpbsonline.com
Pag
e47
Table 1: Statistical data of Method I
Parameters Tolperisone hydrochloride Diclofenac sodium
Wavelength(nm) 254 282 254 282 Beer’s law limit(µg/ml) 4-12 4-12 8-16 8-16 Regression equation y=0.064x+0.021 y=0.017x+0.006 y=0.010x-0.003 y=0.040x-0.029 Slope 0.064 0.017 0.010 0.040 Intercept +0.021 +0.006 -0.003 -0.029 Correlation coefficient( r2) 0.997 0.972 0.999 1.000 Limit of detection(µg/ml) 0.019 0.036 0.043 0.023 Limit of quantitation(µg/ml)
0.059 0.117 0.130 0.072
Table 2: Statistical data of Method II
Parameters Tolperisone hydrochloride Diclofenac sodium
Wavelength(nm) 238 254 238 254
Beer’s law limit(µg/ml) 4-12 4-12 8-16 8-16
Regression equation y=0.035x+0.019 y=0.064x+0.021 y=0.025x+0.018 y=0.010x-0.002
Slope 0.035 0.064 0.025 0.010
Intercept +0.019 +0.021 +0.018 -0.002
Correlation coefficient( r2) 0.999 0.997 0.997 0.999
Limit of detection(µg/ml) 0.019 0.016 0.043 0.044
Limit of quantitation
(µg/ml)
0.059 0.049 0.130 0.133
Table 3: Results of Recovery Studies
Level of %
Recovery
Amount present
(mg/tab)
Amount of standard
drug added (mg)
Total amount of drug
recovered(mg)
% Recovery
TOL DIC TOL DIC TOL DIC TOL DIC
80
30
30
30
10
10
10
24
24
24
8
8
8
23.93
23.88
23.89
7.79
7.89
7.84
99.73
99.51
99.57
97.39
98.74
98.06
100
30
30
30
10
10
10
30
30
30
10
10
10
29.97
29.92
29.89
9.84
9.89
9.78
99.91
99.73
99.66
98.43
98.97
97.89
120
30
30
30
10
10
10
36
36
36
12
12
12
35.90
35.88
35.92
11.86
11.78
11.84
99.74
99.68
99.78
98.90
98.22
98.67
Table 4: Results of Precision Studies
Precision studies
Method I Method II
TOL DIC TOL DIC
Intraday(% RSD),n=6 0.2191 0.1823 0.0807 0.1765
Interday(% RSD),n=6 0.1910 0.2908 0.0974 0.5982

Available Online through
www.ijpbs.com (or) www.ijpbsonline.com IJPBS |Volume 3| Issue 4 |OCT-DEC|2013|42-48
International Journal of Pharmacy and Biological Sciences (e-ISSN: 2230-7605)
Mary Mathew*et al Int J Pharm Bio Sci www.ijpbs.com or www.ijpbsonline.com
Pag
e48
Table 5: Results of Analysis of Tablet Formulation
Brand name Company Label Claim Amount Present (mg)
Method I Method II
TOLPIDOL D Themis Medicare Ltd DIC 50mg 49.8± 0.12 50.0±0.01
TOL 150mg 149.8±0.05 149.8± 0.07
REFERENCES 1. Indian Pharmacopoeia. Volume II, 2010. 76
2. United States Pharmacopoeia 24; 2149-2152
3. Chang-lkChoi, Jung-Woo Bae, Young-Seo Park, Choon-
Gon Jang and Seok-Yong Lee. Determination of
Tolperisone in human plasma by liquid
chromatography/tandem mass spectroscopy for
clinical application. Arch Pharm Res 2006;4:339-342
4. Bhavesh Bhurabhai, Murali M, Satyanarayana P V.
Development and validation of RP-HPLC method for the
estimation of Tolperisone hydrochloride in bulk and
pharmaceutical dosage form. Der Pharma Chemica
2011; 3:13-19.
5. Y K Agrawal, K Shivramchandra. Spectrophotometric
determination of Diclofenac sodium in tablets. J Pharm
Biomed Anal 1991; 9:97-100.
6. N P Nadpara, U D Kantariya, B J Ladya, M A Rachchh.
Visible-Spectrophotometric estimation of Diclofenac
sodium in Bulk and Pharmaceutical formulation using
Dichlone. Inventi Rapid: Pharm Analysis & Quality
Assurance 2012:1:92-96.
7. A .H. Beckette, J. B. Stenlake Practical Pharmaceutical
Chemistry, 4th Edition; CBS Publishers New Delhi;
2007; 275.
8. ICH Harmonised Tripartite Guideline, Validation of
Analytical Procedures: fdagov.com
*Corresponding Author: Mary Mathew*
College of Pharmaceutical Sciences, Government Medical College, Trivandrum, Kerala-695011